 Wenyou Han1,2
 Jie Lei
- 1Chongqing Huadi Resource and Environment Technology Co.,LTD., Chongqing, China
- 2Chongqing Institute of Geology and Mineral Resources, Chongqing, China
The appropriate delineation of ecological space is crucial for ensuring ecological security, enhancing the regional environmental carrying capacity, and fostering sustainable economic and social development. For hilly and mountainous areas, there are few studies on ecological security pattern analysis combined with land use types. Taking Chongqing, China as a case study, this paper systematically developed an special evaluation system for ecosystem sensitivity (ES) and ecosystem service function (ESF) in hilly and mountainous areas, utilizing various sources of data from the year 2022 to support the delineation of ecological space types (EST), and analyzing ecological pattern security issues in conjunction with the current land use status. The results were as follows: (1) The ES was predominantly classified as extremely sensitive, comprising 47.54% (39,171.12
1 Introduction
With the development of the economy and society, the increasing demand for production and living space has led to the continuous encroachment on ecological space, resulting in significant ecological degradation (Hou et al., 2022; Liu et al., 2017; Liu Y. et al., 2024; Liu and Zhong, 2024). This issue is particularly prominent in Chongqing, a key ecological barrier of the Yangtze River, where rapid urban expansion and agricultural land use intensification have heightened the contradiction between cultivated land protection and ecological security. The balance between economic growth and ecological conservation has become a critical challenge for sustainable development in this region. China has implemented a series of ecological civilization construction plans, which explicitly call for optimizing the national land use pattern and enhancing ecological land protection. Ecological space is vital for maintaining the ecological security pattern, enhancing regional environmental carrying capacity, and promoting the sustainable development of the economy and society (Liang et al., 2023; Zhao et al., 2022a; Chakraborti et al., 2018). In Chongqing, as the last ecological barrier of the Yangtze River before it enters the densely populated eastern regions, the protection and rational allocation of ecological space are of particular importance. The region’s ecological security directly influences water resource conservation, biodiversity protection, and disaster prevention along the Yangtze River Basin. The appropriate delineation of ecological space has thus become a key research issue, requiring careful consideration of trade-offs between land resource utilization and ecological sustainability (Wang et al., 2022; Liu and Ding, 2022). Ecological space is generally defined as the area that ensures regional ecological security, provides essential ecological services, and fulfills important ecological functions. The classification and delineation methods for ecological space are still under exploration. Currently, the division of EST based on their role in supporting ecosystem health is a prominent topic of scholarly research (Chen et al., 2021; Ngom et al., 2016; Zhang et al., 2022). Among these, ES and ESF are critical indicators that reflect ecosystem health (Liu et al., 2023; Luo Q. et al., 2023). ESF maintains the dynamic balance of the ecosystem and plays an important supporting role within it (Yu et al., 2021). ES indicates the degree of the ecosystem’s response to external disturbances and is essential for maintaining ecological stability (Liu T. et al., 2024; Ye and Wang, 2024).
Numerous studies have delineated ecological space, with a focus on mesoscopic and macro scales, including national, provincial, urban agglomeration, and municipal levels (Ouyang et al., 2022; Ban et al., 2022; Gupta et al., 2012). Domestic and international studies have employed various methods and integrated diverse datasets to comprehensively analyze ecological space-related issues. Internationally, various methods have been used to analyze ecological space. For example, Manob Das et al. analyzed the correlation between ecological space quality and land use in Delhi, India, based on land cover changes (Das et al., 2024). They employed the Entropy Method (EM) and geospatial techniques to assess the ecological space quality of the Delhi metropolitan area (India). Their findings contribute to spatial landscape planning and sustainable ecological space management. Additionally, some studies have utilized statistical methods to analyze ecological spaces. For instance, Shmakova et al. assessed the characteristics of ecological spaces in Russian regions using various official statistical data (Shmakova and Kuznetsova, 2023). Some studies have integrated ecological space data with other relevant factors to jointly analyze ecological issues. For example, Bekisoglu et al. explored the relationship between urban green spaces and ecological zones, using data on urban green spaces and ecological space boundaries (Bekisoglu and Keyis, 2023). Their study highlights the role of urban green spaces in maintaining ecological functions and their interaction with broader ecological space frameworks. In China, Zhao et al. applied and extended the methodological approach of ecological function zoning to urban spaces in Taizhou, China (Zhao et al., 2022b). They combined ecological environmental sensitivity, the importance of ecosystem service functions, and socio-economic stress assessments to analyze both ecological and economic conditions comprehensively. Li et al. constructed an ecological resistance surface based on factors such as land use types, topographic position index, and soil erosion intensity, and analyzed the ecological space pattern in Shaanxi, China (Li et al., 2022). Chen et al. delineated the ecological security space of the Guanzhong Plain urban agglomeration in China using ecological importance and sensitivity data (Chen et al., 2022). Furthermore, they incorporated ecological source points to analyze ecological corridors, providing insights into regional ecological connectivity and spatial optimization strategies.
While numerous studies have explored EST assessment and the integration of ES and ESF, research focusing on hilly and mountainous areas remains limited. Taking Chongqing as the study area, and considering its unique “Mountain City” characteristics and environmental risk factors, this study, utilizing the 2022 dataset, constructs an ES evaluation system and an ESF evaluation system by integrating key ecological factors such as soil and water loss sensitivity, desertification sensitivity, geological disasters sensitivity, habitat sensitivity, water resource conservation function, soil and water conservation function, and biodiversity function. Traditional ES evaluations often rely on methods such as the Analytic Hierarchy Process (AHP) and maximum value method, which may lead to the dominance of a single factor and fail to reflect the multidimensional nature of ecological sensitivity (He et al., 2021). To overcome this limitation, this study employs a back propagation (BP) neural network for ES factor evaluation. This approach enhances the objectivity and accuracy of ecological sensitivity assessments by mitigating biases caused by subjective weighting. Differing from other studies, by incorporating land use data, we jointly explore the direct relationship between ecological security and land use patterns. This integration of ES, ESF, and EST enables us to analyze ecological space patterns, providing new insights into ecological pattern security and offering guidance for sustainable land management in hilly and mountainous regions.
2 Study area and materials
2.1 Study area
Chongqing, located in the southwest of China, extends from 105°11′ to 110°11′ east longitude and from 28°10′ to 32°13′ north latitude. It consists of 26 districts, 8 counties, and 4 autonomous counties, covering a total area of 82,402
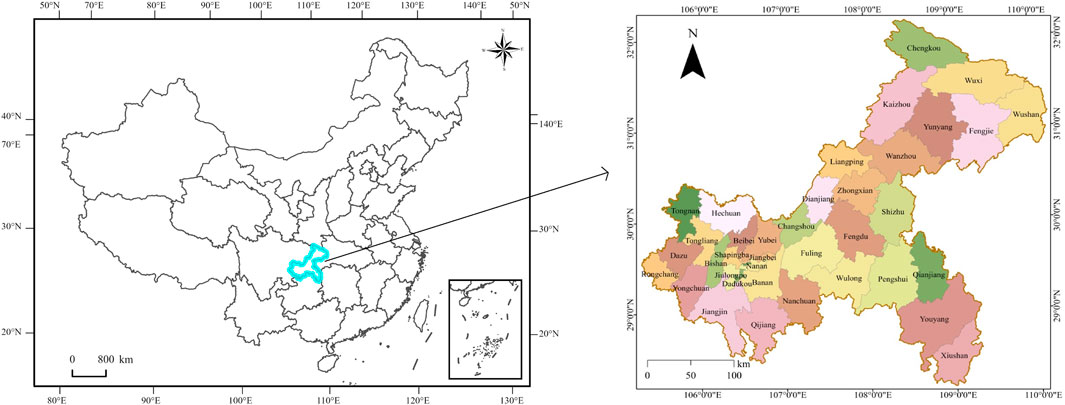
Figure 1. Overview of the study area.
2.2 Dataset
This study utilized various basic datasets, including precipitation, net primary productivity (NPP) of vegetation, fractional vegetation cover (FVC), land use patterns, road networks, digital elevation model (DEM), fault zone datasets, and stratigraphic lithology, among others, as outlined in Table 1. For example, NPP data was obtained from the MOD17A3 NPP product, with a spatial resolution of 500m, covering the period from 2015 to 2022. FVC data was sourced from the China 250 m FVC dataset, with a spatial resolution of 250 m. The land use data was derived from the Resources and Environmental Science Data Platform, China. Using these datasets, we calculated key parameters such as rainfall erosivity, slope length, slope, degree of relief, soil erodibility, and regional carbonate exposure percentage. Rainfall erosivity was calculated from precipitation data (Wang et al., 2023; Xie et al., 2024), which was obtained from the China Meteorological Data Network for the period 2015–2022. Slope length, slope, and degree of relief were derived from DEM data (Zhang et al., 2012; Zhu and Chen, 2024), which was provided by the SRTM data from the Geospatial Data Cloud, with a resolution of 90 m. Soil erodibility and regional carbonate exposure percentage were calculated using the Chinese HWSD attribute database (Kabolizadeh et al., 2023; Zhang et al., 2021). All data were resampled to a resolution of 250 m.
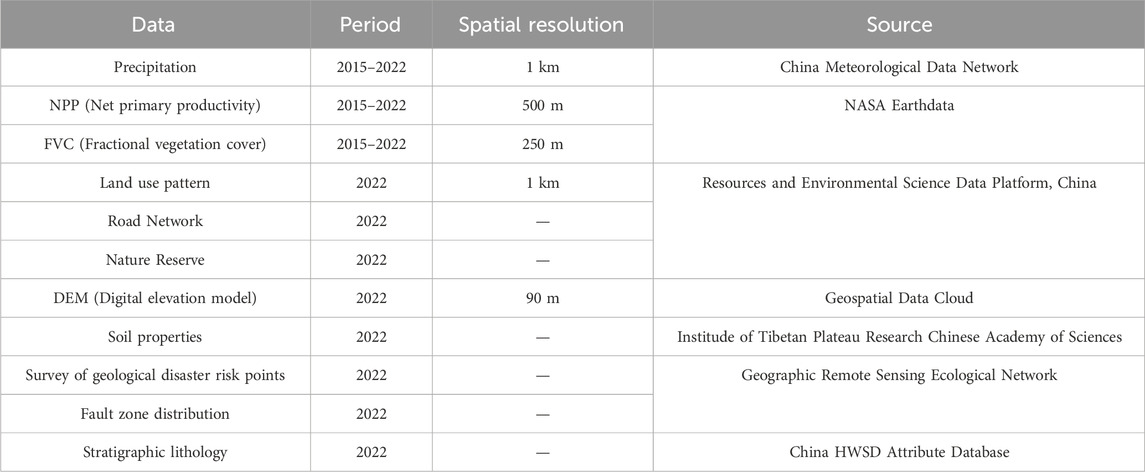
Table 1. Basic dataset.
3 Methods
3.1 Overview
In alignment with the related works of (Yi et al., 2020; Xu et al., 2023; Tang et al., 2018; Lai et al., 2023) and considering the mountainous terrain and elevation fluctuations in the study area, we developed an ES evaluation model that incorporates factors such as soil and water loss sensitivity, desertification sensitivity, geological disasters sensitivity, and habitat sensitivity. Additionally, taking into account the local ecology, we included factors related to water resource conservation function, soil and water conservation function, and biodiversity function to develop the ESF evaluation model. We applied Principal Component Analysis (PCA) (He et al., 2010), the BP neural network (Chen et al., 2017), and other methods to separately determine the weights of ES-related factors. Furthermore, we referenced existing ecological space delineation methods (Zhao et al., 2022c; Zhang et al., 2023) and classified the study area into four categories: core, auxiliary, transitional, and development-friendly ecological spaces to evaluate ecological pattern security. Based on the ecological space results, we analyzed ecological pattern security issues in conjunction with the current land use status. The specific technical approach of this paper is shown in Figure 2.
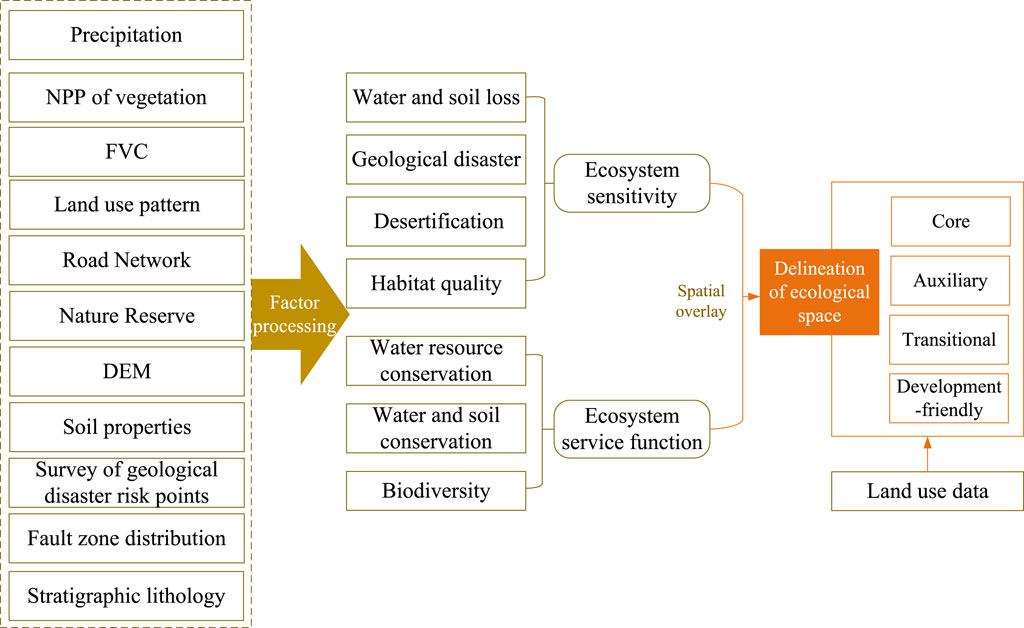
Figure 2. Overall technical route (The first column represents the fundamental data, from which the relevant factors in the second column are derived. These factors are further processed to obtain the ecological factors in the third column. Finally, ecological space is delineated.).
3.2 Ecosystem sensitivity
3.2.1 Soil and water loss sensitivity
Our study primarily evaluated soil and water loss sensitivity by considering water dynamics. Based on the principle of soil and water loss equation (Xie et al., 2018; Equation 1), rainfall erosivity, soil erodibility, slope, slope length, and FVC were selected for GIS product calculation. The natural breaks method (Jenks, 1967) was used to divide the sensitivity into five levels. The formula of soil and water loss sensitivity is as follows:
where
3.2.2 Desertification sensitivity
Based on the formation mechanism of desertification, regional carbonate exposure percentage, slope and FVC factors were selected to construct an evaluation system (Equation 2). After GIS product calculation (Gu et al., 2021), the natural breaks method (Jenks, 1967) was again used to divide the sensitivity into five levels. The formula of desertification sensitivity is as follows:
where
3.2.3 Geological disaster sensitivity
In line with relevant studies (Hongtao, 2020), we selected factors such as stratigraphic lithology, distance from fault zone, degree of relief, slope, rainfall erosivity, soil erodibility and FVC to construct an evaluation system of geological disaster sensitivity. The structure of the BP neural network is illustrated in Figure 3.
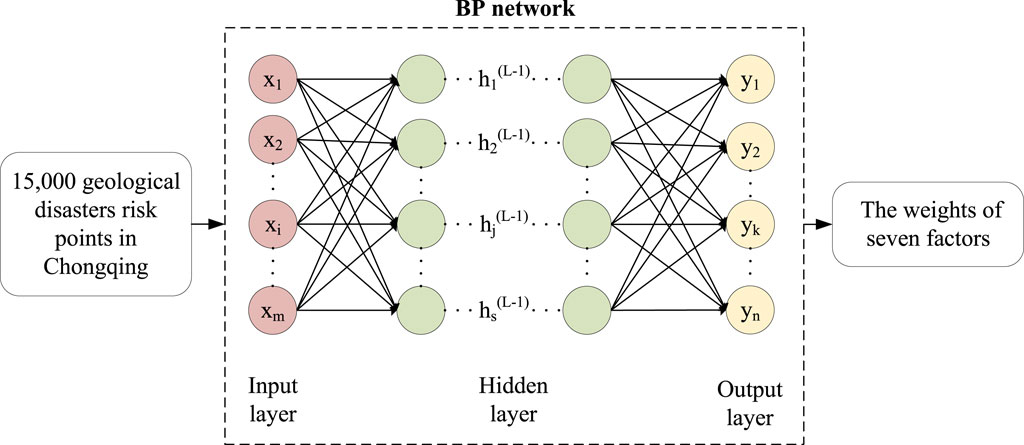
Figure 3. BP network model.
As shown in Equations 3, 4, the factors influencing geological disasters are set as the input
where
Our study input the field survey data of 15,000 geological disaster risk points in Chongqing from 2022 into the BP neural network. The dataset was initially divided into training and testing sets at an 8:2 ratio, with 10% of the training set further allocated as a validation set. A learning rate of 0.01 was adopted to ensure stable convergence during the training process. Through multiple iterations, we determined that the optimal configuration consisted of 7 nodes in the first hidden layer and 5 nodes in the second hidden layer. The training and validation loss curves indicate that the model achieved stable convergence, with both losses decreasing significantly over 100 epochs, reflecting effective learning and generalization, as shown in Figure 4. The importance and weights of each factor were determined through the BP neural network training and testing process, as shown in Table 2. The overall accuracy of the model reached 0.87, demonstrating its reliability in predicting geological disaster sensitivity.
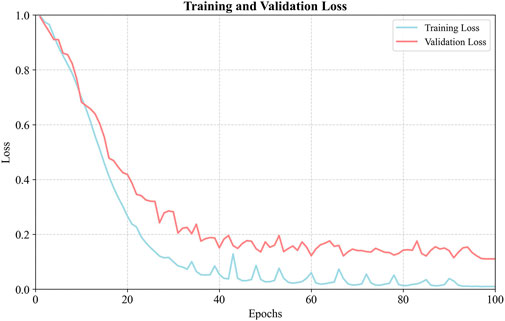
Figure 4. Training and validation loss.
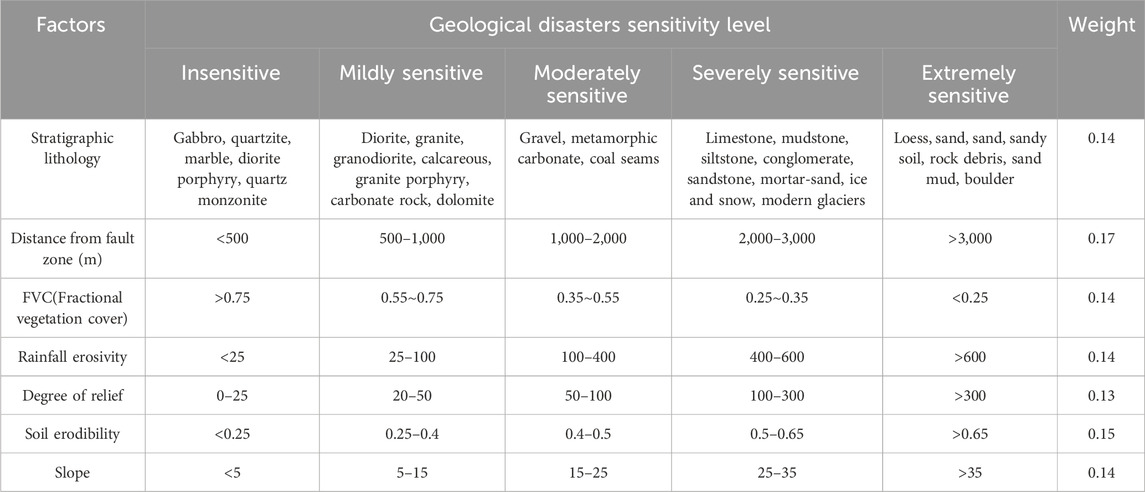
Table 2. Geological disasters sensitivity levels.
Using the weights of factors to calculate geological disaster sensitivity (Equation 5), the formula of geological disaster sensitivity is as follows:
where
3.2.4 Habitat sensitivity
Land use, vegetation coverage, distance from main roads, and distance from nature reserves were selected to construct a Habitat Sensitivity evaluation system. As shown in Table 3, five levels were divided according to relevant research (Yi et al., 2020). To determine the relative importance of each factor, Principal Component Analysis (PCA) was employed. PCA is a statistical method used to reduce the dimensionality of the data while retaining the most important variance information. By applying PCA, the weight of each factor was extracted based on its contribution to the principal components, which represent the most significant patterns of variation in the data. Factors with larger coefficients in the principal components are considered more important and thus assigned higher weights in the habitat sensitivity evaluation system. This approach allows for a more objective and comprehensive assessment of habitat sensitivity, considering the interrelationships between different factors (Equation 6). The formula for habitat sensitivity is as follows:
where
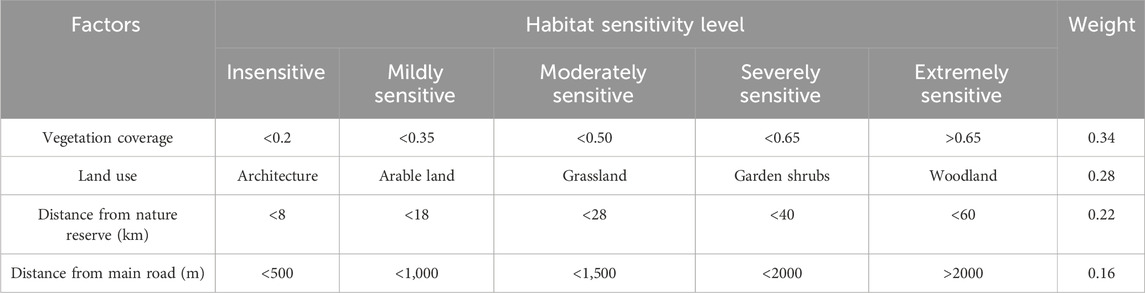
Table 3. Habitat sensitivity level table.
3.2.5 Ecosystem sensitivity
Referring to previous studies (Zhao Z. et al., 2022), the evaluation results of the above four sensitivity factors were spatially superimposed using the mean value method to obtain a comprehensive evaluation result map of ES. This study divided comprehensive ES into three sensitivity levels: general sensitivity, sensitive, and extremely sensitive, using the natural breaks method (Jenks, 1967). By using this method, we can better capture the natural thresholds in ecological sensitivity, leading to more precise and actionable insights for ecological conservation and management.
Areas classified as general sensitivity exhibit low to moderate levels of sensitivity across the evaluated factors, indicating relatively stable conditions with minimal vulnerability to soil erosion, desertification, geological hazards, and habitat degradation. These regions are generally suitable for development with appropriate mitigation measures. Areas categorized as sensitive demonstrate moderate to high levels of sensitivity in at least one or more factors, reflecting a heightened vulnerability to environmental stressors. These regions require careful management to balance ecological conservation and development needs, as they are more prone to degradation under external pressures. Areas identified as extremely sensitive show high to very high levels of sensitivity across multiple factors, representing regions with critical ecological vulnerability. These areas are highly susceptible to severe soil erosion, desertification, geological disasters, and habitat loss, necessitating stringent protection measures to maintain ecological stability and prevent irreversible damage. This classification provides a clear framework for understanding the spatial distribution of ecological sensitivity and supports targeted strategies for sustainable land use and ecological conservation.
3.3 Ecosystem service function
3.3.1 Water resource conservation function
Using the NPP quantitative indicator evaluation method (Lv et al., 2022), the ecosystem water source service capacity index was adopted as evaluation indicator (Equation 7). The formula of water resource conservation function is as follows:
where
3.3.2 Soil and water conservation function
The soil and water conservation function model, based on the Revised Universal Soil and Water Loss Equation (RUSLE) (Feng and Zhao, 2014), was used to assess importance of soil and water conservation (Equation 8). The formula of soil and water conservation function is as follows:
where
3.3.3 Biodiversity function
For assessing biodiversity importance (Ma et al., 2019), we utilized the biodiversity maintenance service capacity index as the evaluation indicator (Equation 9). The formula of biodiversity function is as follows:
where
3.3.4 Ecosystem service function
Referring to previous studies (Niu et al., 2022), we used
where
Areas classified as generally important exhibit relatively lower levels of contribution to water resource conservation, soil and water conservation, and biodiversity maintenance compared to other regions. While these areas still provide valuable ecosystem services, their functional importance is less pronounced in the broader context of regional ecological balance. Areas categorized as important demonstrate moderate to high levels of contribution to at least one or more ecosystem service functions, reflecting their significant role in supporting water resources, soil stability, or biodiversity. These regions are key to maintaining ecological functionality and require thoughtful management to ensure their continued contribution. Areas identified as extremely important show high to very high levels of contribution across multiple ecosystem service functions, representing regions that are critical for water resource conservation, soil and water retention, and biodiversity preservation. These areas play an indispensable role in sustaining regional ecological health and resilience. This classification provides a nuanced understanding of the spatial distribution of ecosystem service function importance, highlighting the varying degrees of contribution across different regions. It supports targeted strategies for sustainable land use planning and ecological conservation, ensuring the protection and enhancement of ecosystem services where they are most needed.
3.4 Ecological space division
Referring to established ecological space delineation methods (Zhao et al., 2022c; Zhang et al., 2023), we employed the spatial overlay method to classify ecological space into four categories based on the results of ESF and ES: core, auxiliary, transitional, and development-friendly. This classification was further examined in conjunction with current land use data to evaluate ecological pattern security. Ecological space was subsequently grouped into important and non-important types, where core and auxiliary ecological spaces constituted the important category, while transitional and development-friendly ecological spaces were classified as non-important.
Core ecological space encompasses areas characterized by either extremely important ESF or extremely sensitive ES, playing a critical role in maintaining ecological balance and biodiversity. Auxiliary ecological space consists of areas with important ESF and sensitive ES, serving as a supportive buffer to core ecological spaces and contributing to overall ecological stability. Transitional ecological space includes regions exhibiting either important ESF or sensitive ES, functioning as an intermediate zone between core/auxiliary spaces and development-friendly areas. Development-friendly ecological space comprises areas with generally important ESF and generally sensitive ES, making them suitable for development activities with minimal ecological impact.
This structured classification framework facilitates a comprehensive understanding of ecological patterns and provides a scientific basis for sustainable land use planning. By integrating ecological conservation objectives with development requirements, this approach ensures a balanced and informed decision-making process in land resource management.
4 Results and analysis
4.1 Ecosystem sensitivity
We selected Chongqing as the study area and conducted an analysis of its ecosystem sensitivity based on data from 2022, including factors such as soil and water loss sensitivity, desertification sensitivity, geological disasters sensitivity, and habitat sensitivity. In the study area, the soil and water loss sensitivity types were primarily classified as moderately and severely sensitive, with areas of 25.00% (20,598.78
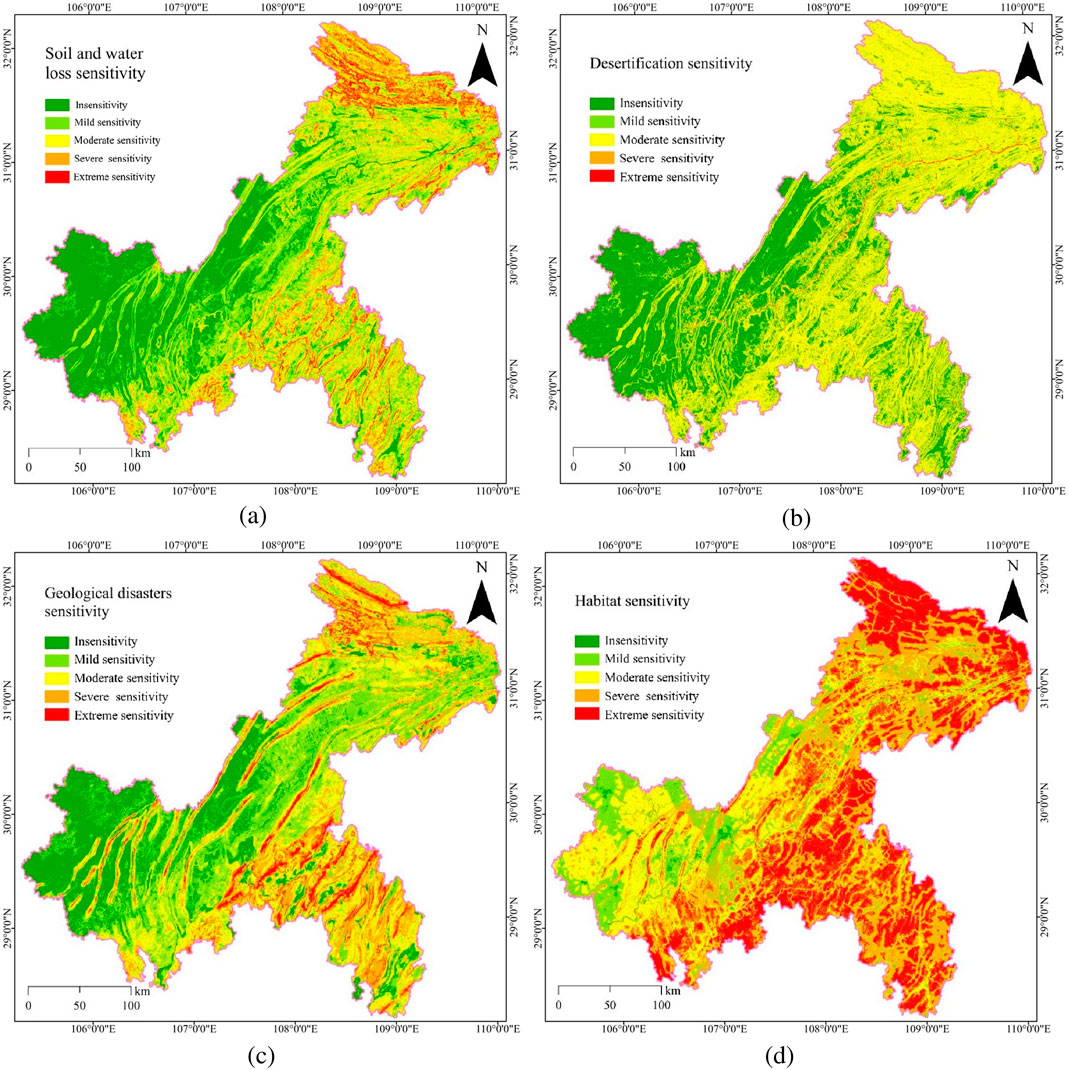
Figure 5. Ecosystem sensitivity evaluation. (a) Soil and water loss sensitivity (b) Desertification sensitivity (c) Geological disasters sensitivity (d) Habitat sensitivity.
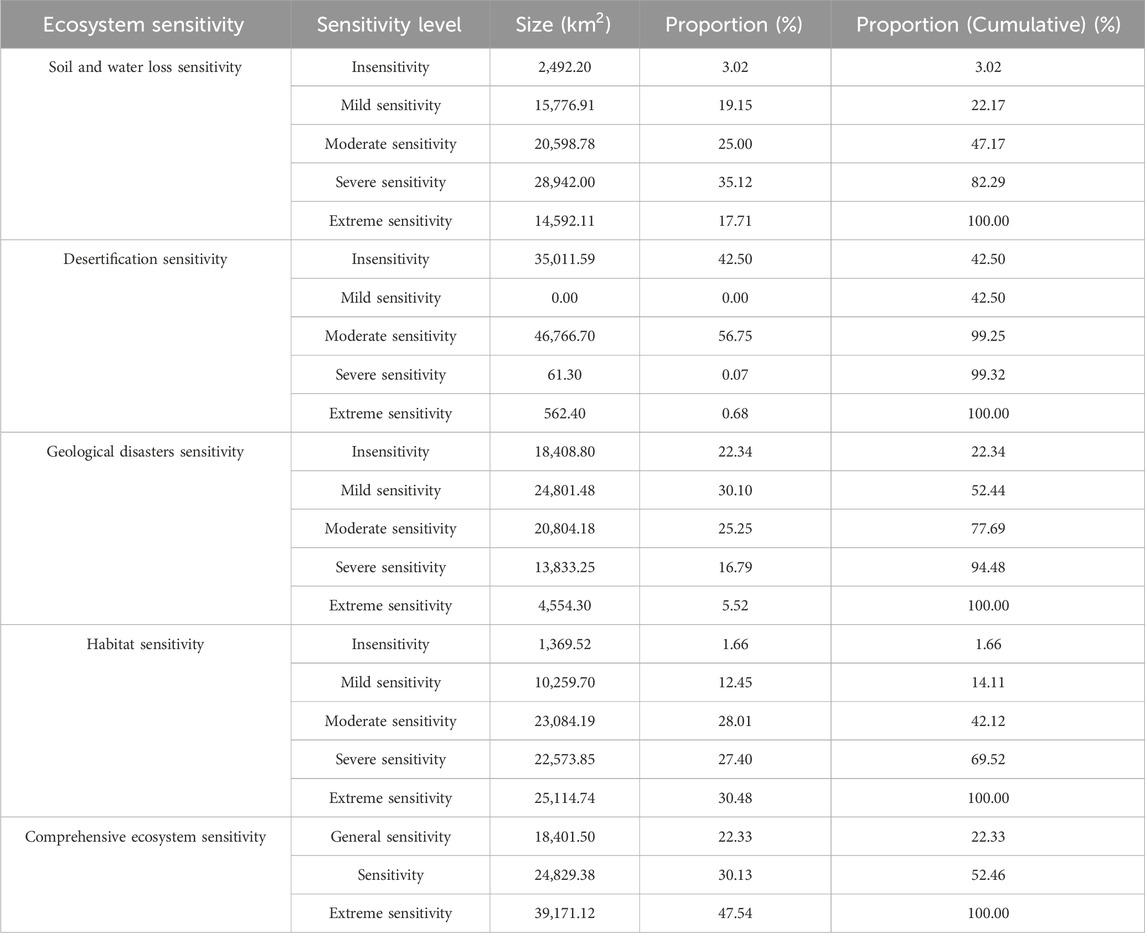
Table 4. Results of ecosystem sensitivity evaluation.
Figure 5b and Table 4 indicate that the desertification sensitivity of the study area was predominantly insensitive and moderately sensitive, accounting for 42.50% (35,011.59
Figure 5c and Table 4 describe the geological disasters sensitivity in the study area, which was predominantly moderate and mild. Insensitive areas were mainly distributed in low mountains and hilly regions such as Tongnan District, Hechuan, and Dazu in the west of Chongqing, accounting for 22.34% (18, 408, 80
From Figure 5d and Table 4, with a large proportion of nature reserves and ecological sources, the habitat sensitivity of the study area was predominantly classified as sensitive. Among these, the extremely sensitive areas were located in national nature reserves such as Daba Mountain, Jinfo Mountain, and Jinyun Mountain, accounting for 30.48% (25,114.74
As shown in Figure 6 and Table 4, the ES areas were predominantly classified as extremely sensitive, accounting for 47.54% (39,171.12
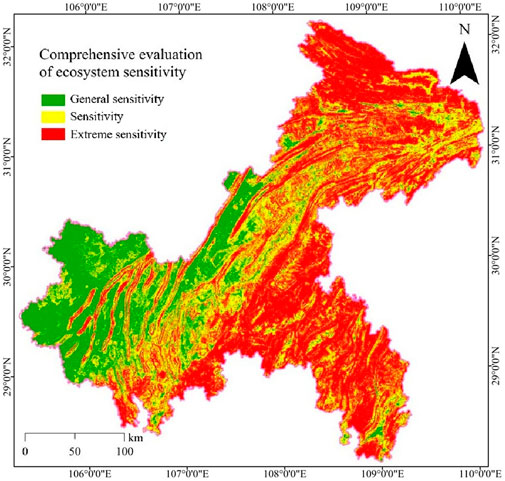
Figure 6. Comprehensive evaluation of ecosystem sensitivity.
4.2 Ecosystem service function
We analyzed the ecosystem service functions of Chongqing based on 2022 data for water resource conservation function, soil and water conservation function, and biodiversity function. As shown in Figure 7a and Table 5, the results indicated that water resource conservation function was predominantly of general importance, accounting for 70.46% (58,061.33
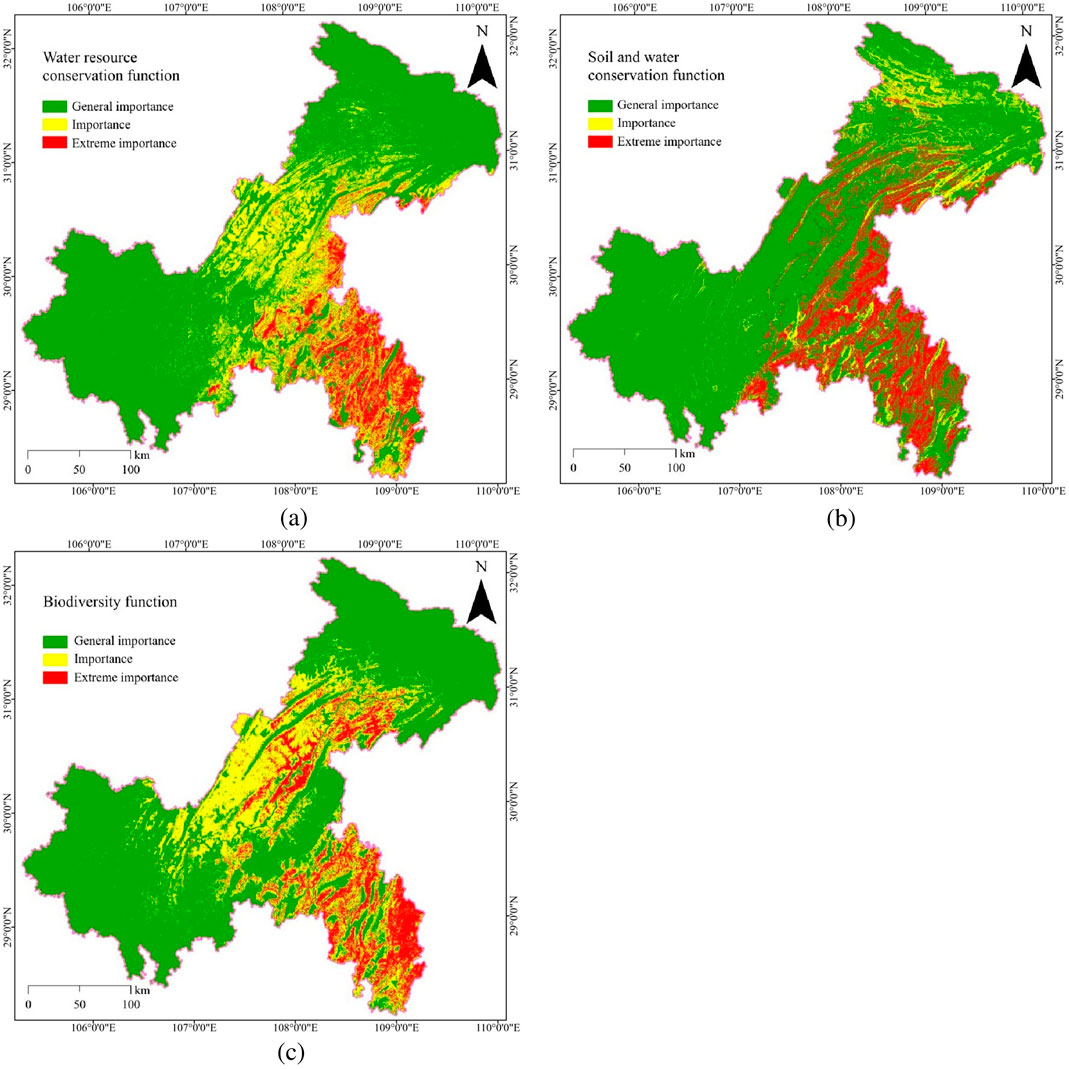
Figure 7. Ecosystem service function evaluation. (a) Water resource conservation function (b) Soil and water conservation function (c) Biodiversity function.
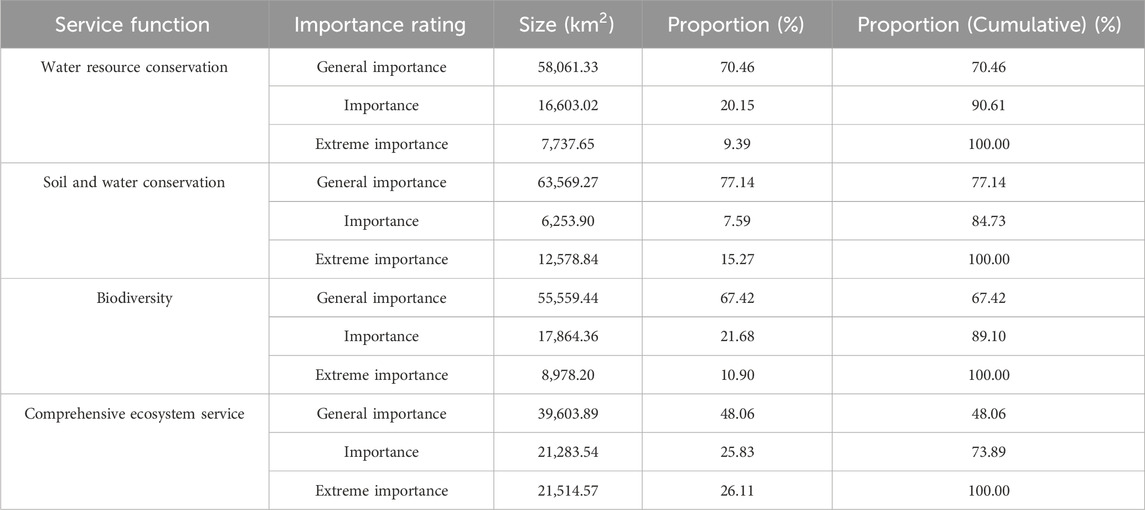
Table 5. Statistical results of ecosystem service function evaluation.
As shown in Figure 7b and Table 5, the soil and water conservation function was primarily of general importance, accounting for 77.14% (63,569.27
As shown in Figure 7c and Table 5, the biodiversity function was mainly of general importance, accounting for 67.42% (55,559.44
As shown in Figure 8 and Table 5, the results indicated that the comprehensive ecosystem service function was primarily of general importance, distributed in the central, western, and northeastern parts of the study area, accounting for 48.06% (39,603.89
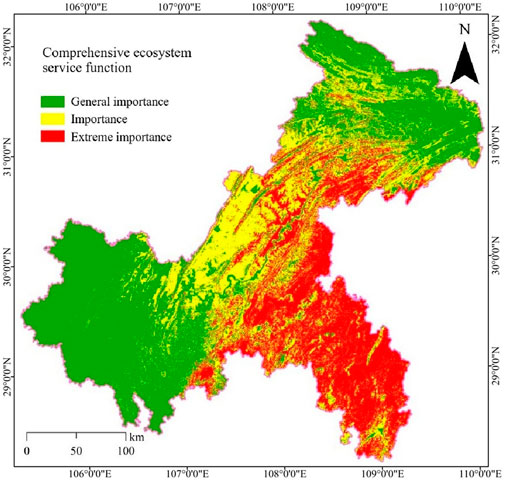
Figure 8. Comprehensive ecosystem service function.
4.3 Ecological space division
As shown in Figure 9 and Table 6, the area of important ecological space was 51,898.62
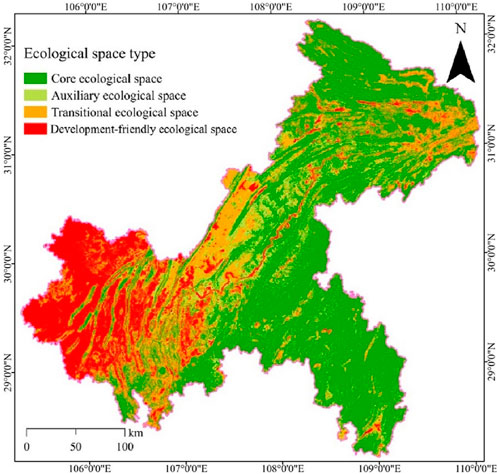
Figure 9. Ecological space type division.
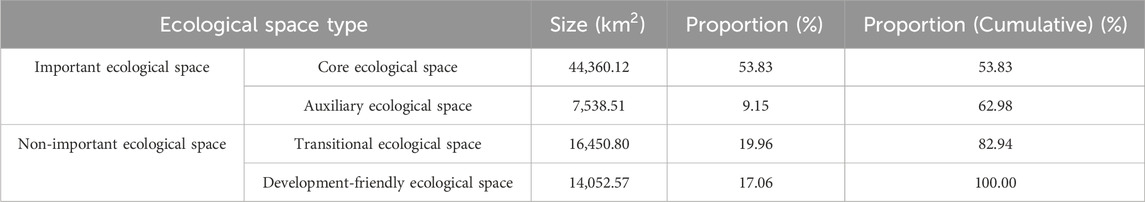
Table 6. Statistical results of ecological space classification.
The area of non-important ecological space was 30,503.37
To analyze the ecological space security pattern, construction and cultivated lands were overlaid with ecological land. As shown in Table 7, 91.24% (1,524
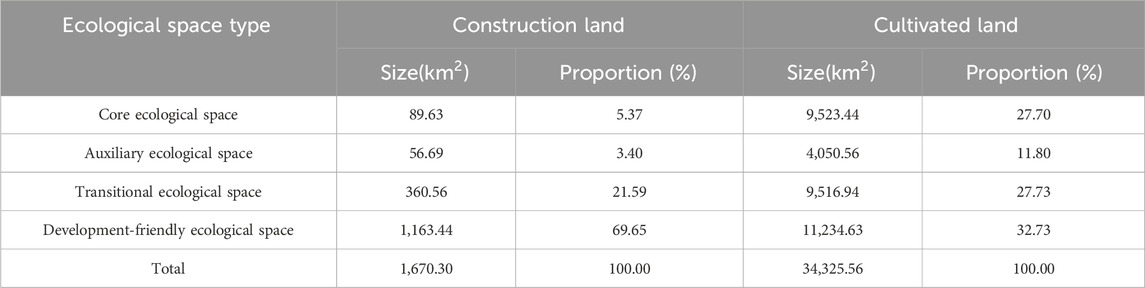
Table 7. Statistics on the current status of ecological space construction land.
5 Discussion
5.1 Ecosystem sensitivity
In the study area, the analysis of desertification sensitivity revealed that carbonate rock is prone to leaching and slow soil formation, which provides the material basis for desertification. However, carbonate rock leakage in the study area was not prominent, and the high coverage of forest and grass vegetation effectively mitigated erosion forces and dissolution conditions, limiting desertification processes. The western part of the study area exhibited predominantly insensitive characteristics. In contrast, the southeastern and northeastern regions, characterized by high mountains, steep slopes, and intense summer rainfall, created favorable conditions for erosion, resulting in predominantly moderate sensitivity. For habitat sensitivity, severely sensitive areas, which are rich in forest resources, exhibit high vegetation coverage and abundant precipitation, making them critical ecological conservation zones. The ES was primarily classified as extremely sensitive, and was mainly concentrated in the east region, where the terrain is elevated, and forest resources are abundant. In terms of spatial distribution, ES generally followed a west-to-east increasing trend, with lower sensitivity in the west and higher sensitivity in the east. The dominant influencing factors were soil and water loss sensitivity and habitat sensitivity. Given the varying ecological sensitivity conditions across the study area, it is essential to adopt differentiated land-use management and ecological protection strategies to enhance regional sustainability.
The primary factor weight determination methods used in this study include the BP neural network and PCA. The weighting of geological disasters sensitivity factors was determined using a BP neural network, which provides a relatively objective analytical approach. Additionally, for habitat sensitivity, we employed PCA to calculate the weights of relevant factors. This method minimizes subjectivity by extracting the most significant features from the dataset, ensuring a more data-driven and unbiased assessment. Therefore, this approach is feasible and reliable for determining factor weights in ecological studies.
5.2 Ecosystem service function
The comprehensive ESF of the study area was primarily classified as generally important, which had flat terrain and were located in densely developed regions. The dominant factor was water resource conservation function. The extremely important water resource conservation function areas, were mainly concentrated in Pengshui, Qianjiang, Youyang, and Xiushan counties, where there was abundant precipitation, high forest coverage, and strong water resource conservation capacity. In terms of spatial distribution, the ESF in the study area exhibited a trend of lower values in the northwest and higher values in the southeast. Based on the ESF distribution results and facing the complex ecological and environmental risk problems in the study area, it is recommended to strengthen water resource management, focus on vegetation protection and natural restoration, rationally develop and utilize land resources to enhance land use efficiency, and improve the ecological compensation mechanism. These measures aim to promote the coordinated and sustainable development of the regional ecological environment and socio-economic systems.
5.3 Ecological space division
This paper divided EST into core, auxiliary, transitional, and development-friendly categories. Among them, the core ecological space was largely composed of nature and ecological conservation areas. However, these areas were also fragile and sensitive, significantly impacted by human activities. Therefore, it is essential to develop policies for their reasonable development and protection. The auxiliary ecological space, serving as a supplementary area to the core ecological space, should impose restrictions on large-scale urban development activities. The development-friendly ecological space has abundant arable land resources and is extensively urbanized. The transitional ecological space, acting as a buffer zone for ecological space, possesses a relatively high environmental carrying capacity and can supplement important and development-friendly ecological spaces for further development.
As shown in Table 7, 91.24% (1,524
In contrast, 39.50% (13,574.00
Furthermore, efforts should be made to enhance the protection of core ecological spaces and issue warnings against human interference. Since core ecological spaces are key ecologically sensitive areas, it is essential to strengthen the monitoring of soil erosion and desertification, increase forest and grass vegetation coverage, maintain the integrity of forests, wetlands, and urban green spaces, halt commercial logging of natural forests, establish a biodiversity monitoring network, and improve habitat quality. These measures are crucial to maintaining ecological security and promoting sustainable land use management.
6 Conclusion
Chongqing is located in the heart of the Three Gorges Reservoir area and has typical mountainous and hilly geomorphological characteristics. We selected Chongqing as the study area and analyzed the ecological space patterns based on various ecological factors from the 2022 data. Additionally, land use data was incorporated to further examine the associated relationships. In contrast to prior research, our study constructed a special ES-ESF-EST ecological space pattern security issue research framework, tailored to the environmental characteristics of hilly and mountainous areas. First, to construct an ES evaluation model, our study selected soil and water loss sensitivity, desertification sensitivity, geological disasters sensitivity, and habitat sensitivity factors, utilized BP neural network methods to determine the indicator weights, and also incorporated relevant factors such as geology, vegetation, roads, climate, and others to build the evaluation system. Secondly, to construct the ESF evaluation model, we selected water resource conservation function, soil and water conservation function, and biodiversity function factors, and obtained the comprehensive ESF results based on the maximum value method. Finally, the spatial distribution structure of EST was mapped based on the results of ES and ESF and using spatial overlay methods. Unlike previous studies, the ecological pattern division results for each land use type were obtained, and the spatial security pattern issues for each land use type were analyzed by incorporating land use data. In the context of implementing the ecological civilization strategy and maintaining national ecological security, this study can support the construction of a natural ecological spatial pattern and optimize the delineation of national land space development patterns, which is of great significance to ecological protection and construction.
Production space, living space, and ecological space together constitute the national land space planning pattern. The topography of Chongqing is complex, and the ecological space delineated in this paper slightly conflicts with the agricultural space of the production space. In subsequent research, other spaces should be considered to explore more scientific and practical methods for dividing ecological space. Moreover, this study primarily focuses on ecological data to delineate the ecological spatial pattern, without incorporating economic, demographic, or policy-related data. Future research will integrate these additional factors to analyze the ecological configuration of Chongqing in comparison with other cities in China, providing a more comprehensive understanding of regional differences in ecological spatial planning.
Data availability statement
The original contributions presented in the study are included in the article/supplementary material, further inquiries can be directed to the corresponding author.
Author contributions
WH: Conceptualization, Data curation, Project administration, Writing – original draft, Writing – review and editing. JL: Data curation, Formal Analysis, Methodology, Project administration, Writing – original draft, Writing – review and editing. WW: Methodology, Writing – original draft. RG: Methodology, Writing – original draft. JT: Visualization, Writing – original draft. JW: Formal Analysis, Writing – original draft.
Funding
The author(s) declare that financial support was received for the research and/or publication of this article. This research was funded by the Chongqing Natural Science Foundation General Project, grant number CSTB2022NSCQ-MSX1664. Chongqing Research Institution Performance Incentive Guidance Special Project, grant number CSTB2024JXJL-YFX0038.
Conflict of interest
Authors WH, JL, WW, RG, JT, and JW were employed by Chongqing Huadi Resource and Environment Technology Co.,LTD.
Generative AI statement
The author(s) declare that no Generative AI was used in the creation of this manuscript.
Publisher’s note
All claims expressed in this article are solely those of the authors and do not necessarily represent those of their affiliated organizations, or those of the publisher, the editors and the reviewers. Any product that may be evaluated in this article, or claim that may be made by its manufacturer, is not guaranteed or endorsed by the publisher.
References
Ban, N., Liu, X., and Zhu, C. (2022). Landscape ecological construction and spatial pattern optimization design based on genetic algorithm optimization neural network. Wirel. Commun. Mob. Comput. 2022, 1–10. doi:10.1155/2022/4976361
Bekisoglu, H., and Keyis, N. (2023). Association of urban green spaces with urban ecological zones. J. Infrastructure, Policy Dev. 7, 2800. doi:10.24294/jipd.v7i2.2800
Chakraborti, S., Das, D. N., Mondal, B., Shafizadeh-Moghadam, H., and Feng, Y. (2018). A neural network and landscape metrics to propose a flexible urban growth boundary: a case study. Ecol. Indic. 93, 952–965. doi:10.1016/j.ecolind.2018.05.036
Chen, H., Yang, Q., Su, K., Zhang, H., Lu, D., Xiang, H., et al. (2021). Identification and optimization of Production-Living-Ecological space in an ecological foundation area in the upper reaches of the yangtze river: a case study of jiangjin district of chongqing, China. Land 10, 863. doi:10.3390/land10080863
Chen, J., Wang, S., and Zou, Y. (2022). Construction of an ecological security pattern based on ecosystem sensitivity and the importance of ecological services: a case study of the guanzhong plain urban agglomeration, China. Ecol. Indic. 136, 108688. doi:10.1016/j.ecolind.2022.108688
Chen, W., Li, X., Li, J., and Wang, J. (2017). Enhancing the MapReduce training of BP neural networks based on local weight matrix evolution, IEEE Xplore, 2829–2835. doi:10.1109/bigdata.2017.8258250
Das, M., Das, A., and Pereira, P. (2024). Impact of urbanization induced land use and land cover change on ecological space quality-mapping and assessment in Delhi (India). Urban Clim. 53, 101818. doi:10.1016/j.uclim.2024.101818
Feng, Q., and Zhao, W. (2014). The study on cover-management factor in usle and rusle: a review. Acta Ecol. Sin. 34. doi:10.5846/stxb201306151710
Gu, Y., Xu, M., Yang, Y., Huang, X., Zou, C., and Ye, X. (2021). Delineation of ecological conservation redline in karst rocky desertification areas: a case study of weining county, guizhou province. Acta Ecol. Sin. 41, 3462–3474. doi:10.5846/stxb201905311143
Gupta, K., Kumar, P., Pathan, S. K., and Sharma, K. P. (2012). Urban neighborhood green index – a measure of green spaces in urban areas. Landsc. Urban Plan. 105, 325–335. doi:10.1016/j.landurbplan.2012.01.003
He, S., Zou, F., and Wang, J. (2021). Ecological sensitivity evaluation of longnan county based on ahp and mse weighting method. Chin. J. Ecol. doi:10.13292/j.1000-4890.202109.022
He, Y., Zhu, J., and Yu, D. (2010). Landscape ecological evaluation in mining area by PCA and remote sensing integrated. 2010 Int. Conf. Multimedia Technol. ICMT 2010, 1–4. doi:10.1109/ICMULT.2010.5631109
Hongtao, N. (2020). Smart safety early warning model of landslide geological hazard based on bp neural network. Saf. Sci. 123, 104572. doi:10.1016/j.ssci.2019.104572
Hou, Y., Zhang, Z., Wang, Y., Sun, H., and Xu, C. (2022). Function evaluation and coordination analysis of Production–Living–Ecological space based on the perspective of Type–Intensity–Connection: a case study of suzhou, China. Land 11, 1954. doi:10.3390/land11111954
Jenks, G. F. (1967). The data model concept in statistical mapping. Int. Yearb. Cartogr. 7, 186–190.
Kabolizadeh, M., Rangzan, K., and Mohammadi, S. (2023). Estimation of soil erodibility (k-factor) in Iran using SoilGrids and HWSD spatial databases. Watershed Manag. Res. 1, 13–33. doi:10.22092/wmrj.2022.358115.1457
Lai, X., Yu, H., Liu, G., Zhang, X., Feng, Y., Ji, Y., et al. (2023). Construction and analysis of ecological security patterns in the southern anhui region of China from a circuit theory perspective. Remote Sens. 15, 1385. doi:10.3390/rs15051385
Li, H., Zhang, T., Cao, X.-S., and Zhang, Q.-Q. (2022). Establishing and optimizing the ecological security pattern in shaanxi province (China) for ecological restoration of land space. Forests 13, 766. doi:10.3390/f13050766
Liang, X., Gao, X., Zhao, M., Guo, Z., and Shen, W. (2023). Ecological space resilience assessment of baiyangdian basin from the perspective of evolutionary resilience. Front. Ecol. Evol. 11. doi:10.3389/fevo.2023.1200218
Liu, J., Zhang, G., Zhuang, Z., Cheng, Q., Gao, Y., Chen, T., et al. (2017). A new perspective for urban development boundary delineation based on SLEUTH-InVEST model. Habitat Int. 70, 13–23. doi:10.1016/j.habitatint.2017.09.009
Liu, J., and Zhong, J. (2024). Landscape evolution in China’s key ecological function zones during 1990–2015. Sci. Rep. 14, 2655. doi:10.1038/s41598-024-52863-1
Liu, T., Peng, X., and Li, J. (2024a). Evaluation of ecological sensitivity and spatial correlation analysis of landscape patterns in sanjiangyuan national park. Sustainability 16, 5294. doi:10.3390/su16135294
Liu, X., Su, Y., Li, Z., and Zhang, S. (2023). Constructing ecological security patterns based on ecosystem services trade-offs and ecological sensitivity: a case study of shenzhen metropolitan area, China. Ecol. Indic. 154, 110626. doi:10.1016/j.ecolind.2023.110626
Liu, Y., and Ding, M. (2022). Maintenance and optimization of ecological space in natural Resource-Advantaged cities: a case study in zhangzhou, fujian province. Sustainability 14, 11952. doi:10.3390/su141911952
Liu, Y., Zhou, T., and Yu, W. (2024b). Analysis of changes in ecological environment quality and influencing factors in chongqing based on a Remote-Sensing ecological index mode. Land 13, 227. doi:10.3390/land13020227
Luo, L., Yang, C., Chen, R., and Liu, W. (2023a). Comprehensive land consolidation zoning based on minimum cumulative resistance Model—a case study of chongqing, southwest China. Land 12, 1935. doi:10.3390/land12101935
Luo, Q., Bao, Y., Wang, Z., Chen, X., Wei, W., and Fang, Z. (2023b). Vulnerability assessment of urban remnant mountain ecosystems based on ecological sensitivity and ecosystem services. Ecol. Indic. 151, 110314. doi:10.1016/j.ecolind.2023.110314
Lv, Y., Wang, X., Yv, X., Kong, X., and Qi, W. (2022). Systematic identification and differential control of natural ecological space in shandong province. Acta Ecol. Sin. 42, 3010–3019. doi:10.5846/stxb202101070063
Ma, M., Zhang, H., Gao, J., Ju, C., Wang, Y., and Liu, D. (2019). Different methods comparison of delineating the ecological protection red line for biodiversity conservation. Acta Ecol. Sin. 39, 6959–6965. doi:10.5846/stxb201807251587stxb201807251587
Ngom, R., Gosselin, P., and Blais, C. (2016). Reduction of disparities in access to green spaces: their geographic insertion and recreational functions matter. Appl. Geogr. 66, 35–51. doi:10.1016/j.apgeog.2015.11.008
Niu, X., Ni, H., Chen, G., Zhang, D., Zhang, J., Zhang, J., et al. (2022). Evaluation of ecological conservation importance of fujian province. Acta Ecol. Sin. 42, 1130–1141. doi:10.5846/stxb202012153187
Ouyang, X., Xu, J., Li, J., Wei, X., and Li, Y. (2022). Land space optimization of urban-agriculture-ecological functions in the Changsha-Zhuzhou-Xiangtan urban agglomeration, China. Land Use Policy 117, 106112. doi:10.1016/j.landusepol.2022.106112
Shmakova, M., and Kuznetsova, Y. (2023). Characteristics of the ecological space of Russia: regional differences. Eng. Technol. Syst. 31, 655–683. doi:10.15507/2413-1407.125.031.202304.665-683
Tang, F., Zhang, P., Zhang, G., Zhao, L., Zheng, Y., Wei, M., et al. (2018). Construction of ecological corridors in changli county based on ecological sensitivity and ecosystem service values. Ying yong sheng tai xue bao 29, 2675–2684. doi:10.13287/j.1001-9332.201808.017
Wang, D., Fu, J., Xie, X., Ding, F., and Jiang, D. (2022). Spatiotemporal evolution of urban-agricultural-ecological space in China and its driving mechanism. J. Clean. Prod. 371, 133684. doi:10.1016/j.jclepro.2022.133684
Wang, W., Yin, S., Yu, J., He, Z., and Xie, Y. (2023). Long-term trends of precipitation and erosivity over northeast China during 1961–2020. Int. Soil Water Conservation Res. 11, 743–754. doi:10.1016/j.iswcr.2023.04.002
Wolfe, P. (1969). Convergence conditions for ascent methods. SIAM Rev. 11, 226–235. doi:10.1137/1011036
Xie, H., Yao, G., He, Y., and Zhang, D. (2018). Study on spatial identification of critical ecological space based on gis: a case study of poyang lake ecological economic zone. Shengtai Xuebao/Acta Ecol. Sin. 38, 5926–5937. doi:10.5846/stxb201703280534
Xie, X., Li, C., Wu, L., Gao, Z., Wang, Y., Shen, N., et al. (2024). Improvement of land surface vegetation ecology inhibited precipitation-triggered soil erosion in the alpine-cold river source area – a case study in southern gansu, China. J. Hydrology Regional Stud. 51, 101614. doi:10.1016/j.ejrh.2023.101614
Xu, H., Zhang, Z., Yu, X., Li, T., and Chen, Z. (2023). The construction of an ecological security pattern based on the comprehensive evaluation of the importance of ecosystem service and ecological sensitivity: a case of yangxin county, hubei province. Front. Environ. Sci. 11. doi:10.3389/fenvs.2023.1154166
Ye, X., and Wang, R.-Y. (2024). Ecological sensitivity assessment of xinyi city in guangdong province based on GIS and AHP. Int. J. Environ. Agric. Biotechnol. 9, 120–135. doi:10.22161/ijeab.93.13
Yi, D., Zhao, X., Guo, X., Zhao, L., Zhang, H., Han, Y., et al. (2020). Delimitation of urban development boundary based on ecological sensitivity evaluation and CA-Markov simulation in plain city:a case of nanchang, jiangxi, China. Ying yong sheng tai xue bao 31, 208–218. doi:10.13287/j.1001-9332.202001.013
Yu, Q., Feng, C.-C., Shi, Y., and Guo, L. (2021). Spatiotemporal interaction between ecosystem services and urbanization in China: incorporating the scarcity effects. J. Clean. Prod. 317, 128392. doi:10.1016/j.jclepro.2021.128392
Zhang, H., Yang, Q., Rui, L., and Liu, Q. (2012). Estimation methods of slope gradient and slope length in watershed based on GIS and multiple flow direction algorithm. Chin. Soc. Agric. Eng. 28, 159–164. doi:10.3969/j.issn.1002-6819.2012.10.025
Zhang, L., Hu, B., Zhang, Z., and Liang, G. (2023). Research on the spatiotemporal evolution and mechanism of ecosystem service value in the mountain-river-sea transition zone based on “production-living-ecological space” – taking the karst-beibu gulf in southwest guangxi, China as an example. Ecol. Indic. 148, 109889. doi:10.1016/j.ecolind.2023.109889
Zhang, Q., Wang, Q., Zhu, J., Xu, L., Li, M., Rengel, Z., et al. (2021). Higher soil acidification risk in southeastern Tibetan plateau. Sci. Total Environ. 755, 143372. doi:10.1016/j.scitotenv.2020.143372
Zhang, Y., Jiang, P., Cui, L., Yang, Y., Ma, Z., Wang, Y., et al. (2022). Study on the spatial variation of China’s territorial ecological space based on the standard deviation ellipse. Front. Environ. Sci. 10, 982734. doi:10.3389/fenvs.2022.982734
Zhao, H., Jiang, X., Gu, B., and Wang, K. (2022a). Evaluation and functional zoning of the ecological environment in urban Space—a case study of taizhou, China. Sustainability 14, 6619. doi:10.3390/su14116619
Zhao, H., Jiang, X., Gu, B., and Wang, K. (2022b). Evaluation and functional zoning of the ecological environment in urban Space—a case study of taizhou, China. Sustainability 14, 6619. doi:10.3390/su14116619
Zhao, H., Xu, Y., Zhou, Y., Zhang, G., and Chen, X. (2022c). Quantitative identification and analysis of spatiotemporal evolution characteristics of ecological space:a case study of hulun buir city. J. Nat. Resour. 37, 2153. doi:10.31497/zrzyxb.20220815
Zhao, Z., Zhao, Y., Li, T., Lv, Y., Wang, C., and Wu, X. (2022d). Comprehensive evaluation and spatio-temporal variations of ecological sensitivity on the qinghai-tibet plateau based on spatial distance index. Acta Ecol. Sin. 42. doi:10.5846/stxb202110283041
Keywords: ecosystem sensitivity, ecosystem service function, ecological space type, ecological security conflict, hilly and mountainous
Citation: Han W, Lei J, Wang W, Gao R, Tian J and Wang J (2025) Ecological space delineation and security analysis in the hilly areas of chongqing, China. Front. Environ. Sci. 13:1554974. doi: 10.3389/fenvs.2025.1554974
Received: 03 January 2025; Accepted: 26 March 2025;
Published: 09 April 2025.
Edited by:
Merja H. Tölle, University of Kassel, GermanyReviewed by:
Xinchen Gu, China Institute of Water Resources and Hydropower Research, ChinaJinzhu Wang, Deakin University, Australia
Copyright © 2025 Han, Lei, Wang, Gao, Tian and Wang. This is an open-access article distributed under the terms of the Creative Commons Attribution License (CC BY). The use, distribution or reproduction in other forums is permitted, provided the original author(s) and the copyright owner(s) are credited and that the original publication in this journal is cited, in accordance with accepted academic practice. No use, distribution or reproduction is permitted which does not comply with these terms.
*Correspondence: Jie Lei, NTk5OTIxMDNAcXEuY29t