 Meixia Wang*
 Qingyun Zheng
- School of Economics and Management, Xi’an University of Technology, Xi’an, China
The wellbeing eco-efficiency (WEE) is a core indicator for assessing the quality of regional ecological environment and the wellbeing of people’s livelihood. Clarifying its spatial and temporal dynamic evolution and network structure characteristics is crucial for promoting the ecological protection and high-quality development in the entire Yellow River Basin (YRB). Based on the panel data of 99 cities in the YRB from 2010 to 2022, the WEE is measured by introducing the ecological wellbeing into the evaluation system of eco-efficiency. The spatial-temporal dynamics, disparities, and their origins, as well as the structural attributes of the network, are investigated. The results showed that: First, The WEE in the YRB, upper, middle, and lower reaches have been improved, showing the stage characteristics of “steady growth-fluctuation decline-rapid growth,” and technological progress is the main driving force for efficiency growth. Second, the absolute difference of WEE in the whole and middle reaches shows an expanding trend, and the upper and lower reaches show a decreasing trend. The inter-regional differences and hypervariable density are the main sources of spatial differences. Third, the YRB has broken the geographical location restrictions and formed a multi-threaded complex network form. During the sample investigation period, the network scale and network agglomeration have been continuously enhanced, and the small-world network correlation effect is significant. Forth, regarding the small group network characteristics: the upper reaches’ WEE has a “wheeled” structure centered on Longnan; the middle reaches’ WEE forms a “chain” structure with Yulin, Xi’an, and Ankang as cores; and the lower reaches’ WEE exhibits a “dual-core multi-center radial” structure with Heze and Zhengzhou at its core, featuring significant two-way interactions.
1 Introduction
Against the backdrop of rapid global economic development, issues such as excessive resource consumption, escalating environmental pollution, and ecosystem degradation have become increasingly severe, posing significant challenges to sustainable development. Striking a balance between economic growth and ecological preservation has emerged as a central topic of concern for governments and academia worldwide. Recently, ecological efficiency, an indicator system that comprehensively reflects the state of economic development and ecological environment, has garnered widespread attention. It provides theoretical and practical foundations for achieving high-quality development by considering multiple dimensions including environmental, economic, ecological, and social benefits of energy utilization (Peng et al., 2020; Yu et al., 2021). Building on this, sustainable development theory emphasizes balanced development across the three pillars of economy, society, and environment (Zhao et al., 2025). The driving forces-pressure-state-impact-response (DPSIR) analytical framework highlights the impacts of human activities, environmental pressures, changes in ecosystem states, and their consequences on social wellbeing (Yi et al., 2025). Ecological footprint and carbon footprint theories reveal the relationship with people’s livelihood and wellbeing by measuring human resource consumption and carbon emissions (Jiang et al., 2025). Social-ecological resilience theory emphasizes the reciprocal interactions between society and ecosystems, while inclusive green development theory advocates for the parallel progress of economy, environment, and social equity (Wang and Ge, 2024). Therefore, based on these theoretical foundations, “wellbeing” is introduced as an important extension of ecological efficiency, leading to the concept of wellbeing ecological efficiency (WEE). WEE strikes a balance between human wellbeing and ecological preservation, serving as a crucial indicator that comprehensively assesses the quality of socio-economic development, the benefits of ecological environmental protection, and the enhancement of people’s wellbeing.
In the process of sustained economic growth since China’s reform and opening up, although the traditional quantitative and extensive development model has created the “Oriental Miracle” of world economic growth (Chen and Hou, 2024), it has also caused a sequence of issues like excessive consumption of resources, substantial emissions of greenhouse gases and deterioration of the ecological environment. This development model has aggravated the contradiction between economy, environment and people‘s wellbeing to a certain extent (Wang and Yang, 2024; Li et al., 2023; Lee et al., 2023). Especially under the influence of air pollution, land degradation and ecological space shrinkage, the national health, social culture and education level have been significantly impacted (Liu et al., 2021; Pan, 2023). According to the “2022 China Ecological Environment Bulletin,” about 37.2% of cities are plagued by air pollution, and the health of water ecology and marine ecology in key areas is not optimistic. In this context, the Chinese government has proposed a series of development strategies at the policy level, such as “promoting green development,” “improving people’s livelihood and wellbeing,” and “achieving harmonious coexistence between man and nature.” As an important indicator to reflect the level of ecological civilization construction and meet the needs of people’s better life, WEE is an inevitable choice to promote high-quality development.
As an important ecological security barrier, the birthplace of Chinese civilization and an important economic zone in China, the Yellow River Basin (YRB) has significant ecological functions, cultural values and economic significance (Feng et al., 2023; Li et al., 2024). However, for a long time, the heavy industry structure dominated by energy and chemical industry has caused serious damage to the ecological environment of the basin, resulting in the wide distribution and serious degree of ecological sensitive areas and fragile areas. Combined with the frequent occurrence of extreme climate events in recent years, the ecosystem of the YRB is facing severe challenges (Zhao et al., 2023). How to enhance eco-efficiency while safeguarding and promoting residents’ ecological wellbeing has become a critical issue that urgently needs to be addressed. However, the urban development patterns in the YRB are diverse, and there are significant differences in ecological resource endowments among regions. Traditional assessments of eco-efficiency struggle to comprehensively reflect the coordinated development of regional ecology and social wellbeing. Therefore, this paper innovatively introduces the concept of WEE, aiming to more comprehensively measure the environmental impact and contributions to residents’ wellbeing during the economic development process of cities in the YRB, thereby addressing the shortcomings of traditional evaluation systems. Simultaneously, the development strategy of urban agglomerations has gradually transformed the YRB from a “point-like” model of economic development of a single city to a “plane-like” and “mesh-like” model (Hao et al., 2023). However, the research on high-quality development based on the principle of geographical proximity is often limited to the limitations of administrative jurisdictions, and fails to fully reveal that the regional problems of the YRB are actually rooted in the needs of the overall governance of the entire basin (Chen et al., 2021). There exist complex economic, social, and ecological connections among cities in the YRB, forming a tightly interwoven network structure. By employing social network analysis (SNA), we can clearly reveal the spatial network characteristics of WEE in the YRB, such as which cities occupy core positions, which cities play critical connecting roles. This helps to deeply understand the intrinsic mechanisms of ecological and social wellbeing interactions among cities within the basin, providing strong support for formulating regional coordinated development strategies.
Given this context, this paper takes 99 cities in the YRB as the research subjects, integrates multidimensional variables related to people’s livelihood and wellbeing into the assessment framework of eco-efficiency, and quantitatively evaluates the level of WEE in each city. On this basis, the dynamic evolution and spatial differences of the WEE are analyzed through kernel density estimation and the Gini coefficient. Furthermore, the SNA method is employed to dynamically identify the characteristics of the spatial correlation network structure and the group clustering features of WEE. The possible marginal contributions are: (1) This paper, adopting a lens of strong sustainability and high-quality development, embarks on an analysis from the tripartite dimensions of “economic prosperity, ecological gains, and social welfare,” amalgamating a spectrum of variables that encapsulate the ethos of ecological civilization and the populace’s yearning for an enhanced standard of living (energy economic growth, ecological environment damage and construction index, and people’s livelihood and wellbeing) into the assessment framework of eco-efficiency, enriching and expanding the new perspective of eco-efficiency research. It recalculates the WEE of cities in the YRB, promoting the evolution of eco-efficiency from a “GDP-oriented” approach to one focused on “people’s livelihood and wellbeing.” The paper also delineates the evolutionary characteristics of this metric across both temporal and spatial dimensions, providing a new paradigm for the study of eco-efficiency. (2) Using cities as research samples, the SNA is employed to delineate the spatial correlation network structure characteristics, group clustering features, and evolutionary trends of WEE, thereby enriching the connotations of spatial features and analytical methods of eco-efficiency. This paper, based on the three-dimensional portrayal of “relational data,” provides a detailed depiction of the complex, multi-threaded overall network and group network structure characteristics of WEE. It accurately identifies the roles that each city plays within the network, laying a solid foundation for planning the collaborative enhancement path of WEE.
2 Literature review
The term “eco-efficiency” was initially coined by Schaltegger and Stum in 1990, defining it as the quotient of economic expansion against the escalation of environmental strain. Subsequently, the World Business Council for Sustainable Development (WBCSD) in 1995 further elaborated and honed this concept, asserting that eco-efficiency is about satisfying the essential needs for human survival and elevating life quality through the provision of products or services that offer competitive pricing benefits. The objective is to mitigate the process’s impact on resource intensity and ecological health to a level within the Earth’s regenerative capacity. In essence, eco-efficiency strives for the optimization of economic prosperity and environmental conservation through the most judicious use of resources and the least environmental degradation, fully reflecting the concept of strong sustainable development (Du et al., 2023; Wang et al., 2023a). Recently, as issues of ecological preservation and people’s wellbeing have become increasingly urgent, research on ecological efficiency has gradually expanded from a mere focus on the relationship between economy and environment to broader domains. Welfare economics is concerned with maximizing the overall wellbeing of residents under limited resources, and ecological efficiency provides an effective framework for assessing whether this goal can be achieved while safeguarding the environment (Zhang et al., 2024). Enhancing ecological efficiency not only helps reduce environmental pollution but also directly improves residents’ wellbeing levels by enhancing living conditions (Zhang et al., 2021). Therefore, the evaluation of ecological efficiency should transcend traditional indicators of energy use and economic growth, and comprehensively consider environmental impacts, social welfare, and people’s livelihood and wellbeing, thereby providing a more holistic reflection of regional development quality and the harmony between ecology and society.
As research continues to deepen, the evaluation system of eco-efficiency has evolved from a single economic output indicator to a multidimensional indicator framework. Early studies predominantly used Gross Domestic Product (GDP) as the sole output indicator, but this approach overlooked the environmental pollution and ecological degradation issues arising from energy use (Zhou et al., 2019). Consequently, scholars have gradually incorporated ecological factors and pollution as undesirable outputs into the evaluation system (Yang and Li, 2020; Ren et al., 2024; Tian and Mu, 2024). However, current eco-efficiency evaluations still primarily focus on the relationship between the economy and the environment, with relatively insufficient attention paid to people’s wellbeing (Liu et al., 2020). Therefore, WEE builds upon traditional eco-efficiency by further integrating dimensions of social wellbeing and people’s livelihood, and closely aligns with the socio-economic conditions of the YRB, ultimately constructing a more comprehensive evaluation framework.
The assessment techniques for eco-efficiency predominantly consist of stochastic frontier analysis (SFA) and data envelopment analysis (DEA), with DEA being the predominant approach (Li and Long, 2021). The early DEA-CCR model assigned specific weights to different inputs and subsequently integrated them. Nonetheless, given the constraints of conventional DEA models when it comes to managing pollutants and other unfavorable outputs, researchers developed super-efficiency DEA models (enabling further comparison and ranking of efficient decision-making units), SBM models, Super-SBM models (effectively addressing the issue of slack variables), and EBM models (accommodating both radial and non-radial features) (Zhang and Chen, 2022; Pan et al., 2023; Li and Yang, 2023). There has been additional investigation into the selection and treatment of indices for undesired outputs, enhancing the precision of measurement outcomes and their alignment with actual production processes. Among them, the Super-SBM model is extensively utilized for eco-efficiency measurement as it accurately handles slack variables, improves result stability and reliability, and flexibly processes non-radial data without fixed input-output ratios (Wu et al., 2022).
From the perspective of the research content of eco-efficiency, it mainly focuses on the following aspects: First, it involves investigating the dynamic evolution of eco-efficiency distribution. Wen et al. (2022) used the Super-SBM model and the spatial autocorrelation model to analyze the eco-efficiency of cultivated land use in the Dongting Lake Plain in time and space. The study found that the eco-efficiency showed the characteristics of “up-down-up” in time, and there was a spatial agglomeration phenomenon in spatial eco-efficiency. Lv et al. (2020) used the three-stage DEA model, local autocorrelation and spatial lag coefficient regression model to empirically analyse the spatial and temporal effects of China’s tourism industry eco-efficiency and found that the provincial tourism eco-efficiency showed convergent agglomeration characteristics. The second is the study of spatial differences in eco-efficiency. Sun et al. (2023) used the Super-SBM model and kernel density function to analyze the eco-efficiency of China’s provinces in time and space, and deeply studied the differences in eco-efficiency between China’s provinces through Gini coefficient, σ-convergence and Markov transition matrix. Wu et al. (2022) employed the Super-SBM model to assess the eco-efficiency of Chinese 244 cities from 2005 to 2017 and utilized a dynamic Durbin model to empirically test the impact of industrial agglomeration on eco-efficiency and regional heterogeneity. Thirdly, factors influencing eco-efficiency include economic development level, industrial structure, technological innovation, environmental regulation, artificial intelligence, and resource endowment. Economic development level significantly promotes eco-efficiency. With the increase in per capita GDP and labor productivity, regions are more likely to adopt advanced technologies, thereby enhancing resource utilization efficiency (Guo et al., 2022). A high proportion of heavy industry reduces eco-efficiency, while high-tech and circular economy sectors can improve it (Xu et al., 2022). Technological innovation significantly enhances eco-efficiency by optimizing production processes and reducing resource consumption and pollution emissions (Zhang et al., 2021). Strict environmental regulations compel enterprises to increase environmental protection investments, adopt clean production technologies and processes, and reduce pollutant emissions, thereby driving industrial transformation and upgrading (Cui et al., 2022). Artificial intelligence improves eco-efficiency through intelligent monitoring and data analysis, enabling precision agriculture, energy management, and supply chain optimization. It also facilitates real-time monitoring of air and water pollution and predicts ecological risks, aiding in pollution control and ecological restoration (Ren et al., 2025). Abundant natural resource endowments typically provide a foundation for economic development, but over-reliance on resource exploitation may lead to resource waste and environmental degradation, resulting in the resource curse (Gong, 2023).
Researchers have undertaken studies on China’s eco-efficiency at multiple levels, predominantly focusing on the national, provincial, or broader regional scales (sub-zones, sub-regions and metropolitan areas). The examination of urban eco-efficiency, as a more granular spatial unit, is understudied, particularly regarding its dynamic evolution and the factors driving such changes. Cities constitute the fundamental spatial units and the building blocks of provincial development. Their organizational actions and functions exhibit distinctive traits that neither provinces nor larger geographical entities can replicate, revealing a set of unique behavioral dynamics and operational models (Li, 2022). Because of factors such as economic growth, urban size, resource allocation, and geographic positioning, there is a notable spatial disparity and a tendency toward polarization in the levels of eco-efficiency across various regions (Liu et al., 2022; Quito et al., 2023). In the context of the new development paradigm where domestic circulation is predominant, the inter-regional movement of labor, capital, and energy has become increasingly frequent. Consequently, the ecological and environmental issues that arise are transcending geographical boundaries, manifesting as a complex and multifaceted spatial correlation network. The contradiction between ecological conservation and the wellbeing of people’s livelihood is becoming increasingly apparent among different regions. (Xu et al., 2022). Nevertheless, most of the current research employs exploratory spatial data analysis (ESDA) along with conventional spatial econometric techniques to investigate and assess the spatial distribution patterns and regional disparities of eco-efficiency. The spatial clustering characteristics of eco-efficiency revealed by ESDA consider only the geographical aspects of “contiguity” or the “neighborhood” effect, and it is impossible to further reveal the spatial correlation characteristics of urban eco-efficiency. Thus, we use the SNA method to describe the complex and multi-layered structure characteristics of WEE in the YRB, using “relationship data,” and precisely locating the role of individual cities in the network.
3 Methods
3.1 Research methods
3.1.1 Super-SBM model and malmquist-luenberger index
We employ the Super-SBM model, which is based on input-output categories, to evaluate the WEE. This model represents a non-radial, non-angular measurement approach within the DEA framework, capable of comprehensively addressing issues related to the slackness in inputs and outputs. The Super-SBM model builds upon this by further differentiating among decision-making units that have achieved efficiency, thereby addressing the limitations inherent in the SBM model. The formula is:
Where, m is the number of decision making units (DMU), and each DMU includes n inputs
To better examine the dynamic changes of efficiency, the Malmquist Luenberger (ML) index, which includes a directional distance function to explain undesirable output, has been proposed. From the periods t to t+1, the corresponding formula is presented below:
Where,
Where, an ML value greater than 1 signifies an enhancement in WEE, whereas an ML value less than 1 indicates a deterioration in WEE.
3.1.2 Kernel density estimation
The kernel density estimation is a type of nonparametric test method employed to infer the distribution of intensive data. We select the Gaussian kernel function to study the dynamic evolution of WEE in the YRB. f(x) is its probability density function, and its expression is as follows:
Here, n denotes the sample size, Xi signifies an independently and identically distributed observation from the population X, h indicates the bandwidth.
3.1.3 Dagum Gini coefficient
We employ the Dagum Gini coefficient approach to explore the temporal dynamics of spatial disparities in WEE within the YRB, delving into the underlying causes. The total Gini coefficient G is broken down into three components: the within-region inequality contribution Gw, the between-region net value inequality contribution Gnb, and the super variable density contribution Gt, where the relationship holds: G = Gw + Gnb + Gt. A lower Gini coefficient typically indicates narrower regional disparities and a higher degree of regional integration. Conversely, a higher Gini coefficient suggests a weaker level of regional collaboration. In accordance with Dagum’s definition and the scope of this study, the computations are formulated as follows:
Among them, k represents the number of regions, n represents the number of all cities, yji (yhr) represents the WEE of city i(r) in region j(h), nj(nh) represents the number of cities in region j(h), and μj(μh) is the mean value of WEE in region j(h). In Equation 12,
3.1.4 Modified gravity model
In this paper, the modified gravity model is applied to calculate the spatial correlation of WEE among cities. The precise formula is presented below:
Where,
3.1.5 SNA
SNA is a method for studying social relationships, network structures, and the flow of information. By analyzing the connections between individuals, it explores the patterns of formation and evolution of social networks, thereby understanding social structures and individual behaviors. It mainly includes overall network structure analysis, centrality analysis, and cohesive subgroup analysis (Liu et al., 2015; Shao and Wang, 2021). This paper applies this method to avoid the limitation of “geographic proximity” in traditional spatial methods and conducts a holistic study of the network structure of WEE in the YRB. The principal indicators and analytical techniques are presented in Table 1.
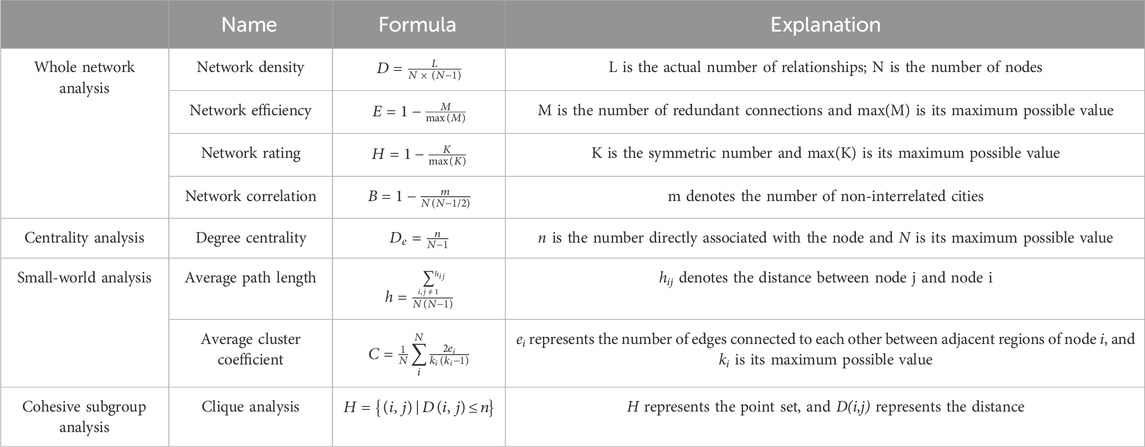
Table 1. Network characteristic analysis and calculation method.
3.2 Evaluation index system
According to the development demands of environmental welfare non-decreasing in the theory of strong sustainability, in the process of promoting ecological civilization construction and improving the quality of economic growth, it is essential to reduce ecological environmental damage while continuously transforming and restoring the environmental system to enhance environmental construction capacity (Yang and Li, 2020). Based on this, this paper constructs an environmental construction index and an environmental damage index, which are incorporated into the WEE evaluation system as input indicators and undesirable outputs, respectively. Specifically, the environmental construction index reflects the efforts and achievements of a region in environmental restoration and construction, while the environmental damage index measures the potential environmental destruction caused by economic growth in the region. These two indices can help comprehensively assess the resource inputs and environmental pressures faced by a region in promoting ecological civilization construction. Since the primary aim of economic, resource, and environmental development is to enhance human wellbeing, measuring eco-efficiency solely based on economic, resource, and environmental indicators cannot fully reflect the actual situation (Wang et al., 2018). Therefore, based on the theories of sustainable development, ecology, and welfare economics, and integrating the coordination mechanism between ecosystem services and people’s wellbeing, we refer to Wang and Shi (2014), Xie et al. (2024), and Zhang et al. (2018) and develop an evaluation framework for the people’s wellbeing index, as shown in Table 2. This index covers two dimensions: the wellbeing of people’s basic needs and the wellbeing of social harmonious development, aiming to reflect social fairness and justice, superior ecological environment, openness, and innovation, among other characteristics, to maintain ecosystem stability and enhance people’s wellbeing.
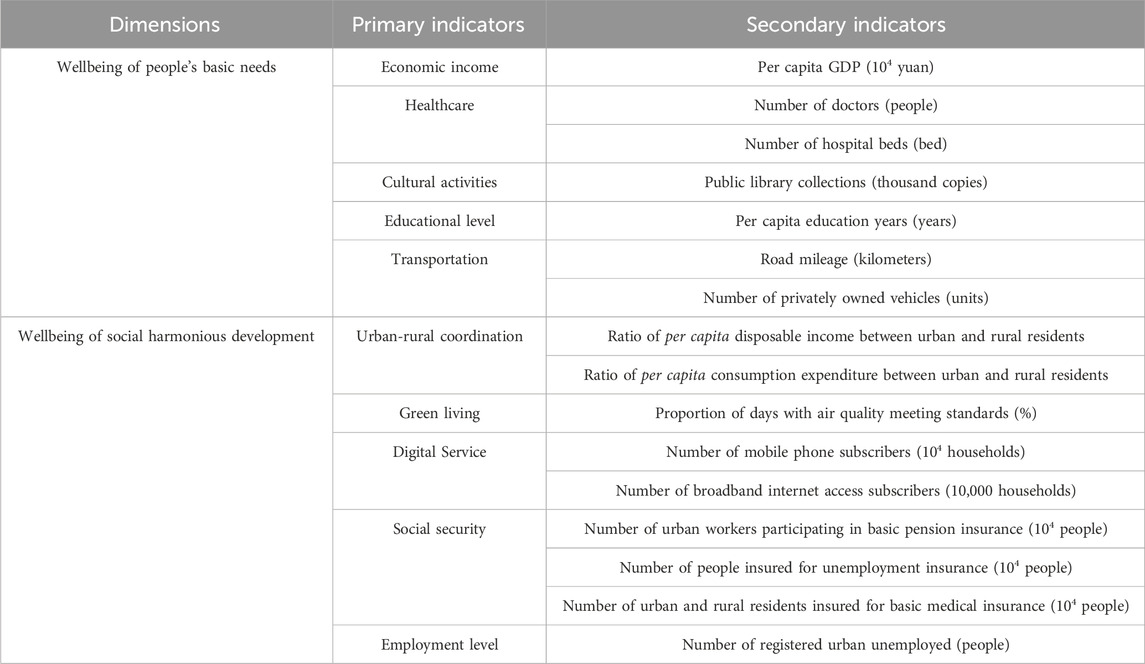
Table 2. Evaluation index system of people’s livelihood and wellbeing.
Based on the above analysis, the input indicators for WEE encompass four dimensions: energy consumption, physical capital stock, human capital stock, and environmental construction index. The expected outputs encompass the People’s livelihood and wellbeing index and GDP, while the undesired output is the environmental damage index. The detailed indicator system and the methodology are illustrated in Table 3.
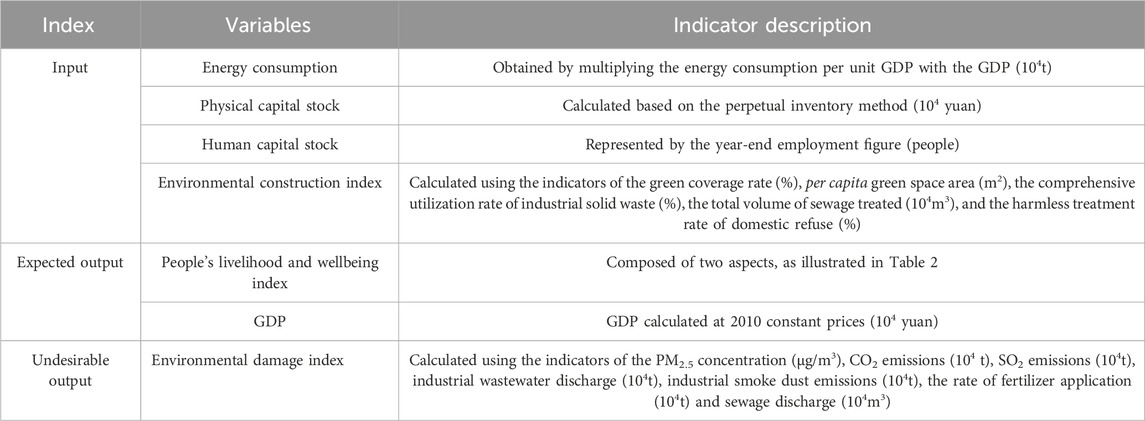
Table 3. Evaluation index of the WEE.
3.3 Research scope and data sources
The YRB is located in northern China, spanning across nine provinces and covering a vast area from Qinghai Province to Henan Province. As the second-largest river in China, the YRB holds significant geographical importance and plays a crucial role in agriculture, industry, and water resource utilization, both economically and ecologically. In addition, the YRB is rich in mineral resources and is one of China’s primary sources of coal, oil, and natural gas. However, the ecological environment of the YRB has long faced severe challenges, particularly water scarcity, ecological degradation, and pollution. These issues not only threaten the ecological security of the basin but also directly impact the sustainable development of the economy and the long-term stability of society. Following the study by Chen et al. (2021) and Wang et al. (2024), this paper designates 99 cities across nine provinces within the YRB for the period of 2010–2022 as the subject of study, as shown in Figure 1. The selection is grounded in the natural watershed boundaries to ensure the consistency of geographical entities and the completeness of provincial administrative divisions, considering the accessibility and completeness of the data. Concurrently, this study categorizes the YRB into its upper, middle, and lower reaches, identifying Hekou Town in Inner Mongolia and Taohuayu in Henan Province as the demarcation points.
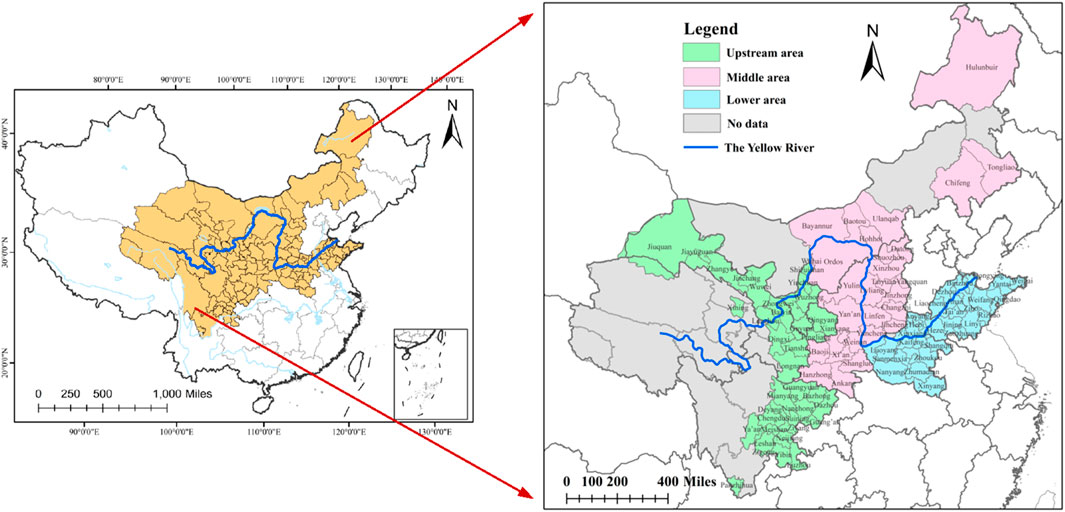
Figure 1. Study area.
The data are mainly derived from the 2011–2021 China Urban Statistical Yearbook, and provincial and urban statistical yearbooks. Among them, the per capita years of education are from the Chinese census and sample survey database. The PM2.5 concentration is based on the global ground observation PM2.5 concentration raster data calibrated by the University of Washington in St. Louis using geographically weighted regression (GWR). It is calculated using the zoning statistical tool in ArcGIS software, and the geographical distance between cities is calculated by ArcGIS software. The individual missing values in the above data are filled by linear interpolation.
4 Results and discussion
4.1 Measurement and decomposition of WEE in the YRB
4.1.1 Measurement of WEE in the YRB
Using the Super-SBM model, this study assesses the WEE of 99 cities in the YRB from 2010 to 2022 from two perspectives: the entire YRB and its three main sub-regions. As displayed in Figure 2, the average annual growth rate of WEE in the entire YRB from 2010 to 2022 is 2.85%, indicating an upward trend. This suggests that with the development of society, the state pays more and more attention to the coordinated improvement of economic construction, people‘s livelihood wellbeing construction and ecological governance, and the WEE has been effectively improved. From an evolutionary perspective, the WEE has experienced three stages of “steady growth-fluctuation decline-rapid growth.” From 2010 to 2013, the WEE in the YRB showed a steady growth trend. This may be because, under the influence of the financial crisis in 2008, China began to adjust its economic growth model and industrial layout at an accelerated pace and continued to push forward the improvement of people’s livelihoods, so that the economy of the YRB grew rapidly and people’s living standards improved steadily. At the same time, the 18th National Congress of the Communist Party of China introduced an array of ecological conservation initiatives, contributing to a steady enhancement of the WEE. From 2013 to 2017, the WEE exhibited a trend of fluctuating decline, with an average annual reduction of 1.04%. As industrialization progresses, environmental pressures have been escalating, and the tension between resource exploitation and environmental conservation has grown more pronounced. Issues such as severe soil erosion, scarcity of water resources, and a decrease in biodiversity signal that the YRB’s ecological environment has reached a pivotal juncture in its struggle for protection and management, leading to a decline in the WEE. From 2017 onwards, the introduction of various environmental conservation strategies, including the enhancement of spatial planning, the promotion of integrated water resource management, and the prioritization of ecological considerations, has led to a gradual amelioration of the YRB’s ecological environment, and the WEE has also entered a stage of fast growth.
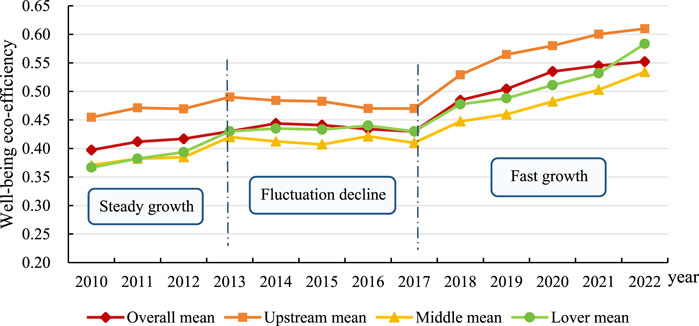
Figure 2. Evolution trend of the WEE.
As shown in Figure 3, the WEE in the YRB exhibits significant spatial differentiation characteristics. Specifically, the WEE values in the upper reach range from 0.45 to 0.61, markedly higher than those in the middle and lower reaches. The possible reason is that, driven by the “dual carbon” goals, upstream provinces such as Qinghai and Sichuan have adopted mechanisms to realize the value of ecological products, converting ecological resources into economic benefits and forming a virtuous cycle of “protection-appreciation-feedback”. Factors such as abundant renewable resources, low population density, and a good living environment have contributed to the healthy and efficient operation of the ecosystem, thus resulting in a relatively high WEE value. The WEE values in the middle and lower reaches are relatively close and exhibit a trend of “convergence-divergence.” Although the lower reach has higher population densities and fewer resource reserves, they are at the forefront of institutional and technological innovation, with developed tertiary industries, higher levels of economic development, and improved residents’ living standards, leading to improvements in the WEE. The middle reach, rich in coal resources, generates significant amounts of wastewater, sulfur dioxide, nitrogen oxides, and other waste during coal production and deep processing. Simultaneously, it releases large amounts of heat and dust, exerting tremendous pressure on the ecological environment, severely impacting environmental quality. Faced with the dual negative impacts of industrial structure adjustment, upgrading, and resource constraints, the improvement of the WEE is constrained. Furthermore, an in-depth examination of factors reveals that the hindered improvement of the WEE in the middle reach is primarily due to three institutional barriers: First is the inertia of resource-dependent policies. Taking Shanxi as an example, the long-term implementation of the “coal supply guarantee” policy has led local governments to continuously support the coal industry through tax incentives and land allocation preferences, resulting in a “resource curse” effect that squeezes policy space for emerging industries. Second is the absence of regional collaborative governance. Horizontal ecological compensation mechanisms in the middle reach have not yet been fully implemented. Compared to the Yangtze River Delta, the middle reach lacks a market-oriented mechanism for realizing the value of ecological products, leading to insufficient governance motivation. Third is the distortion in the market mechanism. The pithead price of coal in the middle reach has long been below the full cost. For instance, in 2023, the internalization rate of coal’s environmental cost in Yulin City was only 31%. Compared to Germany’s polluter pays principle, the resource tax rate is relatively low, leading to the continuous accumulation of negative environmental externalities. This regional imbalance is essentially a structural mismatch between institutional supply and transformational needs: the upper reach relies on institutional innovation to activate ecological capital, the lower reach leverages market advantages to capture technological dividends, while the middle reach, under the dual pressures of the policy implementation funnel and factor price distortion, falls into a state of inefficiency.
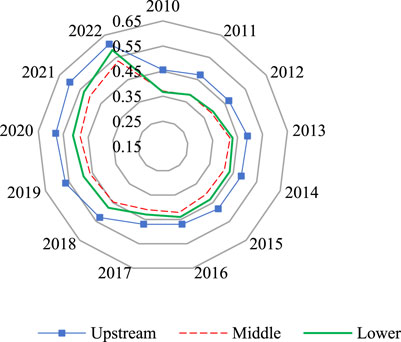
Figure 3. Comparison of the development trend of WEE.
Based on industrial structure characteristics, cities can be classified into three basic types: industry-dominant, service-dominant, and balanced types, as presented in Figure 4. The WEE of service-dominant cities has consistently maintained a high level and shown an accelerated upward trend since 2014, with core cities such as Chengdu and Xi’an exhibiting particularly significant performance, where the efficiency values exceeded 1 in 2022. The possible reasons lie in the effective promotion of industrial upgrading and resource optimization through policy tools such as fiscal transfer payments, tax incentives, and green finance in these cities. Additionally, these cities are endowed with abundant renewable resources, low population density, and favorable living environments, providing advantageous conditions for the healthy and efficient operation of ecosystems. In contrast, although the WEE of industry-dominant cities has shown a steady upward trend, some cities (such as Shizuishan and Wuzhong) have experienced significant fluctuations in their WEE, primarily due to stringent environmental policies such as high emission standards and environmental entry barriers that have temporarily increased compliance costs for enterprises. Market failures have led to the excessive concentration of resources in inefficient heavy and chemical industrial sectors, and the externalization of environmental costs has weakened the incentives for enterprises to reduce emissions. Although the overall WEE of balanced cities is lower than that of service-dominant cities, it has grown rapidly, with some cities, such as Bazhong and Longnan, achieving significant improvements after 2020, thanks to the strengthening of ecological compensation mechanisms and the preferential policies for green industries, such as support for ecological agriculture and tourism. However, the stability of the WEE in some cities is poor, with declines observed in Guyuan and Zhongwei in 2022.
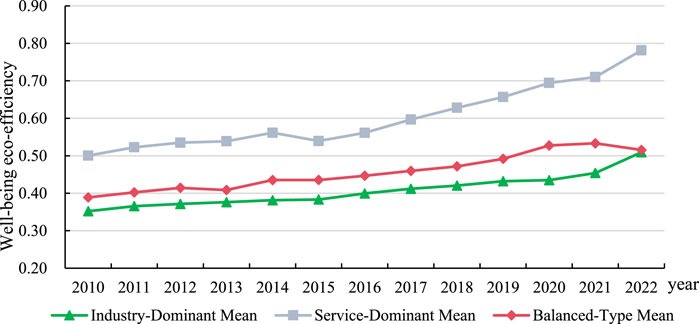
Figure 4. Evolution of WEE across city types.
4.1.2 Decomposition of WEE in the YRB
4.1.2.1 Input-output slack analysis
To explore the relationship between the WEE and other sustainable development goals, such as economic development, social equity, resource utilization, environmental damage, etc., and to identify the directions for improvement needed to enhance WEE, this paper employs input redundancy rate and output deficiency rate to conduct a decomposition analysis of WEE. A high input redundancy rate indicates excessive input of relevant indicators, signifying waste of resources, and it is necessary to reduce unnecessary inputs to improve the efficiency. A high output deficiency rate, on the other hand, implies that the output of the indicator is too low, leading to insufficient production efficiency, and it is necessary to increase the relevant output to enhance the efficiency. The rate of the input-output slack calculated using the SBM model to the value of the corresponding indicator is defined as the input redundancy rate and output deficiency rate, as shown in Table 4.

Table 4. Input redundancy rate and output deficiency rate of WEE.
From an overall watershed perspective, the redundancy rate of the environmental construction index is the highest (63.08%), indicating significant waste in investments in environmental governance projects. This suggests potential issues of overinvestment or inefficient allocation, necessitating the optimization of resource allocation with a focus on quality rather than quantity. The redundancy rates of human capital stock (42.57%) and physical capital stock (35.73%) follow, reflecting that labor and physical resources are not fully converted into effective outputs. This may be related to inadequate education and training, delayed technology application, or inefficient capital allocation. The energy consumption redundancy rate (25.33%) is relatively lower but still requires the promotion of energy-saving technology applications. The deficiency rates of GDP (25.15%) and wellbeing of people’s basic needs (22.54%) are relatively high, indicating that economic output and social welfare levels are not optimal. These need to be improved through technological innovation or policy adjustments to enhance production efficiency. The deficiency rate of the environmental damage index (20.35%), being a reverse indicator, implies that a low value signifies prominent pollution issues. This value indicates that pollutant emission problems are relatively severe. The deficiency rate of wellbeing of social harmonious development (0.39%) is extremely low, suggesting relatively good performance in this area. However, regional disparities still need to be monitored.
Regionally, the upper reach tops the entire basin with a redundancy rate of environmental construction index (66.51%), which may be linked to an excessive concentration of ecological restoration projects lacking scientific evaluation. Meanwhile, the deficiency rates of GDP (22.26%) and wellbeing of people’s basic needs (13.92%) are relatively low, indicating that while economic development is somewhat lacking, basic livelihood security is relatively good. Furthermore, the upper reach has the lowest deficiency rate of environmental damage index (14.51%) in the entire basin, suggesting that ecological and environmental issues remain prominent. In the middle reach, both the redundancy rates of energy consumption (31.86%) and physical capital stock (35.36%) are at high levels, reflecting the dominance of an extensive growth model. Additionally, the GDP deficiency rate (29.94%) is the highest in the basin, indicating a relatively monolithic economic structure and significant pressure for industrial upgrading. The deficiency rate of environmental damage index (21.54%) is also high, indicating severe industrial pollution, particularly in high-pollution industries such as steel and chemicals. The lower reach has the highest redundancy rates of energy consumption (34.59%) and physical capital stock (40.18%) in the entire basin, highlighting issues of inefficient resource utilization. At the same time, the deficiency rate of wellbeing of people’s basic needs (30.66%) is significantly higher, possibly due to inadequate public service provision resulting from high population density. Overall, the upper reach should prioritize ecological protection, enhance the efficiency of environmental construction, and actively cultivate green industries such as organic agriculture and carbon sink trading. The middle reach should accelerate the green transformation of traditional industries, explore an integrated “industry + ecology” development model, and enhance sustainable development capabilities. The lower reach needs to improve public service levels, enhance social equity, and focus on addressing issues of resource utilization efficiency.
4.1.2.2 ML change decomposition analysis
With the aim of gaining a deeper understanding of the evolving nature of WEE in the YRB, as well as the fluctuations in the associated efficiency decomposition indicators, this study utilizes the ML index for assessing the temporal changes in eco-efficiency across the cities within this region. The findings of this assessment are detailed in Table 5.
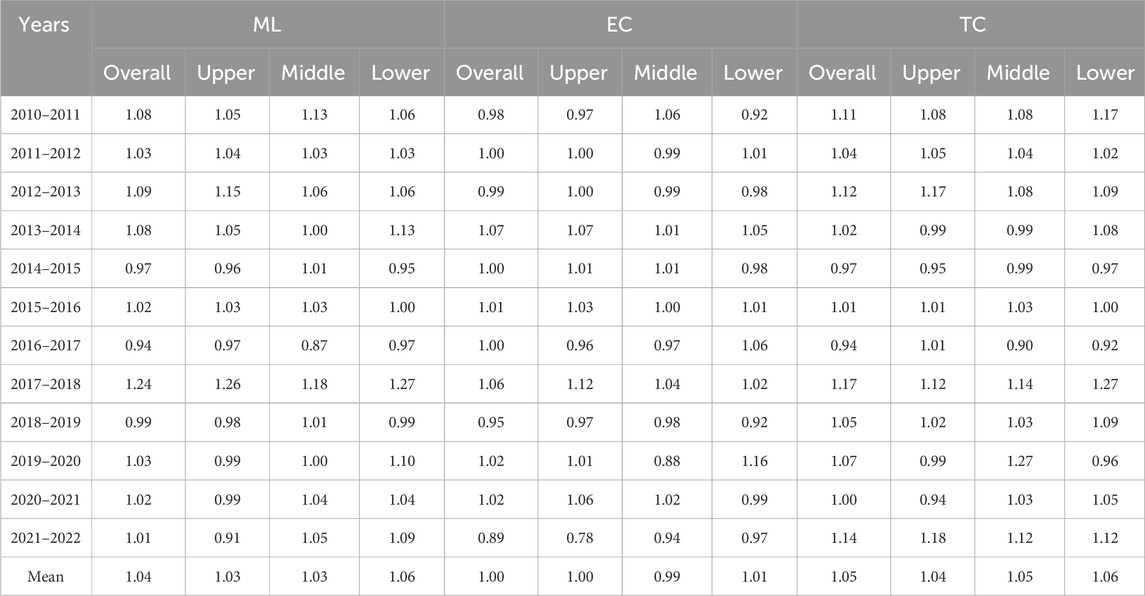
Table 5. Changes in WEE and decomposition items.
According to Table 5, from the overall change of WEE in the YRB, the average annual growth rate of WEE between 2010 and 2022 is 4%. Among them, except for negative growth in 2014–2015, 2016–2017 and 2018–2019, the rest of the years are positive growth, and in 2017, it reached a growth rate of 24%. It is observable that 2017 is a turning point in the change of WEE in the YRB, aligning with the change of WEE measured by super-efficiency SBM. Viewing the matter through the lens of evolving technological efficiency and progress, it's clear that the advancement of technology is the primary engine for the rise in WEE. In addition, the enhancements in technological efficiency act as a further accelerator for the expansion of WEE.
From the perspective of regions, the changes of WEE in the upper, middle and lower reaches from 2010 to 2022 are all greater than 1, showing an increasing trend. Among them, the increase rate of WEE in the lower reaches is up to 6%, which is inextricably linked to the high level of the science and technology development. The growth rate of WEE in the middle and upper reaches is 3%. This may be attributable to difficulties in industrial restructuring, low technological innovation, and the over-exploitation and abuse of water and land resources. These factors place pressure on both economic growth and the ecological environment, thereby impeding the growth of WEE. From the perspective of technical efficiency changes, except for the negative growth in the middle reach, other regions are growth. Looking at the lens of the average yearly increase in technological progress, the lower reach boasts the highest rate at 6%. This underscores the critical role of technological progress as the principal catalyst for the enhancement of WEE. Generally, the growth of WEE in the YRB shows a gradient growth trend of “upper-middle-lower” and the growth differences between regions are constantly expanding.
4.2 The dynamic evolution and spatial difference of WEE in the YRB
4.2.1 Dynamic distribution evolution
We employ the kernel density estimation technique to portray the overall contour and dynamic progression of the absolute discrepancy distribution of WEE across the YRB, with the outcomes depicted in Figure 5.
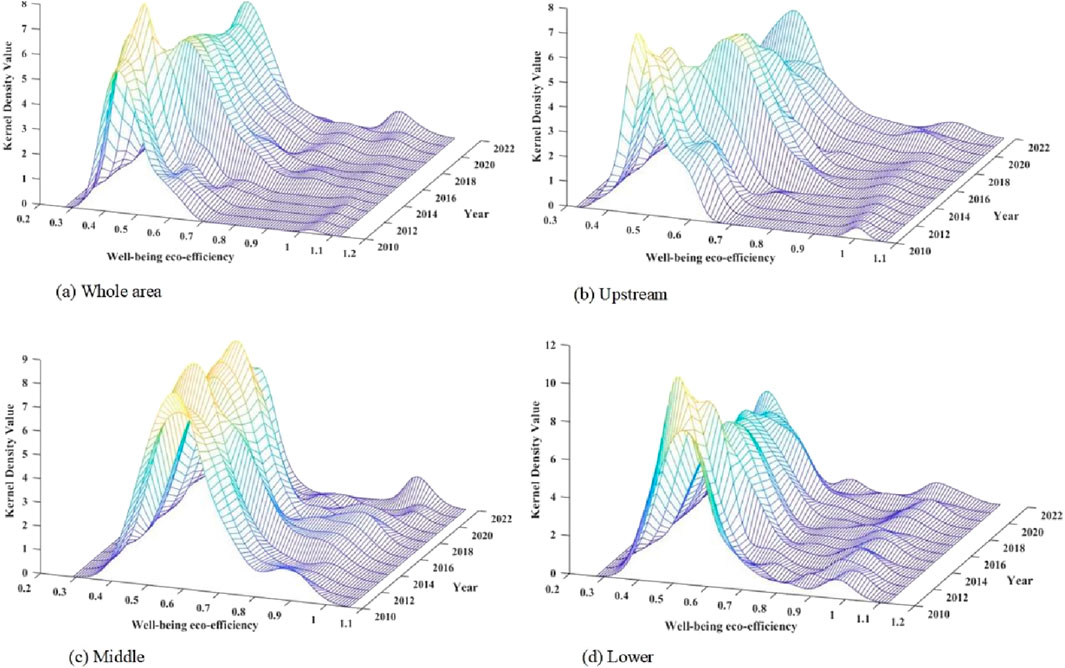
Figure 5. Dynamic evolution of WEE in the YRB. (a) Whole area. (b) Upstream. (c) Middle. (d) lower.
From the perspective of the entire YRB, the WEE in 2010 was primarily concentrated around 0.3–0.5, with a kernel density peak of approximately 3.1, indicating that the WEE during this period was generally low, with no significant regional differences. Compared to 2010, the distribution of WEE in 2013 showed no major changes, but the kernel density peak increased to 7.9, and the bandwidth decreased, suggesting a relative reduction in the overall disparity of WEE. Starting from 2014, the kernel density curve began to shift to the right, with the peak continuously declining and the bandwidth widening, indicating a gradual improvement in WEE and a further expansion of regional disparities. By 2022, WEE was concentrated in the ranges of 0.4–0.6 and 0.8–1.0, with the kernel density curve gradually exhibiting a bimodal pattern. This demonstrates that over time, the WEE in the YRB has increasingly concentrated at higher levels, with the degree of intra-regional imbalance continuously rising and the polarization trend becoming more pronounced.
From the perspective of the upper reaches of the YRB, from 2010 to 2022, the overall trend of the kernel density of WEE exhibits spatial consistency with the entire YRB, showing a rightward shift accompanied by an evolutionary pattern of bandwidth expansion from “narrow to wide.” This indicates that regional disparities in WEE have gradually intensified. However, diverging from the general trend, the peak value of the kernel density function in the upper basin demonstrates a fluctuating pattern of “decrease - increase - decrease - increase” during 2010–2022. Such oscillatory behavior suggests a weakening extremalization tendency and an emerging convergence pattern in WEE distribution. Notably, the abrupt peak elevation observed in 2022 implies an increasing concentration of high-efficiency values. Geospatial analysis further reveals those cities with superior welfare ecological performance form significant agglomerations on the right tail of the density distribution. Collectively, these findings reveal a dynamic process of “convergence - polarization - re-convergence” in WEE development within the upper reaches. While this trajectory signifies overall improvement in welfare outcomes, it simultaneously highlights persistent regional disparities and uneven development patterns.
From the perspective of the middle reaches of the YRB, from 2010 to 2022, the kernel density curve of WEE exhibited significant fluctuations, especially between 2014 and 2016, during which substantial changes in WEE occurred. After 2018, the overall peak value of the kernel density showed an upward trend. Simultaneously, the kernel density curve experienced a transition from “unimodal” to “weak bimodal”, indicating that the polarization trend in WEE is gradually becoming apparent. Unlike the overall YRB and the upper reaches, the kernel density curve gradually shifted to the left, suggesting that the WEE in the middle reaches is gradually decreasing. In summary, the WEE has undergone a process of “convergence - polarization.”
From the perspective of the lower reaches of the YRB, from 2010 to 2022, the change trend of the kernel density of WEE was similar to that of the middle reaches. The kernel density waveform gradually shifted to the left, and the vertical height of the peak decreased, but the magnitude of the decrease was more significant than that in the middle and upper reaches. Unlike the middle and upper reaches, the kernel density bandwidth experienced an initial increase followed by a decrease. During the period from 2014 to 2016, the bandwidth expanded significantly, while by 2022, the bandwidth had noticeably contracted and was slightly lower than in 2010 and 2012. This sugests that the differences in WEE in the lower reaches are gradually decreasing. Overall, the WEE shows a process of “polarization - convergence.”
4.2.2 Spatial difference and decomposition
To further reveal the spatial differences and sources of WEE in the YRB, this study uses the Dagum Gini coefficient method to measure its overall differences, intra-regional differences, inter-regional differences and contribution rates in detail, as displayed in Figure 6. As presented in Figure 6A, the mean value of the overall Gini coefficient is 0.121, indicating that the imbalance of the WEE is obvious. In terms of trend analysis, the overall Gini coefficient exhibited a wavy downward trajectory, decreasing from 0.111 to 0.103 between the years 2010 and 2016. However, in 2017, the coefficient increased rapidly to 0.119, and then showed a trend of increasing year by year. Further analysis of the internal WEE in the three major regions reveals significant regional differences. The lower reaches exhibit the greatest disparity, with an average Gini coefficient of 0.116, compared to 0.114 in the upper reaches and 0.094 in the middle reaches. From the development trend perspective, the Gini coefficients of internal WEE in the three major regions have risen, suggesting an increased spatial difference among them. Specifically, the internal Gini coefficient in the upper reaches fluctuates significantly, showing a “rising - falling - rising - falling” trend, while those in the middle and lower reaches are relatively stable.
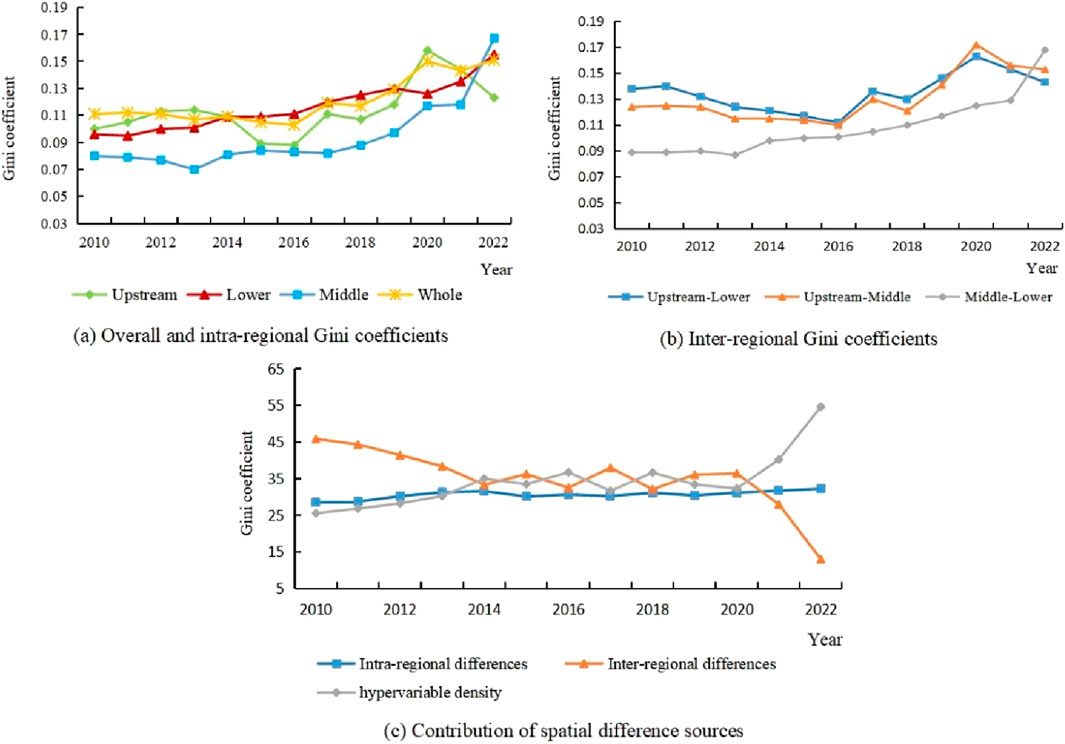
Figure 6. Spatial difference and contribution rate of WEE. (a) Overall and intra-regional Gini coefficients. (b) Inter-regional Gini coefficients. (c) Contribution of spatial difference sources.
Figure 6B shows the developmental trajectory of regional disparities in WEE within the YRB. The inter-regional difference between the upper and lower reaches is the greatest, with an average Gini coefficient of 0.135, indicating a significant disparity in WEE between them. In contrast, the degree of difference between the middle and upper reaches, the middle and lower reaches decreased in turn, and the average inter-regional Gini coefficient is 0.131 and 0.108, respectively. From 2010 to 2022, the inter-regional differences in WEE between the lower and middle reaches, the lower and upper reaches, and the middle and upper reaches are similar to the overall differences, showing an upward trend. The average annual growth rates are 5.74%, 0.66%, and 2.24%, respectively. This indicates that the spatial differences among regions have further increased and thus require attention. Considering the evolutionary trajectory, the Gini coefficient curve between the lower and upper, the middle and upper staggered and fluctuated, and the difference showed a trend of “convergence-divergence- convergence-divergence”.
Figure 6C is the evolution process of the contribution of the spatial difference source of WEE. The average contribution rate of inter-regional differences is the highest at 35.09%, followed by that of hypervariable density at 34.27%, and finally the average intra-regional contribution rate at 30.64%. This shows that inter-regional differences and hyper-variation density, that is, the cross-overlap of different regions, are the main sources of differences in WEE. Throughout the sampling period, the overall contribution rate between regions showed a downward trend, and the inter-regional contribution showed a relatively stable change, while the hypervariable density fluctuated with an average annual increase of 7.38%, showing a “rise-decline-rise” distribution pattern.
4.3 Network structural characteristics of WEE in the YRB
4.3.1 Network complexity characteristics
Utilizing the modified gravity model, we employ the previously calculated WEE of the YR as the foundational data to establish a spatial correlation network. Taking 2010, 2013, 2017, and 2022 as examples, Ucinet software was used to construct a 99 × 99 relationship matrix and ArcGIS software was used to establish the spatial correlation of WEE in 99 cities.
From the calculation results of the gravity model, the WEE has broken the geographical location restrictions and flowed among regions to form a directed spatial correlation complex network without isolated points. Combined with the statistics of network complexity characteristics in Table 6, the scale of network continued to expand from 2010 to 2022. The network relationship flow among 99 cities increased from 1084 in 2010 to 1831 in 2022, and the network density showed an upward trend. By 2022, the network density was 0.189, indicating that the correlation between cities was not close enough and a solid organizational structure had not been formed. The network correlation degree of each year is higher than 0.9, indicating that the network has obvious spatial spillover effect and good accessibility. The network hierarchy in each year is very low, indicating that the symmetry between cities in the network is low, and more cities are in the marginal position. The network efficiency is above 0.76, indicating that there are fewer redundant connections in the network. The average number of cities connected to a single city increased from 18.222 to 18.495, indicating that the relationship has gradually become closer in the past 13 years, the spatial correlation between cities has been strengthened, the network structure cohesion has gradually increased, and the network connectivity has been improved. The diameter of the network was reduced from 9 to 7, and the average path length was reduced from 2.810 to 2.545, indicating that the accessibility of the network was continuously improved. The average clustering coefficient increased first and then decreased, indicating that the correlation effect of WEE was widespread among cities, but the correlation effect was reduced due to the impact of the new coronavirus epidemic. The larger agglomeration coefficient and the shorter average path length in the network conform to the nature of the small-world network. The change of WEE in some regions can lead to the change of the agglomeration of the whole network.
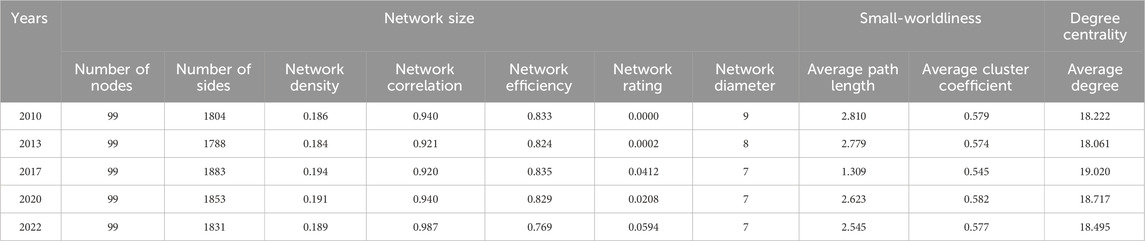
Table 6. Statistics of network complexity characteristics of WEE.
4.3.2 Cohesive subgroup analysis
We use Ucinet software to convert the binary matrix of WEE in the YRB in 2010, 2016 and 2022 into a 0–1 symmetric matrix, and conduct factional analysis. According to the results of faction analysis, 99 cities are further divided into four categories: core cities, bridge cities, major cities and edge cities by using the natural discontinuity point method.
Table 7 presents the number and classification of urban factions in the years 2010, 2016, and 2020. In 2010, the urban network along the YRB began to take shape, with core cities predominantly located in the central and western regions. Specifically, Zhengzhou, Tianshui, Qingyang, Xi’ an, Pingliang, and Chengdu appeared in 77, 61, 54, 48, and 47 factions respectively, forming the core of the network. This indicates a high degree of overlap among these cities across different factions, placing them in the most crucial core positions and maintaining exchanges and cooperation with numerous smaller urban groups. Furthermore, 35 cities including Bazhong, Heze, Yulin, Yan’an, and Liaocheng appeared in 22–38 factions, suggesting that they played reliable core member roles within the regional network and served as bridges to some extent. Meanwhile, 31 cities such as Guangyuan, Jiaozuo, Dezhou, Tongchuan, Ankang, and others appeared in 11–21 factions, indicating that their communication scope was relatively narrow, but they had formed small cooperative groups and played significant roles within specific regions. Additionally, 27 cities including Ulanqab, Baotou, Nanyang, Xinyang, Hohhot, and others appeared in 0–10 factions, positioning them at the periphery of the network with limited exchanges and cooperation with other cities.
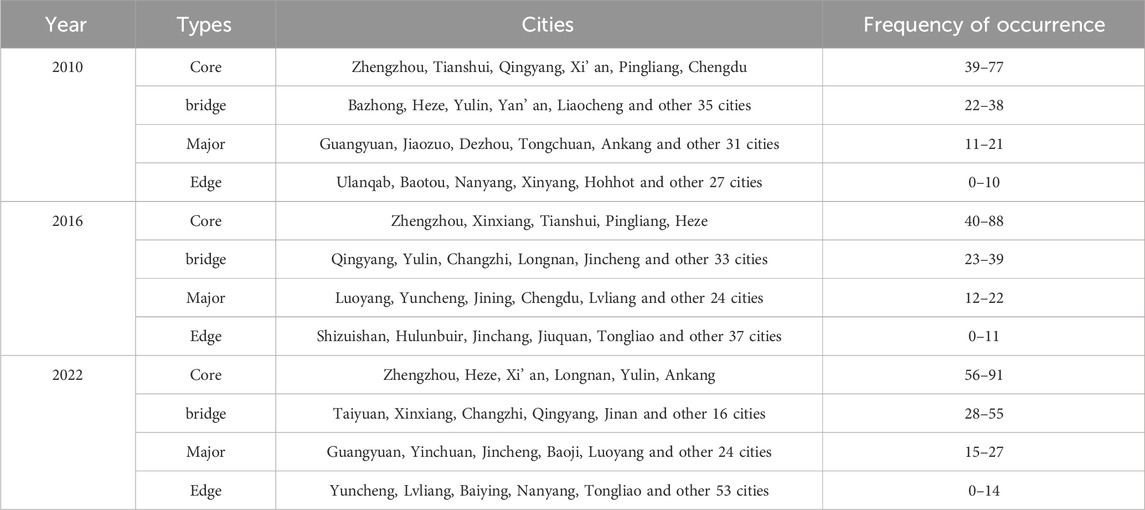
Table 7. Factional analysis of spatial correlation network of WEE.
In 2016, the urban network was further strengthened, with core cities expanding towards the midstream. Xinxiang and Heze emerged as new core cities, reflecting the enhanced synergy within the Central Plains urban agglomeration. Tianshui and Pingliang maintained their core positions, while Xi’an temporarily withdrew, possibly due to the initial allocation of resources towards inland hubs (such as Zhengzhou) under the “Belt and Road” initiative. Additionally, resource-based cities such as Qingyang, Yulin, Changzhi, and Jincheng played crucial intermediary roles within the network. For example, Changzhi served as an important regional link connecting the Shanxi energy belt with the core area of Henan. Meanwhile, the number of bridge cities decreased, but their frequency of appearance within the network increased, indicating a concentration of intermediary functions towards nodes with higher added value. Chengdu’s core position declined, reflecting a weakening of connectivity among upstream cities. The roles of some cities also fluctuated, with Luoyang, for instance, downgrading from a potential core to an important city. Furthermore, the number of peripheral cities increased by 10, with remote cities such as Hulunbeir, Jiuquan, and Tongliao becoming further marginalized, while resource-depleted cities (such as Shizuishan) gradually withdrew from the main network system due to economic decline.
By 2022, the urban network had taken on a new configuration, with the spatial distribution of core cities shifting westward and the issue of marginalization further intensifying. Zhengzhou and Xi’an reshaped the dual-core driving pattern, while Longnan and Ankang emerged as new core cities, reflecting the impact of the ecological protection strategy in the YRB. The Qinling-Bashan mountainous region, due to its enhanced role as an ecological barrier, drove the initial success of the “ecology-economy” synergetic development policy. The number of bridge cities significantly decreased, but their frequency of appearance in the network markedly increased, indicating a worsening differentiation in network hierarchy, with a few high-value nodes monopolizing intermediary functions. For example, provincial capitals or regional centers such as Taiyuan, Jinan, and Qingyang became key intermediaries. Among them, Taiyuan connected the urban agglomeration in central Shanxi with the core region of Shaanxi, promoting cross-provincial synergetic development. However, some bridge cities (such as Jincheng) were downgraded, indicating that the direct radiation scope of core cities had further expanded. Notably, the number of peripheral cities surged to 53, accounting for over 50%, including some previously relatively important cities (such as Luliang and Yuncheng), reflecting an aggravation of stratification in the urban network and increasingly prominent regional development imbalances.
Summarizing the evolution pattern of urban roles in the YRB, it mainly comprises three aspects: (1) Expansion path of core cities: Zhengzhou continues to strengthen its hub status, while Xi’an returns to the core after a brief fluctuation, indicating the effectiveness of the national central city policy. Furthermore, the rise of Longnan and Ankang reflects the promoting effect of the “Lucid waters and lush mountains” strategy on the development of eco-cities. (2) Functional changes of bridge cities: Bridge cities have shifted from resource-based cities (in 2016) to regional centers (in 2022). For example, the formation of the Jinan-Zhengzhou collaboration model demonstrates that policy guidance can optimize the allocation of intermediary resources and enhance regional synergy efficiency. (3) Worsening marginalization crisis: The number of peripheral cities has doubled in 3 years, necessitating differentiated revitalization strategies for resource-depleted and remote cities, such as ecological compensation and investment in digital infrastructure.
Based on the faction analysis results in Table 7, we divided the overall network of WEE into three sub-group networks and drew the 2022 sub-group network structure characteristic map, as shown in Figure 7. Zhengzhou, Heze, Xi’ an, Longnan, Yulin, and Ankang have strong radiation ability and cohesion. They are closely related to the surrounding cities and have strong driving ability. They are not only the core of small groups, but also closely related to other cities nationwide. Taiyuan, Xinxiang, Changzhi, Qingyang, Jinan and other cities are closely related to the core cities, which can drive the cities that cannot directly contact with the core members and play an important intermediary role. Although Guangyuan, Yinchuan, Jincheng, Baoji, Luoyang and other cities are not deeply connected with each other, they can still significantly contribute to linking with core cities and each other through intermediary cities.
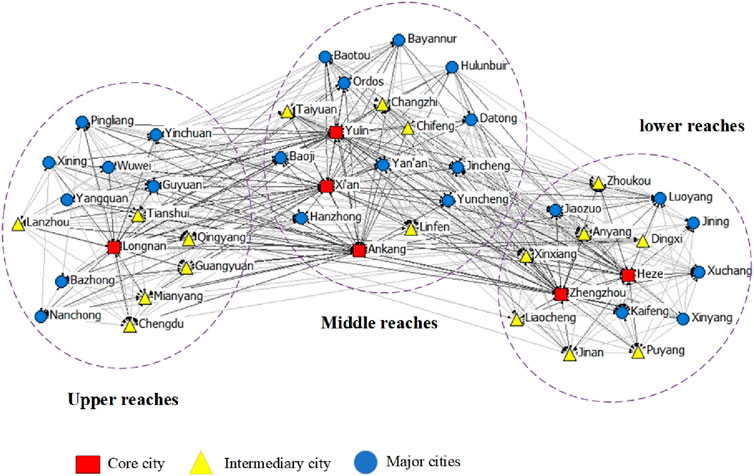
Figure 7. Characteristics of small group network structure in 2022.
From the perspective of small-group network structures, in the upper reaches, there is only one core city, Longnan, which connects some cities in the middle and lower reaches. Overall, it exhibits a “wheel-shaped” network characteristic. This structure indicates that the WEE in the upper reaches is relatively dispersed and the overall coordination is feeble. Consequently, it is essential to reinforce the construction of core cities and play the role of intermediary cities to promote more cross-regional cooperation and exchanges. In the middle reaches, there are three core members, namely, Yulin, Xi’an and Ankang, presenting a “chain-shaped” network structure. The degree of two-way interaction among cities is large, which can promote the common optimization of WEE. In the lower reaches, there are two core cities, Heze and Zhengzhou, seven intermediary cities such as Liaocheng, Xinxiang and Anyang, and several key cities. Overall, it presents a “double-core multi-center radial” network characteristic with these two cities as the cores. The central advantages of core cities should be utilized to integrate their ecological resources. Overall, cities in each region form different small groups according to their connectivity and functional positioning. Among them, the middle and lower reaches are relatively closely connected, mainly with “five core cities” as the radiation centers, with deep radiation and wide range. Due to factors such as geographical location and economic level, the upper reaches have fewer direct connections with core cities and need to use intermediary cities as bridges.
5 Conclusions and policy implications
5.1 Conclusions
This study employs Super-SBM model to measure and decompose the WEE of 99 cities in the YRB, and then uses kernel density estimation and Dagum Gini coefficient to analyze its distribution dynamic evolution law, spatial differences and sources. Finally, based on the SNA method, the spatial correlation network structure characteristics of WEE are described. The principal findings can be summarized as follows.
(1) Throughout the survey period, the overall WEE in the YRB and the upper, middle and lower reaches has improved, and has experienced three stages of “steady growth-fluctuation decline-rapid growth.” From the perspective of regional comparison, the WEE in the upper reach of the YRB is the highest, and the middle and lower reaches are relatively close. The overall spatial distribution pattern is “high in the west and low in the east.” From the perspective of the dynamic changes and decomposition indicators of WEE, the WEE in the YRB as a whole, upper, middle, and lower reaches have been improved, showing the stage characteristics of “steady growth-fluctuation decline-rapid growth,” and technological progress is the main driving force for WEE growth. From the perspective of city types, service-dominant cities demonstrate higher efficiency, industrial cities exhibit significant resource waste, while balanced-type cities face an imbalance between economic development and social welfare provision.
(2) From the perspective of dynamic evolution, the WEE of the whole YRB and the upper reaches are gradually concentrated to a high level, while the middle and lower reaches are on the contrary. Among them, the absolute difference of WEE in the whole basin and the middle reaches is expanding, while that in the upper and lower reaches is shrinking. The difference within the middle reach is the highest, and the difference between the middle and the lower reaches is the most significant. The hypervariable density and disparities within regions are the primary drivers of spatial variations in WEE within the YRB.
(3) The WEE in the YRB has broken through the geographical proximity effect and presented a complex and multi-threaded spatial correlation network structure. Since 2010–2022, the scale of the network in the YRB has been expanding, and the network agglomeration has been increasing. There is a general correlation effect between cities and changes in the WEE of some regions can lead to changes in the agglomeration of the entire network. However, the degree of closeness between cities is low, and there are more marginal cities. The overall correlation and stability of the network require enhancement.
(4) From the perspective of the evolution of urban roles, core cities exhibit a dual characteristic of “dual-core driven” and “ecological emergence” coexisting. The development pathway of bridge cities has shifted from traditional resource dependence to regional collaboration guided by policies. The number of peripheral cities has grown rapidly, and the issue of regional development imbalance has become increasingly prominent. From the perspective of small-group network structures, the upper reaches exhibit a “wheel - shaped” network structure with Longnan as the core; the middle reaches present a “chain-shaped” network structure with Yulin, Xi’an and Ankang as the three cores; the lower reaches show a “double-core multi-center radial” network structure with Heze and Zhengzhou as the cores. Overall, the middle and lower reaches are relatively closely connected, mainly taking “five core cities” as the radiation centers, with deep radiation and wide range. Due to factors such as geographical location and economic level, the upper reaches have relatively few direct connections with the middle and lower reaches and need to use intermediary cities as bridges.
5.2 Policy implications
This paper argues that to improve the WEE in the YRB and achieve high-quality development, it is necessary to proceed from a global perspective, and at the same time, it is necessary to classify and implement policies according to the advantages and characteristics of different regions. Drawing from the research findings, the subsequent recommendations are proposed:
(1) Measures should be tailored to local conditions and categorized accordingly to enhance regional WEE. The government should introduce region-specific preferential policies tailored to the unique conditions of each area. Specifically, the upper reaches, as an important water supply area and the central region of the ecological security strategy in China, should strengthen the economical and intensive use of water resources and ecological restoration and management, and enhance the self-regulation ability of the ecosystem. As the main energy production and supply base, the middle reaches should accelerate the industrial structure upgrading, limit the access of high-water consumption and low efficiency industries, give full play to the industrial agglomeration effect, and form a low-carbon development and green circulation pattern. As a key region for the construction of national innovation highlands, the lower reaches needs to accelerate the development of new productive forces, promote the research and development and application of green technologies, and build green industrial clusters.
(2) Efforts should be made to narrow the regional disparities and achieve the joint construction, sharing and co-governance of the ecological environment in the upper, middle and lower reaches. We should resolutely implement the “holistic approach” concept of the YRB and improve the regional coordinated development mechanism. We should promote the rational transfer of industries and technological exchanges, establish cross-regional industrial cooperation parks, and drive the in-depth integration of industrial chains in the upper and lower reaches. We should improve the basin-wide collaborative management mechanism, carry out water rights trading, carbon sink trading and pollution discharge rights trading in the basin, and realize the optimal allocation of ecological resources through market-based means. We should strengthen the inter-regional infrastructure interconnection and interoperability, accelerate the construction of the green transportation corridor in the YRB, and promote the cross-regional flow of talents, technologies and resources.
(3) The radiation effect of core cities should be leveraged to construct an efficient and interconnected network. Full play should be given to the leading role of core cities: Core cities (such as Xi’an, Heze, Zhengzhou, etc.) should leverage their advantages in technological innovation, industrial agglomeration, and ecological governance to radiate and drive the development of surrounding cities; intermediary cities (such as Taiyuan, Xinxiang, etc.) should strengthen their connections with core cities while providing technical support and resource matching services to peripheral cities; and peripheral cities (such as Yuncheng, Luliang, etc.) should enhance their ties with mid- and downstream core cities, and improve their own WEE by participating in regional cooperation.
(4) Green innovation should play a pivotal role in enhancing the WEE of the YRB. A green technology innovation fund for the YRB should be established to support universities, research institutions, and enterprises in conducting green technology research, with a focus on breaking through key technologies in the fields of water resource conservation, pollution treatment, and ecological restoration. The application of green technologies should be promoted, including water-saving irrigation technologies in agriculture, clean production technologies in industry, and smart environmental protection technologies in urban management. Additionally, a green technology cooperation platform for the YRB should be established to facilitate the sharing and transformation of technological achievements.
Data availability statement
The original contributions presented in the study are included in the article/supplementary material, further inquiries can be directed to the corresponding author.
Author contributions
MW: Conceptualization, Formal Analysis, Writing – review and editing. QZ: Data curation, Methodology, Writing – original draft. LL: Methodology, Supervision, Writing – review and editing.
Funding
The author(s) declare that financial support was received for the research and/or publication of this article. This work was supported by the National Social Science Fund of China (No. 22XTJ004), the Shaanxi Provincial Social Science Fund (2024ES08), and the Research Grant from Xi’an University of Technology for Graduate Students (105-252082401).
Conflict of interest
The authors declare that they have no known competing financial interests or personal relationships that could have appeared to influence the work reported in this paper.
Generative AI statement
The authors declare that no Generative AI was used in the creation of this manuscript.
Publisher’s note
All claims expressed in this article are solely those of the authors and do not necessarily represent those of their affiliated organizations, or those of the publisher, the editors and the reviewers. Any product that may be evaluated in this article, or claim that may be made by its manufacturer, is not guaranteed or endorsed by the publisher.
References
Chen, M. G., and Hou, Y. Y. (2024). Evolution of drivers of China’s economic growth: 2000-2019. Econ. Res. J. 59 (1), 53–71.
Chen, M. H., Yue, H. J., Hao, Y. F., and Liu, W. F. (2021). The spatial disparity, dynamic evolution and driving factors of ecological efficiency in the Yellow River Basin. J. Quant. Technol. Econ. 38 (09), 25–44. doi:10.13653/j.cnki.jqte.2021.01.002
Cui, S., Wang, Y., Zhu, Z., Zhu, Z., and Yu, C. (2022). The impact of heterogeneous environmental regulation on the energy eco-efficiency of China's energy-mineral cities. J. Clean. Prod. 350, 131553. doi:10.1016/j.jclepro.2022.131553
Du, Y. D., Liu, L., Wang, J. B., Bai, Y. P., Hui, W. J., Li, J. J., et al. (2023). Evaluation of community’s ecological efficiency in Beijing based on carbon emission constraint. Acta Ecol. Sin. 43 (2), 590–602. doi:10.5846/stxb202202170373
Feng, Y. J., Zhu, A. K., and Miao, C. H. (2023). Research on the impact of ecological compensation policy on air quality in the Yellow River Basin. Ecol. Econ. 39 (12), 206–213.
Gong, W. C. (2023). A study on the effects of natural resource abundance and foreign direct investment on regional eco - efficiency in China under the target of COP26. Resour. Policy 82, 103529. doi:10.1016/j.resourpol.2023.103529
Guo, L., Li, P., Zhang, J., Xiao, X., and Peng, H. (2022). Do socio-economic factors matter? A comprehensive evaluation of tourism eco-efficiency determinants in China based on the Geographical Detector Model. J. Environ. Manage. 320, 115812. doi:10.1016/j.jenvman.2022.115812
Hao, Z. J., Wen, Q., Shi, L. N., Wu, X. Y., and Ding, J. M. (2023). Spatial network analysis of coupling coordination between social economy and eco-environment in Yellow River Basin urban agglomerations. Econ. Geogr. 43 (12), 181–191. doi:10.15957/j.cnki.jjdl.2023.12.018
Jiang, R. R., Fei, L. J., and Kang, S. X. (2025). Analysis and prediction of urban agglomeration ecological footprint based on improved three - dimensional ecological footprint and shared socioeconomic pathways. Ecol. Indic. 170, 113079. doi:10.1016/j.ecolind.2025.113079
Lee, C. C., Wang, C. S., He, Z. W., Xing, W. W., and Wang, K. Y. (2023). How does green finance affect energy efficiency? The role of green technology innovation and energy structure. Renew. Energy 219 (1), 119417. doi:10.1016/j.renene.2023.119417
Li, D., and Yang, W. P. (2023). Evolution of China’s TFP for high-quality economic development: factor input intensification or output structure optimization. J. Quant. Technol. Econ. 40 (08), 46–68. doi:10.13653/j.cnki.jqte.20230627.004
Li, H. D., Ma, W. B., Zhang, L. J., Lv, Y. J., Liu, C. W., and Zhao, L. J. (2023). Synergistic governance of urban ecology and environment: from the perspectives of ecological resilience and synergistic efficiency. J. Ecol. Rural. Environ. 39 (8), 1096–1102. doi:10.19741/j.issn.1673-4831.2023.0194
Li, H. Y., Wang, Y., Zhang, H. W., Yin, R. M., Liu, C., Wang, Z. J., et al. (2024). The spatial-temporal evolution and driving mechanism of urban resilience in the Yellow River Basin cities. J. Clean. Prod. 447, 141614. doi:10.1016/j.jclepro.2024.141614
Li, M., and Long, K. S. (2021). Regional differences and threshold characters of the impact of energy use efficiency on energy scarcity in China. China J. Popul. Resour. Environ. 19 (3), 265–273. doi:10.1016/j.cjpre.2021.12.029
Li, Y. C. (2022). The measurement and evolution characteristics of spatial structure of urban innovation: the perspective of innovation activity distribution. Urban Plan. Forum 1, 74–80. doi:10.16361/j.upf.202201010
Liu, B. M., Zhang, A. L., and Xiong, Y. F. (2022). Spatial differences of urban land use ecological efficiency in the Yangtze River Economic Belt and its interactive spillover effects with industrial structure upgrading. China J. Popul. Resour. Environ. 32 (10), 125–139.
Liu, H. J., Liu, C. J., and Sun, Y. N. (2015). Spatial correlation network structure of energy consumption and its effect in China. China Ind. Econ. 5, 83–95. doi:10.19581/j.cnki.ciejournal.2015.05.008
Liu, H. M., Zhang, Z. X., Zhang, T., and Wang, L. Y. (2020). Revisiting China’s provincial energy efficiency and its influencing factors. Energy 208, 118361. doi:10.1016/j.energy.2020.118361
Liu, Q. Q., Dang, Y. X., Zhang, W. Z., and Wei, L. Y. (2021). Impact of PM2.5 pollution on urban residents’ happiness and willingness-to-pay: a case study of urban China. Sci. Geogr. Sin. 41 (12), 2096–2106. doi:10.13249/j.cnki.sgs.2021.12.003
Lv, J. H., Liu, X. T., Zhang, B., and Wang, X. H. (2020). Ecological efficiency and spatial effects of tourism industry in China. J. Northeast For. Univ. 48 (10), 49–54+60. doi:10.13759/j.cnki.dlxb.2020.10.009
Pan, J. (2023). Research on the coupling coordination between high-quality development and ecological protection of urban agglomerations in the Yellow River Basin. Sta. Decis. 39 (24), 113–117. doi:10.13546/j.cnki.tjyjc.2023.24.020
Pan, J. J., Hou, G. M., Gu, J. F., Zhang, H. F., Wang, J. P., and Chen, Z. W. (2023). Empirical study on the impact of technological progress on the environmental efficiency of China’s power industry: based on SBM super efficiency-ML-Tobit. China J. Manag. Sci. 31 (12), 215–227. doi:10.16381/j.cnki.issn1003-207x.2021.0883
Peng, B. H., Wang, Y. Y., and Wei, G. (2020). Energy eco-efficiency: is there any spatial correlation between different regions? Energy Policy 140, 111404. doi:10.1016/j.enpol.2020.111404
Quito, B., del Río-Rama, M., Álvarez-García, J., and Bekun, F. V. (2023). Spatiotemporal influencing factors of energy efficiency in 43 European countries: a spatial econometric analysis. Renew. Sust. Energy Rev. 182, 113340. doi:10.1016/j.rser.2023.113340
Ren, W. H., Xu, Y., and Weng, S. Q. (2025). How does industrial intelligence affect the ecological efficiency of China's mariculture industry? Empirical analysis based on panel data from coastal regions of China. Mar. Pollut. Bull. 212, 117513. doi:10.1016/j.marpolbul.2024.117513
Ren, X. C., Wang, S., and Wang, K.-H. (2024). The industrial technological spillover effect and differentiation characteristics of industrial chains in the ecological efficiency of the yellow river basin. J. Clean. Prod. 477, 143856. doi:10.1016/j.jclepro.2024.143856
Shao, H. Q., and Wang, Z. F. (2021). Spatial network structure of transportation carbon emission efficiency in China and its influencing factors. China J. Popul. Resour. Environ. 19 (4), 295–303. doi:10.1016/j.cjpre.2022.01.002
Sun, C. T., Fu, L. Y., Jiang, B., Wang, Y., and Zhu, Z. C. (2023). Distribution dynamics and regional differences of eco-efficiency development in China. Acta Ecol. Sin. 43 (04), 1366–1379. doi:10.5846/stxb202108022107
Tian, Z. G., and Mu, X. Z. (2024). Towards China's dual - carbon target: energy efficiency analysis of cities in the Yellow River Basin based on a “geography and high - quality development” heterogeneity framework. Energy 306, 132396. doi:10.1016/j.energy.2024.132396
Wang, F., Wu, M., and Du, X. Y. (2023a). Does industrial upgrading improve eco-efficiency? Evidence from China's industrial sector. Energy Econ. 124, 106774. doi:10.1016/j.eneco.2023.106774
Wang, G., Li, S. J., and Ma, Q. F. (2018). Spatial-temporal evolution of Chinese eco-efficiency from the perspective of human well-being. Sci. Geogr. Sin. 10, 1597–1606.
Wang, H. P., and Ge, Q. (2024). Ecological resilience of three major urban agglomerations in China from the “environment–society” coupling perspective. Ecol. Indic. 169, 112944. doi:10.1016/j.ecolind.2024.112944
Wang, R. N., Xiao, Y., Huang, H., and Chang, M. (2024). Exploring the complex relationship between industrial upgrading and energy eco - efficiency in river basin cities: a case study of the Yellow River Basin in China. Energy 312, 133498. doi:10.1016/j.energy.2024.133498
Wang, S. Y., and Shi, L. J. (2014). Determinants of well-being and their spatial differentiation in the Yangtze River Delta urban agglomeration. Urban Probl. 6, 12–16.
Wang, W. S., and Yang, Y. S. (2024). Spatial-temporal differentiation characteristics and driving factors of China’s energy eco-efficiency based on geographical detector model. J. Clean. Prod. 434, 140153. doi:10.1016/j.jclepro.2023.140153
Wen, G. H., Liu, M. B., Hu, X. H., and Zhao, J. (2022). Spatial correlation and spatial effect of cultivated land use ecological efficiency in the Dongting Lake Plain. Sci. Geogr. Sin. 42 (6), 1102–1112.
Wu, K., You, K. R., Ren, H., and Gan, L. (2022). The impact of industrial agglomeration on ecological efficiency: an empirical analysis based on 244 Chinese cities. Environ. Impact Asses. Rev. 96, 106841. doi:10.1016/j.eiar.2022.106841
Xie, W. W., Hu, B. Q., and Zhang, L. L. (2024). Coupling relation between ecosystem services and people's well-being from the perspective of human-land symbiosis and simulation prediction: a case study of southwestern Guangxi Karst-Beibu Gulf. J. Environ. Eng. Technol. 14 (02), 583–591.
Xu, J. J., Wang, H. J., and Tang, K. (2022). The sustainability of industrial structure on green eco-efficiency in the Yellow River Basin. Econ. Anal. Policy 74, 775–788. doi:10.1016/j.eap.2022.04.002
Yang, W. P., and Li, D. (2020). Study on the regional differences and spatial convergence of ecological total factor productivity in China. J. Quant. Technol. Econ. 37 (09), 80–99.
Yi, R., Chen, Y., and Chen, A. (2025). Evaluating urban climate resilience in the Yangtze River Delta urban agglomeration: a novel method integrating the DPSIR model and Sustainable Development Goals. J. Environ. Manag. 376, 124517. doi:10.1016/j.jenvman.2025.124517
Yu, W., Zhang, P., and Ji, Z. H. (2021). Study on regional difference, distribution dynamics and convergence of eco-efficiency of urban clusters in China. J. Quant. Technol. Econ. 38 (1), 23–42.
Zhang, C. Q., and Chen, P. Y. (2022). Applying the three-stage SBM-DEA model to evaluate energy efficiency and impact factors in RCEP countries. Energy 241, 122917. doi:10.1016/j.energy.2021.122917
Zhang, X. X., Zhong, W., and Hong, Y. M. (2018). Analysis of influential factors of civil happiness in China: based on LASSO screening method. Stat. Res. 35 (11), 3–13.
Zhang, Y., Cai, X., Jiao, L., Mao, Y., Huo, X., and Wu, Y. (2024). Using eco-efficiency and eco-wellbeing performance as indicators for urban sustainable development: a two-stage network analysis. Sustain. Dev. 32 (3), 1825–1844. doi:10.1002/sd.2750
Zhang, Y., Mao, Y., Jiao, L., Shuai, C., and Zhang, H. (2021). Eco-efficiency, eco-technology innovation and eco-well-being performance to improve global sustainable development. Environ. Impact Asses. 89, 106580. doi:10.1016/j.eiar.2021.106580
Zhao, H. B., Gu, T. X., Sun, D. Q., and Miao, C. Q. (2023). Dynamic evolution and influencing mechanism of urban human settlements in the Yellow River Basin from the perspective of “production-living-ecological” function. Acta Geogr. Sin. 78 (12), 2973–2999.
Zhao, Y., Zhou, R. J. M., Yu, Q., and Zhao, L. (2025). Revealing the contribution of mountain ecosystem services research to sustainable development goals: a systematic and grounded theory driven review. J. Environ. Manag. 373, 123452. doi:10.1016/j.jenvman.2024.123452
Keywords: Yellow River Basin, wellbeing eco-efficiency, dynamic spatiotemporal evolution, network structure characteristics, small group network characteristics
Citation: Wang M, Zheng Q and Liu L (2025) Dynamic evolution and network structure characteristics of the wellbeing eco-efficiency of cities in the Yellow River Basin, China. Front. Environ. Sci. 13:1565441. doi: 10.3389/fenvs.2025.1565441
Received: 24 January 2025; Accepted: 08 April 2025;
Published: 22 April 2025.
Edited by:
Yaohui Liu, Shandong Jianzhu University, ChinaReviewed by:
Guo Zhengquan, North China University of Technology, ChinaWeifeng Gong, Qufu Normal University, China
Chuanhui Wang, Qufu Normal University, China
Yanbin Chen, Shandong Normal University, China
Copyright © 2025 Wang, Zheng and Liu. This is an open-access article distributed under the terms of the Creative Commons Attribution License (CC BY). The use, distribution or reproduction in other forums is permitted, provided the original author(s) and the copyright owner(s) are credited and that the original publication in this journal is cited, in accordance with accepted academic practice. No use, distribution or reproduction is permitted which does not comply with these terms.
*Correspondence: Meixia Wang, d2FuZ214QHhhdXQuZWR1LmNu