 Weifang Song
 Hao Zhang*
- School of Economics and Management, Huaibei Normal University, Huaibei, China
The international community has increasingly focused on reducing carbon emissions. The transportation sector is one of the key areas of carbon emissions in China. This study uses the superefficiency EBM-DEA model considering undesirable outputs to estimate the transportation sector carbon dioxide emission efficiency (TSCDEE) for 30 provinces in China from 2012 to 2022. The Tobit model is used to analyze the influencing factors of TSCDEE and the heterogeneous characteristics of the influencing factors across regions. The results indicate that the mean value of efficiency in Chinese provinces is 0.709. The overall TSCDEE in China shows a fluctuating upward trend, with the carbon emission efficiency higher in coastal areas but lower in the Southwest and Northeast. This study shows that factors such as freight turnover level, transportation infrastructure level, and technological progress have significant positive impacts on TSCDEE. In contrast, population mobility has a significant negative effect on TSCDEE. Based on the above results, this study proposes specific measures such as optimizing travel modes, improving infrastructure construction, increasing freight turnover, and promoting technological progress. This study also considers the differences between eight regions and offers targeted suggestions. These findings provide a reference for achieving green and low-carbon development in the transportation sector.
1 Introduction
Climate warming is the great global challenge of today. The transportation sector is one of the main sources of energy consumption and also one of the key sectors influencing a country’s economic growth (Oladunni et al., 2024). The transportation sector is one of the three major emission sectors globally (Liu et al., 2022). To achieve carbon peaking and carbon neutrality goals proposed by China in 2020, carbon emissions reduction in the transportation sector cannot be ignored. With the rapid development of the economy in China, the carbon emissions generated in the transportation sector are rising at a faster rate. Now, carbon emissions from the transportation sector account for 10.4% of the total in China (Wen, 2021). Compared to other sectors, carbon emissions from the transportation sector have the following characteristics: firstly, they have a high share of direct emissions, mainly from the combustion of fossil fuels (Li et al., 2024). Secondly, they are growing at a faster speed. In recent years, the average annual growth rate of carbon emissions in the transportation sector has remained above 5%, making the transportation sector one of the fastest-growing areas of greenhouse gas emissions. Thirdly, the growth of demand and emissions in the transportation sector is more rigid, making it more difficult to reduce emissions. The above characteristics indicate that the transportation sector faces many challenges in carbon emissions reduction. Therefore, it is essential to enhance TSCDEE to promote the green transformation of transportation and realize the high-quality development in the transportation sector (Said and Dindar, 2024).
Currently, there are still insufficient studies on the measurement of carbon emission efficiency and the analysis of influencing factors in China’s transportation sector. This study enriches the existing research methods by using the superefficiency EBM-DEA model to measure TSCDEE. Meanwhile, this study innovatively considers the influence of freight turnover level and population mobility on TSCDEE, which fills the research gaps in the related field. Through deeply analyzing the intrinsic connection between the influencing factors and TSCDEE, we can well understand how these factors affect the carbon emission efficiency in the transportation sector, so as to provide a scientific basis for policymakers and promote the high-quality development of the transportation industry. Specifically, the main arrangements of this study are as follows:
Firstly, we measure the TSCDEE of 30 provinces in China and analyze the spatiotemporal evolution characteristics of TSCDEE. Subsequently, the influencing factors of TSCDEE are recognized, and the heterogeneity of the influencing factors in eight regions is also analyzed. Finally, the corresponding policy recommendations are put forward.
2 Literature review
It is important to adopt a suitable methodology to evaluate TSCDEE. This will help the government to formulate targeted policies and promote the sustainable development of the transportation sector. Existing studies employed some methods to measure carbon emissions and efficiency in the transportation sector. Li et al. (2025) utilized a composite assessment framework, namely the extended STIRPAT model and the STIRPAT-SD model, combined with scenario analysis methods, to comprehensively evaluate urban passenger transport carbon emissions. Li et al. (2021a) used the triple exponential smoothing model and improved gray model to forecast urban transport carbon dioxide emissions from 2011 to 2017. Montoya-Torres et al. (2023) predicted carbon emissions from private transport systems using Life Cycle Assessment (LCA) method. Irfan et al. (2024) employed the panel stochastic frontier approach (SFA) to estimate the energy efficiency of different transport modes in India from 2000 to 2014. In addition to the methods mentioned above, the data envelopment analysis (DEA) method is normally used to measure TSCDEE, which evaluates the relative efficiency of decision-making units (DMUs) with multiple inputs and outputs without requiring a predefined form of the production function. DEA models are mainly categorized into radial DEA and non-radial DEA. Radial DEA models assume that all DMUs change along the same proportions. Non-radial DEA models, such as SBM-DEA model, consider the complex relationship between inputs and outputs and permit trade-offs in different dimensions. Currently, there are more studies applying the SBM model to evaluate the efficiency of the transportation industry. Jiang and Li. (2022) measured the total factor carbon emission efficiency in China’s transportation industry. Zhang et al. (2022) evaluated the operational and energy efficiency of urban rail transit in China. Hussain et al. (2023) evaluated the efficiency of sustainable transportation in 35 OECD countries. Qian et al. (2021) estimated the efficiency of provincial freight system in China. Considering carbon dioxide emissions as an undesirable output and applying the SBM-DEA model, Liu et al. (2024) evaluated the efficiency of China’s transportation system. Domagala and Kadlubek. (2023) comprehensively evaluated the economic, energy, and environmental efficiency of the 27-road freight transport sector in EU countries in 2019. The EBM model was proposed in 2010, combining the characteristics of radial and non-radial DEA models. Some studies measure transportation carbon emission efficiency using the EBM-DEA model. Zhao et al. (2022) estimated the TSCDEE using the EBM-DEA model with undesirable outputs. Du et al. (2021) estimated transportation carbon efficiency across the Belt and Road Initiative countries during 2005–2017 using a three-stage EBM model. Li (2023) applied the improved three-stage EBM-DEA model to measure the logistics efficiency of provinces in China. Wang and Wang. (2024) evaluated the ecological efficiency of 20 international transportation hubs in China using the superefficiency EBM model.
In terms of influencing factors, Zhang et al. (2024) indicated that dynamic traffic distribution significantly affects traffic carbon emissions using Monte Carlo method. Wu et al. (2023) revealed the spatial and temporal heterogeneity of built environment elements on transportation carbon emissions using a geographically and temporally weighted regression (GTWR) model. Tang et al. (2023) concluded that demographic, economic, and technological factors are the determinants of transportation carbon emissions using the least absolute shrinkage and selection operator (LASSO) regression. Zhang et al. (2023) found that the city size and structure, economic development and industrial structure, road transportation facilities construction, public service facilities construction, and other governance elements play decisive roles in transportation carbon emissions based on the random forest model. Li et al. (2021b) discovered that city size has a positive correlation effect on energy use efficiency and that the population size is negatively correlated with the efficiency of carbon emissions using the panel data model. Zhao et al. (2022) found that factors such as transportation structure, transportation infrastructure level, and technology significantly positively affect TSCDEE, while urbanization level and urban population density both significantly negatively affect TSCDEE based on the spatial Durbin Model. Lv et al. (2023) found that government intervention, energy structure, GDP per capita, energy use efficiency, population size, and technological level influence the carbon emissions efficiency from transportation using the GTWR model.
The above literature indicates that numerous comprehensive studies have been conducted on the measurement and influencing factors of TSCDEE. However, there is still room for further improvement based on existing research. (1) In terms of research methodology, the superefficiency EBM model considering carbon emissions as undesirable outputs is seldom applied to the measurement of TSCDEE, and to further analyze the spatiotemporal evolution characteristics of TSCDEE. (2) Regarding influencing factors, freight turnover level and population mobility factors are often neglected. Therefore, it is necessary to further analyze the impact of these two factors on TSCDEE. (3) It is crucial to consider the heterogeneous effects of the influencing factors on different economic zones to provide targeted policy recommendations.
The main contributions of this study are as follows: (1) To enhance the TSCDEE measurement technique, the TSCDEE of 30 Chinese provinces is measured using the superefficiency EBM-DEA model, which considers undesirable outputs. The spatiotemporal evolution characteristics of the TSCDEE are then examined using the ArcGIS software. (2) Considering the key influencing factors of freight turnover level and population mobility, the Tobit model is established to conduct further empirical research. The impacts of other influencing factors on TSCDEE are also investigated to provide practical guidance for promoting the green and low-carbon development of the transportation sector. (3) Through empirical analysis of different regions, this study reveals the differences in the role of influencing factors in different economic zones, to provide a scientific basis for the formulation of differentiated policies.
3 Methodology
3.1 Superefficiency EBM-DEA model considering undesirable outputs
3.1.1 The principle of the superefficiency EBM-DEA model
Previous studies have used DEA models to measure transportation carbon emission efficiency, which provides a beneficial reference for measuring TSCDEE in this study. However, these models have some drawbacks. Generally, traditional DEA models have two common methods, namely radial and non-radial model. Radial DEA models, such as the CCR model and the BBC model, assume that all inputs and outputs are adjusted in the same proportion, do not take into account the effects of non-radial slack variables and do not allow for factor decomposition when evaluating efficiency, which can result in biased measurements. Non-radial DEA models, such as the SBM-DEA model, where the slack variables are not necessarily proportional to inputs or outputs, and the DMUs lose proportionality in the original inputs or outputs (Zeng et al., 2019). The EBM-DEA model adopted in this study considers both radial and non-radial information, which can evaluate TSCDEE accurately.
Under constant returns to scale, the EBM-DEA model is shown in Equation 1:
where
Although the EBM-DEA model has made improvements, there are still issues that must be solved to make it more realistic. The model ignores undesirable outputs and may be biased in evaluating efficiency. Ren et al. (2020) proposed an improved EBM model to measure eco-efficiency in China, which achieves the combination of radial and non-radial DEA models and considers undesirable outputs. The EBM model considering undesirable outputs is shown in Equation 2:
where
3.1.2 Input-output indicators
Based on previous studies results (Zeng et al., 2023; Zhao et al., 2022; Zhao et al., 2024), this study chooses the capital stock, labor, and energy consumption of the transportation sector as three input indicators. The value added by the transportation sector is a desired output. The CO2 emissions of the transportation sector is an undesired output (Table 1). Descriptive statistics of the input and output variables are provided in Table 2. The median values of all variables are less than the mean values. The standard deviations of all variables are large, which indicates that the data distribution is relatively dispersed. In addition, significant differences exist between the maximum and minimum values. These descriptive results indicate that significant TSCDEE differences may exist among different provinces. The transportation sector in this study includes the transportation, storage, and postal service industries (Wang and He, 2017).
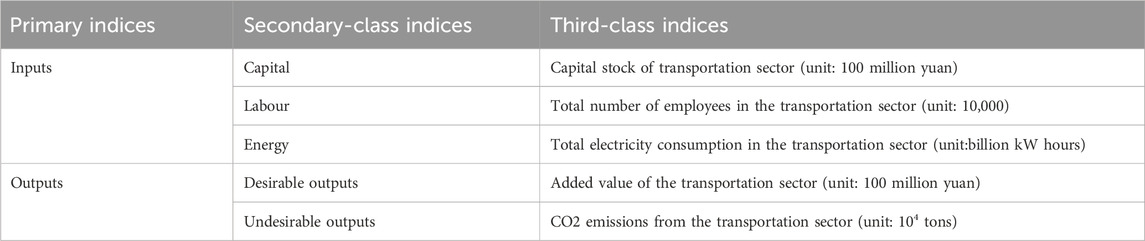
Table 1. Meaning of the input‒output variables.
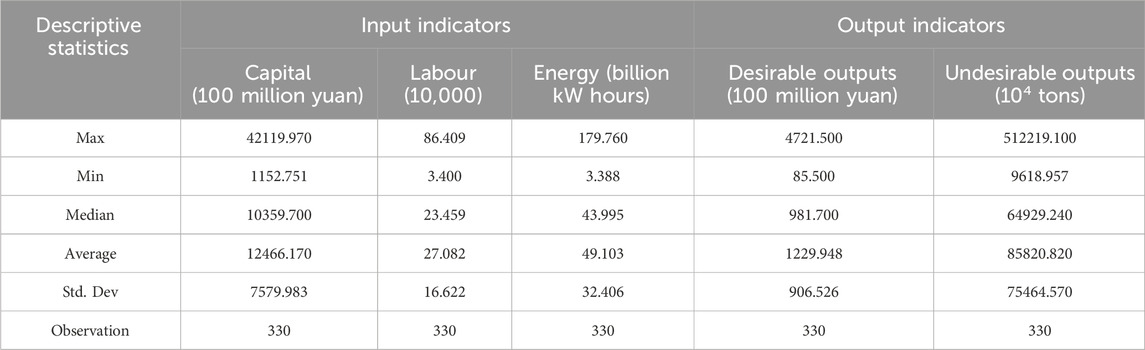
Table 2. Descriptive statistics of the input and output variables.
The Chinese government does not publish capital stock data on the transportation sector. This study uses the perpetual inventory method to calculate the capital stock as follows:
National Bureau of Statistics of China (NBSC) has not publish data on carbon emissions in the transportation sector, so they are needed to calculate. This study refers to the method in the Intergovernmental Panel on Climate Change (IPCC) guidelines and selects eight energy sources: raw coal, gasoline, kerosene, diesel oil, fuel oil, LPG, natural gas, and other gas (Guan et al., 2021; Liu et al., 2024; IPCC, 2006). Data are obtained from the China Energy Statistical Yearbook (CESY). The calculation formula is shown in Equation 3:
where
3.2 Tobit model
3.2.1 The principle of the tobit model
Tobin (1958) proposed the Tobit linear regression model for dealing with situations where the dependent variable is truncated. When truncated data are present, the Tobit model can deal with continuous variables restricted to specific intervals. Compared to the OLS, the Tobit model provides unbiased estimation results and ensures consistency in parameter estimation. The dependent variable in this study is the truncated efficiency value between 0 and 1.1 obtained from the superefficiency EBM-DEA model, which is suitable for the Tobit model. Therefore, the Tobit model is chosen in this study for analyzing the impact of influencing factors on TSCDEE. It is shown in Equation 4:
where
3.2.2 Influencing factors variables
Considering the availability and consistency of the data, this study focuses on analyzing the influencing factors of TSCDEE from four aspects: economy, population, infrastructure, and technology. Based on existing studies, this study selects population mobility (PM), freight turnover level (FTL), technological progress (TP), and transportation infrastructure level (TIL) as independent variables (Table 3).
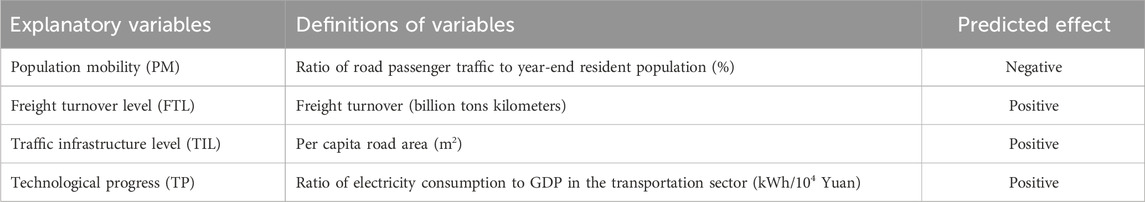
Table 3. Meaning of the influencing variables.
3.2.2.1 Population mobility (PM)
Existing studies show that energy consumption in the transportation sector is one of the major sources of carbon emissions. Energy consumption increases carbon emissions and thus reduces TSCDEE (Tang et al., 2023). Population mobility and regional development are interactive processes. Under the current unbalanced regional development and population distribution in China, a large number of people migrate between different regions every year (Fang et al., 2021). According to the study on the impact of urban transportation travel modes on energy and the environment, population mobility is one of the main drivers of urban transportation demand, which leads to an increase in transportation demand. With the increase in population mobility, the demand for road passenger transportation services also rises. Then it is directly reflected in the volume of road passenger traffic. It is necessary to optimize and adjust the transport structure according to the Chinese Ministry of Ecology and Environment. Specifically, it is important to promote the conversion of roads to railroads and roads to waterways for the transportation of bulk and medium-long distance goods (The State Council, 2018). This reflects that road transportation is the main source of carbon emissions in the transportation industry, and its carbon emission intensity ranks high among all modes of transportation. Since road transportation mainly relies on fossil fuels, the increase in this energy consumption will reduce TSCDEE. This study applies the ratio of road passenger transport volume to the year-end resident population to measure population mobility (Fang et al., 2023).
Hypothesis 1. Population mobility will reduce TSCDEE.
3.2.2.2 Freight turnover level (FTL)
There is an interactive causal relationship between regional freight turnover and GDP, which is important for coordinating the balance between freight transportation and regional economic development. Economic development is usually accompanied by an increased demand for the movement of goods and services, which directly contributes to higher freight turnover levels. With economic activity expanding, the demand for transportation and freight turnover also increase. Freight turnover is a key indicator of the development in the transportation sector and is closely related to economic development. The increased freight turnover can satisfy the logistics needs of regional development and promote regional economic development (Ma et al., 2020). In summary, freight turnover has a positive effect on economic development. The improvement of the economic development level is conducive to optimizing energy consumption structure and industrial structure. This contributes to the creation of a clean and effective traffic management system and traffic carbon emissions reduction. In this study, the product of the weight of the freight and the distance transported is used to represent the freight turnover level.
Hypothesis 2. High freight turnover will promote TSCDEE.
3.2.2.3 Traffic infrastructure level (TIL)
A high-quality transportation infrastructure system plays a significant role in reducing energy consumption and curbing carbon emissions. The transportation infrastructure level can be reflected through the transportation road resources allocation, including the rational layout of the transportation network and the alleviation of traffic congestion. Some studies have shown that the expansion of per capita road area and the optimization of the transportation network can effectively reduce traffic congestion and improve the overall operational efficiency of the transportation system. Per capita road area is used to represent the traffic infrastructure level in this study (Zhao et al., 2022).
Hypothesis 3. The improvement of transportation infrastructure will enhance TSCDEE.
3.2.2.4 Technological progress (TP)
Technological progress is a key driver for CO2 emissions reduction. Energy intensity is the amount of energy consumed per unit of GDP. Low energy intensity represents less energy consumption for the same economic output, which helps to reduce greenhouse gas emissions and improve TSCDEE. Technological progress can improve energy efficiency, reduce energy intensity, and decrease carbon emissions from the transportation sector (Oladunni and Olanrewaju, 2022). This study uses the ratio of electricity consumption to value added in the transportation sector to represent energy intensity.
Hypothesis 4. Technological progress will increase TSCDEE.
3.3 Research area and data sources
Considering the availability of data, this study selects the panel data of 30 provinces in China (excluding Tibet) as the research object, with a sample interval of 2012–2022. Based on the Research Report of the State Council, these Chinese provinces are divided into eight economic zones (Zhao et al., 2019). These are the Northern coast (Beijing, Tianjin, Hebei, Shandong), the Eastern coast (Shanghai, Jiangsu, Zhejiang), the Southern coast (Fujian, Guangdong, Hainan), the Northeast (Liaoning, Jilin, Heilongjiang), the Middle Yellow River (Shanxi, Inner Mongolia, Henan, Shaanxi), the Middle Yangtze River (Jiangxi, Anhui, Hubei, Hunan), the Southwest (Guangxi, Chongqing, Sichuan, Guizhou, Yunnan) and the Northwest (Gansu, Qinghai, Ningxia, Xinjiang).
Data on fixed capital investment, employment, and GDP in the transportation sector are obtained from CSY. Date on electricity consumption in the transportation sector are taken from CESY. The data for the independent variables are obtained from CSY, CESY, and provincial statistical Yearbook.
4 Results
With the use of MaxDEA 12.1 software, the TSCDEEs of 30 provinces in China between 2012 and 2022 are calculated as seen in Table 4. The spatiotemporal evolution maps for TSCDEE levels in 2012, 2017 and 2022 are drawn using ArcGIS 10.8 software.
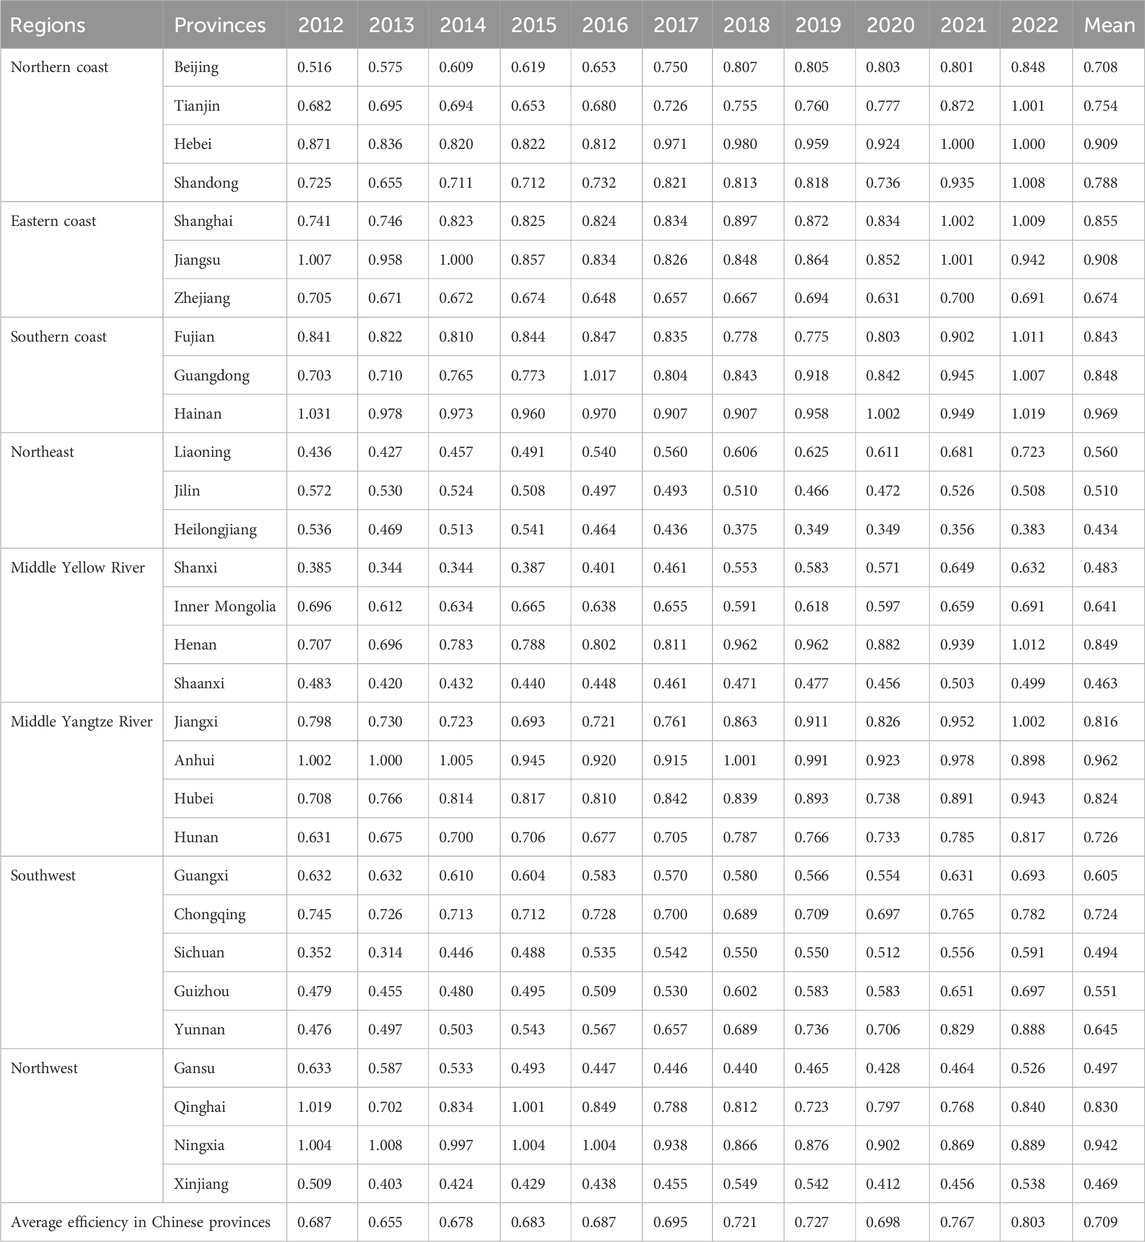
Table 4. The values of TSCDEE for 30 provinces in China (2012–2022).
4.1 Efficiency evaluation analysis
4.1.1 Overall analysis
During the 2012–2022 period, the TSCDEE in China generally increases, but the overall efficiency remains low. As seen in Figure 1, the efficiency reaches 0.687 in 2012, 0.695 in 2017, and 0.803 in 2022. The mean value of efficiency in Chinese provinces is 0.709, which indicates that TSCDEE in China has much room for improvement.
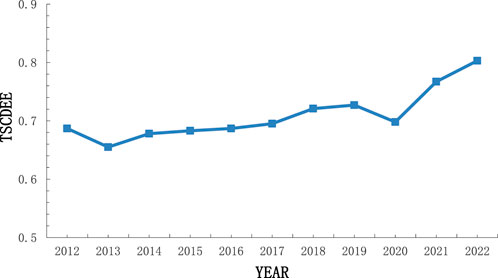
Figure 1. The evolutionary trend of TSCDEE value in China (2012–2022).
The overall TSCDEE in China shows a fluctuating upward trend. This indicates that with the development of society and technological advances, the transportation sector is gradually realizing green and sustainable development. Notably, the national average TSCDEE in 2020 shows a downward trend, which is likely due to the outbreak of the COVID-19 pandemic in January 2020. The pandemic has led to a decrease in labor participation due to labor casualties and the control of population movement and concentration. This epidemic leads to labor shortages and a significant drop in demand in the transportation sector, which affects the capital accumulation and GDP contribution of the transportation sector (Tan et al., 2022). Although the decrease in energy consumption and CO2 emissions during the epidemic (Zhang et al., 2021), the significant reduction in GDP in the transportation sector results in a relative increase in energy consumption and CO2 emissions per unit of GDP. Ultimately, the efficiency reduces. The Chinese government proposed carbon peaking and carbon neutrality goals in September 2020. The Ministry of Transport issued a Green Transport Development Plan for the 14th Five-Year Plan in 2021. Subsequently, local governments should actively implement this policy. They can optimize the transport structure, build green transport infrastructure, and construct a low-carbon transport system, which has led to a more significant increase in TSCDEE after 2020.
4.1.2 Regional analysis
With the analysis of the 11-year average efficiency values of the eight regions, as seen in Table 5, it can be seen that the Southern coast has the highest efficiency value, followed by the Middle Yangtze River, the Eastern coast, the Northern coast, the Northwest, the Middle Yellow River, the Southwest, and the Northeast. Over time, these regions show the same change trend as the national efficiency values. The reasons are as follows:
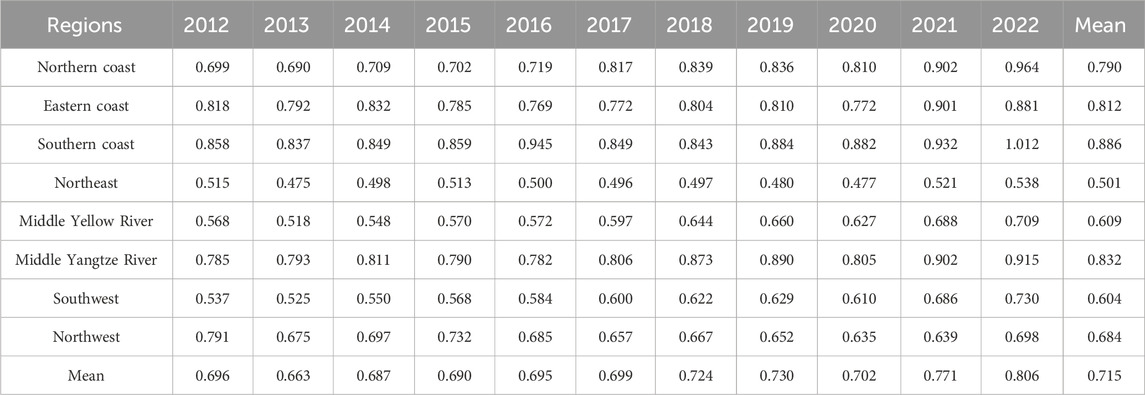
Table 5. TSCDEE values for eight Chinese regions (2012–2022).
(1) Coastal regions have a relatively developed transportation industry due to location advantages and the first-mover advantage of reform and opening. These areas have advanced industrial structures and levels of industrial agglomeration, which can improve energy utilization efficiency and TSCDEE. For example, Beijing promotes integrated railway and transportation systems. Guangdong shifts to electric buses. Owing to their geographical location, coastal provinces have a high level of opening up to the outside world. They can attract more foreign investment and technology. Their management concepts and energy-saving and emission-reduction technologies are advanced. Coastal provinces have achieved great results in promoting green transformation and low-carbon development. For example, Beijing has promoted the “integration of the two networks” of rail and transit to enhance the overall efficiency of the public transportation system and the travel experience of passengers. Yancheng has become the first “city of 10 million kilowatts of new energy power generation” in the Yangtze River Delta region, actively promoting the construction of a zero-carbon industrial park. The electrification rate of buses in Guangdong Province reaches 98.88%, and the scale of the new energy operating vehicles and vessels ranks first in China.
(2) The TSCDEE in the Middle Yangtze River, the Middle Yellow River, and the Northwest are closer to that in the coastal regions. The Middle Yangtze River and Middle Yellow River regions have rich natural resources and population advantages. Industrial factor endowments allow them to develop new quality productivity according to local conditions. Their industrial structure is constantly optimized and adjusted, and the transportation infrastructure is continuously improved. Therefore, the TSCDEE in these two regions closely follows that in the coastal regions. The Northwest has a huge potential for wind power generation, which can reduce greenhouse gas emissions and strengthen the use of clean energy.
(3) Because of their geographic limitations, the Southwest and the Northeast have difficulties in absorbing advanced technologies. And following the reform and opening, many people moved to the coastal provinces, causing a serious brain drain in the two regions, which has affected the technological progress of the local transportation industry. Furthermore, these two regions also face greater challenges in attracting foreign investment and high-tech enterprises, which restricts their TSCDEE level.
4.1.3 Provincial-level analysis
The annual average TSCDEE of 30 provinces can be divided into four intervals, and the 30 provinces can be divided into four spatial regions, including the high TSCDEE (>0.85), relatively high TSCDEE (0.674–0.849), medium TSCDEE (0.51–0.645), and low TSCDEE (<0.5). (1) For Hebei, Anhui, Jiangsu, Ningxia, Hainan, and Shanghai, TSCDEEs are greater than 0.85. Notably, Ningxia is a western province with a high efficiency value. The reasons are that Ningxia has conditions for the large-scale development of renewable energy and is rich in wind and solar energy resources. As a result, Ningxia has a greater TSCDEE than other western provinces. (2) For Beijing, Tianjin, Shandong, Zhejiang, Chongqing, Hunan, Henan, Hubei, Jiangxi, Fujian, Guangdong, and Qinghai, TSCDEEs range from 0.674 to 0.849 and belong to a relatively high category. (3) For Jilin, Liaoning, Guizhou, Inner Mongolia, Yunnan, and Guangxi, TSCDEEs range from 0.51 to 0.645, which are all in the medium TSCDEE level region. (4) Heilongjiang, Shanxi, Shaanxi, Gansu, Sichuan, and Xinjiang are all in the low TSCDEE level region (<0.5).
The spatiotemporal evolution trend of provincial TSCDEE in major years is shown in Figure 2. Trend analysis shows that: (1) Hebei, Shanghai, and Hainan have consistently maintained the highest efficiency values, indicating that coastal provinces have notable advantages in TSCDEE. This may be related to the economic development level, the improvement of transportation infrastructure, and the large investment in environmental protection technology. (2) Beijing, Tianjin, Shanxi, Liaoning, Henan, Guangdong, Sichuan, Guizhou, and Yunnan show an overall increasing trend in efficiency, indicating that these provinces are gradually improving TSCDEE. (3) Heilongjiang, Gansu, Qinghai, and Ningxia show a decreasing trend in TSCDEE, which may be related to the irrational allocation of transportation resources. (4) The TSCDEE of the remaining provinces shows the same trend as the change of the country, with fluctuating upward and downward trends.
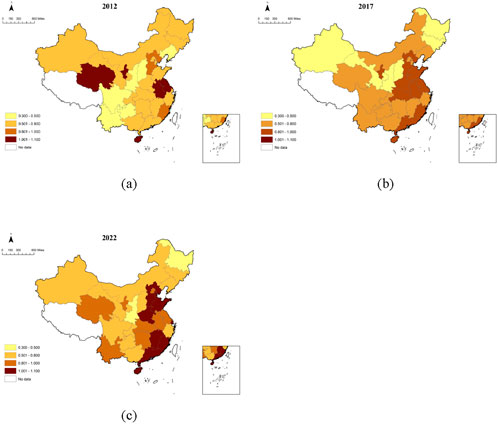
Figure 2. Provincial TSCDEE in 2012, 2017, and 2022. (a) Provincial TSCDEE in 2012 (b) provincial TSCDEE in 2017 (c) provincial TSCDEE in 2022.
4.2 Influencing factors analysis for TSCDEE
4.2.1 Hausman test
Before conducting the regression analysis, the Hausman Test is used with Stata 18.0 software to determine the form of the panel data model in this study. The null hypothesis (Ho) of the Hausman Test is that a random effects model is more appropriate, and if the Ho can be rejected at the significance level, it means that fixed effects are more appropriate. Conversely, a random effects model is used.
In this study, the parameters of the fixed and random effects models are first estimated using ordinary least squares (OLS). The p-value of the test result is 0.4874, which is not significant at the commonly used significance levels (1%, 5%, 10%) and therefore the null hypothesis cannot be rejected. Thus, the random effects model is chosen for the subsequent Tobit regression analysis.
4.2.2 Regression result analysis
In this study, the Tobit random effects model is estimated using Stata 18.0 software to assess the factors affecting TSCDEE in China. The regression results are presented in Table 6. Results show that the regression coefficient of PM is −0.503, significant at a 1% level. The regression coefficient of lnFTL is 0.035, significant at a 10% level. The regression coefficient of lnTIL is 0.172, significant at a 1% level. The regression coefficient of lnTP is −0.323, also significant at a 1% level. Through coefficient analysis, it is found that the freight turnover level, the transportation infrastructure level, and technological progress have significant positive effects on TSCDEE, while population mobility has a significant negative impact on TSCDEE. The results are consistent with the previous hypothesis.
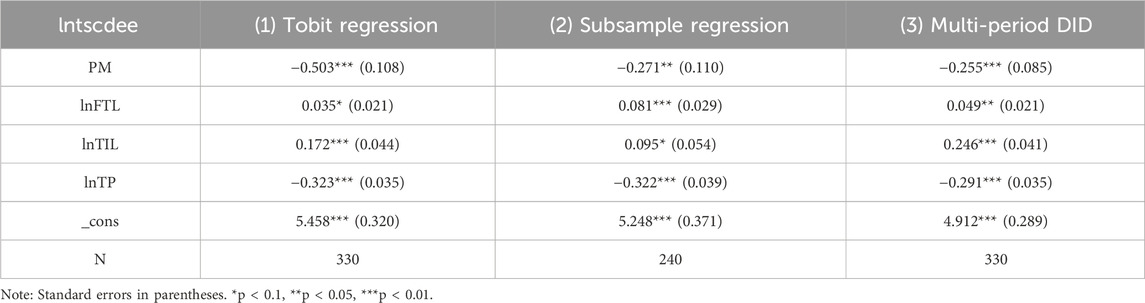
Table 6. Tobit regression results.
4.2.3 Robustness analysis
4.2.3.1 Subsample regression
Considering that time trends or other external factors may impact the results of the study. This study adopts the strategy of excluding part of the sample when conducting the robustness test. Specifically, we exclude the last 3 years of data adopted by the Tobit regression analysis based on this subsample. The results are seen in Table 6, which show that the coefficients and significance are unchanged, proving the robustness of the baseline regression.
4.2.3.2 Endogenous test
This study constructs a multiperiod difference-in-difference (DID) model for endogenous test. The concept is as follows: the samples are divided into two groups, experimental and control, according to the level of population mobility. Then take its mean as the dividing line; those above the sample mean are set as the experimental group, and those below the mean are set as the control group. The regression results are shown in Table 6, and the conclusion remains valid.
4.3 Heterogeneity analysis of influencing factors
For the heterogeneity analysis, this study considers the possible impact of the COVID-19 epidemic on the economic development of the regions, especially in the transportation sector. To ensure the accuracy and reliability of the results, this study excludes data from the year 2020 in conducting the analysis. The results of the heterogeneous regression are shown in Table 7.
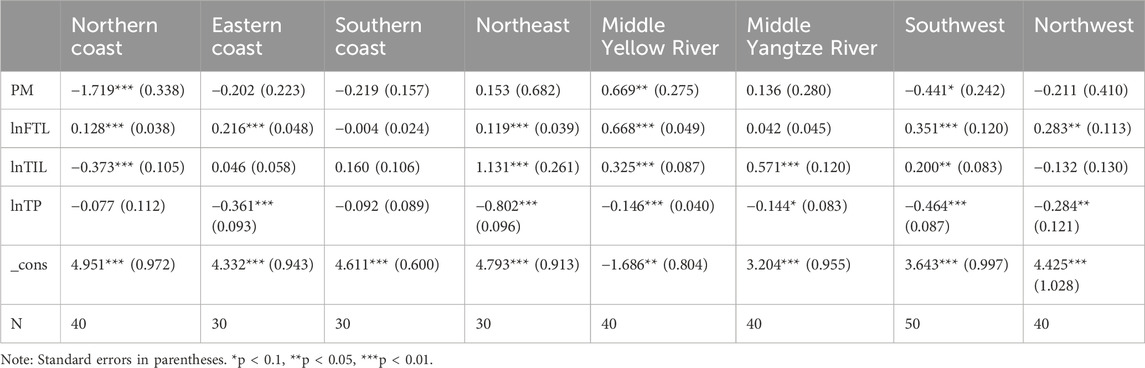
Table 7. Heterogeneity analysis results for the factors influencing TSCDEE in eight Chinese regions.
(1) Population mobility has a significant negative impact on the TSCDEE in the Northern coast and Southwest, while it shows a significant positive impact in the Middle Yellow River. This result is related to the stage of urbanization, economic development level, and industrial structure of each region. There is slow urbanization process, backward economic development, and high population outflow in the Southwest. The loss of talent in the Southwest is detrimental to the optimization and upgrading of industrial structure, such as the transition to higher value-added and more environmentally friendly industries, which reduces TSCDEE. Urbanization in the Middle Yellow River is in a high-speed development stage. It can utilize the benefits of resource endowment and continuously optimize the industrial structure in the development. With the population inflow, professional and technical talents increase and bring more advanced energy-saving and emission-reduction technologies, then improve TSCDEE. A comparative analysis of the coefficients reveals that population mobility has a most significant negative impact on the Northern coast. The reasons are that Beijing, as the capital of China, is also the center of politics, economy, and culture, attracting a large number of migrant and skilled workers; Tianjin is a megacity with a huge population size; The transportation network extends in all directions in Hebei, and Hebei is an important transportation hub connecting population flows in North China, Northeast, and Northwest; Shandong is a large population province in China. The improvement of TSCDEE in the Northern coast is hindered by the growing population, the pressure on transportation demand, and the increase in energy consumption. Therefore, for the Northern coast, it is necessary to optimize residents’ transportation methods, alleviate traffic congestion, and promote green travel or shared transportation modes to reduce energy consumption.
(2) The freight turnover level has a significant positive impact on TSCDEE in the Northern coast, Eastern coast, Northeast, Middle Yellow River, Southwest, and Northwest regions. This is because the improvement in the freight turnover level reflects an increase in the volume of freight turnover, which is conducive to the promotion of advanced transportation equipment and the introduction of cutting-edge technology. This will increase the investment in transportation facilities, improve the economic development level, and ultimately enhance TSCDEE (Tang et al., 2023). Through the coefficient comparison analysis, it is found that the freight turnover level promotes TSCDEE most significantly in the Middle Yellow River, followed by the Southwest and Northwest. The reasons are that the geographic location and transportation advantages of the Middle Yellow River make it an important hub connecting east and west, and communicating north and south. It has a high freight turnover and a higher demand for advanced transportation equipment, which increases its economic development potential and better utilizes advanced technology. They have difficulties in absorbing advanced technologies due to geographic constraints, which lead to the backwardness of production technologies in the Northwest and Southwest, especially in the field of transportation. To improve TSCDEE, it is important to increase investment in transportation facilities to enhance the freight turnover level.
(3) The transportation infrastructure level has a significant positive effect on TSCDEE in the Northeast, Middle Yellow River, Middle Yangtze River, and Southwest regions, while it shows the opposite effect in the Northern coast. Through the coefficient comparison analysis, it is found that the transportation infrastructure level contributes most significantly to TSCDEE in the Northeast. This is because the Northeast is sparsely populated, with a relatively low population concentration. There has the backward transportation network and weakest infrastructure. The natural low-temperature environment has become a major obstacle to the promotion of new energy vehicles in the Northeast. The transportation structure needs to be optimized there. Therefore, it is essential to improve the construction of transportation infrastructure, especially promoting the use scenarios of new energy vehicles in the Northeast. The urbanization level of the Middle Yellow River, Middle Yangtze River, and Southwest is still in the development stage, strengthening infrastructure construction is conducive to improving TSCDEE. Over the years, the Northern coast has had a good foundation for the development of transportation infrastructure construction, structural transformation, and technological innovation. The Northern coast owns the most complete transportation system in China. If it continues to expand infrastructure in a unordered manner, resources and energy will be wasted. It is necessary to explore other ways besides infrastructure development to improve TSCDEE in the Northern coast.
(4) Technological progress has a significant contribution to TSCDEE in the Eastern coast, Northeast, Middle Yellow River, Middle Yangtze River, Southwest, and Northwest. Technological progress is an important driver in the energy utilization process that reduces carbon emissions. Lower energy intensity represents less energy consumption for the same economic output, which improves economic efficiency and promotes transportation carbon emission efficiency. The coefficient comparison analysis reveals that technological progress has the most significant contribution to TSCDEE in the Northeast. The Northeast is the largest heavy industry base in China. There is the backward economic development, serious brain drain, and insufficient development of high-tech industries in the Northeast. If the Northeast can improve the industrial structure, promote the transformation and upgrading of industries, and realize the dual goals of low-energy consumption and high-output value, it will have an extremely significant positive impact on the TSCDEE. Notably, the impact of technological progress on the Northern and Southern coasts is not strong enough. There are the best education resources, the top higher education institutions, numerous research institutes, and a significant potential for technological innovation in the Northern coast. The Southern coast has formed several high-tech industry clusters based on its geographical location and policy support. The vigorous development of high-tech industries promotes technological innovation and industrial upgrading and helps to alleviate environmental pressure and reduce pollution. Therefore, technological progress is already an advantage for the Northern and Southern coasts, there is limited room to enhance their TSCDEE solely on technological progress.
5 Discussion
(1) The TSCDEE overall shows a fluctuating upward trend in China. The efficiency exhibits an unbalanced regional distribution and significant differences between provinces. The above conclusions are consistent with the findings of previous studies. In addition, this study also finds that TSCDEE is higher in coastal regions and lower in the Southwest and Northeast. This suggests that coastal regions should take more responsibility for the green transition in transportation, while the Southwest and Northeast should focus on retaining and attracting talent, improving transportation infrastructure, and promoting technological progress.
(2) In terms of the influencing factors, this study finds that the improvement in the transportation infrastructure will enhance TSCDEE, which supports the view of Zhao et al. (2022). Technological progress can improve TSCDEE, which is consistent with the findings of Lin and Jiang. (2022). In addition, this study further finds that population mobility has a significant negative effect on TSCDEE, which validates the previous hypothesis. The increase in population mobility leads to a rise in transportation demand, which increases energy consumption and carbon emissions and reduces TSCDEE. Meanwhile, this study also finds that the increase in freight turnover can improve TSCDEE, which is consistent with the previous hypothesis. The increase in freight turnover is conducive to meeting the transportation demand, improving economic development, and ultimately increasing TSCDEE.
(3) In terms of heterogeneity analysis, this study finds that the influencing factors show significant differences across different regions. The main manifestations are as follows: the regression coefficients of population mobility have obvious spatial heterogeneity. Population mobility has the most significant negative effect on the Northern coast; the regression coefficients of freight turnover show positive correlation effect in most regions. Freight turnover has the most significant positive effect on the Middle Yellow River; In all regions, the coefficients of the transportation infrastructure level are either positively or negatively distributed. Transportation infrastructure has the most significant positive effect on the Northeast. This study further finds that the transportation infrastructure level has a significant negative effect on TSCDEE in the Northern coast, which suggests that the Northern coast should optimize its existing transportation network to alleviate traffic congestion; the regression coefficients of technological progress show a positive correlation effect throughout the country. The high values are distributed in the Northeast and Southwest. At the same time, this study also finds that technological progress does not play a significant role in the Northern and Southern coasts, because these two regions already have the advantages of technological progress, and the marginal benefits of further technological investment are relatively low.
6 Policy implications
(1) The Chinese government should strengthen the policy guarantee for green and low-carbon transportation to promote the low-carbon transformation of the transportation sector. It is important to narrow the development gap and improve TSCDEE. On the one hand, policy synergy should be strengthened. The country should create a unified accounting method for transportation carbon emissions and clarify the emission targets and sources. The statistical database should be improved to implement transportation carbon emissions management and control. On the other hand, the regional linkage should be strengthened. Regions should establish a cross-regional transportation technology cooperation platform. They should promote resource sharing and talent exchange, break down administrative division barriers, and realize complementary advantages. Regional development differences should also be considered. Coastal provinces need to take advantage of their economic and geographical strengths. The backward regions should be given financial subsidies and talent introduction policies. The transportation projects in the backward regions need priority support. It is necessary to improve the construction of transportation infrastructure and enhance TSCDEE in the backward regions.
(2) To improve TSCDEE, it is necessary to utilize the synergistic effect among the influencing factors. On the one hand, local governments should actively respond to the national policy orientation of expanding domestic demand. They should boost consumption and improve investment efficiency to raise the demand for transportation freight, which will increase freight turnover. Infrastructure is an important support for the development of new-quality productive forces. It is necessary to strengthen transportation infrastructure investment to promote economic growth (Oladunni et al., 2022). It is necessary to promote the construction of green transportation infrastructure and optimize the layout, structure, function, and development mode of infrastructure. It is important to optimize the energy structure, improve the efficiency of energy use, and promote technological progress in the transportation sector. To achieve sustainable economic development, a new mechanism for the comprehensive transition from dual control of total energy consumption and intensity to dual control of total carbon emissions and intensity should be promoted. On the other hand, the government should advocate that residents adopt a moderate, green, and low-carbon lifestyle, and guide them to give priority to the green modes of travel. The large-scale application of new energy sources and clean energy vehicles should be achieved to mitigate the negative impacts of population mobility.
(3) Local governments should consider regional differences when formulating policies. In coastal areas with large population mobility, emphasis should be placed on enhancing public awareness of green travel and advocating green travel modes. At the same time, it is essential to upgrade the supply capacity of public transportation, optimize and adjust the layout of urban bus lines and stations to improve the public travel experience. In the Northeast, emphasis should be placed on the implementation of financial subsidies and tax incentives, including subsidies for investment in clean energy projects, energy-saving and emission-reduction technologies. At the same time, it is important to implement talent introduction policies and encourage high-tech industries to land in the Northeast, and provide career development and research opportunities for technical talents. The Middle Yellow River should utilize its strategic transportation position to improve freight turnover. It can strengthen regional linkages, establish a multimodal transport system, and realize the connection between different modes of transportation.
7 Conclusion
This study uses the EBM-DEA model to calculate the TSCDEE in China and analyzes the spatiotemporal evolution pattern of the TSCDEE. The Tobit model is used to analyze the influencing factors as well as the heterogeneity in different regions. The main conclusions are as follows:
(1) The TSCDEE in most provinces shows a fluctuating upward trend, which is consistent with the overall TSCDEE trend in China. In addition, there is an imbalance in the spatial distribution of efficiency values, which is manifested in higher efficiency values in coastal regions and lower efficiency values in the Southwest and Northeast.
(2) The Tobit regression result shows that TSCDEE is influenced by factors such as population mobility, freight turnover level, transportation infrastructure level, and technological progress. Notably, only population mobility plays a negative influence on TSCDEE. For this result, it is recommended that the government actively promotes green travel policies and calls on provinces to adopt specific traffic management measures to cope with the negative impact of population mobility.
(3) The Tobit model is used for heterogeneity analysis of the influencing factors. The results show that regions differ in urbanization level, economic development level, resource endowment, and industrial structure. As a result, the same influencing factor can have varying strengths and directions of influence on different regions. Based on this result, it is suggested that local governments should consider regional heterogeneity and make targeted policy recommendations.
Data availability statement
The raw data supporting the conclusions of this article will be made available by the authors, without undue reservation.
Author contributions
WS: Conceptualization, Data curation, Software, Writing – original draft. HZ: Funding acquisition, Resources, Writing – review and editing.
Funding
The author(s) declare that financial support was received for the research and/or publication of this article. This research was supported by Provincial Foundation for Excellent Young Talents of Colleges and Universities of Anhui Province (Grant No. 2023AH030082), and Anhui Province Social Science Research Project in Universities (Grant No. 2022AH050351).
Acknowledgments
The authors are grateful to the editor and reviewers for their critical suggestions of this manuscript.
Conflict of interest
The authors declare that the research was conducted in the absence of any commercial or financial relationships that could be construed as a potential conflict of interest.
Generative AI statement
The author(s) declare that no Generative AI was used in the creation of this manuscript.
Publisher’s note
All claims expressed in this article are solely those of the authors and do not necessarily represent those of their affiliated organizations, or those of the publisher, the editors and the reviewers. Any product that may be evaluated in this article, or claim that may be made by its manufacturer, is not guaranteed or endorsed by the publisher.
Supplementary material
The Supplementary Material for this article can be found online at: https://www.frontiersin.org/articles/10.3389/fenvs.2025.1565476/full#supplementary-material
References
Domagala, J., and Kadlubek, M. (2023). Economic, energy and environmental efficiency of road freight transportation sector in the EU. Energies 16, 461. doi:10.3390/en16010461
Du, Q., Lu, C., Zou, P. X. W., Li, Y., Li, J., and Cui, X. (2021). Estimating transportation carbon efficiency (TCE) across the belt and road initiative countries: an integrated approach of modified three-stage epsilon-based measurement model. Environ. Impact Assess. Rev. 90, 106634. doi:10.1016/j.eiar.2021.106634
Fang, J., Liu, Y., Gao, H., Dong, J., and Lv, B. (2023). Does public data access promote regional harmonious development? On a quasi-natural experiment of government data platform access. J. Manag. World 39, 124–142. doi:10.19744/j.cnki.11-1235/f.2023.0112
Fang, W., An, P., and Liu, S. (2021). Evolution characteristics and regional roles’ influencing factors of interprovincial population mobility network in China. Complexity 2021, 6679580. doi:10.1155/2021/6679580
Guan, Y., Shan, Y., Huang, Q., Chen, H., Wang, D., and Hubacek, K. (2021). Assessment to China’s recent emission pattern shifts. Earths Future 9, e2021EF002241. doi:10.1029/2021EF002241
Hussain, Z., Xia, Z., and Li, Y. (2023). Estimating sustainable transport efficiency and socioeconomic factors: application of non-parametric approach. Transp. Lett.- Int. J. Transp. Res. 15, 685–697. doi:10.1080/19427867.2022.2082004
IPCC (2006). Guidelines for national greenhouse gas inventories. Rep. Intergov. Panel Clim. Change. Available online at: https://www.ipcc-nggip.iges.or.jp/public/2006gl/vol2.html (Accessed February 26, 2025).
Irfan, M., Mahapatra, B., and Shahbaz, M. (2024). Energy efficiency in the indian transportation sector: effect on carbon emissions. Environ. Dev. Sustain. 26, 6653–6676. doi:10.1007/s10668-023-02981-z
Jiang, M., and Li, J. (2022). Study on the change in the total factor carbon emission efficiency of China’s transportation industry and its influencing factors. Energies 15, 8502. doi:10.3390/en15228502
Li, J. (2023). Research on efficiency and dynamic development of logistics industry considering unexpected output. Master’s thesis. Taiyuan, China: Shanxi University.
Li, J., and Zhang, G. (2016). Estimation of capital stock and capital return rate of China’s transportation infrastructure. Contemp. Finance Econ., 3–14. doi:10.13676/j.cnki.cn36-1030/f.2016.06.001
Li, Q., Chen, J., and Zhang, P. (2024). Study on carbon emission characteristics and its influencing factors of energy consumption in sichuan province, China. Front. Environ. Sci. 12, 1414730. doi:10.3389/fenvs.2024.1414730
Li, X., Lv, T., and Qu, D. (2025). Assessing carbon emissions from urban road transport through composite framework. Sustain. Energy Technol. Assess. 73, 104151. doi:10.1016/j.seta.2024.104151
Li, Y., Li, T., and Lu, S. (2021a). Forecast of urban traffic carbon emission and analysis of influencing factors. Energy Effic. 14, 84. doi:10.1007/s12053-021-10001-0
Li, Y., Shen, J., Xia, C., Xiang, M., Cao, Y., and Yang, J. (2021b). The impact of urban scale on carbon metabolism - a case study of hangzhou, China. J. Clean. Prod. 292, 126055. doi:10.1016/j.jclepro.2021.126055
Lin, H., and Jiang, P. (2022). Analyzing the phased changes of socioeconomic drivers to carbon dioxide and particulate matter emissions in the Yangtze River delta. Ecol. Indic. 140, 109044. doi:10.1016/j.ecolind.2022.109044
Liu, J., Liu, B., and Lee, C. (2024). Efficiency evaluation of China’s transportation system considering carbon emissions: evidence from big data analytics methods. Sci. Total Environ. 922, 171031. doi:10.1016/j.scitotenv.2024.171031
Liu, Y., Chen, L., and Huang, C. (2022). Study on the carbon emission spillover effects of transportation under technological advancements. Sustainability 14, 10608. doi:10.3390/su141710608
Lv, Y., Fan, T., and Zhang, J. (2023). Spatiotemporal characteristics and influencing factors of China’s transport sector carbon emissions efficiency. Ecol. Econ. 39, 13–22. Available online at: https://kns.cnki.net/KCMS/detail/detail.aspx?dbcode=CJFQ&dbname=CJFDLAST2023&filename=STJJ202303001.
Ma, Y., Zhu, J., Gu, G., and Chen, K. (2020). Freight transportation and economic growth for zones: sustainability and development strategy in China. Sustainability 12, 10450. doi:10.3390/su122410450
Montoya-Torres, J., Akizu-Gardoki, O., and Iturrondobeitia, M. (2023). Measuring life-cycle carbon emissions of private transportation in urban and rural settings. Sustain. Cities Soc. 96, 104658. doi:10.1016/j.scs.2023.104658
Oladunni, O. J., Mpofu, K., and Olanrewaju, O. A. (2022). Greenhouse gas emissions and its driving forces in the transport sector of South Africa. Energy Rep. 8, 2052–2061. doi:10.1016/j.egyr.2022.01.123
Oladunni, O. J., and Olanrewaju, O. A. (2022). Effects of the impact factors on transportation sector’s CO2-eq emissions: panel evaluation on South Africa’s major economies. Atmosphere 13, 1705. doi:10.3390/atmos13101705
Oladunni, O. J., Olanrewaju, O. A., and Lee, C. K. M. (2024). The Environmental Kuznets Curve (EKC) Hypothesis on GHG emissions: analyses for transportation industry of South Africa. Discov. Sustain. 5, 302. doi:10.1007/s43621-024-00518-6
Qian, Q., Li, D., Gan, M., and Yao, Z. (2021). Decision analysis of the optimal freight structure at provincial level in China. Environ. Sci. Pollut. Res. 28, 54972–54985. doi:10.1007/s11356-021-14634-7
Ren, Y., Fang, C., and Li, G. (2020). Spatiotemporal characteristics and influential factors of eco-efficiency in Chinese prefecture-level cities: a spatial panel econometric analysis. J. Clean. Prod. 260, 120787. doi:10.1016/j.jclepro.2020.120787
Said, Z. M., and Dindar, S. (2024). Key challenges and strategies in the evaluation of sustainable urban regeneration projects: insights from a systematic literature review. Sustainability 16, 9903. doi:10.3390/su16229903
Tan, L., Wu, X., Guo, J., and Santibanez-Gonzalez, E. D. R. (2022). Assessing the impacts of COVID-19 on the industrial sectors and economy of China. RISK Anal. 42, 21–39. doi:10.1111/risa.13805
Tang, J., Gong, R., Wang, H., and Liu, Y. (2023). Scenario analysis of transportation carbon emissions in China based on machine learning and deep neural network models. Environ. Res. Lett. 18, 064018. doi:10.1088/1748-9326/acd468
The State Council (2018). The state council’s circular on issuing the three-year action plan for winning the blue sky defense war. Available online at: https://www.gov.cn/gongbao/content/2018/content_5306820.htm (Accessed February 26, 2025).
Tobin, J. (1958). Estimation of relationships for limited dependent-variables. Econometrica 26, 24–36. doi:10.2307/1907382
Wang, L., and Wang, Q. (2024). Eco-efficiency evaluation of integrated transportation hub using super-efficiency EBM model and tobit regressive analysis - case study in China. Promet-Traffic Transp. 36, 307–325. doi:10.7307/ptt.v36i2.411
Wang, Z., and He, W. (2017). CO2 emissions efficiency and marginal abatement costs of the regional transportation sectors in China. Transp. Res. Part Transp. Environ. 50, 83–97. doi:10.1016/j.trd.2016.10.004
Wen, X. (2021). China environmental website. Available online at: https://www.cenews.com.cn/news.html?aid=204220 (Accessed January 4, 2025).
Wu, J., Jia, P., Feng, T., Li, H., Kuang, H., and Zhang, J. (2023). Uncovering the spatiotemporal impacts of built environment on traffic carbon emissions using multi-source big data. Land Use Policy 129, 106621. doi:10.1016/j.landusepol.2023.106621
Zeng, G., Sang, Y., Gui, Q., Li, J., Yuan, J., and Zhu, K. (2023). An empirical study on the measurement and influencing factors of carbon emission efficiency in China’s transportation industry. Glob. Nest J. 25, 110–123. doi:10.30955/gnj.005249
Zeng, L., Lu, H., Liu, Y., Zhou, Y., and Hu, H. (2019). Analysis of regional differences and influencing factors on China’s carbon emission efficiency in 2005-2015. Energies 12, 3081. doi:10.3390/en12163081
Zhang, H., Peng, J., Wang, R., Zhang, M., Gao, C., and Yu, Y. (2023). Use of random forest based on the effects of urban governance elements to forecast CO2 emissions in Chinese cities. Heliyon 9, e16693. doi:10.1016/j.heliyon.2023.e16693
Zhang, H., Wang, X., Chen, L., Luo, Y., and Peng, S. (2022). Evaluation of the operational efficiency and energy efficiency of rail transit in China’s megacities using a DEA model. Energies 15, 7758. doi:10.3390/en15207758
Zhang, J., Wu, G., and Zhang, J. (2004). The Estimation of China’s provincial capital stock:1952—2000. Econ. Res. J., 35–44. Available online at: https://kns.cnki.net/KCMS/detail/detail.aspx?dbcode=CJFQ&dbname=CJFD2004&filename=JJYJ200410004.
Zhang, S., Shi, J., Huang, Y., Shen, H., He, K., and Chen, H. (2024). Investigating the effect of dynamic traffic distribution on network-wide traffic emissions: an empirical study in ningbo, China. PLoS One 19, e0305481. doi:10.1371/journal.pone.0305481
Zhang, X., Li, Z., and Wang, J. (2021). Impact of COVID-19 pandemic on energy consumption and carbon dioxide emissions in China’s transportation sector. Case Stud. Therm. Eng. 26, 101091. doi:10.1016/j.csite.2021.101091
Zhao, P., Zeng, L., Li, P., Lu, H., Hu, H., Li, C., et al. (2022). China’s transportation sector carbon dioxide emissions efficiency and its influencing factors based on the EBM DEA model with undesirable outputs and spatial durbin model. Energy 238, 121934. doi:10.1016/j.energy.2021.121934
Zhao, P., Zeng, L., Lu, H., Hu, H., and Liu, Y. (2019). Measurement and spatial econometrics analysis of provincial economic efficiency of urban construction land in China:2008-2017. Urban Dev. Stud. 26, 37–49. Available online at: https://kns.cnki.net/KCMS/detail/detail.aspx?dbcode=CJFQ&dbname=CJFDLAST2019&filename=CSFY201907004.
Keywords: transportation sector, carbon emissions efficiency, population mobility, freight turnover, superefficiency EBM model
Citation: Song W and Zhang H (2025) Research on the measurement and influencing factors of carbon emission efficiency in China’s transportation sector based on EBM-Tobit model. Front. Environ. Sci. 13:1565476. doi: 10.3389/fenvs.2025.1565476
Received: 24 January 2025; Accepted: 07 April 2025;
Published: 16 April 2025.
Edited by:
Lirong Liu, University of Surrey, United KingdomReviewed by:
Serdar Dindar, Yıldırım Beyazıt University, TürkiyeOluwole Joseph Oladunni, Durban University of Technology, South Africa
Copyright © 2025 Song and Zhang. This is an open-access article distributed under the terms of the Creative Commons Attribution License (CC BY). The use, distribution or reproduction in other forums is permitted, provided the original author(s) and the copyright owner(s) are credited and that the original publication in this journal is cited, in accordance with accepted academic practice. No use, distribution or reproduction is permitted which does not comply with these terms.
*Correspondence: Hao Zhang, emhhbmdoYW9uY3VAMTI2LmNvbQ==