 Jiang Li1,2
 Baomiao Ning
- 1School of Geography and Information Engineering, China University of Geosciences, Wuhan, China
- 2Information Center, Department of Natural Resources of Hubei Province, Wuhan, China
- 3School of Public Administration, China University of Geosciences, Wuhan, China
- 4National Land Survey Department, Ningxia Natural Resources Survey and Investigation Institute, Yinchuan, China
- 5Foshan Surveying Mapping and Geoinformation Research Institute Co., Ltd., Foshan, China
Introduction: Predicting future land use/cover changes and their impact on carbon storage is crucial for achieving China's “Dual Carbon” goals. Current studies face challenges of low resolution and difficulties in fine-scale simulations.
Method: This study developed a novel large-scale, high-resolution approach for estimating and simulating carbon sinks and storage changes based on the PLUS model, incorporating cropland and grassland management practices' effects on soil organic carbon, and utilizing block parallel computing.
Results and discussion: Results show that from 2020 to 2030 and 2060, Hubei Province's croplands and construction lands are the main land types undergoing transition while forestlands steadily increase. Cropland management carbon sinks are highest under the natural development scenario. Grassland management carbon sinks are highest in the ecological priority scenario. Forest management carbon emissions peak under ecological priority. Based on simulation results, early warnings were issued to counties with high carbon sequestration and emission risks. The study proposes a high-resolution carbon stock estimation method and implementing large-scale risk warning systems. These findings provide crucial evidence for land policy formulation and achieving “Dual Carbon” goals, offering valuable data support for illegal land use regulation.
1 Introduction
In the context of the rapidly advancing global initiatives towards carbon neutrality and sustainable development, the attainment of carbon neutrality has surfaced as a significant systemic transformation within economic and social frameworks (Friedlingstein et al., 2020; De La Peña et al., 2022). Numerous nations are actively promoting their major urban centers and industrial sectors to reach carbon neutrality by 2050, with the objective of reducing greenhouse gas emissions by 80%–100% (Arshad Ahmad et al., 2022). Within this landscape, China has committed to peaking carbon emissions before 2030 and aims to achieve carbon neutrality by 2060 (Liu et al., 2022). The fundamental pathways to achieve carbon neutrality involve both emission reduction and carbon sequestration (“emission reduction” and “enhanced sinks”) (Guo R. et al., 2021; Guo S. et al., 2021; Hu, 2021). The carbon stock in terrestrial ecosystems plays a crucial role in the global carbon cycle and climate change (Liu et al., 2018; Yang et al., 2022). Land use and land cover change (LUCC) are among the primary factors influencing carbon stock variation, as they affect the carbon stock in vegetation and soil, consequently influencing the overall regional carbon stock dynamics (Deng et al., 2016; Lu et al., 2018; Liu et al., 2019). Changes in vegetation types directly alter carbon sequestration capacity: deforestation leads to a sharp decrease in aboveground biomass, while afforestation and restoration can enhance photosynthetic carbon uptake. Agricultural reclamation accelerates the loss of soil organic carbon, whereas the Grain for Green Program promotes soil carbon accumulation. Anthropogenic management can also strengthen carbon sink functions in vegetation through agricultural intensification and ecological restoration measures (Zhu et al., 2025). LUCC is a key driver of changes in terrestrial ecosystem carbon stock, ultimately leading to a transition of terrestrial ecosystems into significant carbon sources (Ge et al., 2008; Stocker et al., 2010; Kaplan et al., 2011; Stocker et al., 2017).
On the other hand, measures such as forestation, grassland management, wetland conservation, mangrove protection, and seagrass restoration, which primarily constitute biological carbon sequestration, continuously enhance the capacity of ecological carbon sinks, playing a vital role in mitigating global climate change (Zhang et al., 2015; Lai et al., 2016). It is evident that LUCC serves not only as a significant carbon source but also as a major carbon sink (Piao et al., 2009). Against this backdrop, predicting future land use/cover changes and their impacts on carbon sinks is of paramount importance for understanding regional terrestrial ecosystem dynamics (Zhao et al., 2019).
The evaluation of carbon stock spatiotemporal dynamics based on LUCC has gradually become a classic method widely used for assessing carbon stock (Chang et al., 2012; Etemadi et al., 2018; Tang et al., 2020; Liang et al., 2024a). This method enables the spatial mapping of carbon stock distribution and dynamic changes, clearly reflecting the relationship between LUCC and carbon stock (Zhu et al., 2022; Song et al., 2024). Building upon this, in combination with predicted land use/cover results, assessments of carbon stock under different LUCC scenarios can be conducted, providing effective bases for optimizing land use structures (Liu et al., 2019). Cellular Automata (CA) models have proven to be effective tools for predicting land use and land cover changes (Newland et al., 2018; Xuecao et al., 2021; Simkin et al., 2022; Liang et al., 2024b). By coupling human activities and natural elements, CA can simulate future land use changes, effectively integrating top-down system dynamics and bottom-up cellular automata, thus enabling fine-scale simulation of large-scale future land use changes (Chen et al., 2020). For example, Wu et al. (2016) simulated the impact of urban expansion on carbon stock in Guangdong Province at a resolution of 1,000 m using a combination of cellular automata and InVEST models. However, this study was limited to regional scales and only considered urban expansion, rather than transitions between multiple land use types. Liu et al. (2019) simulated the carbon stock of terrestrial ecosystems in China in 2,100 at a resolution of 1,000 m using the FLUS-InVEST model and explored its spatial heterogeneity integrated a system dynamics model, FLUS model, and InVEST model to investigate the indirect effects of climate change and socioeconomic development on carbon stock through urbanization at a resolution of 1,000 m. Shao et al. (2022) simulated the spatiotemporal evolution of carbon stock in Beijing’s ecosystem using the FLUS-InVEST model at a 30-m resolution; however, the study area was relatively limited. Chen et al. (2025) integrated the FLUS and InVEST models to systematically study the relationship between land use change and habitat quality in China from 1980 to 2020 at a 1000 m resolution, and predicted the impact of land use change on habitat quality by 2050. While this method is adaptable to large-scale simulations and assessments, its low resolution and lack of diverse scenario settings hinder its ability to support differentiated policy scenario analyses. The FLUS model incorporates multi-factor drivers and effectively reflects the carbon stock loss induced by urbanization in China, though the resolution of the study remains relatively low (Liu et al., 2019; Yang H. et al., 2020). Carbon stock Zhang et al. (2020) simulated the low-carbon development mode of Wuhan City in 2025 under various scenarios based on the spatial distribution of carbon sinks using the Markov-CA model at a resolution of 100 m. Yang et al. (2021) similarly integrated the CA_Markov model with the InVEST model to assess the impact of future land use changes on regional carbon stocks in the Yellow River Basin at a 1000-m resolution. The CA_Markov model predicts land use changes based on historical transition probabilities, making it suitable for short-term trend simulations at high resolutions but prone to accumulating significant errors in long-term simulations.
Based on the aforementioned research status, current studies utilizing LUCC simulations to predict terrestrial carbon sinks primarily employ models such as InVEST, FLUS, CA_Markov, and their coupled combinations. In addition, Lin et al. (2023) proposed the LP-CA model, which incorporates landscape metrics to improve the precision of urban expansion patch generation, aiding in the accurate prediction of carbon loss caused by urban expansion. However, the model has yet to validate its accuracy across multiple land types, higher resolutions, and larger-scale regions. In summary, these models struggle to balance high efficiency, high precision, multiple land use, and large-scale regional coverage in carbon sink prediction. Most models can only utilize low-resolution data for large-scale regions or conduct high-resolution carbon sink prediction studies in relatively smaller areas. Achieving the “dual carbon” goals requires comprehensive coordination and consideration of carbon emissions and carbon sinks on a large scale. Therefore, conducting fine-scale simulations of land use changes in large-scale regions is particularly important for achieving regional “dual carbon” goals (Sun et al., 2022). Existing land use change simulation models struggle to perform high-resolution, detailed simulations across large-scale regions. This limitation renders them unable to meet the demands of regional carbon stock precision conservation, carbon emission source traceability, land use planning, and regional environmental governance.
In response to this challenge, the Patch Land Use Change Simulation (PLUS) model (Liang et al., 2021) provides a new approach by innovating driving mechanism mining methods through its LEAS and CARS modules, achieving improved accuracy; it supports parallel computing and high-resolution data input, effectively reducing computation time for high-resolution, multi-category, large-scale regional simulations, thereby offering new possibilities for simulating changes in carbon stock and carbon sinks. In terms of models for estimating land use carbon stock and land use carbon emissions changes, Lai et al. (2016) proposed a method for estimating carbon stock changes caused by cropland and grassland management. This method can estimate the carbon stock and changes in land use/cover at a regional level without being affected by the resolution of land use data. These two studies provide new insights for high-resolution simulation of carbon stock and carbon emissions under various scenarios of future land use changes.
A synthesis of current research reveals that existing methods for predicting terrestrial carbon sinks through LUCC simulations face challenges in conducting high-resolution, detailed simulations across large-scale regions. Therefore, based on the PLUS model, this study proposes a high-resolution simulation method for changes in land use carbon stock, carbon sink loss, and carbon emissions risk, aiming to provide fine-scale estimates of land use/cover carbon stock and changes for regional environmental governance and the implementation of carbon neutrality goals. By leveraging this method, we can establish a multi-factor coupled carbon stock assessment system using high-resolution LUCC data and construct a county-level carbon sink risk early warning system.
2 Methods
This study integrates soil organic carbon, as well as changes in carbon stock due to the management of croplands, forest land and grasslands, to jointly estimate the carbon emissions caused by historical land use. Furthermore, based on the land use change simulation model, simulations are conducted to explore the future distribution and changes of carbon sinks, carbon stock, and carbon emissions due to land use changes under various national territorial spatial planning policy scenarios in Hubei Province at a fine scale. The research framework is illustrated in Figure 1.

Figure 1. The framework of the study.
2.1 Vegetation carbon sinks: distribution and loss estimation methods
By integrating the land use data with tables of carbon density and carbon sequestration capacity, high-resolution carbon stock and carbon density data for the region over multiple years are acquired. The formulas are as follows:
where
where
2.2 Soil carbon accounting in agriculture, grassland, and forest management
According to Lai et al. (2016), this study utilized the Chinese soil type map, referred to the Second National Soil Survey of China and related literature studies on soil carbon density, which are applicability proved in Hubei researches (Hu et al., 2012; Wang et al., 2015; He et al., 2018). It's also referred to multi-year vegetation carbon sinks and carbon stock distribution and loss estimation methods to determine the carbon stock of the soil through the two formulas above in Section 2.1 based on the multiplication of the cell area corresponding to the soil type and the corresponding soil carbon density.
Forest management carbon emissions are defined as the total amount of trees harvested within the region, converted into carbon equivalent emissions. Since the logging proportion remains constant, a linear relationship exists between the total tree stock and the logged quantity. Based on the data from the fifth and seventh national forest inventory (1994–1998 and 2004–2008), the formula for calculating emissions from forest land management is as follows:
where
In addition, this study assessed the carbon stock changes due to cropland and grassland management using the empirical model recommended by the IPCC Guidelines for National Greenhouse Gas Inventories (2006). In this assessment, the coefficients of change in relative stocks for different management activities on cropland and grassland were taken from the studies of Jin et al. (2008) and Ipcc (2006), and the SOC values were taken from the Second National Soil Survey Report (Shi and Song, 2016). The formula equation for calculating the change in carbon stock was as follows:
where
2.3 Scenario setting based on planning policy
The PLUS model was chosen to simulate the land use changes in Hubei Province under different scenarios in 2030 and 2060. Markov chain model is selected to predict the future land use demand in Hubei Province. Three scenarios are designed, the natural development scenario, the ecological priority scenario and the economic development scenario, and the neighborhood weights and cost matrices were established under the three scenarios with reference to the existing studies and the actual situation in Hubei Province. The settings of the three scenarios are as follows:
(1) Natural development scenario: The scenario is simulated without considering any land use constraints and according to the land use conversion law of Hubei Province from 2010 to 2020.
(2) Ecological Priority Scenario: Hubei Province, as the core of the Yangtze River Economic Belt, includes key ecological zones like the four major mountainous regions with ecological functions like water conservation, biodiversity, and soil protection. The Jianghan Plain also hosts over 700 lakes with critical roles in biodiversity maintenance and flood storage. This scenario emphasizes a balanced approach to land use planning across ecological, agricultural, and urban land, prioritizing ecological protection. Guided by this objective, the scenario setting methodology for this study was developed based on Hubei Province’s ecological and environmental zoning regulation policies (Hubei_Daily, 2020), with reference to research by Peng et al. (2021) and Li et al. (2022), among others. Transfer rules restrict forest, grassland, and water areas from converting to construction land, while construction land can convert to forest and grassland. The transfer probability of forest and grassland to construction land is reduced by 50%, cropland by 30%, and conversions from cropland and grassland to forest land are increased by 30%.
(3) Economic Development Scenario: Aligned with Hubei’s 14th Five-Year Plan for urbanization quality, this study integrates the scenario setting methodologies for urban development and economic development scenarios from the research of Zhang et al. (2022), Yang H. et al. (2020), and Liu and Yu (2023), enhances expansion potential for construction land and cropland, with stricter limits on construction land transfers. Towns and rural areas remain within their land types, with increased transfer probabilities from cropland, forest, and grassland to construction land by 30%, and reduced conversion probability of construction land to other types (except cropland) by 40%.
2.4 Multi-scenario extrapolation of land cover change based on PLUS modeling
Driven by future land use demand, this study utilizes the PLUS model to simulate and predict land use changes by setting up three different scenarios. With the support of GDAL chunking technology and OpenMP parallel technology, the PLUS model first uses the random forest algorithm to mine the mapping relationship between the developmental changes of urban functional land use type k and the driving factors. Taking the development change of each type of land use components in the metric as the dependent variable and multiple driving factors as the independent variables, the random forest algorithm is used to mine the mapping relationship between the dependent variable and the independent variables:
Based on the development probabilities of each type of functional land, the PLUS model (Figure 2) can simulate the competition and transformation of multiple types of land. The total development probability of each type of land is composed first:
where
where
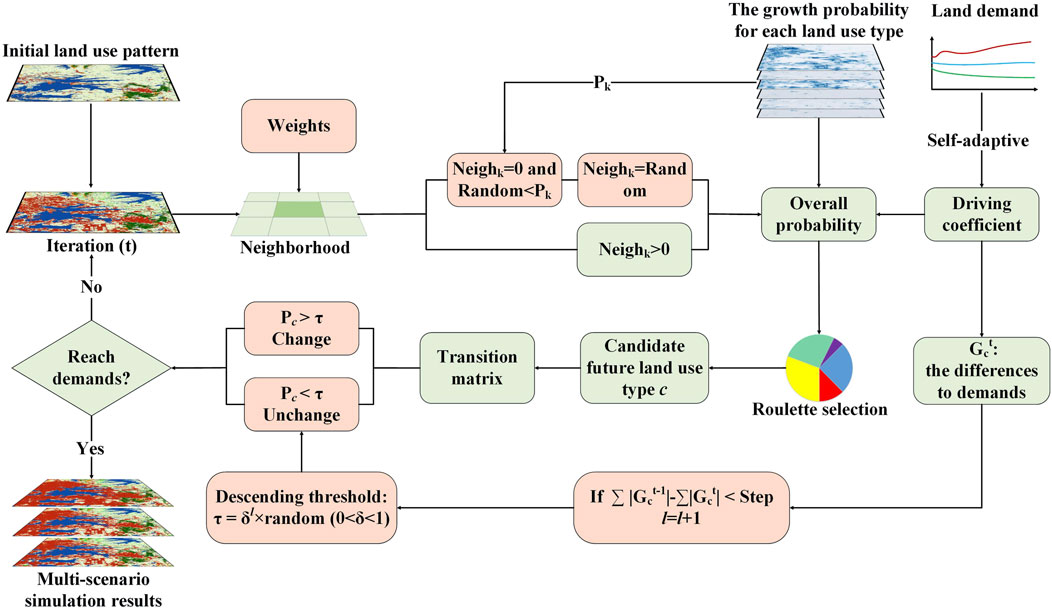
Figure 2. Simulation flow of the PLUS model.
3 Study area and datasets
3.1 Study area
Hubei Province, situated in the central part of China, covers a total area of 185,900 square kilometers, accounting for approximately 1.94% of the country’s total land area. The province has a population of around 57.75 million people (Yu et al., 2024). Geographically, Hubei Province occupies a transitional zone from the second to the third terraced step of China’s terrain, featuring the convergence of major rivers, large lakes, mountains, and reservoirs. Since 2000, the built-up land area in Hubei Province has grown at an average annual rate of 3.9%, increasing its total share to 7.7% by 2023. This expansion has primarily concentrated in the Wuhan Metropolitan Area, the Yichang-Jingzhou Riverside Economic Belt along the Yangtze River, and the contiguous urban zone of “Wuhan-Ezhou-Huanggang-Huangshi.” Meanwhile, cropland area exhibited a fluctuating trend of “initial decline followed by a rebound”: decreasing from 28.5% in 2000 to 24.8% in 2020, before achieving its first net growth since the “Third National Land Survey” in 2023, reaching 71.2805 million mu (25.6% of total land area). However, its spatial distribution demonstrates a corridor-style contraction pattern characterized by “clustering along the Yangtze River and loss in hinterlands.” Driven by the Grain for Green Program and ecological restoration initiatives, forest land area increased cumulatively by 12.7% between 2000 and 2020 (Wei et al., 2020; Zhang et al., 2022). In 2011, Hubei was approved as one of the seven pilot provinces for carbon emissions trading in China. By 2020, the cumulative quota transactions in the Hubei carbon market reached 356 million tons, representing 50.8% of the total for the country. The transaction value reached 8.351 billion yuan (RMB), representing 54.4% of the total for the country (Cao and Zhong, 2023). Therefore, studying the carbon reserves, emissions, and sinks in Hubei Province is of great significance for achieving carbon neutrality goals.
3.2 Data source and processing
The data required for this study on land use in Hubei Province for the years 2010 and 2020 was sourced from the Institute of Geographic Sciences and Natural Resources Research, Chinese Academy of Sciences, with an initial resolution of 30 m and an over-all accuracy of 95% (Kuang et al., 2016). Land use was classified into 19 categories, including paddy fields, dry land, closed forest land, shrubland, sparse woodland, other forest lands, grasslands with high, medium, and low cover, rivers, lakes, reservoirs and ponds, beaches, urban areas, rural residential areas, other construction lands, marshlands, bare soil, and bare rock and gravel areas. The driving factors of land use considered in this study encompass socio-economic factors, transportation, topography, soil, and climate aspects (Table 1). The importance assessment of these driving factors, expressed as contribution values, is displayed in a bar chart (Figure 3) using closed forest land and high cover grassland as examples. Among these, the original data for population, GDP, and soil conditions have a 1000-m resolution, which is lower than that of the land use data. Their applicability after resampling has been widely validated (Yang et al., 2018; Yang J. et al., 2020; Wu et al., 2021). All the data were uniformly resampled to a grid resolution of 30 m to facilitate subsequent simulation experiments. In the CARS module of the PLUS model, the number of decision trees in the random forest algorithm is set to 20.
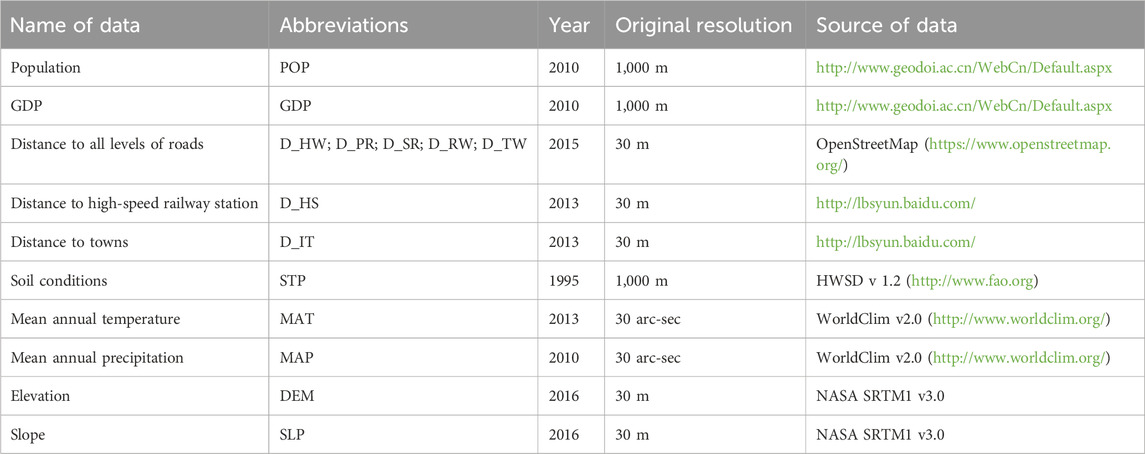
Table 1. Driving factor data for land-use modeling.

Figure 3. Contribution of driving factors (e.g., closed forest land, high cover grassland).
As shown in Table 2, the carbon data for cropland management are based on revised values from studies by Jin et al. (2008) and Lai et al. (2016), while the reference values for grassland management carbon are derived from the organic carbon density data from China’s Second National Soil Survey. In the table, the “Dry” and “Wet” soil moisture statuses correspond to the “dry land” and “paddy field” cropland types in the land use data. The factors for grassland carbon stock management changes follow the default values specified in the IPCC report and the “Good Practice Guidance for Land Use, Land-Use Change, and Forestry” (Ipcc, 2000; Penman et al., 2003). All grasslands were assigned a land-use factor and classified into four categories of grassland management conditions (non-degraded, moderately degraded, severely degraded, and improved) (Table 3). Forest management carbon data, including the total consumption of forest resources, is derived from the China Forest Resources Report (2014–2018), with data on per hectare living tree volume, average tree trunk volume density, and biomass expansion factors for the Hubei province coming from the study by Lai et al. (2016).
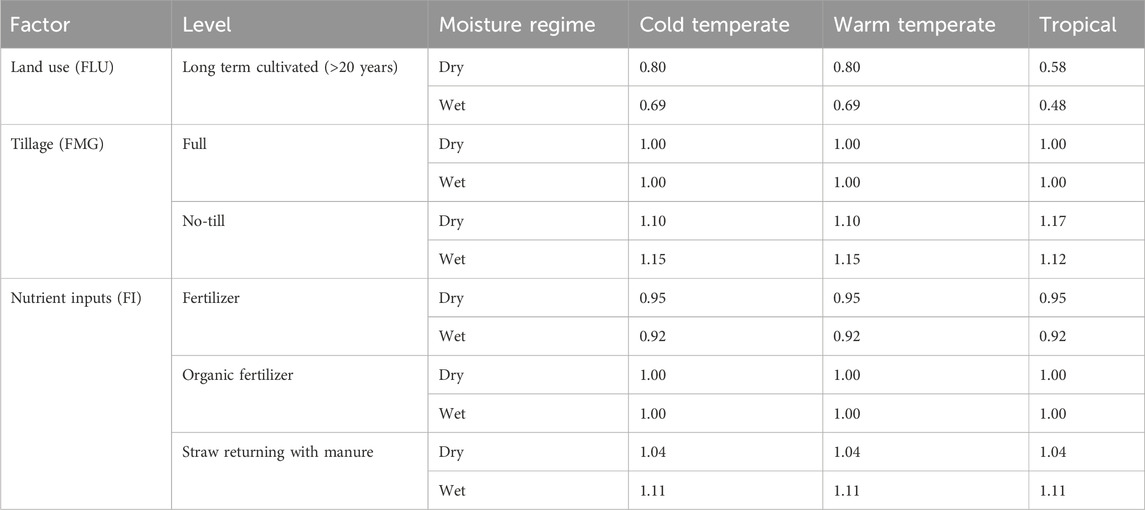
Table 2. SOC impact factors for Chinese cropland management.
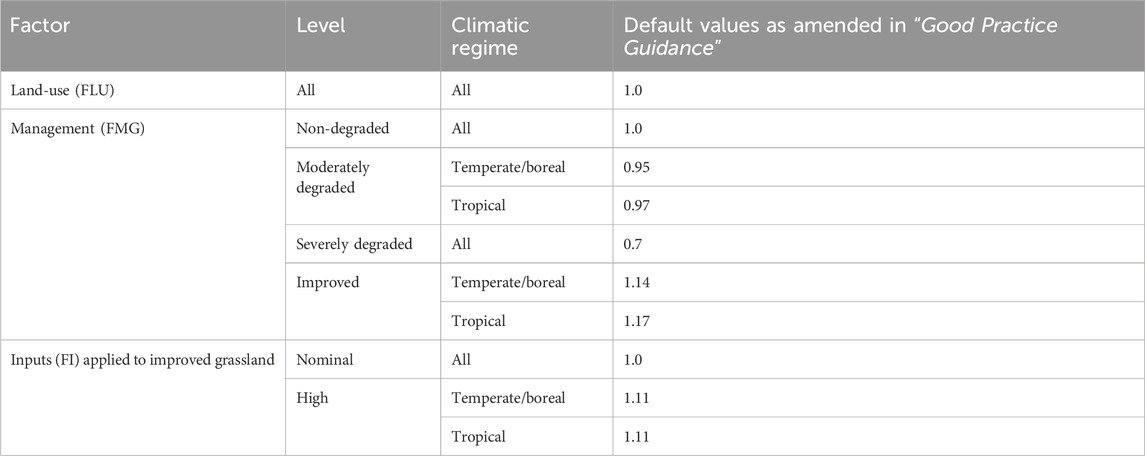
Table 3. SOC impact factors for Chinese grassland management.
4 Results
4.1 Model accuracy verification
The land use pattern in 2020 were simulated based on the land expansion data of Hubei Province from 2010 to 2020 and the development potential of each land use type, and the land use simulation data in 2020 were validated by using the “Confusion Matrix and Fom” module of the PLUS model. The validation process involves comparing the 2020 actual land use data with the 2020 simulated data in the module, which will automatically generate the Kappa coefficient and overall accuracy by calculating the confusion matrix, and it will calculate the Figure of Merit (Fom) result. The results showed that the Kappa coefficient was 0.89, the overall accuracy was 0.91, and the Fom was 0.20. The accuracy validation results showed that the PLUS model has good generalization and high accuracy, and can be applied to the land use data in Hubei Province under the future scenario (Figure 4).
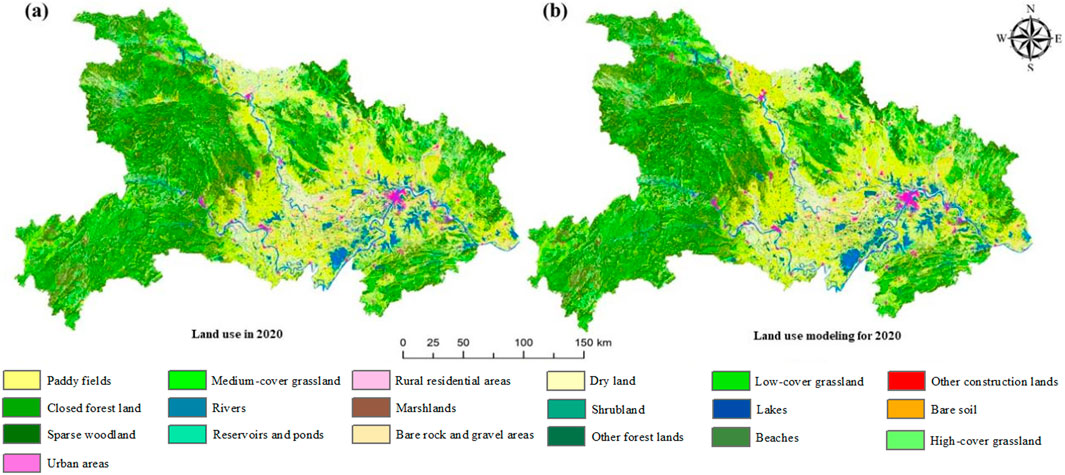
Figure 4. Comparison between the current land use situation in Hubei Province and PLUS simulation in 2020: (a) Original land use in 2020; (b) Simulation result of land use in 2020.
4.2 Results of multi-scenario simulations of land-use change
Under different scenario constraints, the results of land use simulation in Hubei Province in 2030 and 2060 are different, as shown in Figures 5, 6. The areas of cropland, forest land, and grassland under different scenarios in 2030 and 2060 have been statistically analyzed, as shown in Tables 4, 5. Under the economic development scenario in 2030, the areas of urban land and rural settlements show an increasing trend, and the area of urban land changes most significantly, increasing by 374.24 km2, and the areas of urban land, rural settlements, and other construction land are collectively referred to as construction land, and the total area of construction land is the highest among the three scenarios, at 6,812.54 km2. To avoid errors arising from rough categorization, cropland and forest land were classified according to subcategories in the original data, with differences in their carbon density considered during calculations. This consideration has also been exemplified in other studies. For instance, research by Zhu et al. (2025) incorporated the differences in carbon density among subdivided vegetation types. Cropland is divided into paddy fields and dry land. The total area of cropland decreases the most under three scenarios. The significant shift of dry land to other types of land use has led to the reduction in the total area of cropland. Forest land is divided into closed forest land, shrubland, sparse woodland and other forest land, and while the area of closed forest land and other forest land is decreasing, the increase in the area of shrubland and sparse woodland results in an increasing trend in the total area of forest land. Under the natural development scenario, dry land still shows the trend of transferring to other land use types, but due to the change in its area is small, the change in the overall surface value of cropland is also small. The cropland under the natural development scenario as a whole shows the smallest change in area among the three scenarios, with a decrease of only 244.49 km2. The total area of grassland under this scenario shows the smallest change in area when compared with that of the 2020 scenario, and the total area of forest land is higher than that of the economic development scenario, while the area of construction land is higher than that of the economic development scenario. The total area of forest land is higher than that of the economic development scenario, while the total area of construction land is lower than that of the economic development scenario. In contrast, under the ecological priority scenario, a larger area of shrub forest and open forest land is transferred, making the total area occupied by forest land the highest among the three scenarios (92,911.65 km2), which is an increase of 627.87 km2 compared with the area of forest land in 2020, while the area occupied by construction land is the lowest under the three scenarios, and therefore the area of construction land transfer to other land types is the highest under the ecological priority scenario. By comparing the three scenarios, it is found that mainly cropland is being transferred.

Figure 5. Simulation results of land use in Hubei Province under different scenarios in 2030: (a) Economic development scenarios; (b) Natural development scenarios; (c) Ecological priority scenarios.
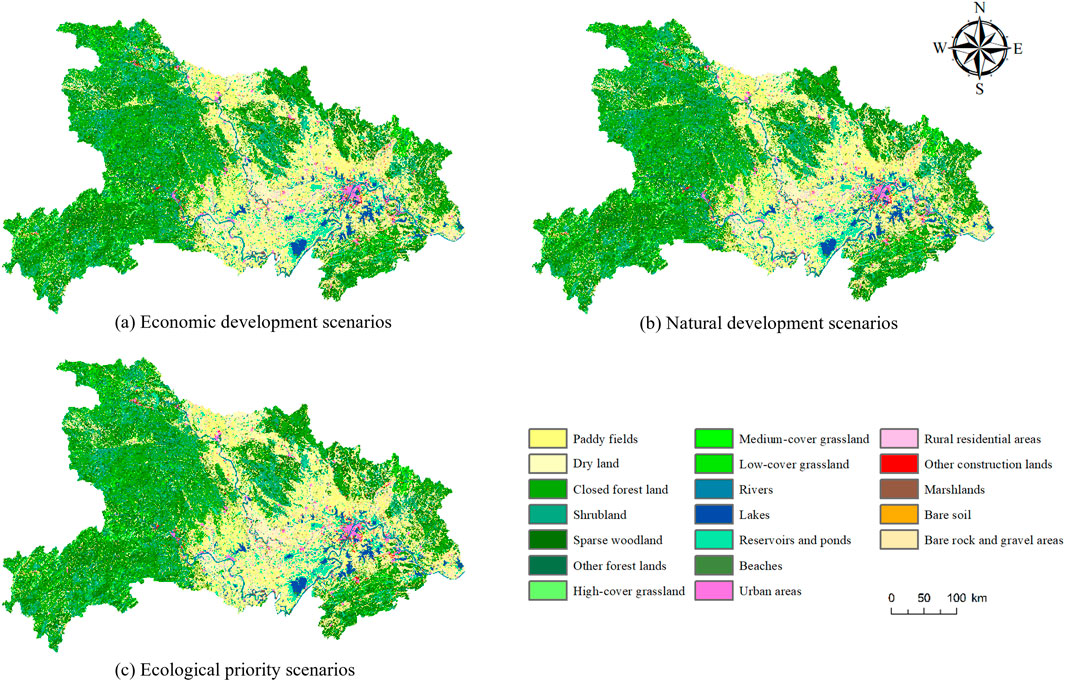
Figure 6. Simulation results of land use in Hubei Province under different scenarios in 2060: (a) Economic development scenarios; (b) Natural development scenarios; (c) Ecological priority scenarios.
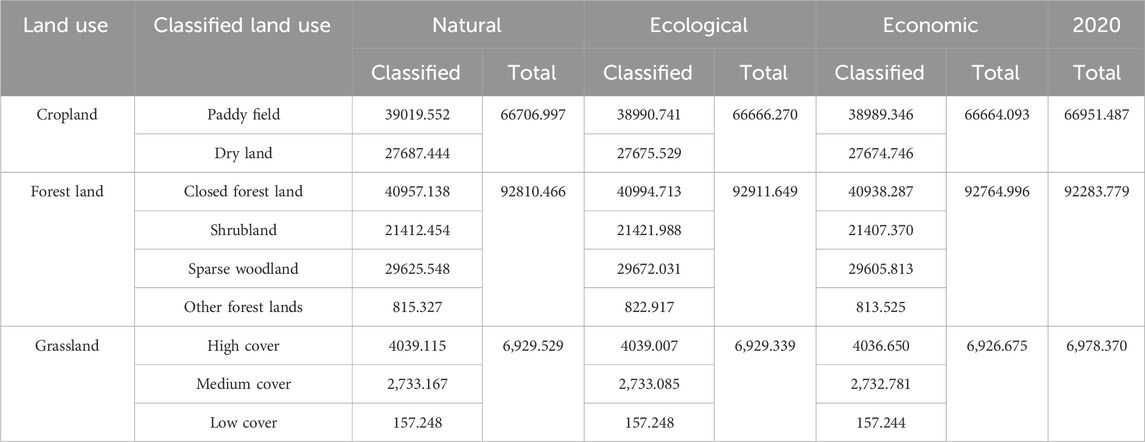
Table 4. The areas of cropland, forest land, and grassland under different scenarios in 2030 (Unit: km2).
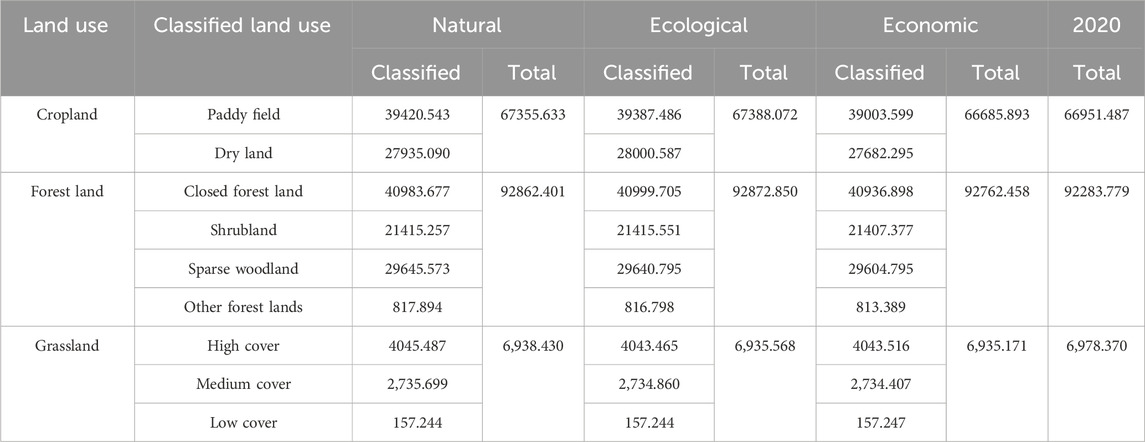
Table 5. The areas of cropland, forest land, and grassland under different scenarios in 2060 (Unit: km2).
The 2060 economic development scenario has the smallest total cropland area of the three scenarios due to a larger area of dryland shifting, and the total cropland area decreases by 265.60 km2 compared to 2020. The decrease in the area of high-coverage and medium-coverage grassland results in a decrease in the area of grassland, and the decrease in the area of high-coverage and medium-cover grassland results in a decrease in the area of grassland. Although the area of grassland is also reduced compared to 2020, the reduction is smaller. The area of urban land and rural settlements increases by 375.23 km2, which makes the construction land under this scenario cover the largest area among all scenarios, with an area of 6,810.57 km2. Under the natural development scenario, the area of cropland is increasing compared with 2020, with an area of 67,355.63 km2, and the area of grassland is decreasing, but the decrease is the lowest among the three scenarios. In the eco-priority scenario, the area of shrub forests and open forests increases by 666.97 km2, which is larger than the decrease in the area of closed forest land and other forest land, so the area of total forest land increases, and the area of total forest land is the highest among the three scenarios, with an increase of 589.17 km2 compared with the year 2020. Compared with the other two scenarios, this scenario has the smallest area of construction land, with an area of 6,802.45 km2, and the area of cropland and forest land is still increasing under this scenario.
4.3 Carbon sinks of land management in various ecosystems
4.3.1 Cropland carbon sequestration
From 2020 to 2030, under the economic scenario, the increase in soil organic carbon stock in cropland management in Hubei Province is approximately 5.9496 × 10⁵ MgCyr−1. Under the ecological scenario, it is approximately 5.9498 × 10⁵ MgCyr−1, and under the natural scenario, it is approximately 5.9535 × 10⁵ MgCyr−1. From 2030 to 2060, under the economic scenario, the increase is approximately 5.9519 × 10⁵ MgCyr−1, under the ecological scenario, it is approximately 6.0141 × 10⁵ MgCyr−1, and under the natural scenario, it is approximately 6.0111 × 10⁵ MgCyr−1. The spatial distribution of agricultural carbon sequestration in Hubei Province is similar under the six scenarios, mainly distributed in the central and western regions where cropland is more extensive. This aligns with findings from some scholars: He and Jiang (2023) demonstrate that central Hubei Province was the most concentrated area for cropland carbon sinks from 2000 to 2020, while the mountainous western Hubei exhibited minimal carbon stock loss. The Jianghan Plain in central Hubei, characterized by flat terrain and deep soil layers, features a contiguous concentration of cropland suitable for large-scale intensive agricultural production, making it a high-value agricultural carbon sink zone. In contrast, the western mountainous regions of Hubei supplement cropland carbon sinks through ecological compensation measures and specialized agricultural practices (Zhang et al., 2025). There are 11 counties with significantly increased soil organic carbon stock in cropland management, including Zhongxiang City, Jianli County, Zaoyang City, Xiangzhou District, Tianmen City, Shayang County, Gong’an County, Jingshan City, and Xiantao City. Among the three scenarios, the natural scenario has the largest cropland management carbon sink, while the economic scenario has the smallest (Figure 7).
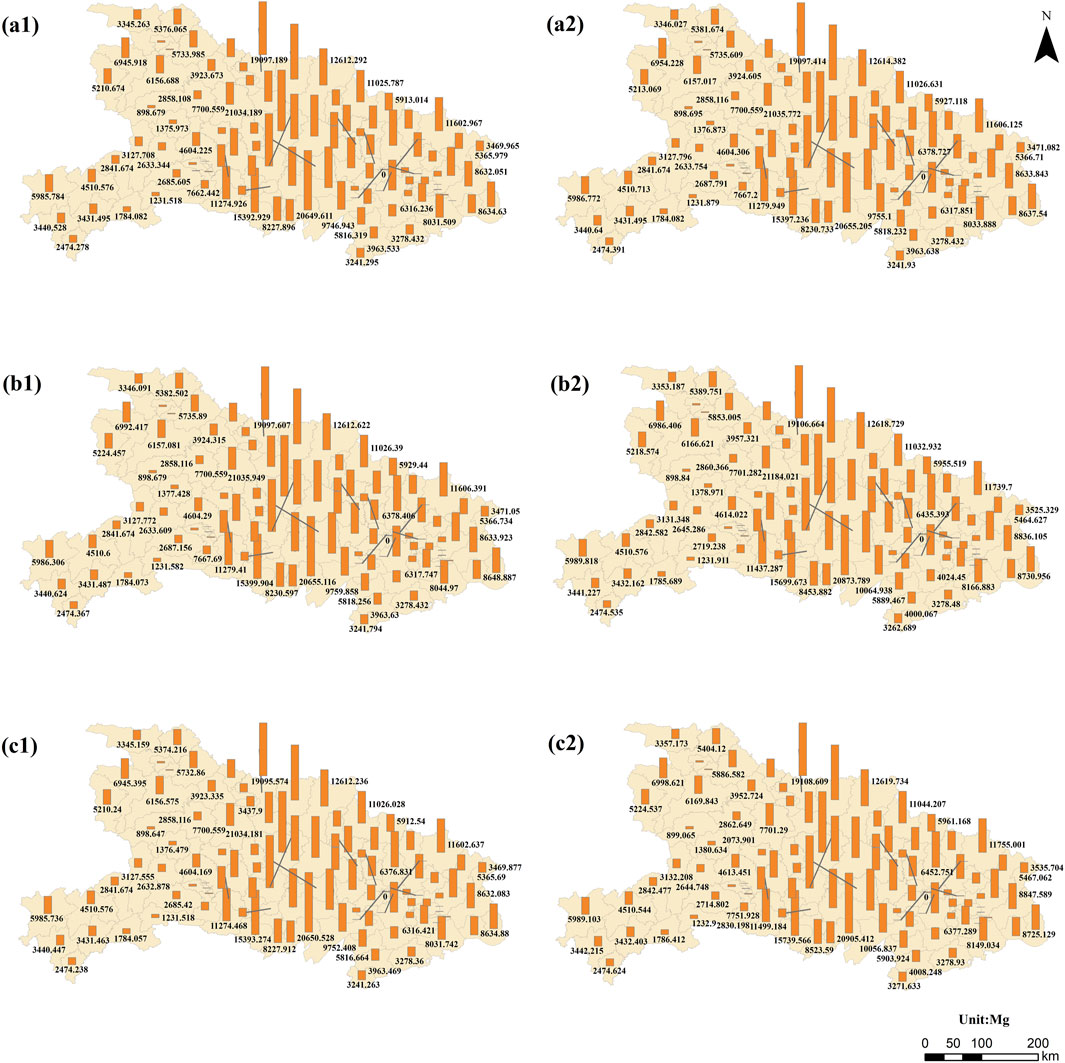
Figure 7. Cropland management carbon sinks by county in Hubei Province from 2020 to 2030: (a1) cropland management carbon sinks for the economic development scenario; (b1) cropland management carbon sinks for the natural development scenario; (c1) cropland management carbon sinks for the eco-priority scenario; and cropland management carbon sinks by county in Hubei Province from 2030 to 2060: (a2) cropland management carbon sinks for the economic development scenario; (b2) cropland management carbon sinks for the natural development scenario; and (c2) cropland management carbon sinks for the eco-priority scenario.
4.3.2 Grassland carbon sequestration
From 2020 to 2030, under the economic scenario, the increase in soil organic carbon stock in grassland management in Hubei Province is approximately 4502.057 MgCyr−1. Under the ecological scenario, it is approximately 4503.789 MgCyr−1, and under the natural scenario, it is approximately 4503.913 MgCyr−1. From 2030 to 2060, under the economic scenario, the increase is approximately 4507.592 MgCyr−1, under the ecological scenario, it is approximately 4507.788 MgCyr−1, and under the natural scenario, it is approximately 4509.680 MgCyr−1. The spatial distribution of grassland carbon sequestration is generally consistent under the six scenarios. Counties with significantly increased soil organic carbon stock in grassland management include Lichuan City, Yunyang District, Yunxi County, Macheng City, and Badong County. The range of changes under the three scenarios is different: from 2020 to 2030, the range of significant increases in grassland management carbon sinks is 265.007–428.494 MgCyr−1 under the economic scenario, 265.006–428.493 MgCyr−1 under the ecological scenario, and 265.022–428.490 MgCyr−1 under the natural scenario; from 2030 to 2060, the range of significant increases in grassland management carbon sinks is 265.161–428.501 MgCyr−1 under the economic scenario, 265.152–428.600 MgCyr−1 under the ecological scenario, and 265.288–428.592 MgCyr−1 under the natural scenario. The spatial distribution of grassland carbon sinks is strongly linearly related to grassland area, so the spatial distribution of grassland under the three scenarios is similar (Figure 8).
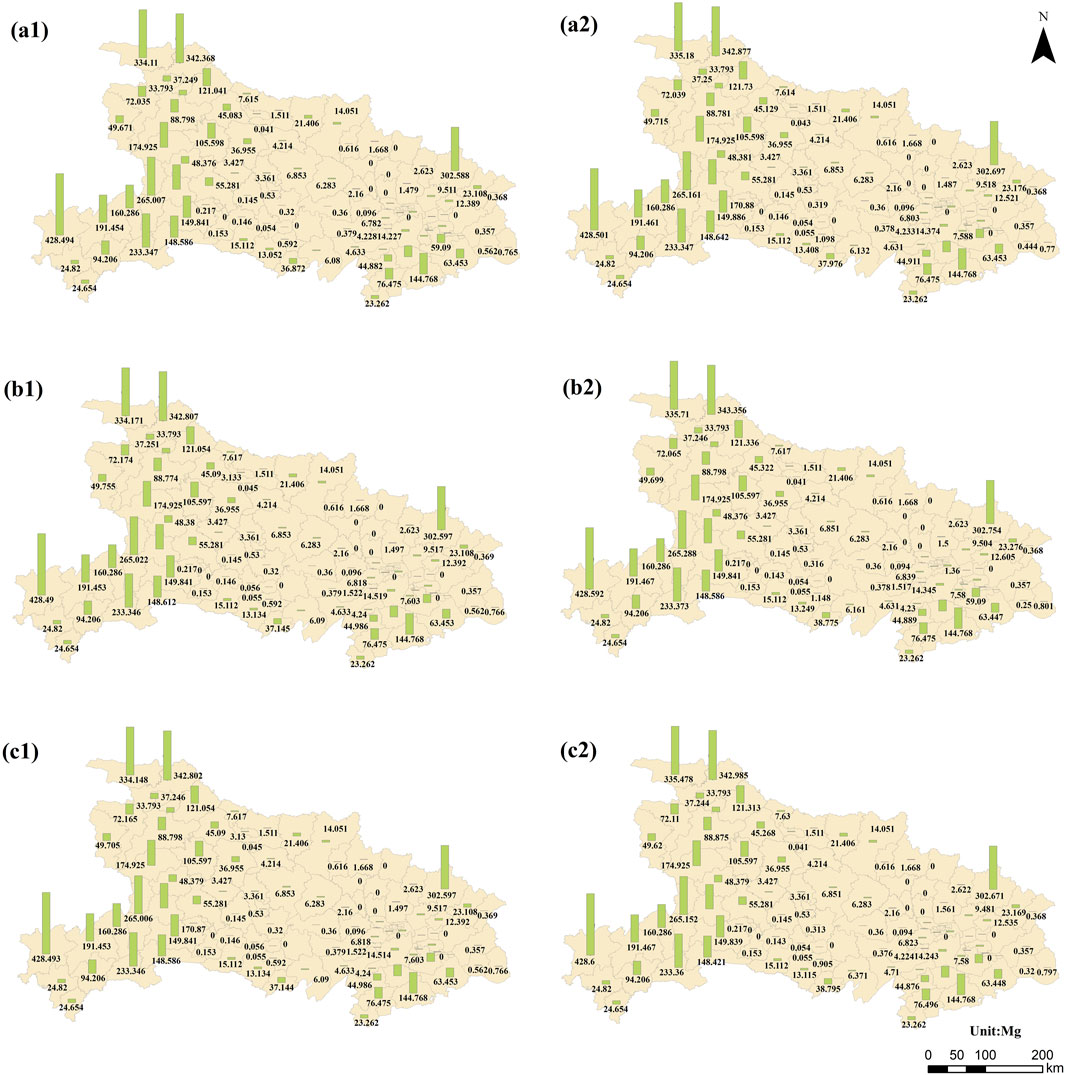
Figure 8. Grassland management carbon sinks by county in Hubei Province from 2020 to 2030: (a1) grassland management carbon sinks for the economic development scenario; (b1) grassland management carbon sinks for the natural development scenario; (c1) grassland management carbon sinks for the ecological priority scenario; and grassland management carbon sinks by county in Hubei Province from 2030 to 2060: (a2) grassland management carbon sinks for the economic development scenario; (b2) grassland management carbon sinks for the natural development scenario; (c2) grassland management carbon sinks for the ecological priority scenario.
4.3.3 Changes in forest carbon stock under different scenarios
In this study, we reflect the changing trends in the overall forest carbon stock by calculating forest management carbon emissions and issue early warnings for forest degradation risks based on these emissions. From 2020 to 2030, under the economic scenario, forest management carbon decreased by about 6.015 TgCyr−1 in Hubei Province. Under the ecological scenario, it decreased by about 6.025 TgCyr−1, and under the natural scenario, it decreased by about 6.018 TgCyr−1. From 2030 to 2060, under the economic scenario, forest management carbon decreased by about 6.015 TgCyr−1, under the ecological scenario, it decreased by about 6.023 TgCyr−1, and under the natural scenario, it decreased by about 6.022 TgCyr−1. Areas with fewer emissions included Jianghan District, Qiaokou District, Jiang’an District, Qingshan District, Hanyang District, Shashi District, Wuchang District, Hannan District. However, the range of changes varied: from 2020 to 2030, the range of forest management carbon emissions under the economic scenario was 0.182–0.278 TgCyr−1, under the ecological scenario it was 0.184–0.278 TgCyr−1, and under the natural scenario it was 0.183–0.278 TgCyr−1. From 2030 to 2060, the range under the economic scenario was 0.184–0.278 TgCyr−1, under the ecological scenario it was 0.184–0.278 TgCyr−1, and under the natural scenario it was 0.184–0.278 TgCyr−1. In all three scenarios, ecological development had the highest forest management carbon emissions, followed by natural development and then economic development, which also reflects the ranking of total forest stock across the three scenarios (Figure 9).
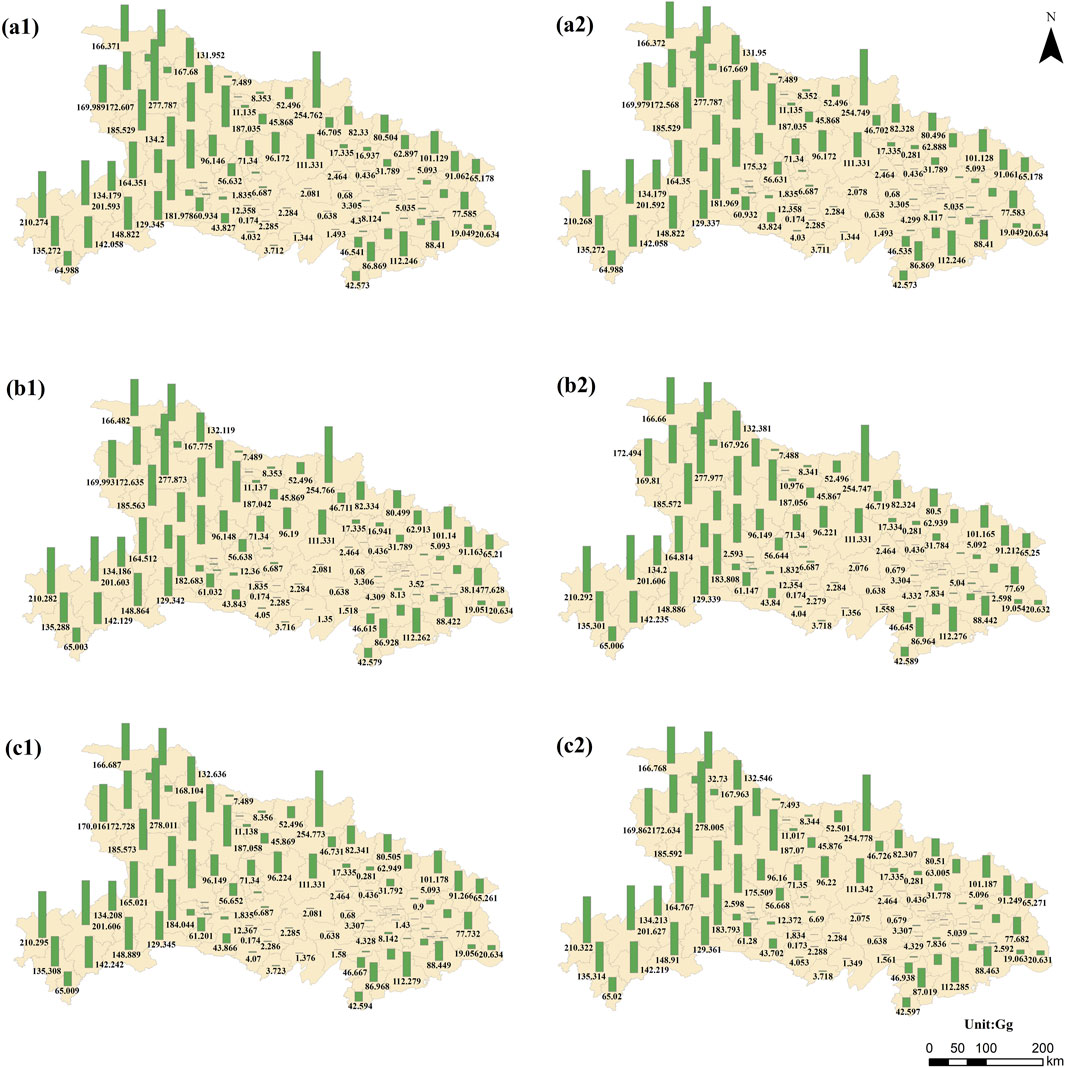
Figure 9. Carbon sources for forest management in counties in Hubei Province from 2020 to 2030: (a1) Carbon sources for forest management in the economic development scenario; (b1) Carbon sources for forest management in the natural development scenario; (c1) Carbon sources for forest management in the ecological priority scenario; and carbon sources for forest management in counties in Hubei Province from 2030 to 2060: (a2) Carbon sources for forest management in the economic development scenario; (b2) Carbon sources for forest management in the natural development scenario; (c2) Carbon sources for forest management in the ecological priority scenario.
5 Discussion
The land use simulation in Hubei Province shows large changes in cropland and construction land in 2030 and 2060 under the three scenarios of economy, nature and ecology. Compared with 2020, the area of cropland decreases in all three scenarios in 2030, while forest land and waters increase, indicating that the ecological space occupies an elevated area. This aligns with the requirements outlined in the study by Hu et al. (2012) regarding enhancing forestry carbon sink capacity to assist China in achieving its “dual carbon” goals. By 2060, the area of cropland decreases only in the economic development scenario, increases in the other scenarios, forest land continues to increase, and waters vary. Future land changes in Hubei Province are concentrated in cropland and construction land, while forest land shows an increasing trend. The study by Tang et al. (2020) emphasizes the potential future carbon loss in Hubei Province caused by the encroachment of forest land due to farmland expansion. The expansion of forest land observed in the results of this study demonstrates a certain degree of compensation for such carbon loss. As an important grain producing area in China, Hubei Province must safeguard the amount of cropland to ensure the stable development of agriculture. In this process, the regional development pattern of “one main and two wings” in Hubei Province emphasizes the radiation role of Wuhan City Circle, which promotes the improvement of the province’s economic contribution to carbon emissions, and at the same time, it needs to coordinate the ecological compensation between central and western Hubei to promote the complementarity of advantages and to realize the dislocation development. This aligns with He et al. (2018)’s findings on ecological compensation measures in Hubei Province and the global significance of ecological compensation for carbon stock changes.
The results of this study indicate that the carbon stock of forest land is significantly larger than that of cropland and grassland, and changes in forest land area play a decisive role in managing carbon sinks in Hubei Province, which has been corroborated by multiple studies (Sohl and Sayler, 2008; Etemadi et al., 2018; Sun et al., 2022; Tian et al., 2022). Therefore, it is necessary to protect the ecological balance while developing and focus on carbon sinks mainly from forest land. Meanwhile, through rational planning of construction land and cropland, it will promote smart growth and rational transfer of construction land in the Wuhan City Circle to enhance carbon sinks and reduce the total amount of carbon emissions and the occupation of forest land, thus increasing the total amount of carbon sinks in Hubei Province (Wei et al., 2020; Tan et al., 2024).
Based on the analysis of the carbon sink data of Hubei Province under the three scenarios in 2020, 2030, and 2060, the following conclusions were drawn: in terms of carbon sinks for grassland management, the ecological development scenario has the highest carbon sink, followed by the natural development scenario, and the lowest is the economic development scenario; In terms of carbon sinks for cropland management, the ecological scenario has a higher carbon sink than the economic scenario, while the natural scenario exceeds the ecological scenario. This conclusion differs from the findings of He et al. (2018) and He and Jiang (2023), whose study estimated that under natural scenarios, cropland carbon sink loss in Hubei Province was higher than under ecological priority scenarios. This may be due to the fact that in the ecological scenario, carbon sinks are primarily concentrated in forest areas, resulting in a minimal difference in cropland carbon sinks between the ecological and natural scenarios. The ecological priority scenario in this study increased the probability of land use conversion from cropland and grassland to forest land, which is also one of the reasons contributing to this outcome. The research by Tang et al. (2020) revealed that cropland expansion encroaching on forest land and other ecological can also lead to significant carbon loss, further demonstrating that this disparity in cropland carbon sink characteristics aligns with ecological priority objectives.
Under three different development scenarios, the areas at risk for various types of carbon sinks differ. Under the economic scenario, from 2020 to 2030, cropland carbon sinks in Xiangzhou District and Zhushan County are the most severely degraded, with a higher risk of degradation. From 2030 to 2060, cropland carbon sinks in Xiangzhou District and Wuxue City continue to decrease significantly, with a higher risk of degradation, and need to be emphasized. The study by Zhang et al. (2025) indicates that the spatial center of gravity of the cropland carbon flow ecological network in Hubei Province is located in central Hubei and is gradually shifting eastward, which aligns with the warned regional change trends highlighted in this study. This imposes requirements on the warned counties to maintain cropland area and uphold the “cropland protection redline” while pursuing economic development. In terms of grassland management, from 2020 to 2030, grassland carbon sinks in places such as Yingshan County and Huangmei County are at risk of declining, while grassland carbon sinks in Xiangcheng District and Jingzhou District have limited increases, and this trend continues until 2060, so it is recommended that attention be paid to these areas. In terms of forest management, from 2020 to 2030, forest carbon emissions in Qingshan District and Jiangan District will increase by a relatively small amount. This distribution characteristic is further corroborated by the conclusion in the study by Peng et al. (2021) that the ecosystem service value is lowest in the city center of Wuhan and its surrounding urban areas. From 2030 to 2060, forest carbon emissions in Zhushan County and Suizhou County will decrease significantly, meanwhile the strong linear relationship between forest carbon emissions and the total amount of forests, there may be a risk of forest degradation in these areas, which is recommended to be paid attention to. The study by Liu and Yu (2023) indicates that prior to 2020, forests in the central areas of major cities in Hubei Province experienced severe degradation, while mountainous areas exhibited extensive but mild forest degradation. This aligns with the pre-2020 LUCC trends used as the basis for the simulations in this study. Therefore, the forest degradation areas warned in this study require heightened attention to the risk of forest carbon sink loss. In particular, mountainous regions, as primary carbon sink zones, need to prevent the accumulation of substantial carbon sink losses resulting from prolonged mild degradation.
Under the ecological scenario, in 2020–2030, the cropland carbon sinks of Zhushan County, Yunyang District, and Xiantao City decrease, and this trend continues until 2060, with a higher risk. In 2020–2030, the grassland carbon sinks of Yingshan County, Jichun County, and Huangmei County have a higher risk of decreasing, and the grassland carbon sinks of Shashi District, and Jingzhou District have a limited increase, and this trend continues until 2060. In 2020–2030, the Qingshan District and Jiangan District have a small increase in forest management carbon emissions; from 2030 to 2060, Zigui County, Jiangxia District and Badong County have a significant decrease in forest management carbon emissions and a high risk of degradation. The aforementioned districts and counties still face a high risk of carbon sink loss in ecological land under ecological scenarios, and this trend is projected to persist long-term, which necessitates focused attention. This study needs to address the following points in future research:
1) Failure to account for drastic vegetation changes under significant climatic shifts or breakthroughs affecting carbon sink capacity (Wu et al., 2025). Future work should enhance the capability to estimate carbon sink variation risks under uncertainty scenarios.
2) Room for improvement in LUCC prediction methods. While this study conducted large-scale, high-resolution provincial-level terrestrial carbon sink change simulations using the advanced PLUS model, future efforts will refine land use simulation models to predict carbon stock and sink changes more accurately across broader regions. Additionally, improving model efficiency will enable timelier carbon sink risk warnings.
3) Regional variability in carbon sink capacity within the same land use type was not considered. Lyu et al. (2023) demonstrated in their carbon sink assessments in Guangdong Province that carbon sinks may differ across regions even for identical land use types, a factor omitted in this study. Future research will incorporate more granular environmental factors influencing carbon sinks, coupling land use types with other surface-level drivers to simulate and predict carbon stock and sink changes with greater precision.
6 Conclusion
This paper provides a high-resolution method for simulating changes in carbon stock, carbon sink loss, and carbon emission risks associated with land use changes. Supported by block parallel technology, this project employs high-resolution land cover simulation products generated by the Patch-Generated Land Use Scenario Simulation Model (PLUS), combined with changes in soil organic carbon and carbon stock due to the management of croplands and grasslands. Based on the aforementioned methodology, the primary achievements of this study lie in estimating historical carbon emissions caused by land use, simulating large-scale, high-resolution carbon stock in Hubei Province, and providing district-level early warnings for carbon sink loss risks. This addresses the issue of low resolution in current studies on carbon stock change extrapolation, which makes it challenging to conduct fine simulations and loss risk warnings for carbon stock and sink patterns on a large scale.
According to the high-resolution method proposed for estimating and simulating variations in carbon sinks and carbon stock, land use simulation results for Hubei Province under natural development, ecological priority, and economic development scenarios were obtained. These results demonstrate that from 2020 to 2030 and 2060, croplands and construction lands are the main land types undergoing transition, while forest lands have shown a steadily increasing trend. This indicates that promoting smart growth of the Wuhan city cluster and reasonable transition of construction land to enhance the carbon sink capacity of eastern Hubei Province and reduce the region’s total carbon emissions is crucial for maintaining ecological balance, protecting the main carbon sinks, and ensuring the collaborative development of various land types in Hubei Province while promoting an increase in total carbon sinks.
Based on the managed carbon sink data for Hubei Province in 2020 and projections for 2030 and 2060 under the three scenarios, we find that grassland management carbon sinks are highest under the ecological priority scenario, followed by the natural development scenario, and lowest under the economic development scenario. Cropland management carbon sinks are highest under the natural development scenario, followed by the ecological priority scenario, and lowest under the economic development scenario. Forest management carbon emissions are highest under the ecological priority scenario, followed by the natural development scenario, and lowest under the economic development scenario. Additionally, between 2020 to 2030, and 2060, we identified several districts and counties that are at greater risk in terms of cropland management carbon sinks, grassland management carbon sinks, and forest management carbon emissions under different scenarios, which are specifically listed in the paper.
Based on the forest management carbon sink results predicted by the study and the identified risk areas in Hubei Province, the following policy recommendations are proposed: In terms of optimizing ecological spaces, establish an intelligent carbon sink monitoring platform, strengthen zoning control of ecological spaces in Hubei Province in accordance with the Outline of the Hubei Provincial Basin Comprehensive Management and Integrated Development Plan, and strictly monitor ecological conservation redlines. In line with the Hubei Provincial High-Standard Farmland Construction Plan, create carbon sequestration demonstration zones in high-risk areas. For promoting regional collaborative development, implement the ecological community requirements of the Yangtze River Economic Belt Development Plan Outline, jointly build a clean energy corridor by effectively utilizing hydropower resources in western Hubei and photovoltaic resources in the central plains, and establish a carbon market alliance for urban clusters in the middle reaches of the Yangtze River to facilitate cross-provincial trading of carbon emission rights and energy usage quotas.
In summary, the method proposed in this paper enables large-scale, high-resolution simulation of carbon stock and carbon sink loss, and precise risk early warning. It allows for the fine simulation of carbon sink patterns under different land space planning scenarios, enabling precise risk warning. The results obtained through this method underscore the importance of protecting cropland, optimizing ecological space, and promoting regional collaborative development to ensure the coordinated development of various land types in Hubei Province and promote total carbon sink growth. Future development in Hubei Province should focus on enhancing carbon sink functions and ecological protection to promote low-carbon development and green growth.
Data availability statement
The original contributions presented in the study are included in the article/supplementary material, further inquiries can be directed to the corresponding author.
Author contributions
JL: Conceptualization, Funding acquisition, Project administration, Resources, Validation, Writing – original draft. BN: Data curation, Formal Analysis, Investigation, Validation, Visualization, Writing – original draft. RS: Conceptualization, Resources, Supervision, Writing – review and editing. YX: Project administration, Supervision, Writing – review and editing. GY: Conceptualization, Project administration, Supervision, Writing – review and editing. YS: Resources, Supervision, Validation, Writing – review and editing. YY: Resources, Supervision, Validation, Writing – review and editing. XL: Conceptualization, Funding acquisition, Methodology, Resources, Validation, Writing – review and editing.
Funding
The author(s) declare that financial support was received for the research and/or publication of this article. This research was funded by the National Natural Science Foundation of China (Grant No. 42271437).
Conflict of interest
Author YX was employed by Foshan Surveying Mapping and Geoinformation Research Institute Co., Ltd.
The remaining authors declare that the research was conducted in the absence of any commercial or financial relationships that could be construed as a potential conflict of interest.
Generative AI statement
The authors declare that no Generative AI was used in the creation of this manuscript.
Correction note
This article has been corrected with minor changes. These changes do not impact the scientific content of the article.
Publisher’s note
All claims expressed in this article are solely those of the authors and do not necessarily represent those of their affiliated organizations, or those of the publisher, the editors and the reviewers. Any product that may be evaluated in this article, or claim that may be made by its manufacturer, is not guaranteed or endorsed by the publisher.
References
Arshad Ahmad, K., Sufyan Ullah, K., Muhammad Abu Sufyan, A., Adnan, S., Yuling, G., Muhammad, A., et al. (2022). Role of institutional quality and renewable energy consumption in achieving carbon neutrality: case study of G-7 economies. Sci. Total Environ. 814, 152797. doi:10.1016/j.scitotenv.2021.152797
Cao, W., and Zhong, D. (2023). Study on the impact of China’s carbon emission trading pilot on carbon intensity and carbon emission reduction in pilot areas. Trade Fair Econ. (05), 104–107. doi:10.19995/j.cnki.CN10-1617/F7.2023.05.104
Chang, R., Fu, B., Liu, G., Wang, S., and Yao, X. (2012). The effects of afforestation on soil organic and inorganic carbon: a case study of the Loess Plateau of China. CATENA 95, 145–152. doi:10.1016/j.catena.2012.02.012
Chen, G., Li, X., Liu, X., Chen, Y., Liang, X., Leng, J., et al. (2020). Global projections of future urban land expansion under shared socioeconomic pathways. Nat. Commun. 11 (1), 537. doi:10.1038/s41467-020-14386-x
Chen, Y., Zhang, F., and Lin, J. (2025). Projecting future land use evolution and its effect on spatiotemporal patterns of habitat quality in China. Appl. Sci. 15 (3), 1042. doi:10.3390/app15031042
De La Peña, L., Guo, R., Cao, X., Ni, X., and Zhang, W. (2022). Accelerating the energy transition to achieve carbon neutrality. Resour. Conservation Recycl. 177, 105957. doi:10.1016/j.resconrec.2021.105957
Deng, L., Zhu, G., Tang, Z., and Shangguan, Z. J. G. E.Conservation (2016). Global patterns of the effects of land-use changes on soil carbon stocks. Glob. Ecol. Conservation 5, 127–138. doi:10.1016/j.gecco.2015.12.004
Etemadi, H., Smoak, J., and Karami, J. (2018). Land use change assessment in coastal mangrove forests of Iran utilizing satellite imagery and CA–Markov algorithms to monitor and predict future change. Environ. Earth Sci. 77, 208. doi:10.1007/s12665-018-7392-8
Friedlingstein, P., O'Sullivan, M., Jones, M., Andrew, R. M., Hauck, J., Olsen, A., et al. (2020). Global carbon budget 2020. Earth Syst. Sci. Data 12, 3269–3340. doi:10.5194/essd-12-3269-2020
Ge, Q., Dai, J., He, F., Pan, Y., and Wang, M. (2008). Research on land use, land cover change, and carbon cycle in China over the past 300 years. Sci. Sin. (Terrae) (02), 197–210. Available online at: https://kns.cnki.net/kcms2/article/abstract?v=Jy1bRTva-nWc3VHGehlyd0EqsgMnhD9OP860FMklsMaeI9A9qCg7Xwh3gC7mpJCIBGOh1QkULgNK7M-llnvL8GRR1opQRMciiFfmfChIHQ_Gmi1S9f51BUs--wH3FbFNnceZ0rmrpHcb8sepSJm-FVtOTH7FOuMpfEddF8aAi8JzzkAjmasqd5M3KfBzL4sS0Xcuewe1Whw=&uniplatform=NZKPT&language=CHS.
Guo, R., Wang, J., Bing, L., Tong, D., Ciais, P., Davis, S. J., et al. (2021a). Global CO2 uptake by cement from 1930 to 2019. Earth Syst. Sci. Data 13, 1791–1805. doi:10.5194/essd-13-1791-2021
Guo, S., Yan, D., Hu, S., and Zhang, Y. (2021b). Modelling building energy consumption in China under different future scenarios. Energy 214, 119063. doi:10.1016/j.energy.2020.119063
He, Q., Zeng, C., Xie, P., Liu, Y., and Zhang, M. (2018). An assessment of forest biomass carbon storage and ecological compensation based on surface area: a case study of Hubei Province, China. Ecol. Indic. 90, 392–400. doi:10.1016/j.ecolind.2018.03.030
He, Q. S., and Jiang, X. (2023). Measuring impacts of temporal and spatial changes of cultivated land on carbon storage: a case study of Hubei Province. Acta Ecol. Sin. 43 (24), 10413–10429. doi:10.20103/j.stxb.202306061192
Hu, A. (2021). China's goal of achieving carbon peak by 2030 and its main approaches. J. Beijing Univ. Technol. Sci. Ed. 21 (03), 1–15. doi:10.12120/bjutskxb202103001
Hu, Q., Wang, S.-l., Chen, L.-c., Zhang, W.-d., and Gong, C. (2012). Biomass and carbon density of main forest ecosystems in Hubei Province. cje 31 (07), 1626–1632. Available online at: https://www.cje.net.cn/EN/abstract/abstract20173.shtml.
Hubei_Daily (2020). Hubei designates ecological and environmental management zones with over one-third of land as protected areas. Hubei Dly. 12–22. Available online at: https://www.hubei.gov.cn/zwgk/hbyw/hbywqb/202012/t20201222_3097333.shtml.
Ipcc (2000). Good practice guidance and uncertainty management in national greenhouse gas Inventories, 1. Available online at: https://www.ipcc.ch/publication/good-practice-guidance-and-uncertainty-management-in-national-greenhouse-gas-inventories/.
Ipcc (2006). IPCC guidelines for national greenhouse gas inventories. Energy 2. Available online at: https://www.ipcc-nggip.iges.or.jp/public/2006gl/vol2.html.
Jin, L., Li, Y. E., Gao, Q., Liu, Y., Wan, Y., Qin, X., et al. (2008). Estimate of carbon sequestration under cropland management in China. Sci. Agric. Sin. 41, 734–743. doi:10.3864/j.issn.0578-1752.2008.03.014
Kaplan, J., Krumhardt, K., Ellis, E., Ruddiman, W., Lemmen, C., and Klein Goldewijk, K. (2011). Holocene carbon emissions as a result of anthropogenic land cover change. Holocene 21, 775–791. doi:10.1177/0959683610386983
Kuang, W., Liu, J., Dong, J., Chi, W., and Zhang, C. (2016). The rapid and massive urban and industrial land expansions in China between 1990 and 2010: a CLUD-based analysis of their trajectories, patterns, and drivers. Landsc. Urban Plan. 145, 21–33. doi:10.1016/j.landurbplan.2015.10.001
Lai, L., Huang, X., Yang, H., Chuai, X., Zhang, M., Zhong, T., et al. (2016). Carbon emissions from land-use change and management in China between 1990 and 2010. Sci. Adv. 2, e1601063. doi:10.1126/sciadv.1601063
Li, Y., Yao, S., Jiang, H., Wang, H., Ran, Q., Gao, X., et al. (2022). Spatial-Temporal evolution and prediction of carbon storage: an integrated framework based on the MOP–PLUS–InVEST model and an applied case study in hangzhou, east China. Land 11 (12), 2213. doi:10.3390/land11122213
Liang, X., Fan, M., Huang, X., Cai, C., Zhou, L., and Wang, Y. (2024a). Spatial distributed characteristics of carbon dioxide emissions based on fossil energy consumption and their driving factors at provincial scale in China. Energy 309, 133062. doi:10.1016/j.energy.2024.133062
Liang, X., Guan, Q., Clarke, K. C., Liu, S., Wang, B., and Yao, Y. (2021). Understanding the drivers of sustainable land expansion using a patch-generating land use simulation (PLUS) model: a case study in Wuhan, China. Comput. Environ. Urban Syst. 85, 101569. doi:10.1016/j.compenvurbsys.2020.101569
Liang, X., Guo, S., Huang, C., Wang, B., Xiao, Y., He, J., et al. (2024b). Modeling the subpixel land-use dynamics and its influence on urban heat islands: impacts of factors and scale, and population exposure risk. Sustain. Cities Soc. 107, 105417. doi:10.1016/j.scs.2024.105417
Lin, J., Li, X., Wen, Y., and He, P. (2023). Modeling urban land-use changes using a landscape-driven patch-based cellular automaton (LP-CA). Cities 132, 103906. doi:10.1016/j.cities.2022.103906
Liu, Q., Lei, Q., Xu, H., and Jia-hai, Y. (2018). China’s energy revolution strategy into 2030. Resour. Conservation Recycl. 128, 78–89. doi:10.1016/j.resconrec.2017.09.028
Liu, W., and Yu, P. (2023). Quantifying synergistic effects of multi-temporal ecosystem service bundles for degraded ecosystem restoration: a case study in Hubei Province, China. Environ. Res. Lett. 18 (9), 094003. doi:10.1088/1748-9326/acea37
Liu, X., Wu, P., Feng, K., Klaus, H., Li, X., Sun, L., et al. (2019). Impacts of urban expansion on terrestrial carbon storage in China. Environ. Sci. & Technol. 53, 6834–6844. doi:10.1021/acs.est.9b00103
Liu, Z., Deng, Z., He, G., Wang, H., Zhang, X., Lin, J., et al. (2022). Challenges and opportunities for carbon neutrality in China. Nat. Rev. Earth & Environ. 3 (2), 141–155. doi:10.1038/s43017-021-00244-x
Lu, X., Zhou, Y., Liu, Y., and Le Page, Y. (2018). The role of protected areas in land use/land cover change and the carbon cycle in the conterminous United States. Glob. Change Biol. 24 (2), 617–630. doi:10.1111/gcb.13816
Lyu, G., Jianchun, Z., Yumei, C. A. I., Chao, M., Shengfa, L. I., and Weilian, C. (2023). Carbon accounting for land use, land-use change and forestry in Guangdong province. Acta Geogr. Sin. 78 (3), 640–657. doi:10.11821/dlxb202303009
Newland, C. P., Zecchin, A. C., Maier, H. R., Newman, J. P., and van Delden, H. (2018). Empirically derived method and software for semi-automatic calibration of Cellular Automata land-use models. Environ. Model. & Softw. 108, 208–239. doi:10.1016/j.envsoft.2018.07.013
Peng, K., Jiang, W., Ling, Z., Hou, P., and Deng, Y. (2021). Evaluating the potential impacts of land use changes on ecosystem service value under multiple scenarios in support of SDG reporting: a case study of the Wuhan urban agglomeration. J. Clean. Prod. 307, 127321. doi:10.1016/j.jclepro.2021.127321
Penman, J., Gytarsky, M., Hiraishi, T., Krug, T., Kruger, D., Pipatti, R., et al. (2003). Intergovernmental panel on climate change: good practice guidance for land use, land-use change and forestry. Vienna: Institute for Global Environmental Strategies for the IPCC.
Piao, S., Fang, J., Ciais, P., Peylin, P., Huang, Y., Sitch, S., et al. (2009). The carbon balance of terrestrial ecosystems in China. Nature 458 (7241), 1009–1013. doi:10.1038/nature07944
Shao, Z., Chen, R., Zhao, J., Xia, C., He, Y., and Tang, F. (2022). Spatio-temporal evolution and prediction of carbon storage in Beijing's ecosystem based on FLUS and InVEST models. Acta Ecol. Sin. 42 (23), 9456–9469. doi:10.5846/stxb202201100094
Shi, J., and Song, G. (2016). Soil type database of China: a nationwide soil dataset based on the second national soil Survey. Soil Surv. 1 (2), 86101. doi:10.11922/csdata.170.2015.0033
Simkin, R., Seto, K., McDonald, R., and Jetz, W. (2022). Biodiversity impacts and conservation implications of urban land expansion projected to 2050. Proc. Natl. Acad. Sci. U. S. A. 119, e2117297119. doi:10.1073/pnas.2117297119
Sohl, T., and Sayler, K. (2008). Using the FORE-SCE model to project land-cover change in the southeastern United States. Ecol. Model. 219 (1-2), 49–65. doi:10.1016/j.ecolmodel.2008.08.003
Song, J., He, X., Zhang, F., Xu, M., Jim, C. Y., Johnson, B., et al. (2024). Analyzing and predicting LUCC and carbon storage changes in xinjiang’s arid ecosystems under the carbon neutrality goal. Remote Sens. 16, 4439. doi:10.3390/rs16234439
Stocker, B. D., Strassmann, K. M., and Joos, F. J. B. (2010). Sensitivity of Holocene atmospheric CO 2 and the modern carbon budget to early human land use: analyses with a process-based model. Biogeosciences 8, 69–88. doi:10.5194/bg-8-69-2011
Stocker, B. D., Yu, Z., Massa, C., and Joos, F. (2017). Holocene peatland and ice-core data constraints on the timing and magnitude of CO2 emissions from past land use. Proc. Natl. Acad. Sci. 114(7), 1492–1497. doi:10.1073/pnas.1613889114
Sun, J., Zhang, Y., Qin, W., and Chai, G. (2022). Estimation and simulation of forest carbon stock in northeast China forestry based on future climate change and LUCC. Remote Sens. 14 (15), 3653. doi:10.3390/rs14153653
Tan, L., L. K, R. T., and Zhang, Z. (2024). Analysis of land use/land cover changes and driving forces during the period 1992–2022: a case study of Jinan City, China. AQUA — Water Infrastructure, Ecosyst. Soc. 73 (3), 584–607. doi:10.2166/aqua.2024.311
Tang, L., Ke, X., Zhou, T., Zheng, W., and Wang, L. (2020). Impacts of cropland expansion on carbon storage: a case study in Hubei, China. J. Environ. Manag. 265, 110515. doi:10.1016/j.jenvman.2020.110515
Tian, L., Tao, Y., Fu, W., Li, T., Ren, F., and Li, M. (2022). Dynamic simulation of land use/cover change and assessment of forest ecosystem carbon storage under climate change scenarios in Guangdong province, China. Remote Sens. 14 (10), 2330. doi:10.3390/rs14102330
Wang, X., Zhang, J., Pang, H., Zheng, L., and Cui, H. (2015). Characteristics of carbon stock and carbon density in the forest ecosystems of Hubei Province. J. Central South Univ. For. & Technol. 35 (10), 93–100. doi:10.14067/j.cnki.1673-923x.2015.10.017
Wei, W., Miao, J., Xia, J., and Wu, J. (2020). Spatial-Temporal evolution characteristics and mechanism of“Three-zone Space”along the Yangtze River Economic Belt in Hubei province from 2010 to 2017. Econ. Geogr. 40 (2), 132–142. doi:10.15957/j.cnki.jjdl.2020.02.015
Wu, H., Lin, A., Xing, X., Song, D., and Li, Y. (2021). Identifying core driving factors of urban land use change from global land cover products and POI data using the random forest method. Int. J. Appl. Earth Observation Geoinformation 103, 102475. doi:10.1016/j.jag.2021.102475
Wu, P., Liu, X., Li, X., and Chen, Y. (2016). Impact of urban expansion on carbon storage in terrestrial ecosystems based on invest model and Ca: a case study of Guangdong province, China. Geogr. Geo-Information Sci. 32 (05), 22–28+36+22. Available online at: https://kns.cnki.net/kcms2/article/abstract?v=Jy1bRTva-nVbRb2MsfNDT6LSbdnbXdjur9BAjospJsrp6IbE4ISqzKf8fRPPH2ki0SiNnRW5aBjCfeHZ9GdCTPB3JMlDGmqejFWbzCO5I_9csIQ_KST3Epihqv2Sc0zzgxAWQff4L_c0-uXeZn_FgIuJMVulEgqKJpdkaUMiTEBalaNsiMrO1jfPd-WiZw_mkahtB4sm_Jo=&uniplatform=NZKPT&language=CHS.
Wu, Y., Zhong, Y., Liu, S., Xu, G., Xiao, C., Wu, X., et al. (2025). Hydrogeodesy facilitates the accurate assessment of extreme drought events. J. Earth Sci. 36 (1), 347–350. doi:10.1007/s12583-024-0123-z
Xuecao, L., Zhang, J., Li, Z., Ty, H., Wu, Q., Yang, J., et al. (2021). Critical role of temporal contexts in evaluating urban cellular automata models. GIScience & Remote Sens. 58, 799–811. doi:10.1080/15481603.2021.1946261
Yang, H., Huang, J., and Liu, D. (2020a). Linking climate change and socioeconomic development to urban land use simulation: analysis of their concurrent effects on carbon storage. Appl. Geogr. 115, 102135. doi:10.1016/j.apgeog.2019.102135
Yang, J., Gong, J., Tang, W., and Liu, C. (2020b). Patch-based cellular automata model of urban growth simulation: integrating feedback between quantitative composition and spatial configuration. Comput. Environ. Urban Syst. 79, 101402. doi:10.1016/j.compenvurbsys.2019.101402
Yang, J., Guo, A., Li, Y., Zhang, Y., and Li, X. (2018). Simulation of landscape spatial layout evolution in rural-urban fringe areas: a case study of Ganjingzi District. GIScience & Remote Sens. 56 (3), 388–405. doi:10.1080/15481603.2018.1533680
Yang, J., Xie, B., and Zhang, D. (2021). Spatio-temporal evolution of carbon stocks in the Yellow River Basin based on InVEST and CA-Markov models. Chin. J. Eco-Agriculture 29 (6), 1018–1029. doi:10.13930/j.cnki.cjea.200746
Yang, Y., Shi, Y., Sun, W., Chang, J., Zhu, J., Chen, L., et al. (2022). Terrestrial carbon sinks in China and around the world and their contribution to carbon neutrality. Sci. Sin. Vitae 52 (4), 534–574. doi:10.1360/SSV-2021-0362
Yu, H. X., Tang, J. L., and Chen, R. Q. (2024). Spatiotemporal evolution characteristics and multi-scale spatial balance and matching analysis of ecosystem service supply and demand in Hubei province. Huan Jing Ke Xue 45 (11), 6477–6488. doi:10.13227/j.hjkx.202312019
Zhang, L., H, L. X., S, G., B, Z. B., M, Z. M., and Y, L. (2025). The formation mechanism and change characteristics of the ecological network of carbon flow of cultivated land in Hubei Province under the “dual carbon” targets. Acta Ecol. Sin. 45 (4), 1599–1612. doi:10.20103/j.stxb.202405020991
Zhang, M., Huang, X., Chuai, X., Yang, H., Lai, L., and Tan, J. (2015). Impact of land use type conversion on carbon storage in terrestrial ecosystems of China: a spatial-temporal perspective. Sci. Rep. 5, 10233. doi:10.1038/srep10233
Zhang, X., Ren, W., and Peng, H. (2022). Urban land use change simulation and spatial responses of ecosystem service value under multiple scenarios: a case study of Wuhan, China. Ecol. Indic. 144, 109526. doi:10.1016/j.ecolind.2022.109526
Zhang, Y., Liu, Y., Wang, Y., Liu, D., Xia, C., Wang, Z., et al. (2020). Urban expansion simulation towards low-carbon development: a case study of Wuhan, China. Sustain. Cities Soc. 63, 102455. doi:10.1016/j.scs.2020.102455
Zhao, M., He, Z., Du, J., Chen, L., Lin, P., and Fang, S. (2019). Assessing the effects of ecological engineering on carbon storage by linking the CA-Markov and InVEST models. Ecol. Indic. 98, 29–38. doi:10.1016/j.ecolind.2018.10.052
Zhu, L., Song, R., Sun, S., Li, Y., and Hu, K. (2022). Land use/land cover change and its impact on ecosystem carbon storage in coastal areas of China from 1980 to 2050. Ecol. Indic. 142, 109178. doi:10.1016/j.ecolind.2022.109178
Keywords: PLUS model, high-resolution simulation, Hubei Province, carbon sink, carbon stock
Citation: Li J, Ning B, Shu R, Xia Y, Yuan G, Shen Y, Yu Y and Liang X (2025) Simulation and assessment of the risk of carbon sink loss in Hubei Province, China. Front. Environ. Sci. 13:1573145. doi: 10.3389/fenvs.2025.1573145
Received: 08 February 2025; Accepted: 02 May 2025;
Published: 21 May 2025; Corrected: 02 June 2025.
Edited by:
Shulei Cheng, Southwestern University of Finance and Economics, ChinaCopyright © 2025 Li, Ning, Shu, Xia, Yuan, Shen, Yu and Liang. This is an open-access article distributed under the terms of the Creative Commons Attribution License (CC BY). The use, distribution or reproduction in other forums is permitted, provided the original author(s) and the copyright owner(s) are credited and that the original publication in this journal is cited, in accordance with accepted academic practice. No use, distribution or reproduction is permitted which does not comply with these terms.
*Correspondence: Guobin Yuan, eXVhbmd1b2JpbkBjdWcuZWR1LmNu