 Yun Tang
 Yuanyuan Wang2
 Quanming Yang
- 1School of Computer Science, Huainan Normal University, Huainan, China
- 2China Water Huaihe Planning, Design and Research Co, LTD, Hefei, China
- 3School of Environment and Spatial Informatics, Suzhou University, Suzhou, China
As a crucial indicator of terrestrial ecosystems, vegetation plays a significant role in reflecting the interactions and coupled coordination between anthropogenic activities and natural ecosystems. Understanding the drivers of vegetation change is paramount for achieving sustainable development of socio-ecological systems. Climate change and anthropogenic activities are the primary influencing factors of vegetation change. Given the current research gap in understanding the impacts of climate factors and anthropogenic activities on vegetation change at different temporal scales within the rapid urbanization process of urban agglomerations, based on the Normalized Difference Vegetation Index (NDVI), nighttime light intensity and climatic factors, this paper explores the spatial-temporal distribution of vegetation change trend through trend analysis, and uses empirical mode decomposition and partial correlation analysis to analyzes the correlation between vegetation change and climate factors and anthropogenic activities at different time scales. The relative contributions of climate factors and anthropogenic activities to vegetation change were analyzed by residual trend method. The results reveal that: NDVI exhibits an increasing trend in most regions, Land Surface Temperature (LST) has significantly increased, and the intensity of anthropogenic activities has significantly intensified in half of the regions. The correlation between vegetation change and anthropogenic activities and climate factors shows spatiotemporal heterogeneity, with significantly correlated areas increasing with the extension of temporal scales. A strong negative correlation between vegetation change and anthropogenic activity intensity is mainly distributed in the core urban areas of various cities. The regions where vegetation change is significantly negatively correlated with LST are primarily located in Zhaoqing, Jiangmen, and Huizhou. Increases in precipitation and sunshine duration promote vegetation growth. Vegetation change is primarily influenced by anthropogenic activities in the short term. In the long-term trend, most areas are dominated by climate factors, and vegetation changes caused by anthropogenic activities are mainly distributed in the core areas of cities. These findings contribute to a comprehensive understanding of the driving mechanisms of vegetation dynamic changes in the context of urbanization and provide a scientific basis for formulating more effective urban ecological management and sustainable development strategies.
1 Introduction
Terrestrial ecosystems, critical components of the global carbon cycle, are vital for climate stability and biodiversity conservation (Ge et al., 2021; Li Y. et al., 2021). However, rapid urbanization is causing unprecedented changes in these ecosystems. Driven by both climate change and anthropogenic activity, alterations in vegetation cover, a prominent feature of terrestrial ecosystems, have garnered widespread attention (Chang et al., 2022). Vegetation is crucial for carbon regulation, climate maintenance, and fragile ecosystem protection, and its dynamics directly impact ecological sustainability. Climate change (e.g., rising temperatures, altered precipitation) and anthropogenic activity (e.g., land-use change) profoundly reshape global vegetation patterns. Therefore, quantifying the relative contributions of climate change and anthropogenic activity to vegetation change is key to understanding terrestrial ecosystem change mechanisms and for developing effective strategies to address climate change and promote socio-economic and ecological sustainability.
Remote sensing provides important data for studying vegetation dynamics and their drivers. Vegetation indices derived from remote sensing are critical indicators for assessing plant biophysical parameters (Wang et al., 2003). The NDVI has characteristics with long temporal record, broad spatial coverage, and high sensitivity, is the most widely used index for measuring vegetation growth. NDVI is applied in vegetation dynamics studies at global (Funk and Brown, 2006; Liu et al., 2022), national (Prăvălie et al., 2022; Mehmood et al., 2024a), regional (Li et al., 2015; Liu et al., 2023; Qi et al., 2024), and city scales (Aburas et al., 2015; Barboza et al., 2021; Singh et al., 2024). In China, long-term NDVI-based monitoring reveals a significant increase in vegetation cover, with spatio-temporal heterogeneity in the rate of increase. For example, studies in the Shaanxi-Gansu-Ningxia region of the Loess Plateau (Li et al., 2015), the northern Loess Plateau (Ning et al., 2015), the Heilongjiang River Basin (Chu et al., 2019), the Yangtze and Yellow River Basins (Zhang et al., 2020), the Yangtze River Delta (Yuan et al., 2019; Tian et al., 2024), the Pearl River Delta (Hu and Xia, 2019; Abbas et al., 2021; Ruan et al., 2020; Chen et al., 2022), the Pearl River Basin (Chen et al., 2022), Jilin Province (Ren H. et al., 2023), Northern China (Lin et al., 2020; Sun et al., 2021), and Southwest China (Qi et al., 2024) demonstrate this trend. Common NDVI-based vegetation change detection methods include linear regression (Wu et al., 2020), the continuous change detection and classification (CCDC) algorithm (Lasaponara et al., 2024), LandTrendr (Eckert et al., 2015; Wuyun et al., 2024), DBEST (detecting breakpoints and estimating segments in trends) (Rhif et al., 2022). The Mann-Kendall test offers several advantages for vegetation trend analysis. This non-parametric method does not require specific data distributions and is suitable for non-normally distributed remote sensing data. In addition, it is resistant to outliers, improving the accuracy of vegetation trend identification (Li P. et al., 2021; Mehmood et al., 2024b).
Climatic factors, topography, nitrogen deposition, CO2 concentration, and anthropogenic activity are major drivers of vegetation change in terrestrial ecosystems (Potter and Brooks, 1998; Jiang, 2022). Climatic factors significantly influence regional vegetation distribution and growth; rising temperatures, altered precipitation patterns, and extreme climate events are profoundly changing global vegetation growth, distribution, and phenology (Jiang et al., 2017; Afuye and et al., 2021; Zhang et al., 2018). Numerous studies indicate that temperature and precipitation are key factors influencing vegetation change. Increased temperature and summer precipitation extend growing seasons and accelerate growth, promoting vegetation cover (Fang et al., 2003). For example, precipitation patterns significantly affect vegetation dynamics in China’s northern agro-pastoral transitional zone (Jiang et al., 2020), and increased temperature and precipitation lead to increased growing season NDVI on the Qinghai-Tibet Plateau (Pang et al., 2017). Vegetation response to climate change in the Yangtze and Yellow River Basins varies with temporal scale (Zhang et al., 2020). In West Bengal, India, temperature and precipitation jointly influence the Enhanced Vegetation Index (Banerjee et al., 2024). Research further suggests that vegetation growth environment, type, and the spatial heterogeneity of climate change can modify vegetation responses to climatic factors. For instance, NDVI in the Pearl River Delta and Yangtze River Delta is more responsive to temperature than precipitation (Chen et al., 2022; Yuan et al., 2019; Abbas et al., 2021), whereas vegetation in the arid, semi-arid, and sub-humid regions of Northern China, temperate grasslands and deserts, and the northern Loess Plateau is more sensitive to precipitation changes (Sun et al., 2021; Lin et al., 2020; Ning et al., 2015). Grassland NDVI in the Heilongjiang River Basin is positively correlated with precipitation year-round. Coniferous, broadleaf, mixed forests, and woodlands show significant positive correlation between NDVI and air temperature, and significant negative correlation with autumn precipitation (Chu et al., 2019). Grassland NDVI in relatively arid regions of Northern China is more sensitive to heavy precipitation than to moderate or light rainfall (Yuan et al., 2015). In semi-humid Northeast Asia, vegetation sensitivity to growing-season temperature differs based on species and elevation (Cao et al., 2019).
Urbanization and population growth amplify the impact of anthropogenic activity on the ecological environment. Anthropogenic activity increasingly influence vegetation, sometimes more profoundly than climate change. For instance, anthropogenic factors and land use are the primary combined influences on vegetation change in eastern China (Zou et al., 2025). Land use change due to urbanization is a major driver of vegetation cover decline in the Yangtze River Delta (Yuan et al., 2019). Urban expansion in Shenzhen leads to regional net primary productivity loss (Yu et al., 2009). In Northern China, reduced population density and afforestation have promoted desertification recovery (Wang J. et al., 2024). Population growth and migration may explain significant vegetation cover changes in the African Sahel (Boschetti et al., 2013), and anthropogenic activity are the dominant factor in vegetation changes near Kolkata, India (Banerjee et al., 2024). Studies indicate that anthropogenic activity can have both promoting and inhibiting effects on vegetation cover. Large-scale ecological projects promote vegetation greening and NDVI increases (Zheng et al., 2021; Shi et al., 2020), such as the Grain for Green program, increased crop planting, and remediation of coal mining areas (Chen et al., 2022; Ning et al., 2015). Afforestation promotes NDVI growth in Shaanxi, Shanxi, and Hebei provinces, and much of Southern China (Lin et al., 2020; Liu et al., 2022). However, anthropogenic activity are also a major cause of vegetation degradation in China’s agro-pastoral belt. Over-cultivation, overgrazing, and unsustainable farming lead to degradation in Northeast China (Chu et al., 2019; Zhang, 2014). Construction land expansion in the Pearl River Basin causes NDVI decline (Wenyu et al., 2022), and energy production, chemical infrastructure, and mineral resource development increase the risk of vegetation degradation in northern Shaanxi (Li et al., 2015).
Given the complex interactions of climate change and anthropogenic activity on vegetation (Zou et al., 2025; Georgescu et al., 2014; Wang et al., 2021), various quantitative methods are used to distinguish their relative contributions. These include Hurst exponent analysis (Wang et al., 2020), geostatistical methods (Zhang et al., 2024), Geodetector models (Zou et al., 2025), partial correlation analysis (Xu et al., 2023), and residual trend analysis (RESTREND) (Yan et al., 2021; Wang W. et al., 2024). RESTREND, based on regression between vegetation indices and climatic factors, calculates the residual between actual and climate-driven vegetation change, representing the impact of anthropogenic activity. Due to its simplicity and suitability for large-scale analysis, RESTREND is chosen as the primary method to quantify the impact of climate and anthropogenic activity on vegetation change.
Regarding analysis of vegetation change drivers, most existing studies rely on traditional methods focused on a single temporal scale. However, long-term climate factor variations are often non-linear, non-stationary, and complex, with different temporal scales or periodic oscillations. Anthropogenic activity intensities, such as urban expansion, over-cultivation, overgrazing, and afforestation, demonstrate spatio-temporal heterogeneity (Zhang et al., 2020; Gao et al., 2022). The relative importance of climate and anthropogenic activity on vegetation change is significantly affected by temporal scale (Ge et al., 2021). Single-scale analyses cannot accurately reflect vegetation responses to different drivers (Qi et al., 2019). Therefore, incorporating multi-temporal scale analysis into assessing the relative importance of climate change and anthropogenic activity, studying vegetation change drivers at annual, interannual, decadal scales, and long-term trends, is crucial for analyzing spatio-temporal differences in the dominant factors affecting vegetation change.
In recent years, China’s regional development strategy has prioritized urban agglomerations. In this model, vegetation change in urban agglomerations exhibits more complex spatio-temporal heterogeneity, posing new challenges for ecological protection and sustainable development. The Guangdong-Hong Kong-Macao Greater Bay Area (GBA) is one of China’s most densely populated regions, with high levels of openness, economic activity, and social and economic development. The GBA has experienced significant climate change and intensive anthropogenic activity, resulting in noticeable vegetation changes (Geng et al., 2022). Climate change increases the magnitude of effects on ecosystem vulnerability, and anthropogenic activity are the primary drivers of these changes (Zhang P. et al., 2023), making it a suitable location for studying vegetation dynamics during urbanization. Multi-scale analyses of the relationships between climate, anthropogenic activity, and vegetation dynamics in the GBA are lacking. This study focuses on multi-temporal scale differences in the impacts of anthropogenic activity and climate change on vegetation, aiming to reveal the driving mechanisms of vegetation change more comprehensively and provide a basis for sustainable urban development and spatial planning.
Based on these considerations, this study proposes a multi-timescale effects model to quantify the relative importance of climate factors and anthropogenic activity on vegetation change in the GBA at different temporal scales. The NDVI and nighttime light intensity are used to represent vegetation change and anthropogenic activity, respectively. Surface temperature, precipitation, and sunshine duration are selected as climate factors. The analysis comprises four aspects: (1) analyzing trends in vegetation change, anthropogenic activity, and climate factors; (2) detecting multi-temporal scale characteristics; (3) calculating the spatial heterogeneity of correlations between vegetation change and climate/anthropogenic activity across different temporal scales; (4) quantifying the relative contributions of climate and anthropogenic activity to vegetation change at different temporal scales.
2 Materials and methods
2.1 Study area
The Guangdong-Hong Kong-Macao Greater Bay Area (GBA), composed of nine cities in the Pearl River Delta urban agglomeration, the Hong Kong Special Administrative Region and the Macao Special Administrative Region, and is one of the five key national city clusters. Covering an area of approximately 56,000 km2, the GBA had a permanent population of 86.884 million at the end of 2023, accounting for about 6% of the total population of China. Its geographical location is situated between 111°12′E−115°35′E and 21°25′N-24°30′N, as shown in Figure 1. The GBA is located in a subtropical monsoon climate zone, characterized by significant cloud cover for most of the year, resulting in a cloudy and rainy environment. It experiences high temperatures and heavy rainfall in summer and mild, low-rainfall conditions in winter, with synchronous rain and heat, abundant rainfall, and sufficient heat. The annual average precipitation reaches 1800 mm, the total annual sunshine duration is 2000 h, and the annual average temperature ranges from 21.4°C to 22.4°C. Subtropical evergreen broad-leaved forests flourish in the GBA, and vegetation growth is vigorous. The economic development level of the GBA exhibits internal imbalances, with an economic pattern characterized by “strong east and weak west.” Over the past 2 decades, Hong Kong’s total economic output has surpassed that of other cities. After the recent decade of development, Shenzhen and Guangzhou have also reached leading economic positions comparable to Hong Kong. The economic level of Foshan and Dongguan has developed steadily, with relatively high total economic output, while other cities have relatively lower total economic outputs (Wu et al., 2021).
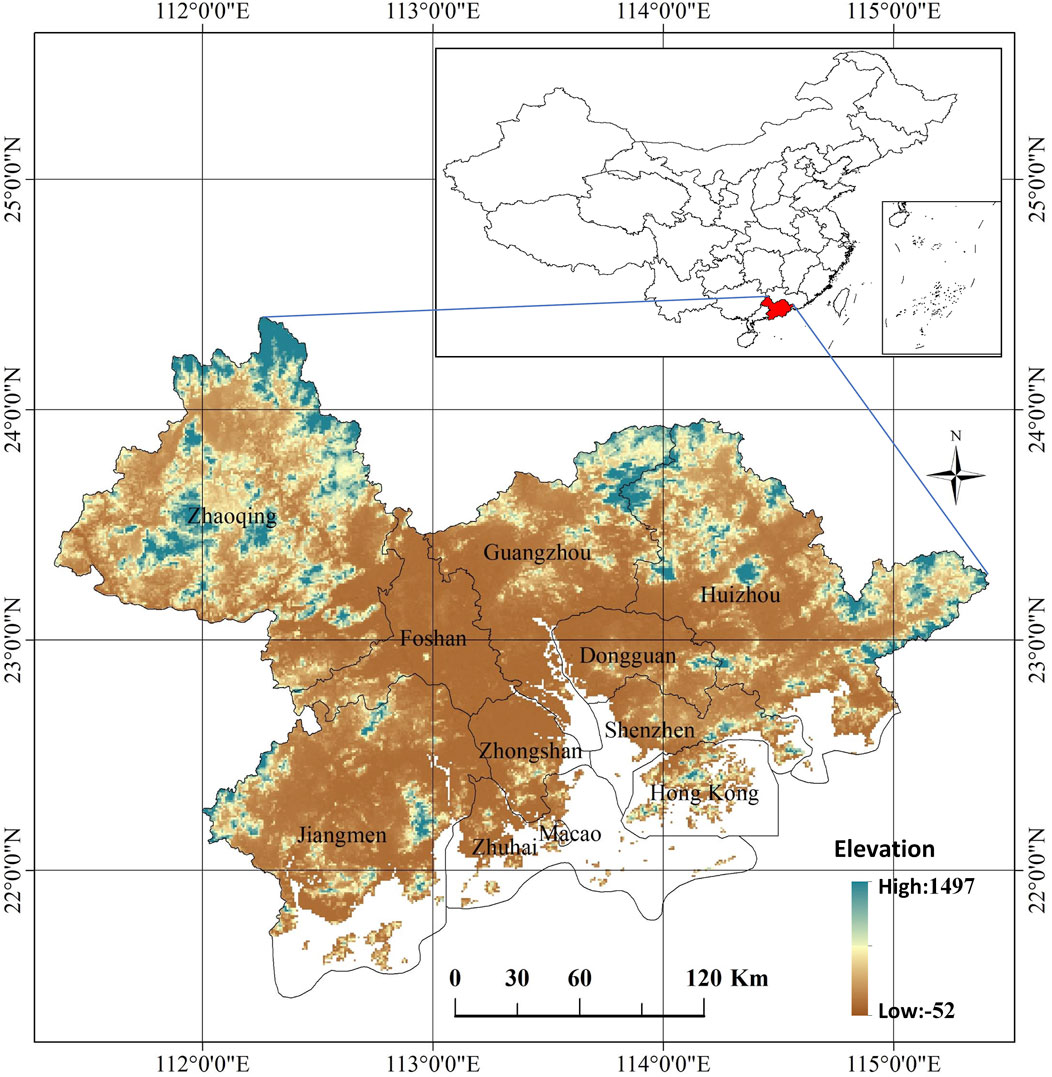
Figure 1. The location of the study area Guangdong–Hong Kong–Macao Greater Bay.
2.2 Data preparation
The data selected for this study include nighttime light imagery, vegetation index, land surface temperature, and meteorological data, covering a period from April 2012 to December 2020, totaling 105 months. All data were reprojected to the WGS84 coordinate system and resampled to a spatial resolution of 0.004167 ° × 0.004167 ° (approximately 500 m at the equator). The Seasonal and Trend decomposition using Loess (STL) algorithm was applied to the original data to decompose the time series into trend, seasonal, and residual components, respectively. Based on the trend components of the data sources, relevant calculations and analyses were conducted to remove the influences of seasonality and noise.
2.2.1 NDVI data
The NDVI is sensitive to chlorophyll and quantifies vegetation change by measuring the contrast between the reflection of solar radiation in the red band and near infrared band. With the advancement of remote sensing technology, NDVI has been widely used for monitoring vegetation change. This study employed NDVI to monitor vegetation changes. The 16-day composite NDVI product provided by MYD13A1 data was selected, and monthly averages were calculated.
2.2.2 Climate data
Climate factors included LST, precipitation, and sunshine duration. LST data were selected from the 8-day composite LST product provided by MOD11A2, and monthly LST averages were calculated. Meteorological data were obtained from the National Meteorological Science Data Center, providing data from national standard meteorological stations for the period 2012–2020 (http://data.cma.cn/), and monthly average temperature, monthly total precipitation, and monthly total solar radiation data were extracted. Given the limited number of existing meteorological stations and the complex topography of the study area, inverse distance weighting interpolation was performed on the meteorological data using ArcGIS 10.6 software to match the remote sensing images. The rasterized meteorological data spatial distribution maps had the same spatial resolution and projection information as the nighttime remote sensing imagery.
2.2.3 Nighttime light data
In 2012, the Visible Infrared Imaging Radiometer Suite (VIIRS) onboard the National Polar-Orbiting Partnership (NPP) satellite, launched by the National Aeronautics and Space Administration (NASA), became available for capturing nighttime lights. The NPP-VIIRS nighttime light remote sensing imagery provides daily raw data, monthly composite data, and some annual composite data, and these products have already eliminated the effects of cloud cover, lightning, and moonlight. The NPP-VIIRS/DNB data were obtained from the Earth Observation Group at the Payne Institute for Public Policy, Colorado School of Mines (https://eogdata.mines.edu/products/vnl/), with a temporal coverage from April 2012 to December 2020. Nighttime light intensity (NTL) was used in this study to represent the intensity of anthropogenic activities.
2.3 Methods
This study develops a multi-timescale effects model (Figure 2) to quantify the influence of climatic factors and anthropogenic activity on vegetation change across multiple temporal scales within the GBA. The analytical framework comprises the following: First, trend analysis of vegetation, anthropogenic activity, and climate factor time series is conducted using the Theil-Sen median trend estimator and the Mann-Kendall test. Second, Empirical Mode Decomposition (EMD) is applied to extract multi-temporal scale characteristics from vegetation change, anthropogenic activity intensity, and climatic factors. Subsequently, partial correlation analysis is performed to assess the relationships between vegetation change at different temporal scales and both climatic factors and anthropogenic activity. Finally, the Residual Trend (RESTREND) method is utilized to quantify the relative contributions of climate factors and anthropogenic activity to vegetation change across each temporal scale. Adopting a multi-temporal perspective, this research aims to provide an in-depth analysis of vegetation dynamics and their underlying drivers, with the goal of providing a scientific basis for refining existing ecosystem models and enabling fine-grained temporal monitoring of human-environment interactions in rapidly urbanizing regions.
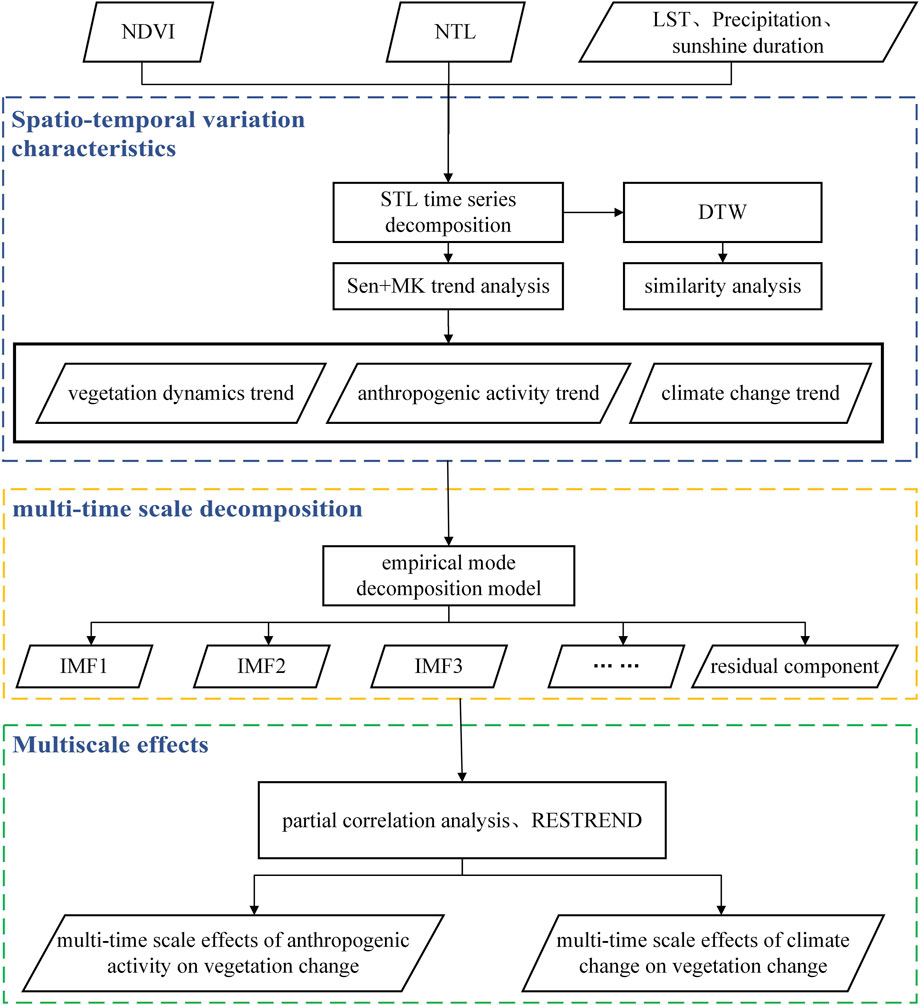
Figure 2. The flowchart of methods.
2.3.1 Mann-Kendall trend analysis
The temporal trend of a time series was calculated using a combination of the Theil-Sen median trend estimator and the Mann-Kendall test. The Theil-Sen median trend estimator, which can reduce the influence of outliers, is widely used for dynamic detection in long time series. The Mann-Kendall test is employed to determine the significance of the trend. The calculation equation for the Theil-Sen median trend estimator is as follows (Li et al., 2021a):
In the equation Equation 1, β represents the rate of change;
The significance of the trend change was calculated using the Mann-Kendall non-parametric statistical test. The calculation process of the Mann-Kendall trend test is as follows:
For a time series
In the Equations 2, 3 n is the length of the time series, and
The formula for calculating the Mann-Kendall significance (Z), as given in Equation 5:
A trend is considered significant when
The combination of the Theil-Sen median trend estimator and the Mann-Kendall test can effectively reflect the spatial distribution characteristics of the change trends in vegetation, anthropogenic activities, and climate factors. Since pixels with a rate of change strictly equal to 0 are essentially nonexistent, pixels with a rate of change between −0.0005 and 0.0005 were classified as stable, pixels with a rate of change less than −0.0005 were classified as degraded areas, and pixels with a rate of change greater than 0.0005 were classified as improved areas. The results of the Mann-Kendall test for significance at the 0.05 confidence level were classified into significant change (
2.3.2 Dynamic Time Warping method
Dynamic Time Warping (DTW) is an algorithm used to measure the similarity between two time series. The DTW algorithm can achieve high classification accuracy when the number of samples or the length of the time series of satellite imagery is reduced, and it is widely applied in land use/cover mapping and farmland detection.
With the advancement of the DTW algorithm in the automatic identification and shape matching of time series of different lengths, the DTW algorithm has been widely applied to analyze the consistency of time series. The calculation formula is as follows (Csillik et al., 2019):
For time series of observed values A and B with lengths of n and m, respectively, construct an n × m matrix:
In the Equation 6, the
The path needs to satisfy three constraints.
(1) Boundary Condition:
(2) Continuity: The path cannot skip over a point for matching, but must align with points adjacent to itself. That is, if
(3) Monotonicity: If
The optimal matching path between the two sequences is found in the distance matrix as the path that minimizes the accumulated distance between sequences A and B:
In the Equation 9,
The accumulated distance
Given the classification advantages of the DTW algorithm, anthropogenic activity, climatic factors, and vegetation change can be flexibly analyzed using DTW similarity measures within urban areas exhibiting natural phenological variability. Both anthropogenic activity and climatic factors represent major influences on vegetation change. The heterogeneity in NDVI induced by anthropogenic activity is examined based on the similarity of NDVI time series corresponding to varying levels of nighttime light intensity. In parallel, the heterogeneity in vegetation change arising from climatic factor variations is assessed by calculating the similarity of NDVI time series associated with varying magnitudes of LST, precipitation, and sunshine duration.
2.3.3 Empirical mode decomposition method
This study analyzed the change characteristics of vegetation, climate factors, and anthropogenic activities at the pixel scale across multiple temporal scales using the Empirical Mode Decomposition (EMD) method.
The EMD method decomposes the original time series data
(1) Identify all the extrema points of the original time series signal
(2) Fit the upper and lower envelopes of these extrema points using spline interpolation. Calculate the mean of these envelopes, denoted as
(3) Determine whether
(4) If
(5) Once an IMF is obtained, subtract this mode function from the original time series signal. Repeat steps (1) through (4) to continuously obtain the next IMF until the remaining sequence after subtraction is either monotonic or constant.
Based on this procedure, the original time series is decomposed using EMD into several IMFs and a residual component, as given in Equation 11:
where
The average period of the ith IMF component is calculated by dividing the length of the time series by the number of peaks (local maximum). To evaluate the relative importance of each IMF and the residual component, the variance contribution is calculated:
In the Equations 12, 13
2.3.4 Partial correlation analysis
Climate factors, anthropogenic activities, and vegetation change are interrelated; altering one element affects the others. Partial correlation analysis calculates the correlation between a dependent variable and an independent variable while excluding the influence of related variables on the dependent variable. The magnitude of the partial correlation coefficient reflects the influence of each factor on the dependent variable, with other factors acting as control variables. Second-order partial correlation coefficients are based on correlation analysis and first-order partial correlation analysis, and third-order partial correlation coefficients are based on correlation analysis, first-order partial correlation analysis, and second-order partial correlation analysis. The calculation formula for partial correlation analysis is as follows (Xu et al., 2023):
In the Equation 14,
The equation for calculating the first-order partial correlation is as follows:
In the Equation 15,
The equation for calculating the second-order partial correlation, as given in Equation 16:
where
The equation for calculating the third-order partial correlation, as given in Equation 17:
where
2.3.5 Residual trend method
Vegetation change is influenced by both climate factors and anthropogenic activities. The RESTREND analyzes the relative roles of climate factors and anthropogenic activities on vegetation change by establishing a relationship model between vegetation change and climate factors. The RESTREND method analyzes the residual trend between the observed NDVI values (
Establish a regression model between
In the equation,
Based on the results of Equation 18, the residual
3 Results
3.1 Change trend analysis
The combination of the Theil-Sen median trend estimator and the Mann-Kendall test can effectively reflect the temporal trends of vegetation, anthropogenic activities, and climate factors in GBA.
3.1.1 Vegetation change trend
By overlaying the classification results of the Theil-Sen median trend estimator and the Mann-Kendall test, the change trends of NDVI at the pixel scale were obtained, as shown in Figure 3. The proportions of the five change types were as follows: significant increase: 17.36%, slight increase: 46.23%, no change: 7.41%, slight decrease: 24.09%, and significant decrease: 4.9%. The area of land with improved vegetation was significantly larger than the area with degraded vegetation. The GBA experienced widespread vegetation greening during the study period, with the total area of significantly improved vegetation accounting for 17.36% and the total area of slightly improved vegetation accounting for 46.23%. Areas with significant vegetation improvement were mainly distributed in Zhaoqing, Huizhou, and Jiangmen. The cities with the highest proportions of improved vegetation area were Zhaoqing, Hong Kong, and Shenzhen, with percentages of 76.89%, 72.9%, and 71.23%, respectively.

Figure 3. Spatial distribution of NDVI change trend.
The total area of vegetation degradation in the GBA reached 28.99%, with relatively significant degradation in Zhongshan, Dongguan, and Guangzhou, the total area of vegetation degradation accounted for 46.99%, 43.21% and 41.31%, respectively. These three cities have experienced more rapid urbanization and significant expansion of built-up areas compared to other cities. This rapid urbanization process has led to noticeable degradation of surface vegetation cover.
3.1.2 Trend of anthropogenic activity intensity
The spatial distribution of the change trends in anthropogenic activity intensity is shown in Figure 4. The proportions of the five change types were as follows: significant increase: 51.47%, slight increase: 8.77%, no change: 6.69%, slight decrease: 2.43%, and significant decrease: 0.71%. The proportions of areas with increased anthropogenic activity intensity were relatively lower in the three cities of Zhaoqing, Huizhou, and Jiangmen.
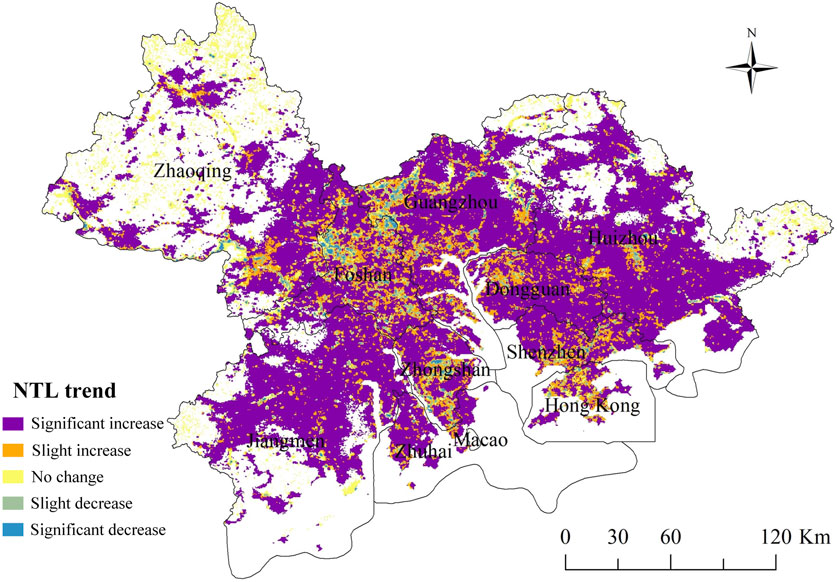
Figure 4. Spatial distribution of NTL change trend.
3.1.3 Trends of climate factors
The spatial distribution of LST change trends is shown in Figure 5. The proportions of the five change types were as follows: significant increase: 34%, slight increase: 53.42%, no change: 5.29%, slight decrease: 6.8%, and significant decrease: 0.48%. With the rapid urbanization of the GBA, the LST in various cities also showed varying degrees of increase. Dongguan, Zhongshan, Zhuhai, and Shenzhen had relatively high proportions of areas with increased LST, with the percentages of significantly increased areas being 80.11%, 71.49%, 53.77%, and 52.08%, respectively. Jiangmen had the lowest proportion of areas with significantly increased LST, at 19.15%.
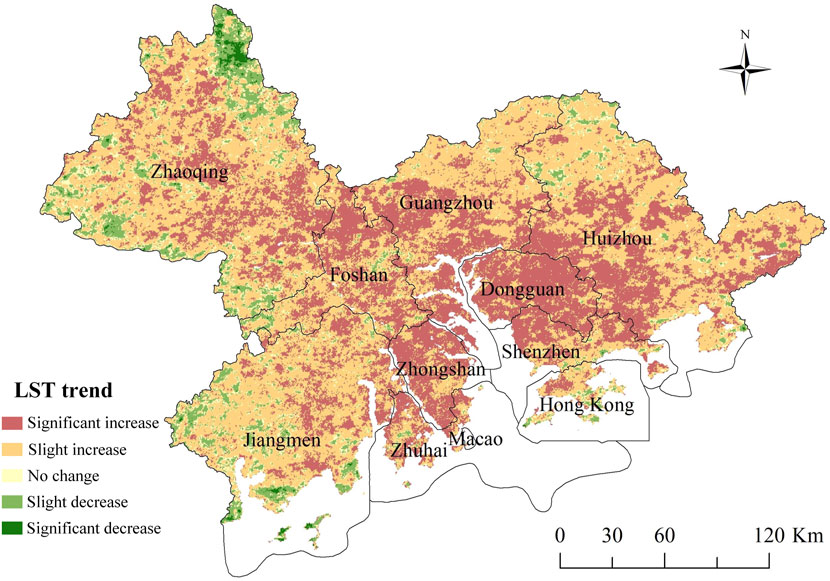
Figure 5. Spatial distribution of LST change trend.
3.2 Similarity analysis
The heterogeneity of NDVI induced by anthropogenic activity was explored, as shown in Figure 6, the DTW distance of NDVI time series exhibited a clear increasing trend with the increase in the difference between nighttime light intensities, indicating that the differences in NDVI became larger. As shown in Figure 7, with the increase in the difference between climate factors, the DTW distances of the NDVI time series corresponding to the three climate factors also showed an increasing trend. Among them, the DTW distance corresponding to different sunshine durations was relatively lower.
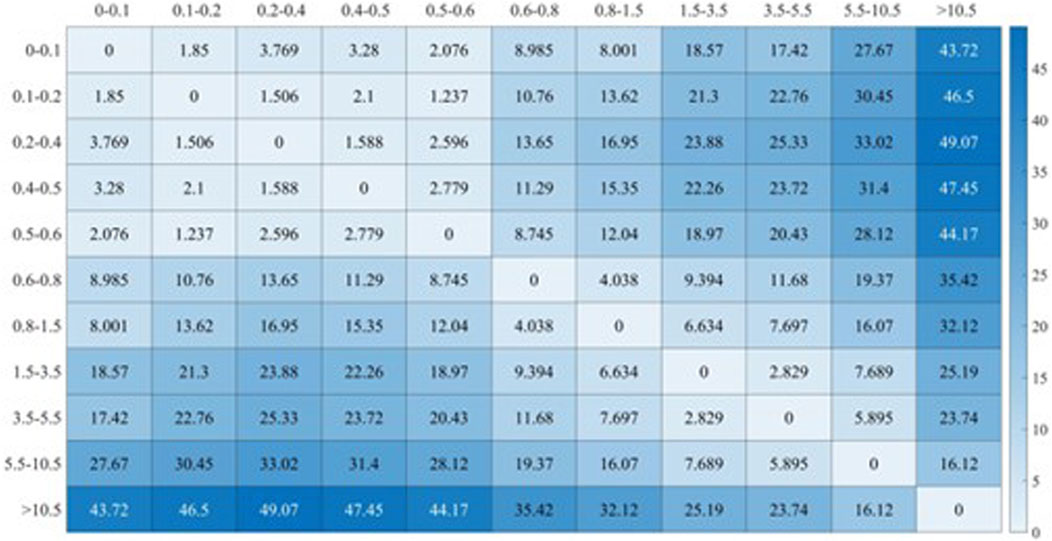
Figure 6. DTW distance of NDVI sequence corresponding to different NTL intensity.
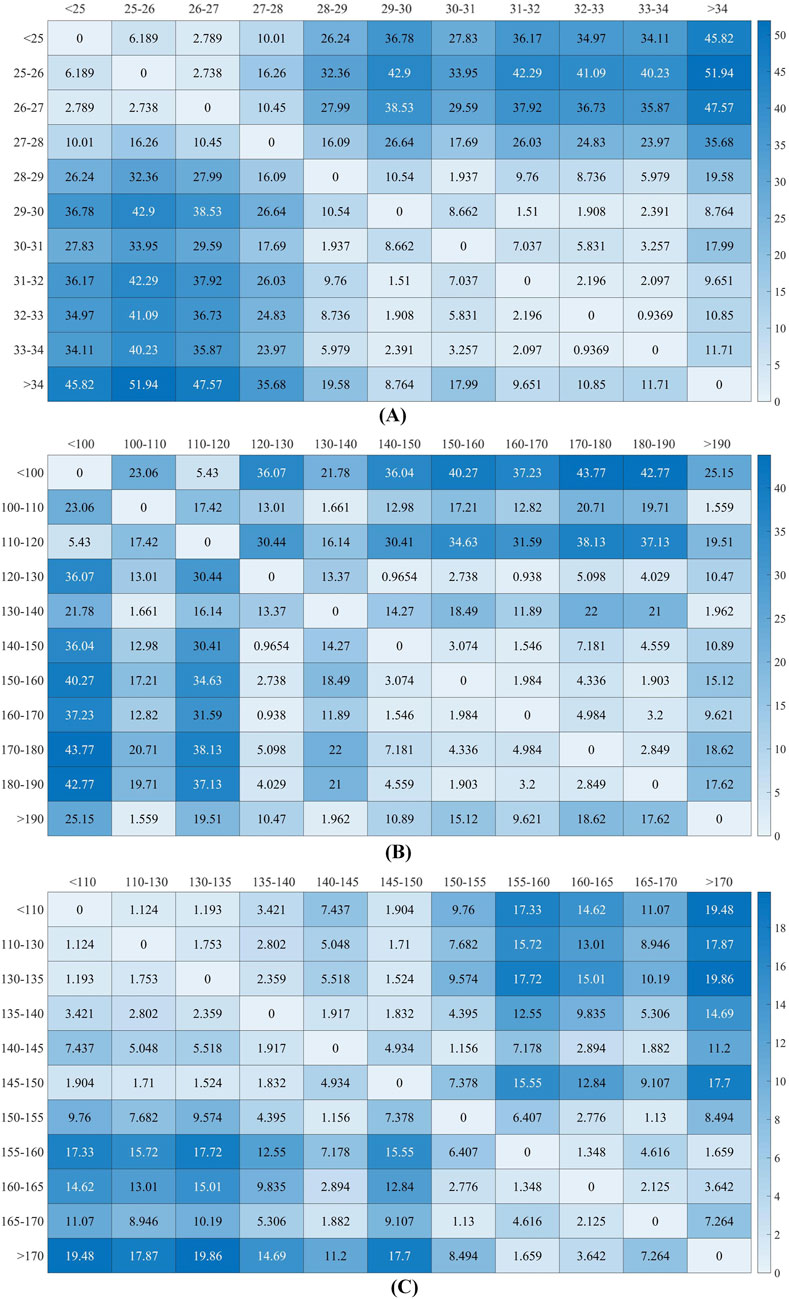
Figure 7. DTW distance of NDVI sequence corresponding to climatic factors (A) LST, (B) precipi-tation, (C) sunshine duration.
3.3 Multi-time scale characteristics analysis
3.3.1 Multi-time scale characteristics of vegetation change
Based on the EMD method, multi-temporal scale analysis was performed on the NDVI time series at the pixel scale from April 2012 to December 2020. The mean period of each IMF and the mean variance contribution of each IMF and the residual component for all pixels were calculated as the change period and variance contribution of vegetation at different temporal scales, respectively. The average periods and average variance contributions are shown in Table 1, and the spatial distribution of variance contributions to vegetation change at different temporal scales is shown in Figure 8.

Table 1. Mean period and variance contribution of vegetation change at different time scales.
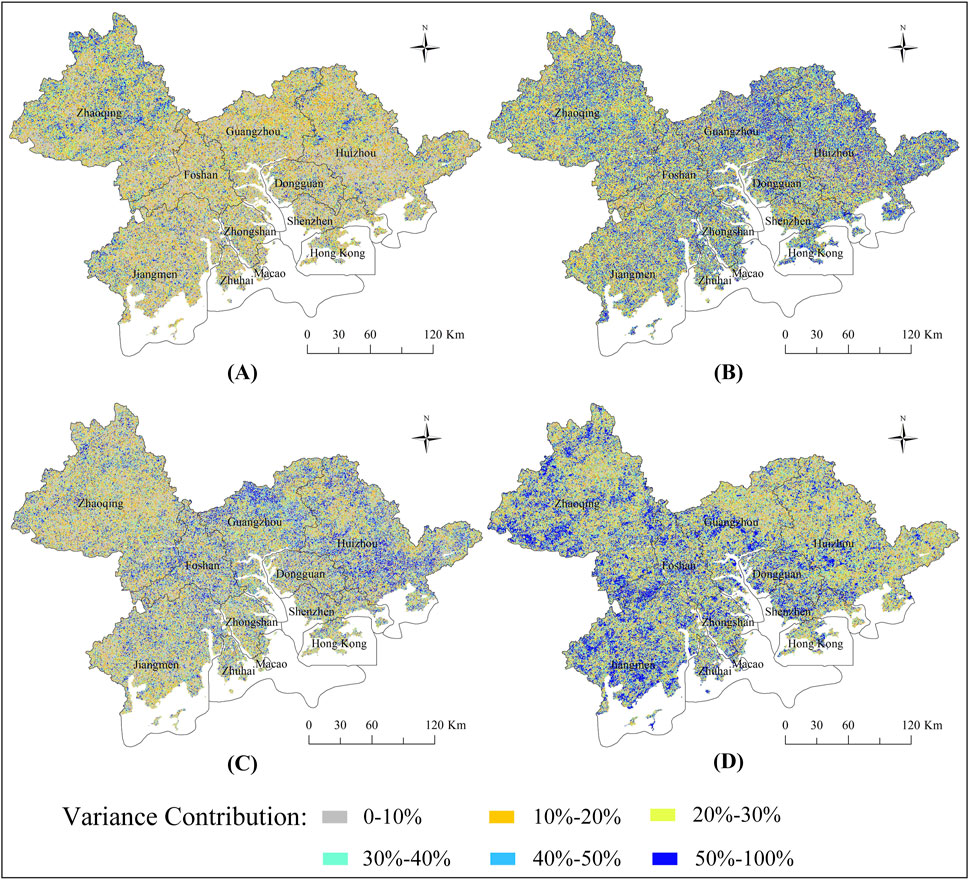
Figure 8. Variance contribution of different time scales to vegetation change (A) 1-year, (B) 3-year, (C) 7-year, (D) long-term trend.
As shown in Table 1, the vegetation changes in the GBA are mainly characterized by periods of 10 months, 36 months, and 86 months. The increasing trend in residual component indicate an overall increase in vegetation cover, which is consistent with the Mann-Kendall trend. Based on the decomposition of vegetation change time series, the multi-temporal scales of vegetation change in the GBA are categorized as annual (1-year), interannual (3-year), sub-decadal (7-year), and long-term trend.
Figures 8A–D present the variance contributions of the 1-year, 3-year, 7-year temporal scales and the long-term trend to vegetation change in the GBA, respectively. For the 1-year temporal scale, the variance contributions of most cities are below 50%, except for a small region in Zhaoqing. Regions where the 3-year variance contribution exceeds 50% account for 15% of the GBA and are mainly distributed in Huizhou, Guangzhou, and Zhaoqing. The 7-year variance contribution exceeds 50% in 10.3% of the study area, primarily in Huizhou and Guangzhou. Long-term trends account for over 50% variance in 17.2% of the GBA, with a higher prevalence in Zhaoqing, Jiangmen, and Zhongshan.
3.3.2 Multi-time scale characteristics of climate factors and anthropogenic activity
Table 2 indicates that the dominant periodicities for anthropogenic activity intensity in the GBA are 12 months, 36 months, and 86 months. The residual components of anthropogenic activity intensity exhibit an increasing trend, with the variance contribution reaching 62.2%, demonstrating a marked increase in anthropogenic activity intensity, which is consistent with the Mann-Kendall trend analysis. The multitemporal scales of anthropogenic activity intensity change in the GBA are then categorized as 1-year, 3-year, 7-year and long-term trends to facilitate the analysis of their impact upon vegetation change.
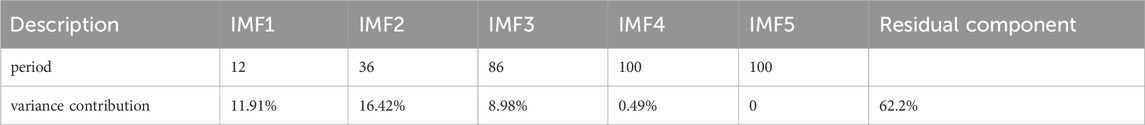
Table 2. Mean period and variance contribution of anthropogenic activity intensity at different time scales.
Figures 9A–D present the variance contributions of the 1-year, 3-year, and 7-year temporal scales, and the long-term trend to anthropogenic activity intensity in the GBA, respectively. The variance contributions of the 1-year, 3-year, and 7-year temporal scales were generally below 30%, indicating minimal fluctuation in anthropogenic activity intensity at shorter temporal scales. The regions with variance contributions greater than 50% in the long-term trend accounted for 65%, indicating that most regions are dominated by long-term trends in anthropogenic activity intensity, and the long-term trend of anthropogenic activity intensity has a significant impact on vegetation change.
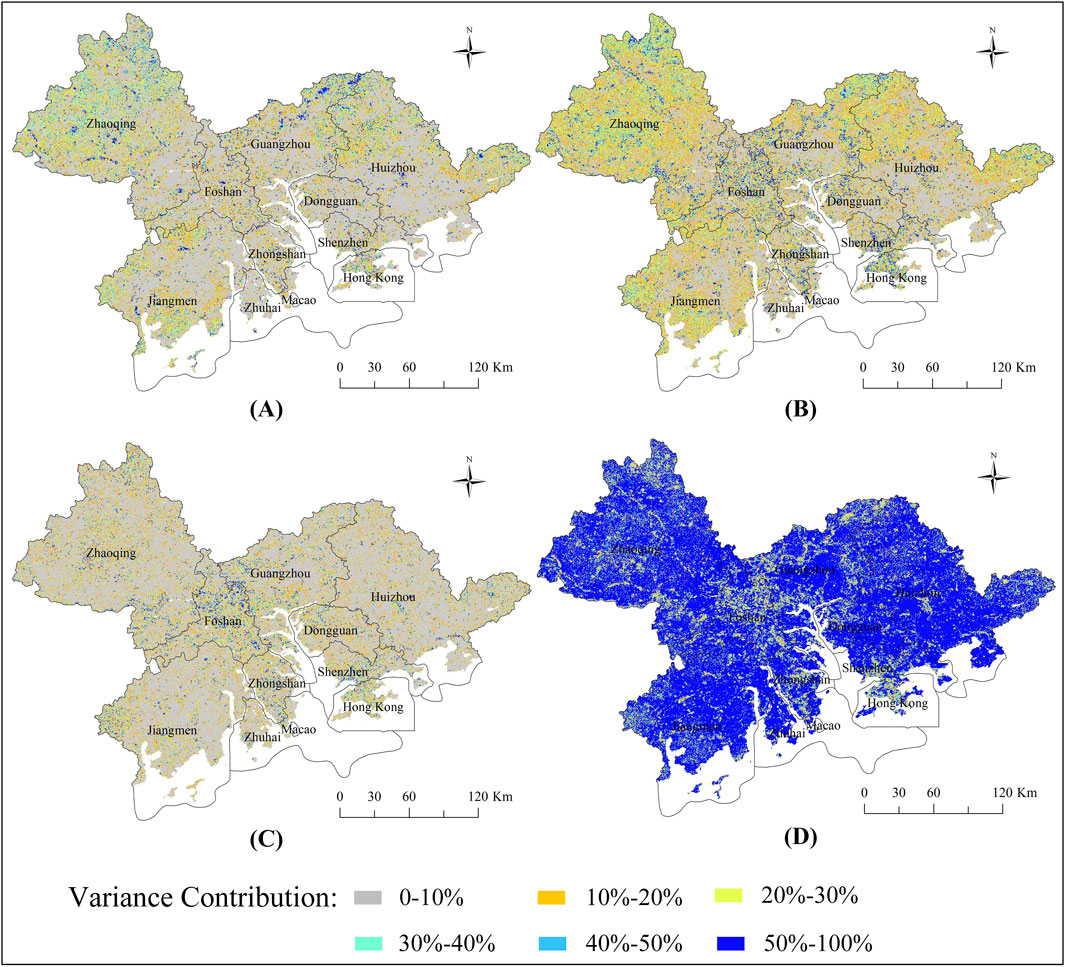
Figure 9. Variance contribution of different time scales to anthropogenic activity intensity (A) 1-year, (B) 3-year, (C) 7-year, (D) long-term trend.
As shown in Table 3, the LST is mainly characterized by 10 months, 36 months, and 79 months periodicities, with the residual component exhibiting an increasing trend and a variance contribution of 25.32%, indicating an increase in LST. This study summarized the multi-temporal scales of LST change as 1-year, 3-year, 7-year temporal scale, and a long-term trend.
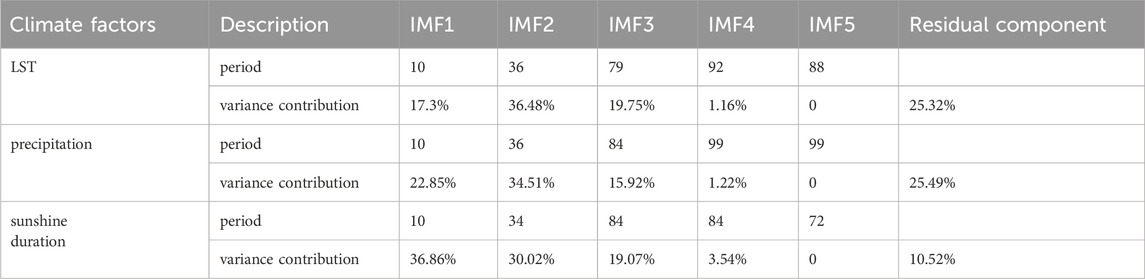
Table 3. Mean period and variance contribution of climate factors at different time scales.
Figures 10A–D respectively show the variance contributions of the 1-year, 3-year, and 7-year temporal scales, and the long-term trend to LST change in the GBA. The 1-year and 7-year temporal scales generally have variance contributions to LST that are less than 50%. The regions with variance contributions greater than 50% at the 3-year temporal scale accounted for 25.26%, Zhaoqing, Guangzhou, and Huizhou are dominated by 3-year LST changes. The regions with variance contributions greater than 50% in the long-term trend accounted for 12.46%, mainly distributed in the core urban areas, indicating that LST changes in the core urban areas are dominated by long-term trends.
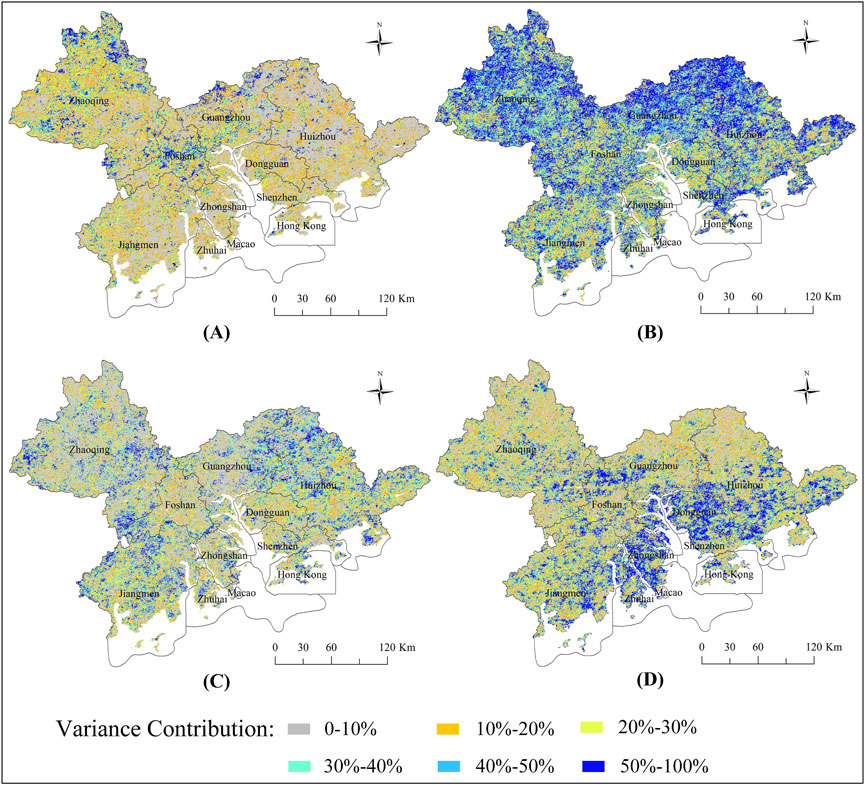
Figure 10. Variance contribution of different time scales to LST (A) 1-year, (B) 3-year, (C) 7-year, (D) long-term trend.
According to Table 3, multi-temporal scales of precipitation and sunshine duration changes are summarized as 1-year, 3-year, and 7-year temporal scales, and a long-term trend. The variance contribution of the long-term trend to precipitation was 25.49%, and the precipitation showed a decreasing trend, and there was no clear long-term trend in sunshine duration.
3.4 Effects of climatic factors and anthropogenic activity on vegetation
3.4.1 Correlation between anthropogenic activity intensity and vegetation change
Using the influence of climate factors (LST, precipitation, and sunshine duration) on vegetation change as control variables, a pixel-by-pixel partial correlation analysis was performed on the relationship between vegetation change and anthropogenic activity intensity at 1-year, 3-year, and 7-year temporal scales, as well as the long-term trend and overall values. Based on the spatial distribution of the partial correlation coefficients, the spatial heterogeneity of the correlation between vegetation change and anthropogenic activity intensity in the GBA at different temporal scales was analyzed. The area percentages of different correlations are shown in Table 4.
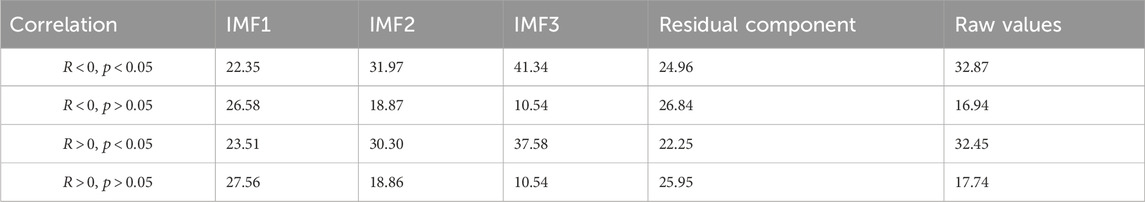
Table 4. The proportion of correlation between vegetation change and anthropogenic activity intensity at different time scales.
Figures 11A–E respectively show the spatial distribution of the partial correlation between vegetation change and anthropogenic activity intensity in the GBA at the 1-year, 3-year, and 7-year temporal scales, the long-term trend, and the overall values. At the 1-year temporal scale in the GBA, the relationship between vegetation change and anthropogenic activity intensity was not significant in 54.14% of the regions, while 22.35% and 23.51% of the regions showed significant negative or positive correlations, respectively. Pixels with negative and positive correlations were evenly distributed in the GBA. The areas with significant correlations between vegetation change and anthropogenic activity intensity increased at the 3-year and 7-year temporal scales. The contribution of the long-term trend to anthropogenic activity intensity was 62.2%, significantly greater than that of other temporal scales. The partial correlation analysis for the long-term trend showed a significant correlation between vegetation change and anthropogenic activity intensity in 47.21% of the regions, with negative correlations mainly distributed in Guangzhou, Huizhou, Zhaoqing, and Jiangmen. The partial correlation analysis for the overall values showed a significant correlation between vegetation change and anthropogenic activity intensity in 65.32% of the regions in the GBA, with negative correlations mainly distributed in the core urban areas of each city, indicating that urbanization development has a negative impact on vegetation.
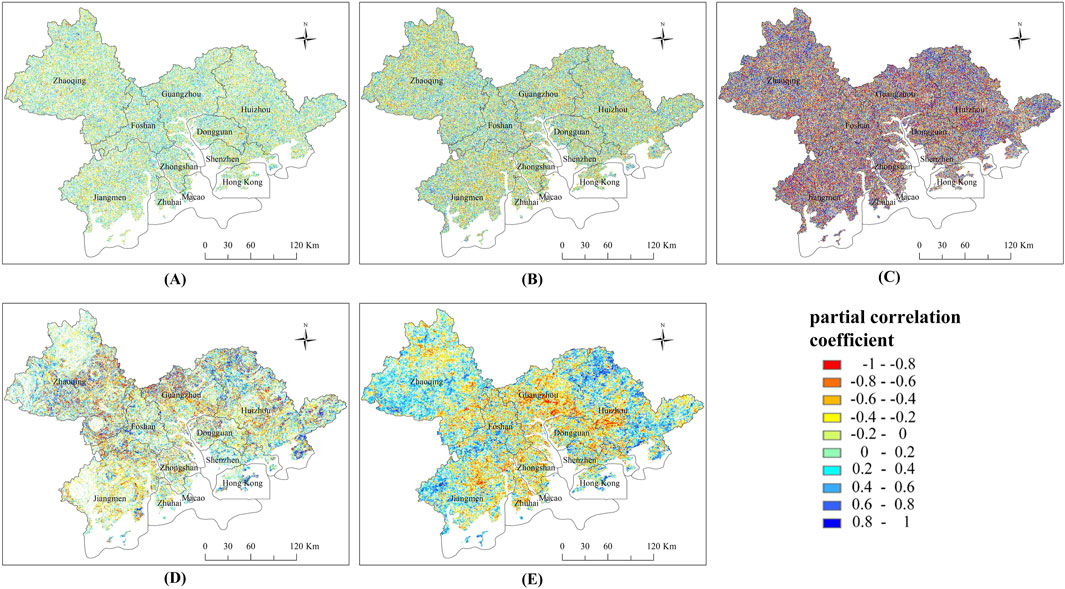
Figure 11. Spatial distribution of partial correlation between vegetation change and anthropogenic activity intensity at different time scales (A) 1-year, (B) 3-year, (C) 7-year, (D) long-term trend, (E) overall values.
3.4.2 Correlation between climatic factors and vegetation change
To reveal the spatial heterogeneity of the correlation between vegetation change and LST change at different temporal scales, partial correlation analyses were performed pixel-by-pixel on the relationship between vegetation change and LST at 1-year, 3-year, and 7-year temporal scales, the long-term trend, and the overall values, using the influence of anthropogenic activity intensity, precipitation, and sunshine duration on vegetation change as control variables. Similarly, the partial correlations between vegetation change and precipitation, between vegetation change and sunshine duration at different temporal scales were analyzed.
As shown in Table 5 and Figures 12A–E, at the 1-year, 3-year, and 7-year temporal scales, the change trends of regions with significant correlations between vegetation change and LST were similar to those of regions with significant correlations between vegetation change and anthropogenic activity intensity. For the overall values, the relationship between vegetation change and LST was not significant in 37.09% of the regions. The regions with significant negative correlations between vegetation change and LST accounted for 30.24%, mainly distributed in Zhaoqing, Jiangmen, and Huizhou. The regions with significant positive correlations between vegetation change and LST reached 32.67%, concentrated in the built-up areas of Guangzhou, Foshan, Zhongshan, Zhuhai, Hong Kong, Shenzhen, and Dongguan. The GBA is located in a humid region with abundant precipitation. The increase in temperature has a small impact on the available water for vegetation, but it can promote vegetation photosynthesis, and the increase in land surface temperature promotes vegetation growth.
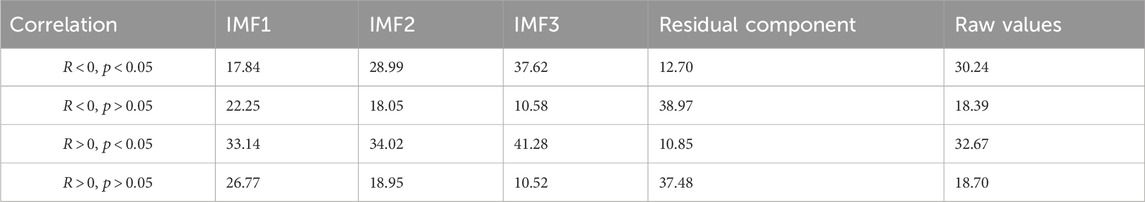
Table 5. The proportion of correlation between vegetation change and LST at different time scales.
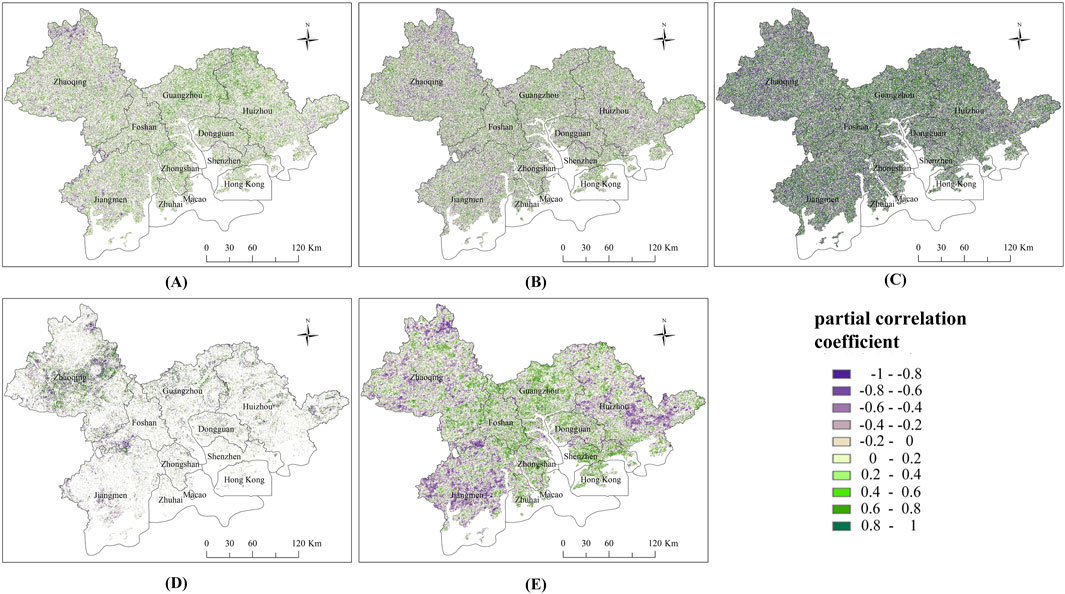
Figure 12. Spatial distribution of partial correlation between vegetation change and LST at different time scales (A) 1-year, (B) 3-year, (C) 7-year, (D) long-term trend, (E) overall values.
As shown in Table 6 and Figures 13A–E, the correlations between vegetation change and precipitation in the GBA were significantly correlated in most regions at the 3-year and 7-year temporal scales and the long-term trend. In the built-up areas of Guangzhou, Foshan, Jiangmen, Zhongshan, and Dongguan, an increase in precipitation promoted vegetation growth.
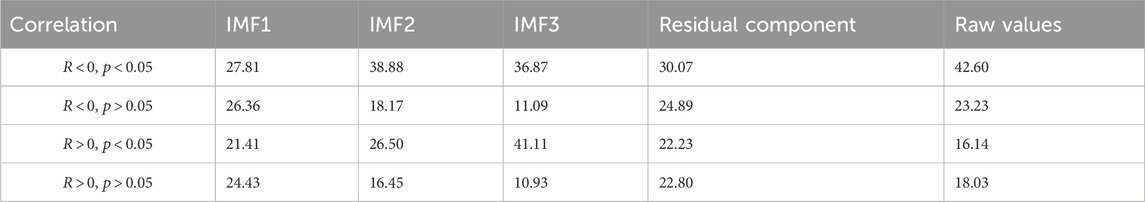
Table 6. The proportion of correlation between vegetation change and precipitation at different time scales.
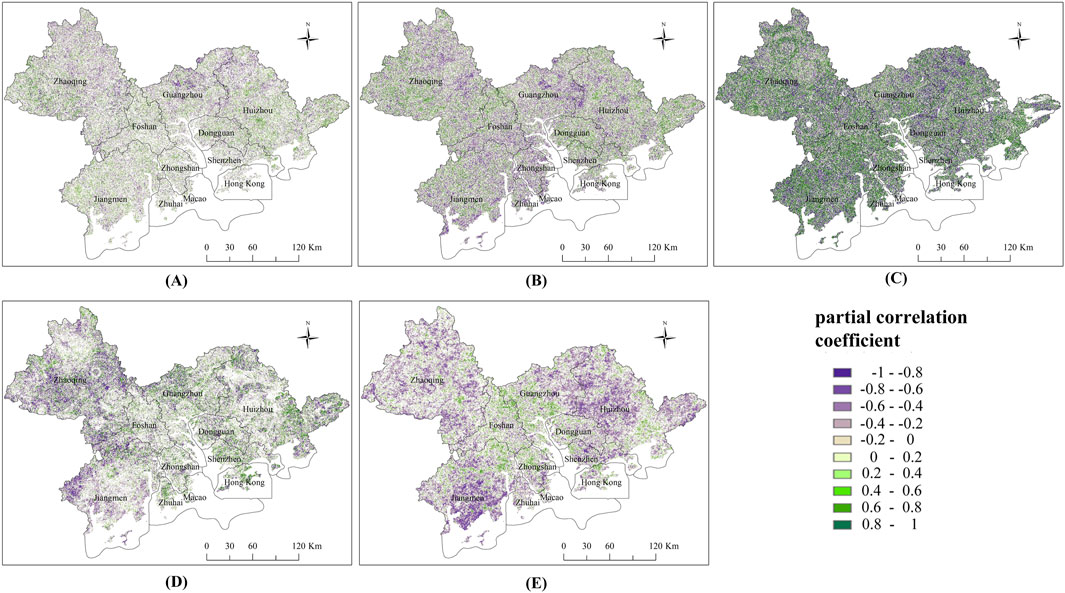
Figure 13. Spatial distribution of partial correlation between vegetation change and precipitation at different time scales (A) 1-year, (B) 3-year, (C) 7-year, (D) long-term trend, (E) overall values.
As shown in Table 7 and Figures 14A–E, for the overall values, an increase in sunshine duration promoted vegetation growth in the built-up areas of Guangzhou, Foshan, Zhongshan, Hong Kong, and Jiangmen.
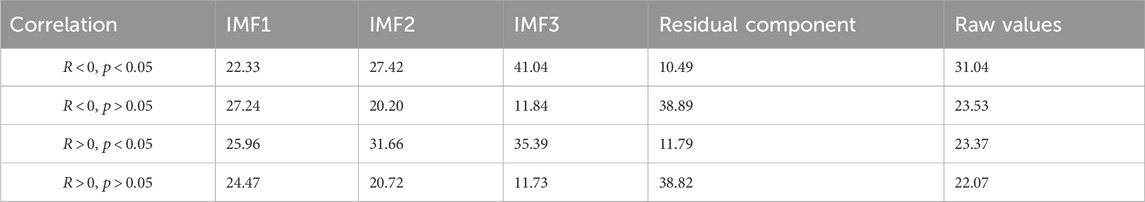
Table 7. The proportion of correlation between vegetation change and sunshine duration at different time scales.
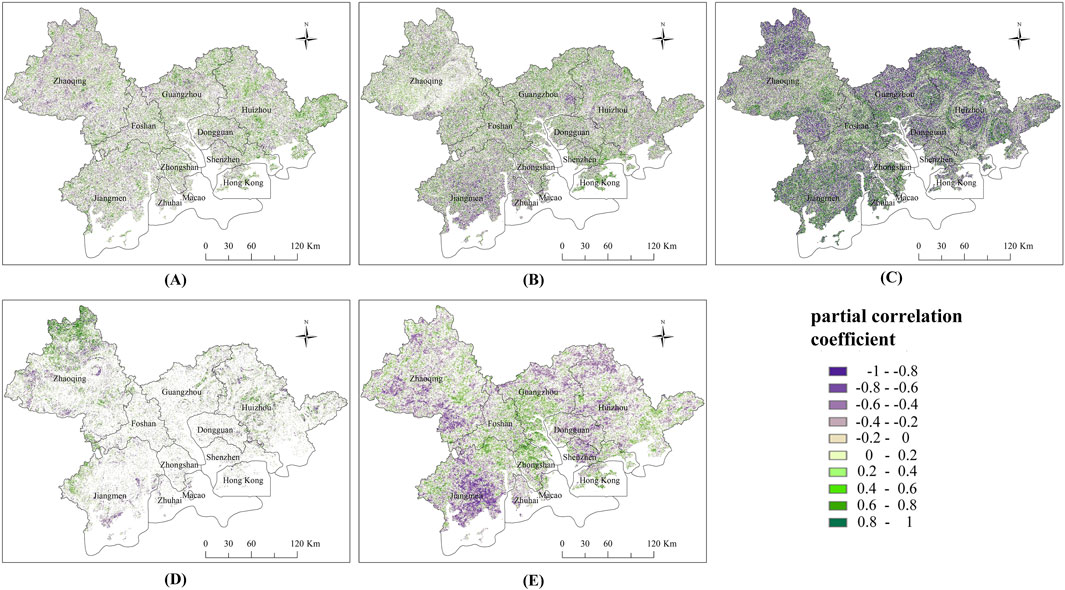
Figure 14. Spatial distribution of partial correlation between vegetation change and sunshine duration at different time scales (A) 1-year, (B) 3-year, (C) 7-year, (D) long-term trend, (E) overall values.
3.5 The contribution of climatic factors and anthropogenic activity to vegetation change
The RESTREND method was used to analyze the response of vegetation change to climate factors and anthropogenic activities in the GBA. Areas with extremely low proportions of impervious surfaces, where vegetation change is only affected by climate factors and not by anthropogenic activities, were randomly selected. The coefficients of a multiple regression model were calculated as the coefficients of the RESTREND model. Based on these coefficients, the predicted values of NDVI were calculated, and the differences between the predicted and observed values were compared. The IMF1 of NDVI was used as the dependent variable in the RESTREND model, and the IMF1 of LST, precipitation, and sunshine duration were used as independent variables. Based on this method, the relative importance of climate factors and anthropogenic activities on vegetation change was determined at the 1-year temporal scale. Similarly, the relative importance of climate factors and anthropogenic activities at the 3-year and 7-year temporal scales and the long-term trend were determined. When the relative contribution of climate factors to vegetation change was greater than 50%, vegetation change was considered to be dominated by climate factors. When the relative contribution of climate factors to vegetation change was less than 50%, vegetation change was considered to be dominated by anthropogenic activities.
As shown in Figure 15, at the 1-year, 3-year, and 7-year temporal scales, the relative contribution of the predicted NDVI values, i.e., vegetation changes induced by climate factors, was low in most regions of the GBA. The regions with a contribution greater than 50% accounted for 23.33%, 22.50%, and 18.79%, respectively, and these regions did not exhibit a clustered distribution, indicating that vegetation change was mainly driven by anthropogenic activities at short temporal scales, and the impact of urbanization on vegetation was significant. The GBA has experienced rapid urbanization in the past decade, with a significant expansion of high-intensity anthropogenic activity areas, which has significantly affected the distribution of vegetation. For the long-term trend, the regions with a relative contribution of predicted NDVI values greater than 50% accounted for 81.81%, and the regions with a contribution greater than 75% accounted for 69.85%, indicating that climate factors played a dominant role in vegetation change. The regions with a relative contribution of predicted NDVI values less than 50% in the long-term trend, i.e., where anthropogenic activities played a dominant role in vegetation change, were mainly distributed in the core urban areas. Among them, the regions with a contribution less than 25% accounted for 10.54%, indicating that with the expansion of the temporal scale, climate factors played a dominant role in vegetation change in most regions of the GBA in the long-term trend. However, in the core urban areas that were significantly affected by urbanization, vegetation change was determined by the intensity of anthropogenic activities.
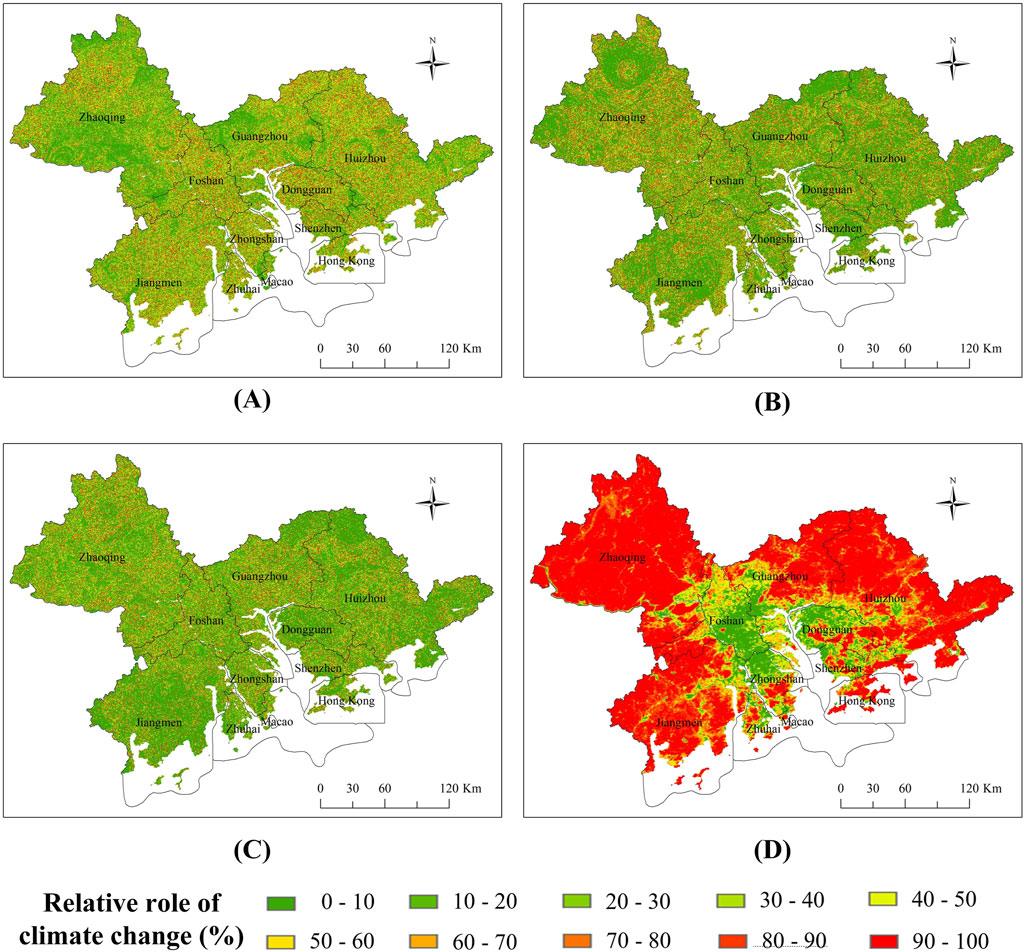
Figure 15. Spatial distribution of relative contributions of climate factors to vegetation change (A) 1-year, (B) 3-year, (C) 7-year, (D) long-term trends.
4 Discussion
4.1 Mapping anthropogenic activity from nighttime lights
Since 1992, NTL data have been extensively utilized in urbanization research, characterizing the intensity and extent of anthropogenic activity from a nocturnal perspective and demonstrating itself as a reliable indicator (Bennett and Smith, 2017). With the proliferation of NTL sensors, algorithms, and data products, NTL data are poised to provide enhanced insight into the socio-economic and environmental changes associated with urbanization. However, limitations persist in NTL-based urban applications. For example, scale effects introduce uncertainties across both spatial and temporal dimensions; differing spatial resolutions can lead to significant discrepancies in the spatial patterns identified in research findings, while varying temporal scales (e.g., annual, monthly, daily) can elicit different NTL patterns and outcomes. Beyond anthropogenic activity influences, NTL variations are also affected by angular effects, seasonal changes, transient light sources, cloud-mask failures, and noise. This can result in inconsistencies between NTL intensity and actual anthropogenic activity intensity (Zhang R. et al., 2023), such as in some rural areas or urban peripheries (Goldblatt et al., 2018). Furthermore, anthropogenic activity mapping presents a complex challenge encompassing factors like population, infrastructure, and land cover. To improve the accuracy of NTL data in urban applications, it is essential to integrate them with geospatial data and other multi-source remote sensing data.
Electricity consumption and urban development are positively correlated; increased electricity consumption primarily stems from sustainable economic growth, urban population, and expanded construction land. Taking Beijing, Shanghai, and Guangzhou as examples, high levels of anthropogenic activity and power consumption frequently coincide (Xu, 2023). Based on this observation, this study utilizes electricity consumption data as a secondary means of validating the characteristics of anthropogenic activity intensity. As shown in Figure 16, Guangzhou and Shenzhen exhibit the highest electricity consumption in the Pearl River Delta region, followed by Foshan and Dongguan. Although Huizhou’s electricity consumption is lower, its average annual growth rate is high (Figure 4), indicating a widespread distribution of areas experiencing increasing anthropogenic activity intensity. These results align with findings based on NTL intensity, providing indirect confirmation of the reliability of NTL intensity as a proxy for anthropogenic activity intensity.
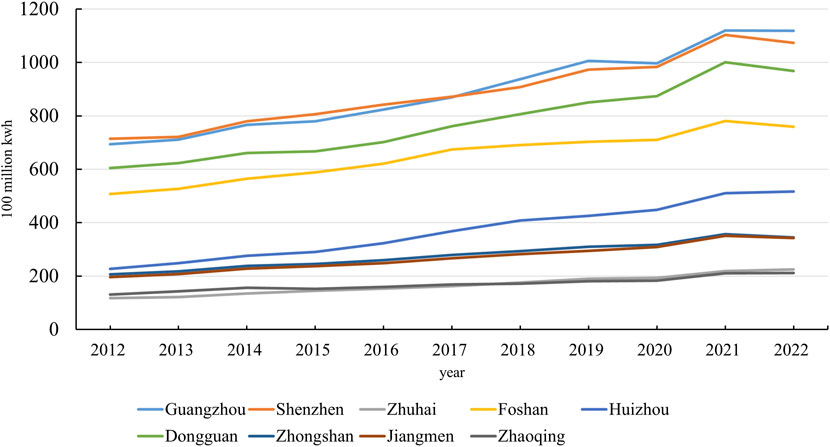
Figure 16. Electricity consumption by city in the Pearl River Delta.
4.2 Impact of climate change on vegetation dynamics
This study delved into the impact of climate change on vegetation dynamics in the GBA. Climate change is a key factor influencing vegetation dynamics. During the study period, land surface temperatures in the GBA generally increased, with the percentages of significantly increased areas in Dongguan and Zhongshan reaching 80.11% and 71.49%, respectively, while the long-term trend of precipitation showed a decrease, and sunshine duration showed no significant long-term changes. The greater the differences in land surface temperature, precipitation, and sunshine duration, the greater the differences in NDVI time series (Mondal and Jeganathan, 2018; Ding et al., 2023), which together constitute a scenario in which climate change has a complex impact on vegetation dynamics in the GBA.
The results showed that the impact of climate factors on vegetation in the GBA exhibited spatial heterogeneity, which is similar to the results of previous studies in northern China, the Yangtze and Yellow River basins, the Qinghai-Tibet Plateau, and West Bengal, India (Yuan et al., 2015; Banerjee et al., 2024; Xu et al., 2023). We found that the positive correlation between LST and vegetation was more pronounced in areas with higher urbanization levels, which is consistent with some studies that show rising temperatures cause earlier spring warming and delayed autumn cooling, extending the growing season and increasing the leaf area index, resulting in regional greening (Li et al., 2022). In contrast, Zhaoqing, Jiangmen, and Huizhou exhibiting a negative correlation between LST and vegetation were more common, where urbanization levels were relatively lower, increased temperatures can lead to enhanced vegetation transpiration, exacerbating water stress and inhibiting vegetation growth.
The decrease of precipitation have a limiting effect on vegetation growth in the long-term scale, which is consistent with the conclusions of relevant studies that indicate negative impacts of low precipitation and aridification on vegetation (Tuo et al., 2024). In Guangzhou, Foshan, and Zhongshan, precipitation and sunshine duration both showed a positive correlation with vegetation, which is similar to the research results from northern China, the Hengduan Mountains, the Qinghai-Tibet Plateau, and the Central Yunnan Urban Agglomeration (Chen et al., 2020; Chen et al., 2021; Zhang et al., 2019; He et al., 2024). From a mechanistic perspective, climate factors directly influence plant physiological processes such as photosynthesis, respiration, and transpiration, thereby affecting vegetation growth and distribution. Different vegetation types also exhibit varying sensitivities to these influences (Ren Y. et al., 2023), which may be the cause of spatial differences.
In the short-term scales, vegetation change may be driven by anthropogenic activities, but in the long-term trends, climate factors gradually become dominant. Some studies also point out that climate change is the main driver of vegetation change over long periods (Ge et al., 2021; Wang J. et al., 2024). This further emphasizes the key role of climate change in shaping vegetation dynamics, and the long-term impact of climate change needs to be fully considered when formulating ecological environment protection strategies.
4.3 Impact of anthropogenic activity on vegetation dynamics
From a spatial distribution perspective, the increase in anthropogenic activity intensity was mainly concentrated in the core urban areas, such as Guangzhou, Shenzhen, and Foshan, where the rate of urban expansion was faster. Zhaoqing, Huizhou, and Jiangmen showed relatively lower proportions of increased anthropogenic activity intensity, indicating that there is obvious spatial heterogeneity in the urbanization process within the GBA, which is similar to the results of research in many regions (Gao et al., 2024; Fan et al., 2022). Although the GBA generally exhibited a greening trend, with vegetation improving in 63.59% of the region, the problem of vegetation degradation remained prominent, especially in areas such as Zhongshan, Dongguan, and Guangzhou, where the total area of degradation accounted for as much as 28.99%. This indicates that rapid urbanization has a negative impact on vegetation cover (Yu et al., 2009; Ruas et al., 2022; Zhang et al., 2023a).
A significant negative correlation between anthropogenic activity intensity and vegetation change existed in some regions, particularly evident in the core urban areas (Gao et al., 2022; Zheng et al., 2021). Zhongshan, Dongguan, and Guangzhou experienced rapid expansion of impervious surfaces during the study period. Anthropogenic activity intensity increased significantly, and the proportion of vegetation degradation was relatively high, indicating that the urbanization process caused significant degradation of vegetation cover, which is similar to the research results in the GBA and the Lanzhou-Xining urban agglomeration (Wu et al., 2022; Wang J. et al., 2024). The results of the partial correlation analysis further confirmed this: as the temporal scale increased, the areas with significant correlations between vegetation change and anthropogenic activity intensity increased. In the long-term trend, anthropogenic activity intensity and vegetation change exhibited a significant negative correlation, particularly in the core urban areas, indicating that the urbanization development had a negative impact on vegetation. This is consistent with previous research that pointed out that urban expansion leads to a decrease in vegetation cover (Zou et al., 2025; Zhang et al., 2023b; Yang et al., 2021). The urbanization process leads to an increase in impervious areas and a decrease in green space areas, which directly results in a reduction of vegetation cover. At the same time, urbanization also changes surface hydrological processes and energy balance, further inhibiting vegetation growth (White and Greer, 2006; Zhou et al., 2021). For example, the dense distribution of buildings and the hardening of roads may lead to a decrease in soil moisture content, which is not conducive to vegetation growth. However, some studies have shown that anthropogenic activities promote vegetation cover, with ecological restoration projects, afforestation activities, and decreased population density becoming important factors for increased vegetation cover (Liu et al., 2023; Jin et al., 2020; Shi et al., 2020; Wang J. et al., 2024).
The impact of anthropogenic activities on vegetation varies at different temporal scales. In the short-term temporal scales, vegetation change is mainly driven by anthropogenic activities, such as the reduction of vegetation cover area caused by urban expansion, which is similar to the conclusions of some studies that found the short-term impacts of urban expansion on vegetation are more significant (Qi et al., 2023). In the long-term trend, areas with higher levels of urbanization showed a stronger dominance of anthropogenic activities, while non-urbanized areas tended to be dominated by climate factors (Prăvălie et al., 2022; Li P. et al., 2021; Pang et al., 2017; Banerjee et al., 2024; Yu et al., 2009; Hu et al., 2023). Studies have found that vegetation types and their specific ecological adaptation strategies determine their different response patterns to climate change, which also explains why vegetation changes in different regions exhibit different patterns under the same climatic conditions. For example, Zhaoqing, Huizhou, and Jiangmen had higher proportions of vegetation improvement, while Zhongshan and Dongguan showed obvious vegetation degradation.
4.4 Limitations and future directions
This study used remote sensing and meteorological data and employed various time series analysis methods to explore vegetation dynamics in the GBA and their relationship with climate change and anthropogenic activities. However, there are still some limitations, which are mainly reflected in the following aspects: 1. Data source limitations: This study relied on MODIS data and NPP-VIIRS/DNB nighttime light data, although these data have good applicability at the regional scale, there are still certain shortcomings in their spatiotemporal resolutions. This may lead to some bias in the detailed depiction of vegetation change and its influencing factors, especially for the evaluation of the lagged effects of extreme climatic events on vegetation. 2. Insufficient representation of meteorological data: Although this study used the monthly total precipitation and sunshine duration data from meteorological stations, the distribution of meteorological stations may not fully represent the climate conditions of the entire study area, especially in topographically complex regions, where the results of data interpolation may have some uncertainties. 3. Methodological limitations: In conducting multi-factor analysis, this study may not have fully captured the non-linear relationships between vegetation change and influencing factors. The selected indicators may not fully represent all climate factors when using the RESTREND method to evaluate the relative contribution of climate factors and anthropogenic activities to vegetation change, which may simplify or underestimate the complex influence of climate change on vegetation.
Future studies could be improved in the following aspects: 1. Improve data quality and resolution: Future research can try to use remote sensing data with higher spatial and temporal resolutions to monitor vegetation dynamics more precisely, and better evaluate the lagged effects of extreme climate events on vegetation. 2. Multi-source data integration: Combining remote sensing data with ground observation data can compensate for the shortcomings of remote sensing data in accuracy and validation. For example, field vegetation surveys and flux observations can be used to improve the accuracy and reliability of research results.
5 Conclusion
This study analyze the spatiotemporal patterns of vegetation change in the GBA, its response characteristics to anthropogenic activities and climate factors, and to quantify the relative contributions of climate factors and anthropogenic activities to vegetation change. According a comprehensive analysis of multi-source data, this study seeks to reveal the driving mechanisms of dynamic vegetation change in the context of urbanization.
The results of this study showed that the GBA as a whole experienced a significant vegetation greening process. The area with improved vegetation was significantly greater than that with degraded vegetation, indicating an overall increasing trend in vegetation cover in the region. Specifically, vegetation in Zhaoqing, Huizhou, and Jiangmen showed significant improvement, while vegetation degradation was more pronounced in the core urban areas of Zhongshan, Dongguan, and Guangzhou. Simultaneously, anthropogenic activities in the region also underwent significant changes. The intensity of anthropogenic activities showed a significant increase in half of the regions, reflecting the impact of the rapid urbanization process on anthropogenic activity intensity. In addition, LST also underwent significant changes, LST increased more noticeably in cities such as Dongguan, Zhongshan, Zhuhai, and Shenzhen, which may be related to the urban heat island effect. Further analysis showed that the dynamics of vegetation change are influenced by driving factors at different temporal scales. The intensity of anthropogenic activities showed smaller fluctuations at short temporal scales, while 65% of the region showed anthropogenic activity intensity fluctuations dominated by long-term trends, indicating that the changes in anthropogenic activities have a cumulative effect over long temporal scales. LST changes in core urban areas were also dominated by long-term trends, which may be the result of the combined effects of long-term urbanization and climate change.
The correlations between vegetation change and anthropogenic activity intensity, and between vegetation change and climate factors exhibited obvious spatiotemporal heterogeneity. As the temporal scale increased, the regions exhibiting significant correlations between vegetation change and anthropogenic activity intensity and between vegetation change and LST gradually increased, indicating that at longer temporal scales, the influences of anthropogenic activities and temperature on vegetation were more pronounced. Notably, vegetation change was significantly correlated with anthropogenic activity intensity in two-thirds of the regions, and the negative correlations were mainly distributed in the core urban areas of various cities, indicating that the urbanization process had a negative impact on vegetation. Simultaneously, regions where vegetation change was significantly negatively correlated with LST were mainly distributed in Zhaoqing, Jiangmen, and Huizhou, while regions with significant positive correlations were concentrated in the built-up areas of Guangzhou, Foshan, Zhongshan, Zhuhai, Hong Kong, Shenzhen, and Dongguan, reflecting the complex impact of temperature changes on vegetation growth in different regions. In addition, increases in precipitation and sunshine duration both promoted vegetation growth to a certain extent.
This study revealed the temporal characteristics of the impacts of climate factors and anthropogenic activities on vegetation change. At short temporal scales, vegetation change was mainly driven by anthropogenic activities, indicating that the short-term impact of urbanization on vegetation was more significant, while the influence of climate factors was relatively small. However, in the long-term trend, vegetation change in most regions was mainly dominated by climate factors, while the vegetation changes caused by anthropogenic activities were mainly distributed in the core urban areas, indicating that over the long-term, the influence of climate factors on vegetation gradually became apparent, while the influence of anthropogenic activities was mainly reflected in urbanized areas.
Data availability statement
The original contributions presented in the study are included in the article/supplementary material, further inquiries can be directed to the corresponding author.
Author contributions
YT: Conceptualization, Data curation, Formal Analysis, Funding acquisition, Investigation, Methodology, Software, Supervision, Validation, Visualization, Writing – original draft, Writing – review and editing. YW: Data curation, Resources, Software, Writing – review and editing. QY: Conceptualization, Data curation, Project administration, Writing – review and editing.
Funding
The author(s) declare that financial support was received for the research and/or publication of this article. This research was funded by the PhD research startup foundation with grant number 622187-BSKYQDJ.
Conflict of interest
Author YW was employed by China Water Huaihe Planning, Design and Research Co, LTD.
The remaining authors declare that the research was conducted in the absence of any commercial or financial relationships that could be construed as a potential conflict of interest.
Generative AI statement
The author(s) declare that no Generative AI was used in the creation of this manuscript.
Publisher’s note
All claims expressed in this article are solely those of the authors and do not necessarily represent those of their affiliated organizations, or those of the publisher, the editors and the reviewers. Any product that may be evaluated in this article, or claim that may be made by its manufacturer, is not guaranteed or endorsed by the publisher.
References
Abbas, S., Nichol, J. E., and Wong, M. S. (2021). Trends in vegetation productivity related to climate change in China’s Pearl River Delta. PLoS One 16, e0245467. doi:10.1371/journal.pone.0245467
Aburas, M. M., Abdullah, S. H., Ramli, M. F., Ash’ aari, Z. H., and Firdaus, M. (2015). Measuring land cover change in Seremban, Malaysia using NDVI index. Procedia Environ. Sci. 30, 238–243. doi:10.1016/j.proenv.2015.10.043
Afuye, G. A., Kalumba, A. M., and Orimoloye, I. R. (2021). Characterisation of vegetation response to climate change: a review. Sustainability 13, 7265. doi:10.3390/su13137265
Banerjee, A., Kang, S., Meadows, M. E., Sajjad, W., Bahadur, A., Moazzam, M. F. U., et al. (2024). Evaluating the relative influence of climate and human activities on recent vegetation dynamics in West Bengal, India. Environ. Res. 250, 118450. doi:10.1016/j.envres.2024.118450
Barboza, E. P., Cirach, M., Khomenko, S., Iungman, T., Mueller, N., Barrera-Gómez, J., et al. (2021). Green space and mortality in European cities: a health impact assessment study. Lancet Planet. Health 5, e718–e730. doi:10.1016/S2542-5196(21)00229-1
Bennett, M. M., and Smith, L. C. (2017). Advances in using multitemporal night-time lights satellite imagery to detect, estimate, and monitor socioeconomic dynamics. Remote Sens. Environ. 192, 176–197. doi:10.1016/j.rse.2017.01.005
Boschetti, M., Nutini, F., Brivio, P. A., Bartholomé, E., Stroppiana, D., and Hoscilo, A. (2013). Identification of environmental anomaly hot spots in West Africa from time series of NDVI and rainfall. ISPRS J. Photogramm. Remote Sens. 78, 26–40. doi:10.1016/j.isprsjprs.2013.01.003
Cao, J., Liu, H., Zhao, B., Li, Z., Drew, D. M., and Zhao, X. (2019). Species-specific and elevation-differentiated responses of tree growth to rapid warming in a mixed forest lead to a continuous growth enhancement in semi-humid Northeast Asia. For. Ecol. Manage. 448, 76–84. doi:10.1016/j.foreco.2019.05.065
Chang, J., Liu, Q., Wang, S., Li, X., Chen, W., Zhao, J., et al. (2022). Vegetation dynamics and their influencing factors in China from 1998 to 2019. Remote Sens. 14, 3390. doi:10.3390/rs14143390
Chen, S., Zhu, Z., Liu, X., and Yang, L. (2022). Variation in vegetation and its driving force in the Pearl river delta region of China. Int. J. Environ. Res. Public Health 19, 10343. doi:10.3390/ijerph191610343
Chen, S. T., Guo, B., Zhang, R., Zang, W. Q., Wei, C. X., Wu, H. W., et al. (2021). Quantitatively determine the dominant driving factors of the spatial—temporal changes of vegetation NPP in the Hengduan Mountain area during 2000–2015. J. Mt. Sci. 18, 427–445. doi:10.1007/s11629-020-6404-9
Chen, W., Xia, L., Xu, G., Yu, S., Chen, H., Chen, J., et al. (2022). Dynamic variation of NDVI and its influencing factors in the Pearl River Basin from 2000 to 2020. Ecol. Environ. 31, 1306. doi:10.16258/j.cnki.1674-5906.2022.07.003
Chen, Z., Wang, W., and Fu, J. (2020). Vegetation response to precipitation anomalies under different climatic and biogeographical conditions in China. Sci. Rep. 10, 830. doi:10.1038/s41598-020-57910-1
Chu, H., Venevsky, S., Wu, C., and Wang, M. (2019). NDVI-based vegetation dynamics and its response to climate changes at Amur-Heilongjiang River Basin from 1982 to 2015. Sci. Total Environ. 650, 2051–2062. doi:10.1016/j.scitotenv.2018.09.115
Csillik, O., Belgiu, M., Asner, G. P., and Kelly, M. (2019). Object-based time-constrained dynamic time warping classification of crops using Sentinel-2. Remote Sens. 11, 1257. doi:10.3390/rs11101257
Ding, H., Yuan, Z., Yin, J., Shi, X., and Shi, M. (2023). Evaluating ecosystem stability based on the dynamic time warping algorithm: a case study in the Minjiang river Basin, China. Ecol. Indic. 154, 110501. doi:10.1016/j.ecolind.2023.110501
Eckert, S., Hüsler, F., Liniger, H., and Hodel, E. (2015). Trend analysis of MODIS NDVI time series for detecting land degradation and regeneration in Mongolia. J. Arid. Environ. 113, 16–28. doi:10.1016/j.jaridenv.2014.09.001
Fan, P. Y., Chun, K. P., Mijic, A., Mah, D. N. Y., He, Q., Choi, B., et al. (2022). Spatially-heterogeneous impacts of surface characteristics on urban thermal environment, a case of the Guangdong-Hong Kong-Macau Greater Bay Area. Urban Clim. 41, 101034. doi:10.1016/j.uclim.2021.101034
Fang, J. Y., Piao, S. L., He, J. S., Zhao, Q. S., and Liu, G. H. (2003). Vegetation activity in China has been increasing in recent 20 years. Sci. China Ser. C Life Sci. 33, 545–552. doi:10.1360/03c0906
Funk, C. C., and Brown, M. E. (2006). Intra-seasonal NDVI change projections in semi-arid Africa. Remote Sens. Environ. 101, 249–256. doi:10.1016/j.rse.2005.12.014
Gao, K., Yang, X., Wang, Z., Lai, F., Zhang, H., Shi, T., et al. (2024). Sensing the multi-scale landscape functions heterogeneity by big geodata from parcel to urban agglomerations-a case of the Greater Bay Area, China. Int. J. Digit. Earth 17, 2304073. doi:10.1080/17538947.2024.2304073
Gao, W., Zheng, C., Liu, X., Lu, Y., Chen, Y., Wei, Y., et al. (2022). NDVI-based vegetation dynamics and their responses to climate change and human activities from 1982 to 2020: a case study in the Mu Us Sandy Land, China. Ecol. Indic. 137, 108745. doi:10.1016/j.ecolind.2022.108745
Ge, W., Deng, L., Wang, F., Zhang, H., Zhao, Y., Li, S., et al. (2021). Quantifying the contributions of human activities and climate change to vegetation net primary productivity dynamics in China from 2001 to 2016. Sci. Total Environ. 773, 145648. doi:10.1016/j.scitotenv.2021.145648
Geng, S., Zhang, H., Xie, F., Li, L., and Yang, L. (2022). Vegetation dynamics under rapid urbanization in the guangdong–Hong Kong–macao greater bay area urban agglomeration during the past two decades. Remote Sens. 14, 3993. doi:10.3390/rs14163993
Georgescu, M., Morefield, P. E., Bierwagen, B. G., and Weaver, C. P. (2014). Urban adaptation can roll back warming of emerging megapolitan regions. Proc. Natl. Acad. Sci. U. S. A. 111, 2909–2914. doi:10.1073/pnas.1322280111
Goldblatt, R., Stuhlmacher, M. F., Tellman, B., Clinton, N., Hanson, G., Georgescu, M., et al. (2018). Using Landsat and nighttime lights for supervised pixel-based image classification of urban land cover. Remote Sens. Environ. 205, 253–275. doi:10.1016/j.rse.2017.11.026
Gregg, J. W., Jones, C. G., and Dawson, T. E. (2003). Urbanization effects on tree growth in the vicinity of New York City. Nature 424, 183–187. doi:10.1038/nature01728
He, Y., Lin, C., Wu, C., Pu, N., and Zhang, X. (2024). The urban hierarchy and agglomeration effects influence the response of NPP to climate change and human activities. Glob. Ecol. Conserv. 51, e02904. doi:10.1016/j.gecco.2024.e02904
Hu, M., and Xia, B. (2019). A significant increase in the normalized difference vegetation index during the rapid economic development in the Pearl River Delta of China. Land Degrad. Dev. 30, 359–370. doi:10.1002/ldr.3221
Hu, T., Dong, J., Qiu, S., Yang, Z., Zhao, Y., Cheng, X., et al. (2023). Stage response of vegetation dynamics to urbanization in megacities: a case study of Changsha City, China. Sci. Total Environ. 858, 159659. doi:10.1016/j.scitotenv.2022.159659
Jiang, H., Xu, X., Guan, M., Lu, Y., Li, L., Chen, L., et al. (2020). Determining the contributions of climate change and human activities to vegetation dynamics in agro-pastural transitional zone of northern China from 2000 to 2015. Sci. Total Environ. 718, 134871. doi:10.1016/j.scitotenv.2019.134871
Jiang, L., Bao, A., Guo, H., Ndayisaba, F., Kurban, A., and De Maeyer, P. (2017). Vegetation dynamics and responses to climate change and human activities in Central Asia. Sci. Total Environ. 599, 967–980. doi:10.1016/j.scitotenv.2017.05.012
Jiang, P. (2022). Analysis of vegetation change in China and its sensitivity to climate variability from 1982 to 2015 [D]. Lanzhou, China: Lanzhou University. doi:10.27204/d.cnki.glzhu.2022.000377
Jin, K., Wang, F., Han, J. Q., Wu, Z. S., Tang, Y. L., Li, J. M., et al. (2020). Contribution of climatic change and human activities to vegetation NDVI change over China during 1982-2015. Acta Geogr. Sin. 75, 961–974.
Lasaponara, R., Abate, N., and Masini, N. (2024). Early identification of vegetation pest diseases using Sentinel 2 NDVI time series 2016-2023: the case of Toumeyella Parvicorvis at Castel Porziano (Italy). IEEE Geosci. Remote Sens. Lett. 21, 1–5. in press. doi:10.1109/lgrs.2024.3386218
Li, M., Wu, P., Ma, Z., and Liu, J. (2022). Prominent vegetation greening in spring and autumn across China during the 1981–2018 period. Environ. Res. Lett. 17, 124043. doi:10.1088/1748-9326/aca8be
Li, P., Wang, J., Liu, M., Xue, Z., Bagherzadeh, A., and Liu, M. (2021a). Spatio-temporal variation characteristics of NDVI and its response to climate on the Loess Plateau from 1985 to 2015. Catena 203, 105331. doi:10.1016/j.catena.2021.105331
Li, S., Yang, S., Liu, X., Li, L., and Zhao, Y. (2015). NDVI-based analysis on the influence of climate change and human activities on vegetation restoration in the Shaanxi-Gansu-Ningxia Region, Central China. Remote Sens. 7, 11163–11182. doi:10.3390/rs70911163
Li, Y., Zheng, Z., Qin, Y., Wang, J., Liu, J., Feng, Q., et al. (2021b). Relative contributions of natural and man-made factors to vegetation cover change of environmentally sensitive and vulnerable areas of China. J. Clean. Prod. 321, 128917. doi:10.1016/j.jclepro.2021.128917
Lin, X., Niu, J., Berndtsson, R., Yu, X., Zhang, L., and Chen, X. (2020). NDVI dynamics and its response to climate change and reforestation in northern China. Remote Sens. 12, 4138. doi:10.3390/rs12244138
Liu, C., Liu, J., Zhang, Q., Ci, H., Gu, X., and Gulakhmadov, A. (2022). Attribution of NDVI dynamics over the globe from 1982 to 2015. Remote Sens. 14, 2706. doi:10.3390/rs14112706
Liu, Y., Xie, Y., Guo, Z., and Xi, G. (2023). Effects of climate variability and human activities on vegetation dynamics across the Qinghai–Tibet Plateau from 1982 to 2020. Remote Sens. 15, 4988. doi:10.3390/rs15204988
Mehmood, K., Anees, S. A., Muhammad, S., Hussain, K., Shahzad, F., Liu, Q., et al. (2024a). Analyzing vegetation health dynamics across seasons and regions through NDVI and climatic variables. Sci. Rep. 14, 11775. doi:10.1038/s41598-024-62464-7
Mehmood, K., Anees, S. A., Rehman, A., Tariq, A., Zubair, M., Liu, Q., et al. (2024b). Exploring spatiotemporal dynamics of NDVI and climate-driven responses in ecosystems: insights for sustainable management and climate resilience. Ecol. Inf. 80, 102532. doi:10.1016/j.ecoinf.2024.102532
Mondal, S., and Jeganathan, C. (2018). Mountain agriculture extraction from time-series MODIS NDVI using dynamic time warping technique. Int. J. Remote Sens. 39, 3679–3704. doi:10.1080/01431161.2018.1444289
Ning, T., Liu, W., Lin, W., and Song, X. (2015). NDVI variation and its responses to climate change on the northern Loess Plateau of China from 1998 to 2012. Adv. Meteorol. 2015, 1–10. doi:10.1155/2015/725427
Pang, G., Wang, X., and Yang, M. (2017). Using the NDVI to identify variations in, and responses of, vegetation to climate change on the Tibetan Plateau from 1982 to 2012. Quat. Int. 444, 87–96. doi:10.1016/j.quaint.2016.08.038
Potter, C. S., and Brooks, V. (1998). Global analysis of empirical relations between annual climate and seasonality of NDVI. Int. J. Remote Sens. 19, 2921–2948. doi:10.1080/014311698214352
Pradhan, B., Yoon, S., and Lee, S. (2024). Examining the dynamics of vegetation in South Korea: an integrated analysis using remote sensing and in situ data. Remote Sens. 16, 300. doi:10.3390/rs16020300
Prăvălie, R., Sîrodoev, I., Nita, I. A., Patriche, C., Dumitraşcu, M., Roşca, B., et al. (2022). NDVI-Based ecological dynamics of forest vegetation and its relationship to climate change in Romania during 1987–2018. Ecol. Indic. 136, 108629. doi:10.1016/j.ecolind.2022.108629
Pravalie, R., Sîrodoev, I., and Peptenatu, D. (2014). Detecting climate change effects on forest ecosystems in Southwestern Romania using Landsat TM NDVI data. J. Geogr. Sci. 24, 815–832. doi:10.1007/s11442-014-1122-2
Qi, G., Cong, N., Luo, M., Qiu, T., Rong, L., Ren, P., et al. (2024). Contribution of climatic change and human activities to vegetation dynamics over southwest China during 2000–2020. Remote Sens. 16, 3361. doi:10.3390/rs16183361
Qi, T., Ren, Q., Zhang, D., Lu, W., and He, C. (2023). Impacts of urban expansion on vegetation in drylands: a multiscale analysis based on the vegetation disturbance index. Ecol. Indic. 147, 109984. doi:10.1016/j.ecolind.2023.109984
Qi, X., Jia, J., Liu, H., Qin, X., Zhang, Y., Liu, H., et al. (2019). Relative importance of climate change and human activities for vegetation changes on China's silk road economic belt over multiple timescales. Catena 180, 224–237. doi:10.1016/j.catena.2019.04.027
Ren, H., Wen, Z., Liu, Y., Lin, Z., Han, P., Shi, H., et al. (2023a). Vegetation response to changes in climate across different climate zones in China. Ecol. Indic. 155, 110932. doi:10.1016/j.ecolind.2023.110932
Ren, Y., Zhang, F., Zhao, C., and Cheng, Z. (2023b). Attribution of climate change and human activities to vegetation NDVI in Jilin Province, China during 1998–2020. Ecol. Indic. 153, 110415. doi:10.1016/j.ecolind.2023.110415
Rhif, M., Abbes, A. B., Martinez, B., de Jong, R., Sang, Y., and Farah, I. R. (2022). Detection of trend and seasonal changes in non-stationary remote sensing data: case study of Tunisia vegetation dynamics. Ecol. Inf. 69, 101596. doi:10.1016/j.ecoinf.2022.101596
Ruan, Z., Kuang, Y., He, Y., Zhen, W., and Ding, S. (2020). Detecting vegetation change in the Pearl River Delta region based on time series segmentation and residual trend analysis (TSS-RESTREND) and MODIS NDVI. Remote Sens. 12, 4049. doi:10.3390/rs12244049
Ruas, R. D. B., Laís, M. S. C., and Bered, F. (2022). Urbanization driving changes in plant species and communities–A global view. Glob. Ecol. Conserv. 38, e02243. doi:10.1016/j.gecco.2022.e02243
Shi, Y., Jin, N., Ma, X., Wu, B., He, Q., Yue, C., et al. (2020). Attribution of climate and human activities to vegetation change in China using machine learning techniques. Agric. For. Meteorol. 294, 108146. doi:10.1016/j.agrformet.2020.108146
Singh, P., Verma, P., Chaudhuri, A. S., Singh, V. K., and Rai, P. K. (2024). Evaluating the relationship between Urban Heat Island and temporal change in land use, NDVI and NDBI: a case study of Bhopal city, India. Int. J. Environ. Sci. Technol. 21, 3061–3072. doi:10.1007/s13762-023-05141-y
Sun, R., Chen, S., and Su, H. (2021). Climate dynamics of the spatiotemporal changes of vegetation NDVI in northern China from 1982 to 2015. Remote Sens. 13, 187. doi:10.3390/rs13020187
Tian, X., Tao, Z., Xie, Y., Shao, W., and Zhang, S. (2024). Spatiotemporal evolution and driving mechanism of fractional vegetation coverage in the Yangtze River Delta. IEEE J. Sel. Top. Appl. Earth Obs. Remote Sens. 17, 10979–10997. In Press. doi:10.1109/jstars.2024.3407727
Tuo, M., Xu, G., Zhang, T., Guo, J., Zhang, M., Gu, F., et al. (2024). Contribution of climatic factors and human activities to vegetation changes in arid grassland. Sustainability 16, 794. doi:10.3390/su16020794
Wang, B., Xu, G., Li, P., Li, Z., Zhang, Y., Cheng, Y., et al. (2020). Vegetation dynamics and their relationships with climatic factors in the Qinling Mountains of China. Ecol. Indic. 108, 105719. doi:10.1016/j.ecolind.2019.105719
Wang, J., and Liu, D. (2022). Vegetation green-up date is more sensitive to permafrost degradation than climate change in spring across the northern permafrost region. Glob. Change Biol. 28, 1569–1582. doi:10.1111/gcb.16011
Wang, J., Wang, Y., and Xu, D. (2024a). Desertification in northern China from 2000 to 2020: the spatial–temporal processes and driving mechanisms. Ecol. Inf. 82, 102769. doi:10.1016/j.ecoinf.2024.102769
Wang, M., Peng, J., Du, Y., Ma, J., Feng, Q., and Hu, Y. (2021). Scale consistency for investigating urbanization level, vegetation coverage, and their correlation. Urban For. Urban Green. 59, 126998. doi:10.1016/j.ufug.2021.126998
Wang, W., Luan, W., Jing, H., Zhu, J., Zhang, K., Ma, Q., et al. (2024b). Quantitative assessment of urban expansion impact on vegetation in the lanzhou–xining urban agglomeration. Appl. Sci. 14, 8615. doi:10.3390/app14198615
Wang, Z. X., Liu, C., and Huete, A. (2003). Progress in vegetation index research: from AVHRR-NDVI to MODIS-EVI. Acta Ecol. Sin. 5, 979–987. doi:10.3321/j.issn:1000-0933.2003.05.020
White, M. D., and Greer, K. A. (2006). The effects of watershed urbanization on the stream hydrology and riparian vegetation of Los Penasquitos Creek, California. Landsc. Urban Plan. 74, 125–138. doi:10.1016/j.landurbplan.2004.11.015
Wu, G., Dang, A., Tian, Y., and Kan, C. (2021). Study on the urban agglomerations structure of the Guangdong-Hong Kong-Macao Greater Bay Area based on spatiotemporal big data. J. Remote Sens. 25, 665–676. doi:10.11834/jrs.20210590
Wu, X., Sun, X., Wang, Z., Li, C., Gao, X., Lu, Y., et al. (2020). Vegetation changes and their response to global change based on NDVI in the Koshi river Basin of central Himalayas since 2000. Sustainability 12, 6644. doi:10.3390/su12166644
Wu, Y., Luo, Z., and Wu, Z. (2022). The different impacts of climate variability and human activities on NPP in the Guangdong–Hong Kong–Macao Greater Bay Area. Remote Sens. 14, 2929. doi:10.3390/rs14122929
Wuyun, D., Duan, M., Sun, L., Crusiol, L. G. T., Wu, N., and Chen, Z. (2024). Pixel-wise parameter assignment in LandTrendr algorithm: enhancing cropland abandonment monitoring using satellite-based NDVI time-series. Comput. Electron. Agric. 227, 109541. doi:10.1016/j.compag.2024.109541
Xu, B., Li, J., Pei, X., and Yang, H. (2023). Decoupling the response of vegetation dynamics to asymmetric warming over the Qinghai-Tibet plateau from 2001 to 2020. J. Environ. Manage. 347, 119131. doi:10.1016/j.jenvman.2023.119131
Xu, L. (2023). A study on the impact of urban development and its transmission effect on carbon emission in China [D]. Lanzhou, China: Lanzhou University. doi:10.27204/d.cnki.glzhu.2023.000245
Yan, W., Wang, H., Jiang, C., Jin, S., Ai, J., and Sun, O. J. (2021). Satellite view of vegetation dynamics and drivers over southwestern China. Ecol. Indic. 130, 108074. doi:10.1016/j.ecolind.2021.108074
Yang, K., Sun, W., Luo, Y., and Zhao, L. (2021). Impact of urban expansion on vegetation: the case of China (2000–2018). J. Environ. Manage. 291, 112598. doi:10.1016/j.jenvman.2021.112598
Yu, D., Shao, H., Shi, P., Li, X., and Ji, C. (2009). How does the conversion of land cover to urban use affect net primary productivity? a case study in shenzhen city, China. Agric. For. Meteorol. 149, 2054–2060. doi:10.1016/j.agrformet.2009.07.012
Yuan, J., Xu, Y., Xiang, J., Wu, L., and Wang, D. (2019). Spatiotemporal variation of vegetation coverage and its associated influence factor analysis in the Yangtze River Delta, eastern China. Environ. Sci. Pollut. Res. 26, 32866–32879. doi:10.1007/s11356-019-06378-2
Yuan, X., Li, L., Chen, X., Liu, X., Li, H., and Chen, Z. (2015). Effects of precipitation intensity and temperature on NDVI-based grass change over Northern China during the period from 1982 to 2011. Remote Sens. 7, 10164–10183. doi:10.3390/rs70810164
Zhang, P., Dong, Y., Ren, Z., Wang, G., Guo, Y., Wang, C., et al. (2023a). Rapid urbanization and meteorological changes are reshaping the urban veg-etation pattern in urban core area: a national 315-city study in China. Sci. Total Environ. 904, 167269. doi:10.1016/j.scitotenv.2023.167269
Zhang, Q. (2014). Contributions of climate change and human activities to vegetation dynamics of Loess Plateau [D]. Lanzhou, China: Lanzhou Jiaotong University. doi:10.7666/d.D539465
Zhang, R., Chen, S., Gao, L., and Hu, J. (2023b). Spatiotemporal evolution and impact mechanism of ecological vulnerability in the Guangdong–Hong Kong–Macao Greater Bay Area. Ecol. Indic. 157, 111214. doi:10.1016/j.ecolind.2023.111214
Zhang, W., Wang, L., Xiang, F., Qin, W., and Jiang, W. (2020). Vegetation dynamics and the relations with climate change at multiple time scales in the Yangtze River and Yellow River Basin, China. Ecol. Indic. 110, 105892. doi:10.1016/j.ecolind.2019.105892
Zhang, X., Jia, W., Lu, S., and He, J. (2024). Ecological assessment and driver analysis of high vegetation cover areas based on new remote sensing index. Ecol. Inf. 82, 102786. doi:10.1016/j.ecoinf.2024.102786
Zhang, Y., Xu, G., Li, P., Li, Z., Wang, Y., Wang, B., et al. (2019). Vegetation change and its relationship with climate factors and elevation on the Tibetan plateau. Int. J. Environ. Res. Public Health 16, 4709. doi:10.3390/ijerph16234709
Zhang, Z., Chang, J., Xu, C. Y., Liu, D., Yu, Z., Yang, H., et al. (2018). The response of lake area and vegetation cover variations to climate change over the Qinghai-Tibetan Plateau during the past 30 years. Sci. Total Environ. 635, 443–451. doi:10.1016/j.scitotenv.2018.04.113
Zheng, K., Tan, L., Sun, Y., Wu, Y., Duan, Z., Xu, Y., et al. (2021). Impacts of climate change and anthropogenic activities on vegetation change: evidence from typical areas in China. Ecol. Indic. 126, 107648. doi:10.1016/j.ecolind.2021.107648
Zhou, S., Zhang, W., Wang, S., Zhang, B., and Xu, Q. (2021). Spatial–temporal vegetation dynamics and their relationships with climatic, anthropogenic, and hydrological factors in the Amur River basin. Remote Sens. 13, 684. doi:10.3390/rs13040684
Keywords: vegetation dynamics, climate factors, anthropogenic activity, multiscale effects, Guangdong-Hong Kong-Macao greater bay area
Citation: Tang Y, Wang Y and Yang Q (2025) Multiscale effects of climate change and anthropogenic activity on vegetation dynamics in Guangdong-Hong Kong-Macao greater bay area. Front. Environ. Sci. 13:1574870. doi: 10.3389/fenvs.2025.1574870
Received: 11 February 2025; Accepted: 29 April 2025;
Published: 15 May 2025.
Edited by:
Tianjiao Feng, Beijing Forestry University, ChinaCopyright © 2025 Tang, Wang and Yang. This is an open-access article distributed under the terms of the Creative Commons Attribution License (CC BY). The use, distribution or reproduction in other forums is permitted, provided the original author(s) and the copyright owner(s) are credited and that the original publication in this journal is cited, in accordance with accepted academic practice. No use, distribution or reproduction is permitted which does not comply with these terms.
*Correspondence: Yun Tang, dGFuZ3l1bjIzQHdodS5lZHUuY24=