 Nating Song
 Yugui Zhang
- 1School of Public Affairs, University of Science and Technology of China, Hefei, China
- 2Institute of Semiconductors, Chinese Academy of Sciences, Beijing, China
With the rapid development of tourism, understanding its relationship with environmental pollution has become a critical issue. Traditional research methods often struggle to effectively capture complex time series data and nonlinear associations, limiting their ability to accurately analyze and predict the interactions between tourism development and environmental changes. In response to these challenges, this research introduces a time series modeling framework leveraging LSTM-Attention-Random Forest (LARF). The LSTM model captures the temporal dynamics in tourism and environmental data, the Attention mechanism enhances the focus on critical time steps, and the Random Forest improves prediction accuracy by leveraging nonlinear relationships through ensemble learning. Experimental results demonstrate that the LARF model significantly outperforms traditional methods in prediction accuracy and generalization ability across multiple datasets, with an average improvement of 18.2% in MSE and 16.5% in MAPE compared to baseline models like LSTM, GRU, and Random Forest. Specifically, the LARF model achieves an MSE of 30.0 on the Global Tourism Data and 35.0 on the China City Air Quality Data, highlighting its robustness and reliability. Furthermore, the model provides innovative insights for pollutant risk quantification and environmental management, offering actionable recommendations for sustainable tourism and environmental governance. This study contributes not only to advancing methodologies for analyzing tourism and environmental systems but also offers a versatile framework that can be applied to other complex systems for predictive modeling and decision support in the future.
1 Introduction
With the swift expansion of international tourism, the interaction between tourism and environment has become the focus of social attention. The environmental effects of tourism activities is not only reflected in the emission of pollutants and resource consumption, but also reflected in the changes in the ecosystem and the long-term impact of the earth system (Brtnickỳ et al., 2020). Therefore, studying the interconnected dynamics between tourism development and the environment holds substantial academic significance and practical application value. By accurately predicting this coupling relationship, it can provide scientific basis for policymakers to optimize tourism planning and promote sustainable development (Ma and Tang, 2022; Pan et al., 2021). At the same time, environmental pollution control and tourism resource management can also make more effective decisions based on this prediction.
However, current research concerning the interaction between tourism and environmental systems faces numerous challenges. Traditional research methods mostly rely on static models or linear regression models, which cannot effectively deal with complex, time-varying and nonlinear relationships (Khodayar and Wang, 2020). The interaction between tourism and environment is usually significant in time sequence, and the interaction between various environmental factors is difficult to be captured by traditional models (Guseva et al., 2022). Therefore, how to extract meaningful features from dynamic data over a long time span and accurately model this coupling relationship is still a key problem to be solved urgently.
In the past few years, researchers have proposed numerous techniques to simulate the interplay between the progression of tourism and environmental changes. Conventional approaches, including ARIMA, SARIMA, and similar time series models, are extensively applied to track the fluctuations in tourism and environmental indicators due to their well-established theoretical foundations. However, their linear nature presents challenges in handling intricate nonlinear associations (Sirisha et al., 2022; Zhang L. et al., 2025). To address this shortfall, machine learning techniques such as random forest and support vector machines have been employed to boost the capability of handling high-dimensional and multivariate datasets (Xiong and Zuo, 2020; Huang et al., 2025). Nonetheless, these methods frequently overlook the temporal dependencies inherent in time series data. Concurrently, deep learning techniques, like LSTM and GRU, are increasingly gaining attention and have shown substantial advancements in predicting time series data for tourism and environmental systems, thanks to their proficiency in modeling long-term temporal dependencies (Wang et al., 2022; Zhang H. et al., 2025). Despite these advancements, current methodologies still exhibit certain limitations. Deep learning heavily relies on the quantity and quality of data, traditional machine learning struggles to fully encapsulate the temporal features, and there remains a lack of comprehensive depiction of the nonlinear inter relationships and dynamic coupling among multiple variables.
In view of the above shortcomings, this paper proposes a new prediction model of coupling relationship between tourism development and environment (LARF), which integrates LSTM network, Attention mechanism and Random Forest to realize multi-level modeling of complex dynamic relationship. Different from traditional methods, this model focuses on combining the temporal feature extraction ability of deep learning with the nonlinear modeling advantage of ensemble learning. The LSTM network is good at dealing with dynamic changes in time series, Attention mechanism emphasizes key time points and improves the model’s capacity to identify critical information, and the random forest plays an important role in nonlinear feature learning and result stability. Through the modular design, LARF model not only has significant advantages in time-dependent feature extraction and multivariate relationship modeling, but also can adapt to the complex requirements of different data scenarios. Experiments demonstrate that the model markedly enhances the accuracy of predictions regarding the interconnection between tourism and the environment, provides reliable data support for policy making and environmental governance, and provides a general technical framework for complex system modeling.
The main contributions of this paper are as follows.
• A coupling relationship modeling method based on LARF is proposed to fully mine the time series characteristics and key factors in tourism and environment data.
• It enhances the model’s forecasting precision and generalizability, offering notable advantages in capturing multivariate and nonlinear relationships.
• It provides a new idea and tool for pollutant risk quantification and environmental governance strategy formulation, and holds significant practical relevance.
In Chapter two, the research status of related fields will be reviewed, and the main methods and challenges of modeling the link between tourism and environmental factors will be reviewed. The third chapter introduces the model framework and method details proposed in this paper. In Chapter four, the experimental design and dataset introduction are presented, and the experimental results are analyzed and discussed. In Section 5, we provide a summary of our findings and outline directions for future research.
2 Related work
2.1 Multi-dimensional influence and coupling relationship quantification of tourism activities on environment
A large number of studies have explored the multi-dimensional impacts of tourism activities on the environment, including pollutant emissions, resource consumption, and ecosystem damage (Irfan et al., 2023). For example, some studies have examined the effects that tourism has on air quality by investigating how increases in tourist numbers influence pollutant concentration levels (Zhang et al., 2020; Yu et al., 2023; Robaina et al., 2020). In addition, there are studies that focus on the pressure of tourism activities on water resources and land use, unveiling the interaction between tourism development and environmental carrying capacity.
In addition to tourism’s impact on the environment, environmental change will also backfire on the development of tourism. Environmental elements, including climate change and recurring natural disasters, can influence the appeal of tourist destinations, thereby impacting tourist numbers and tourism revenue (Rosselló et al., 2020). This type of research highlights the two-way interaction between tourism and the environment, pointing out the need for sustainable tourism development (Muhammad et al., 2021).
To measure the interaction tourism and the environment, scholars have adopted various indicators and models. For instance, the coordinated coupling degree model is frequently utilized to evaluate the level of harmonious development between tourism and environmental systems (Fei et al., 2021). These studies provide important theoretical support for understanding the dynamic relationship between them, but there are still shortcomings in dealing with complex time series and nonlinear relationships (Zheng et al., 2024), and more advanced modeling methods are urgently needed.
2.2 Theoretical framework of tourism-environment interaction
The two-way relationship between tourism and the environment is a complex and dynamic system, involving both the impact of tourism activities on the environment and the reverse effect of environmental changes on the development of the tourism industry. The Sustainable Tourism Development Theory emphasizes that while promoting economic growth and social prosperity, the tourism industry must take measures to reduce the negative impact on the environment and ensure the long-term sustainable use of resources (Park et al., 2022). This theory provides us with an important perspective, indicating that in the process of developing the tourism industry, it is necessary to consider the carrying capacity of the environment and promote the realization of green tourism and a low-carbon economy.
The Ecological Footprint Theory focuses on the consumption of natural resources and energy by tourism activities, as well as the impact of pollution and waste generated on the ecosystem (Işık et al., 2021). By quantifying the ecological footprint of tourism activities, researchers can more clearly understand how the tourism industry consumes natural resources and provide a scientific basis for tourism sustainability. The Environmental Kuznets Curve Hypothesis (EKC Hypothesis) reveals the relationship between economic development and environmental pollution, proposing that with economic development, environmental pollution will increase in the early stage, but after reaching a certain stage of development, the pollution level will tend to stabilize or decrease (Naveed et al., 2022).
These theories provide a powerful framework for understanding the complex feedback mechanism between tourism and the environment, revealing that tourism activities not only affect the environment, but also that environmental changes in turn affect the attractiveness of the tourism industry. Therefore, how to achieve the coordination between environmental protection and economic growth in tourism activities has become the key to promoting the development of sustainable tourism.
2.3 Evolution and challenges of modeling coupling relationship between tourism and environment
Early studies mostly used statistical methods such as linear regression and time series analysis (such as ARIMA model). These models are easy to use and interpretable, and can effectively capture the linear trend in the data (Liu et al., 2023; Zhou et al., 2024). However, when dealing with the intricate nonlinear dynamics of tourism and environmental systems, statistical models often yield suboptimal performance, the performance of statistical models is often unsatisfactory, and it is difficult to accurately reflect the dynamic interaction between them. Conventional machine learning techniques, including Support Vector Machine (SVM), decision trees, and random forests, have been applied to model the interaction between tourism activities and environmental changes (Demir and Sahin, 2022). These methods perform better than traditional statistical models in dealing with nonlinear relationship and high-dimensional data. For example, random forests improve the stability and predictive performance of the model by integrating multiple decision trees (Ghiasi and Zendehboudi, 2021; Pokhrel et al., 2023). However, these methods still have the problem of insufficient time series feature extraction when dealing with data with significant time series dependence, which limits their application in complex system modeling.
With the improvement of computing power and the increase of data volume, deep learning methods have gradually become a research hotspot. The Long Short-Term Memory (LSTM) network is extensively utilized for modeling the interaction between tourism and environmental conditions due to its outstanding ability to recognize long-range dependencies within time series data (Zhang et al., 2022). LSTM can effectively process data with complex temporal features, but its model structure is complex and the training process is time-consuming. In order to further improve the performance of the model, the attention mechanism is incorporated to strengthen the model’s capacity to focus on critical time steps, automatically identify and assign higher weights to important time points, so as to improve the prediction accuracy (Fahim et al., 2020; Masenya, 2024; Li and Guenier, 2024). However, while the Attention mechanism enhances the model’s capability to extract key features, it still faces challenges when dealing with multi-dimensional environmental data, especially in the case of complex interaction of environmental factors, and the performance of the model still needs to be improved. Ensemble learning methods such as random forest significantly improve the robustness and generalization ability of the model by combining multiple weak learners (Feng et al., 2021). These methods perform well in dealing with multivariate and nonlinear relationships, but their interpretability is relatively poor, and it is difficult to directly understand the internal mechanism of the model. In addition, deep learning and ensemble learning methods usually require a large amount of data and computing resources, which increases the complexity in practical applications.
Although the methods based on deep learning and ensemble learning have shown significant advantages in capturing complex nonlinear and temporal features, there are still problems such as high model complexity, large training cost and poor interpretation when dealing with large-scale and multi-dimensional environmental data (Mohammed and Kora, 2023). Therefore, how to improve the performance of the model while taking into account the simplicity and interpretability has become an important direction of current research (Mi et al., 2020).
3 Methods
3.1 Overview of the LARF model architecture
The relationship linking tourism development and the environment is dynamic, complex and highly nonlinear system. Tourism activities, such as changes in the number of tourists and tourism infrastructure construction, directly or indirectly cause environmental pollution (such as air quality degradation, wastewater discharge increase, etc.), while environmental changes (such as climate conditions, pollution levels) also affect tourists’ decision-making behavior. This bidirectional coupling relationship not only has significant time dependence, but also is cross-affected by multi-dimensional data, such as tourism economic indicators, environmental quality indicators, and climate data. However, traditional statistical models (such as linear regression and time series models) often assume linear relationships between variables, which cannot capture complex interaction characteristics. However, a single deep learning model is easily limited to the problem of insufficient nonlinear relationship modeling or overfitting. Therefore, the design motivation of LARF model is to build a hybrid framework that integrates the advantages of deep learning and ensemble learning, accurately captures the dynamic coupling relationship between tourism and environment, and provides support for scientific prediction and policy making.
In terms of the model’s functions, the LARF model adopts a modular design, as shown in Figure 1. The overall structure includes a data preprocessing module, an LSTM-Attention module, a random forest module, and an output module, with each module playing a key role in modeling the association between tourism and environmental dynamics. The data preprocessing module standardizes the original data of tourism and the environment, fills missing values, and reconstructs time series to solve the problems posed by complex data sources and inconsistent units. The utilization efficiency of multi-source data is improved through standardized processing, and sliding window technology is employed to capture the dynamic temporal characteristics of the data.
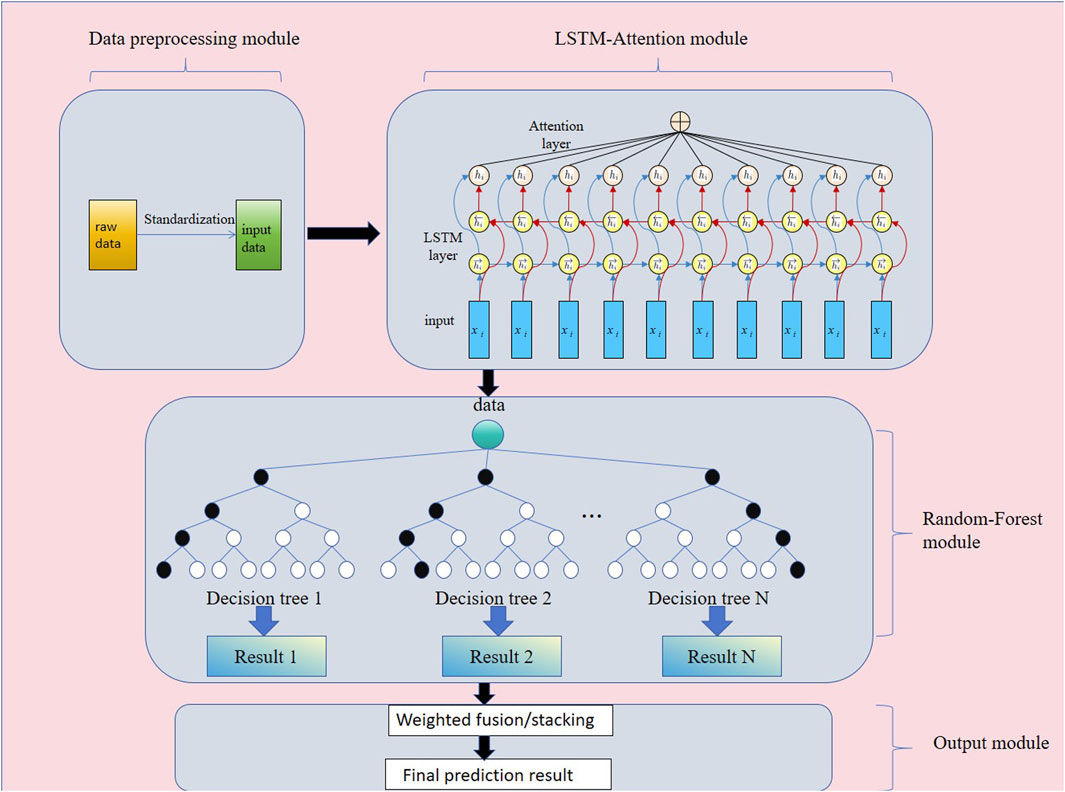
Figure 1. Structure diagram of LARF multi-module tourism and environment coupling relationship prediction model.
As the core part of the model, the LSTM-Attention module effectively extracts short-term fluctuations and extended temporal relationships within the data. Additionally, the Attention mechanism enhances the model’s ability to focus on key time points through automatic weighting, allowing the model to capture significant effects such as the lagging impact of a surge in tourist numbers on air pollution during peak tourist seasons or focusing on “key events” like holidays and extreme weather. This improves prediction accuracy. The high-dimensional time series features extracted by the random forest module further model nonlinear relationships, and its noise-robust capabilities make it suitable for handling the seasonal fluctuations of tourism data and the high-dimensional complexity of environmental data. For example, the random forest module can capture the nonlinear pattern of escalating pollution when the number of tourists exceeds a certain threshold. Finally, the output module integrates the prediction results from the random forest to generate short-term predictions (such as future pollution levels or tourist numbers) and long-term trend analysis (such as the influence of tourism growth on ecological landscape), thus providing a clear and quantitative decision-making basis for policymakers.
The justification for the choice of model components is based on the strengths of each individual method. Random Forest was selected over other ensemble models like XGBoost or CatBoost due to its robust ability to handle complex, high-dimensional, and noisy data, which is crucial for modeling tourism and environmental data. While XGBoost and CatBoost excel in handling non-linear relationships, they require additional feature engineering to capture time dynamics effectively, which makes Random Forest a more natural fit for this research. Additionally, although Transformer-based models such as BERT and GPT have demonstrated superior performance in long-range dependency modeling, their high computational cost and complexity, especially when handling large-scale time-series data, make them less suitable for the practical requirements of this study. Therefore, we opted for the LSTM-Attention framework, which balances efficiency and predictive power while effectively capturing temporal dynamics and providing flexibility for integrating multi-source data.
The LARF model is both a theoretical and practical tool for addressing the complex interactions between tourism and the environment, offering robust support for management and decision-making. During peak tourism seasons or major festivals, when environmental pressures such as exhaust emissions and wastewater increase, the model predicts pollution levels using historical data, enabling preemptive measures like limiting tourist flow or enhancing environmental facilities. It also quantifies the feedback of environmental conditions on tourism, such as predicting changes in tourist numbers following air governance policies, to optimize resource allocation and evaluate policy effectiveness. Additionally, the LARF model identifies the carrying capacity of scenic resources and determines critical thresholds to prevent overdevelopment and environmental degradation. At a strategic level, it simulates the long-term effects of development strategies, such as the impact of new scenic spots on regional environmental quality or analyzing trends in sustainable tourism and environment development over the next decade. Combining LSTM, Attention mechanisms, and Random Forest, the LARF model captures dynamic patterns, emphasizes critical data points, and models nonlinear relationships, while its modular design ensures adaptability across diverse datasets and applications. This makes it a versatile framework for advancing quantitative analysis and promoting sustainable tourism and environmental management through accurate predictions and scientific decision-making.
3.2 LSTM module
In the LARF model of this paper, the LSTM (Long Short-Term memory network) module is used to extract the dynamic features in the time series data, especially to capture the short-term fluctuations and long-term dependence in the integration of tourism and environmental systems. LSTM performs well in time series modeling through its unique gating structure, which can effectively avoid the gradient disappearance or gradient explosion problems common in traditional recurrent neural Network (RNN) (Zargar, 2021). As shown in Figure 2, the LSTM module stores the important long-term information in the time series through the memory unit, and dynamically controls the inflow, retention or forgetting of information through the coordination of the forget gate, input gate and output gate (Jiasen et al., 2020), so as to realize the efficient extraction and update of historical information and ensure that the model can accurately model the dynamic relationship in the time series.
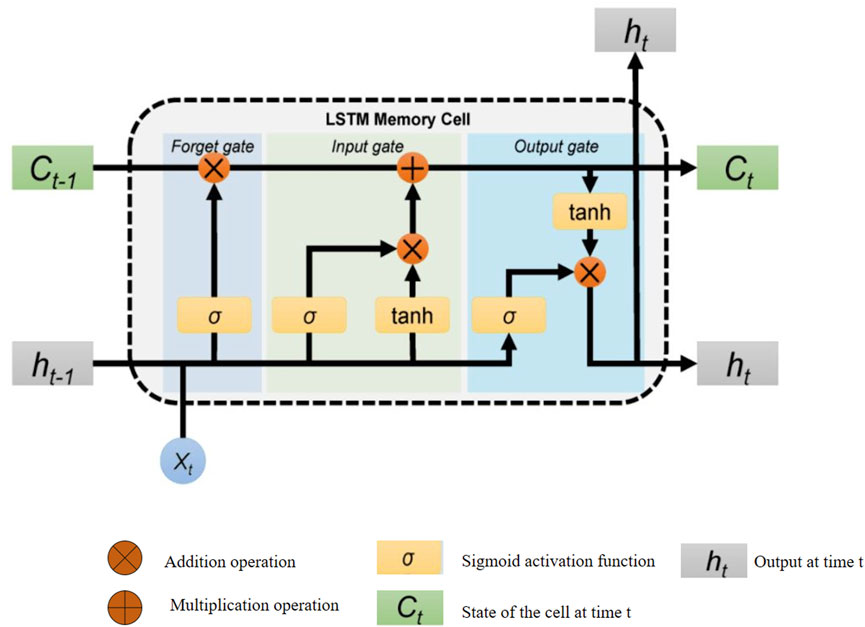
Figure 2. Temporal feature extraction module of LSTM based on time dependence.
In this paper, the main role of the LSTM module is to extract time series features from tourism and environment data, model the short-term and long-term effects of tourism activities on environmental conditions, and the reaction relationship of environmental changes on tourism. It is characterized by the memory unit to effectively capture short-term fluctuations and long-term dependence, and adapt to the characteristics of tourism peak season and environmental feedback (He et al., 2021). The ratio of information inflow and forgetting was dynamically adjusted to ensure that the model was flexible in time series data. Moreover, the gating mechanism effectively alleviates the gradient vanishing problem of traditional RNN, making it suitable for complex time series tasks. The following formula specifically describes the calculation process of each gating mechanism in the LSTM module.
The core mechanism of LSTM consists of the following steps, which are progressively updated and computed in combination with the temporal properties of the input data:
The forget gate, which is used to decide which past information should be kept and which should be forgotten at the current time step t. As shown in Equation 1.
where
The input gate, which is used to decide how the input information at the current time step is updated to the memory cell. Its calculation consists of two parts:
The first is information selection (Equation 2).
The second is new candidate value generation (Equation 3).
where
Update the memory cell state. The state of the current memory cell is updated by forgetting the old information and adding new information (Equation 4):
where
The output gate, which determines the hidden state at the current time step, is
where
The LSTM module plays a core role in time series feature extraction in the LARF model. Its unique gating mechanism enables the model to accurately capture the dynamic relationship between tourism and the environment, and provide high-quality temporal features for the subsequent Attention mechanism and random forest module. This design effectively improves the modeling accuracy and stability of LARF model, and becomes the basic module for analyzing the interaction between tourism and the environment.
3.3 Attention module (multi-head attention)
In the LARF model, as a key component, the multi-head attention module is mainly used to model the multi-dimensional characteristics of time series. Different patterns are modeled by multiple attention heads in parallel, and the short-term dependence, long-term dependence and interaction between variables in time series are captured from different feature subspaces (Liu et al., 2021). For example, one attention head can focus on short-term fluctuations during peak tourism seasons, while another head can model the impact of environmental governance policies on long-term trends. The Attention mechanism is able to identify key time points in tourism and environmental data (such as major holidays or high-pollution days) and assign higher weights to these time steps, thereby helping the model highlight the most important information for target prediction (Liu et al., 2022). Through the output fusion of multiple attention heads, the multi-head attention module can comprehensively learn different time series patterns, enhance the feature expression ability, and provide high-quality input for the subsequent random forest module. In addition, the multi-head attention module is usually used in combination with the output of LSTM to further refine the time series features extracted by LSTM and weight the key time steps, so as to capture complex patterns and important information in the sequence more effectively.
As shown in Figure 3, the multi-head attention mechanism learns the features and patterns of time series in different subspaces by computing multiple attention heads in parallel, and assigns different weights to different time steps. The core goal is to enhance the model’s ability to capture key time points and multivariate interactions, especially in tourism and environment modeling, to be able to identify “critical events” or “high impact time points”, such as the short-term impact of the surge in tourist numbers on environmental pollution during the peak tourism season, and the long-term effect of policy adjustments on the interaction between environment and tourism. The figure on the left shows the overall architecture of multi-head Attention, which relies on Scaled DotProduct Attention, while the figure on the right further shows how it is calculated. By weighting the Query, Key, and Value, the model is able to assign different attention weights to each time step in the input time series, thereby highlighting the most important information for predicting the target. The multi-head attention mechanism parallelizes this process, uses multiple attention heads to model different patterns in different feature subspaces, and fuses their outputs, which significantly improves the feature expression ability and the description effect of complex temporal relationships. The following formula provides a detailed explanation of the multi-head attention mechanism’s computation process.
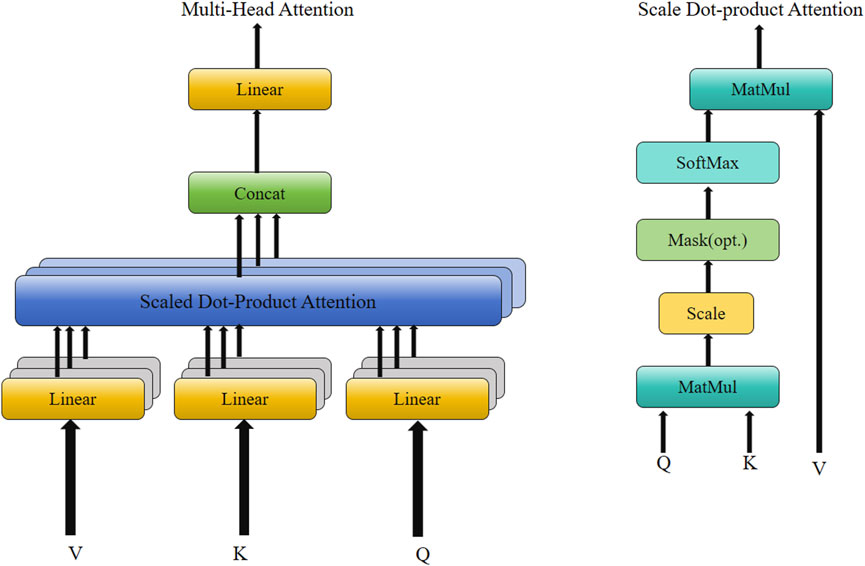
Figure 3. Multi-head attention temporal feature focusing module.
Scaled DotProduct Attention, the basic unit of multi-head attention, consists of the following computation steps:
The input sequence X is projected into the Query, Key, and Value vector Spaces, respectively, using a linear transformation (Equation 7).
where
We then compute the attention weights, where query
where
Finally, the weighted values are output, and the weights are used in the weighted value matrix
MultiHead Attention extends the idea of single-head attention by computing multiple attention heads in parallel to learn different feature patterns. The process is divided into the following steps:
Firstly, the input
where
Then there is concatenation and linear transformation, which concatenates the outputs of all attention heads and maps them to the original dimension by linear transformation (Equation 10).
where
3.4 Random forest module
In the LARF model of this paper, the Random Forest module is used as the final predictor, which is mainly used for nonlinear modeling and integrated prediction of high-dimensional time series features extracted by the LSTM-Attention module. Random forest is a decision tree-based ensemble learning technique. By constructing multiple decision trees and fusing the prediction results of these trees, the generalization ability and robustness of the model are improved (Sun et al., 2020). As shown in Figure 4, random forest generates multiple decision trees through random sampling and feature selection, and each tree is trained with different subsamples and feature combinations and generates independent prediction results. It can effectively deal with high-dimensional feature data, especially in the modeling of the interaction between tourism and the environment, and can capture complex nonlinear relationships, such as the multivariate interaction patterns between the number of tourists, climate conditions and pollutant concentrations (Malekloo et al., 2022). The random forest module ensures the stability and accuracy of the final prediction results through the integration strategy, and reduces the risk of overfitting that may be caused by a single decision tree (Huo et al., 2021).
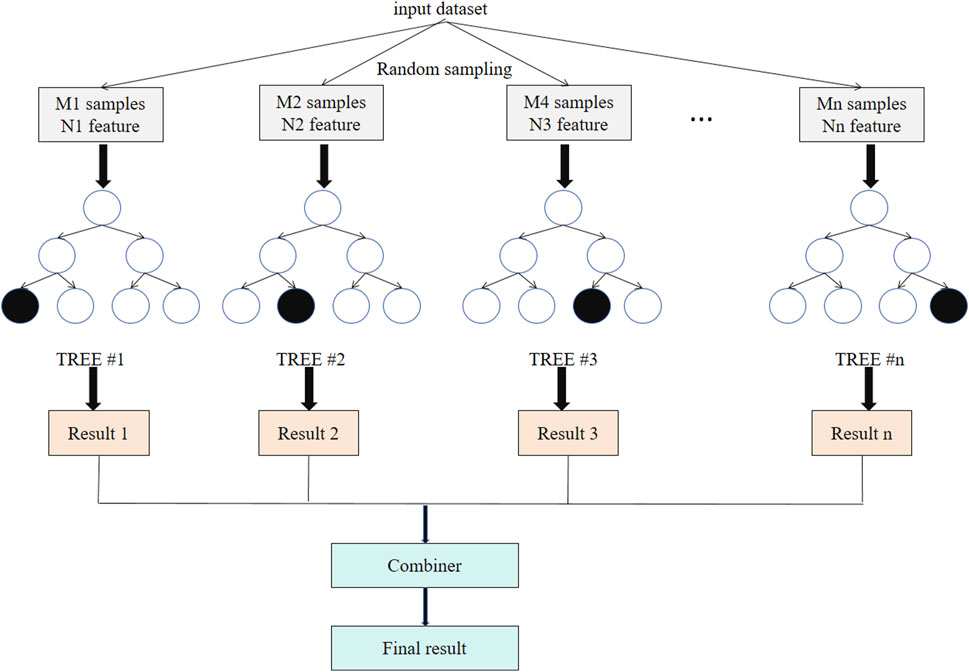
Figure 4. Random forest ensemble learning model.
The random forest module models the high-dimensional features generated by the LSTMAttention module. The input features contain multivariate time series information, such as the number of tourists, weather conditions, pollutant concentrations, etc. The random forest gradually extracts the nonlinear relationship between the input features and the target variable through the node splitting of each decision tree. Through random sampling and feature selection, the random forest module performs well in reducing noise interference and data overfitting. Especially when there is redundant information or outliers in the input features, the random forest can still stably generate accurate prediction results. In addition, random forests are able to capture complex nonlinear patterns in the interaction between tourism and the environment, such as the increase in tourist numbers may nonlinearly exacerbate environmental pollution, and certain external interventions (such as flow restriction policies) may further change this relationship. The results of each decision tree are fused by majority voting (classification task) or weighted average (regression task) to generate the final prediction value, which provides high-precision results for tourism and environment modeling. The following formula describes the key steps and computational process of random forest in detail:
Prediction of a single decision tree, given the input feature vector
where
Each decision tree is built using a random subsample of the dataset (Bootstrap sampling) and some of the features.
While for random sampling and feature selection, random sampling is used to generate subsamples
Ensemble prediction of random forest, random forest generates the final prediction value by integrating the results of all decision trees, and the specific methods are divided into two types according to the task type.
One is the classification task, where the random forest uses majority voting to aggregate the classification results of all decision trees (Equation 12):
where
The other is regression, where the random forest takes a weighted average of the predictions of all the decision trees (Equation 13):
where
4 Experiment
4.1 Datasets
In this study, three publicly available datasets are utilized: Global Tourism Data, China City Air Quality and Tourism Data, and Kaggle Tourism and Pollution Dataset. These data sets have time series characteristics and contain multivariate data on tourism and environment.
The Global Tourism Data is provided by the United Nations World Tourism Organization (UNWTO) and covers tourism-related indicators on a global scale, including key economic indicators such as tourist numbers, international tourism revenues, and domestic tourism expenditures, as well as time-series data related to tourism activities (Kyrylov et al., 2020). The data is broken down by country and region and covers multiple years (typically starting in 1995, with the data updated annually). In addition, the dataset contains macroeconomic characteristics such as the contribution rate of tourism to the country’s GDP and the employment situation.
The China City Air Quality and Tourism Data contains air quality, meteorological data, and information related to tourism activities in major cities in China. Air quality data include concentrations of common pollutants such as PM2.5, PM10, NO2, SO2, and CO, as well as AQI (Air Quality index) (Zeng et al., 2021). Meteorological data include temperature, humidity, precipitation, and so on. Tourism data includes indicators such as the number of tourists, tourism revenue, and the rank of scenic spots. Data are usually recorded on a daily or monthly basis, covering tier-1 to tier-3 cities in China with high temporal resolution.
Kaggle Tourism and Pollution Dataset is a comprehensive dataset that integrates tourism activity data (e.g., number of tourists, hotel occupancy rates, international flight flows) and environmental pollution data (e.g., PM2.5, PM10, CO2 emissions, greenhouse gas concentrations) from major cities around the world (Ahmad et al., 2018). The dataset also contains geolocation and meteorological features (e.g., temperature, precipitation) for some cities. The time span of the data usually covers 5–10 years, and the resolution of the data varies according to the city and variable, and it is mainly recorded on a monthly basis.
In order to ensure data quality and consistency, comprehensive data preprocessing operations must be performed. The purpose of preprocessing is to remove data noise, fill missing values, standardize data formats, align and unify different data sources, so as to ensure that the data can be effectively used in the LARF model. Additionally, we would like to clarify that while the datasets primarily include tourism-related variables, the integration of pollution and industrial emissions data is derived from supplementary sources, particularly those provided by the United Nations Environment Programme (UNEP) and other environmental data repositories. These sources include specific datasets on air quality, CO2 emissions, and industrial pollution that were incorporated into the dataset for a more comprehensive analysis. The pollution and industrial emissions data are aligned with tourism data to provide a multi-dimensional view of how tourism and environmental factors interact over time. The integration of these variables was carefully conducted to ensure data consistency and accuracy, with a focus on aligning different temporal and spatial resolutions of the datasets. Tables 1, 2 describe in detail the key variables, response variables, data preprocessing methods, and statistical characteristics of each data set.
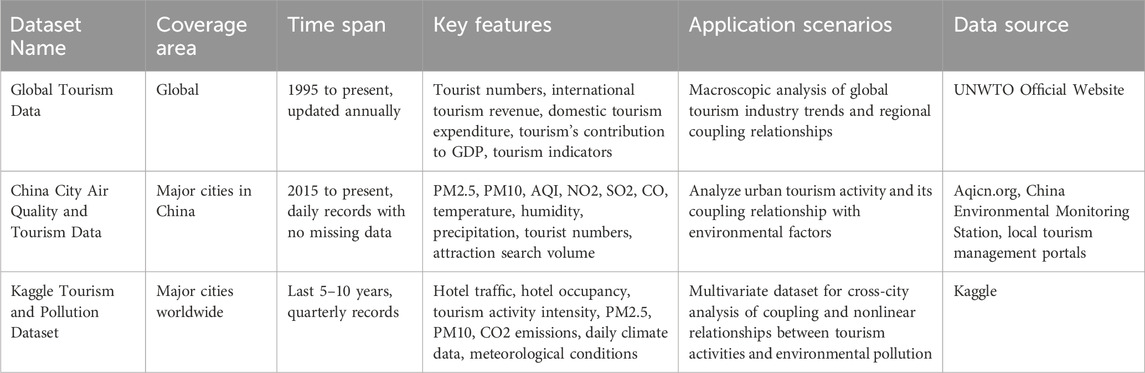
Table 1. Overview of the tourism and environment-related datasets.
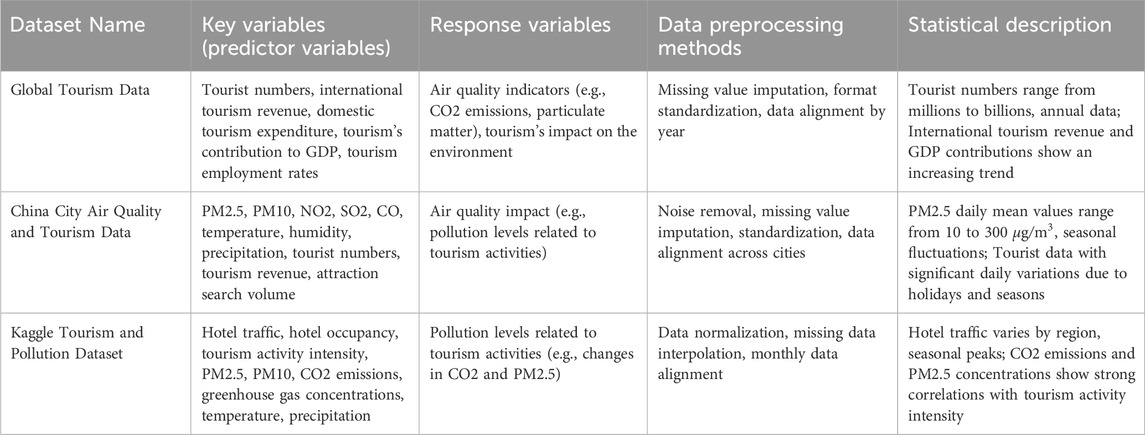
Table 2. Overview of key variables, response variables, data preprocessing methods, and statistical descriptions for each dataset.
4.2 Experimental environment and settings
The experimental environment and setup in this paper fully consider the computational complexity and performance optimization requirements of the model. The combination of high-performance hardware (such as NVIDIA Tesla V100) and mainstream deep learning frameworks (PyTorch) ensures that the model can complete training and inference quickly. In terms of parameter Settings, the hyperparameters are fine-tuned according to the characteristics of LSTM-Attention and Random Forest to balance prediction performance and computational efficiency. Table 3 gives the detailed Settings of various experimental parameters.
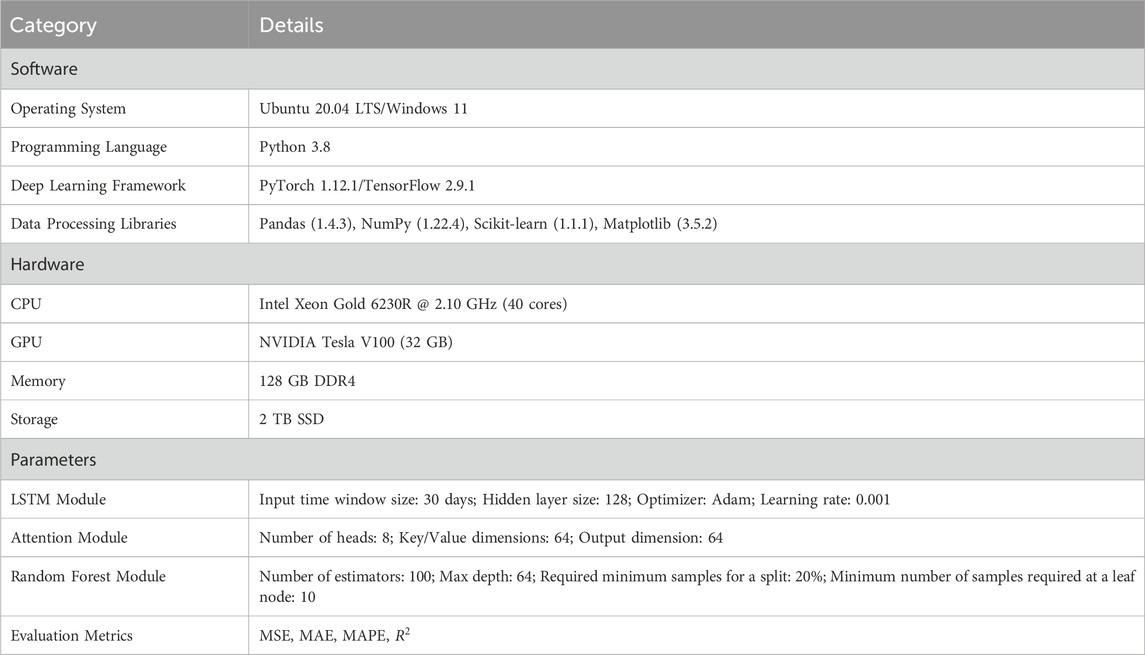
Table 3. The experimental environment and parameter settings are detailed.
In order to fully evaluate the computational efficiency of the model, we recorded and analyzed the training time and inference time of the LARF model in detail. In the experiment, we used NVIDIA Tesla V100 GPU for training. The size of the training dataset and the complexity of the model directly affected the training time. According to the experimental settings, with default parameters and hardware configuration, the training time of the LARF model on the Global Tourism Data dataset is about 6–8 h, and the inference time is about 0.5 s per sample; the training time on the China City Air Quality and Tourism Data dataset is about 4–6 h, and the inference time is about 0.3 s per sample; the training time on the Kaggle Tourism and Pollution dataset is about 5–7 h, and the inference time is about 0.4 s per sample. These results show that although the LARF model has a high computational complexity, it can complete the training and inference tasks within a reasonable time frame with efficient hardware support and optimized parameter configuration.
4.3 Evaluation metrics
To assess the predictive accuracy of the LARF model, this paper selects key evaluation metrics to quantify the error and the model’s fit between its predicted values and actual observations.
MSE (Equation 14) measures the squared error between the predicted value and the true value and is a commonly used basic error metric. It is particularly sensitive to large errors, suitable for tasks that require high model accuracy, and can significantly reflect whether there is a large deviation in the model.
RMSE (Equation 15) is the square root of MSE and has the same dimension as the original data, which facilitates the interpretation of the actual magnitude of the error. Compared with MSE, RMSE is also sensitive to large errors, but its physical meaning is more intuitive, and it is suitable for measuring the overall level of model prediction error.
where
MAPE (Equation 17) measures the relative proportion of prediction errors, and the results are expressed as percentages to facilitate comparisons across data of different magnitudes. This indicator is suitable for scenarios where the target values have a large relative range of variation, such as seasonal fluctuations in tourist numbers or environmental pollution levels.
In general, MSE and RMSE emphasize large errors and are suitable for tasks that require high prediction accuracy of the model, and the physical meaning of RMSE is more intuitive. MAE (Equation 16) pays more attention to the average deviation size of the model, is not sensitive to outliers, and is suitable for scenarios with noisy data. MAPE measures the relative proportion of prediction errors and is suitable for situations where the range of target values fluctuates greatly. Together, these indicators provide multi-dimensional evaluation criteria for the prediction accuracy and stability of LARF model, and comprehensively verify the prediction ability of LARF model and the effectiveness of modeling the complex relationship between tourism and environment.
where
4.4 Results
Now for the
In Figure 5, the distribution of true and predicted values is represented by a scatter plot, while the fitted line illustrates the predicted trend of the model. The experimental results demonstrate that the LARF model achieves excellent prediction performance across the three datasets, with a close fitting relationship between the true and predicted values. The fitted line (green) is close to the ideal line (black dashed line), and the
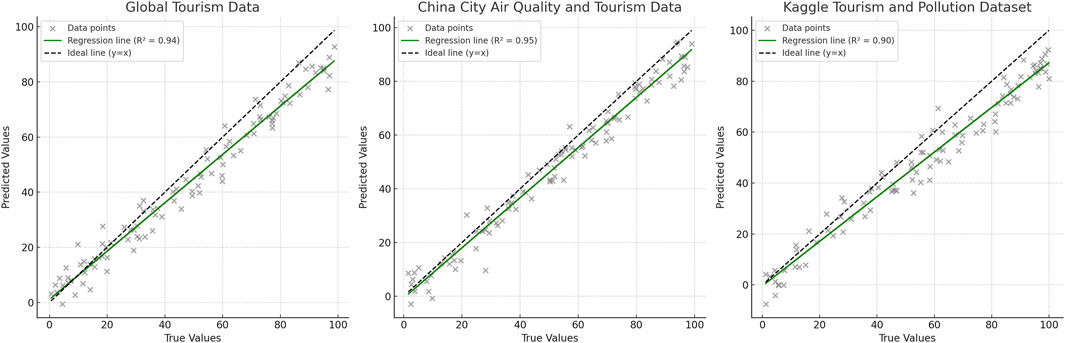
Figure 5. Plot of the fitting results of the true and predicted values of the LARF model on multiple data sets.
In the experimental results of this paper, we compared the LARF model with several other common hybrid models and evaluated its prediction performance on multiple data sets. The experimental results are shown in Table 4. From the evaluation indicators (MSE, RMSE, MAE, MAPE) in the table, it can be seen that the LARF model performs better than other comparison models on all data sets.
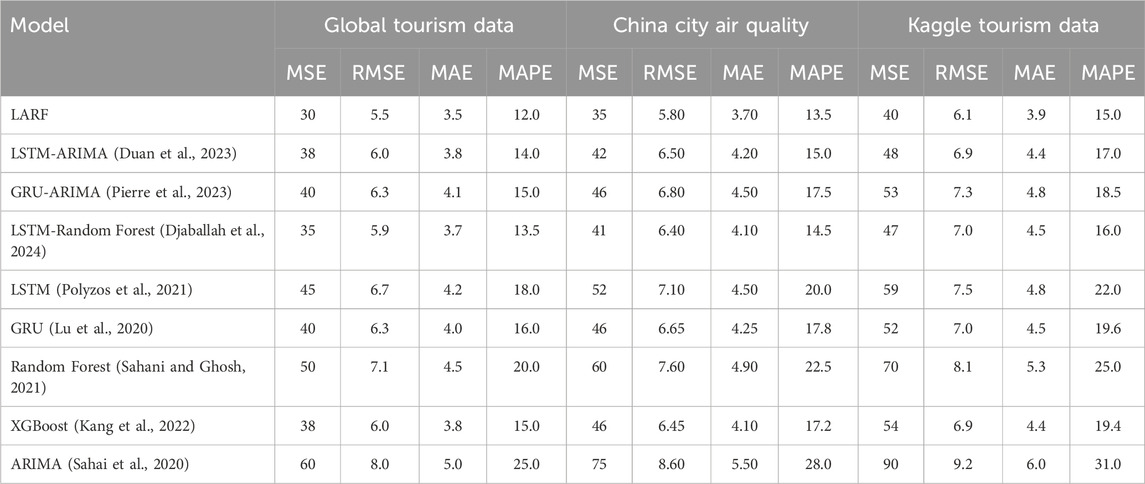
Table 4. Performance comparison of different models on multiple datasets.
The LARF model has obvious advantages in MSE, RMSE, MAE and MAPE on the three data sets of Global Tourism Data, China City Air Quality and Kaggle Tourism Data. On the Global Tourism Data data set, LARF has an MSE of 30, RMSE of 5.5, MAE of 3.5 and MAPE of 12.0, which are all lower than other models, especially when compared with LSTM, GRU, XGBoost and other models, it shows higher accuracy and stability. Although LSTM and GRU can also capture the characteristics of time series data well, their MSEs are 45 and 40 respectively, which are significantly higher than LARF, and their performance in MAE and MAPE has not reached the level of LARF.
The comparison with other hybrid models further highlights the advantages of the LARF model in dealing with complex nonlinear relationships. The comparison results of the LARF model with hybrid models such as LSTM-ARIMA, GRU-ARIMA, and LSTM-Random Forest also show that LARF performs better in capturing nonlinear relationships between multiple variables. LSTM-ARIMA and GRU-ARIMA are stronger in processing time series data, but not as good as LARF in prediction accuracy. Especially on the Kaggle Tourism Data dataset, the MAPE of LARF is 15.0, compared with 17.0 for LSTM-ARIMA and 18.5 for GRU-ARIMA, showing a large gap, indicating that the LARF model has better prediction ability when solving the complex relationship between tourism and environmental pollution.
In addition, traditional single models (such as ARIMA) have great limitations in processing these complex time series data and multi-dimensional features. As can be seen in Table 4, ARIMA has the highest MSE, RMSE, MAE and MAPE on all data sets, especially on the Kaggle Tourism Data data set, where ARIMA’s MAPE is as high as 31.0, much higher than LARF’s 15.0, which further verifies the LARF model’s strong adaptability and superior prediction performance on complex data sets.
The experimental results of the LARF model on multiple data sets show that it not only performs well in processing time series dependencies and nonlinear relationships, but also has obvious advantages in improving prediction accuracy, reducing errors and optimizing model stability. This makes the LARF model more reliable in practical applications and can provide more accurate prediction support for the management of tourism and environmental pollution.
In order to see the performance comparison of each model on different data sets more intuitively, we visualize the data in Table 4, as shown in Figure 6.
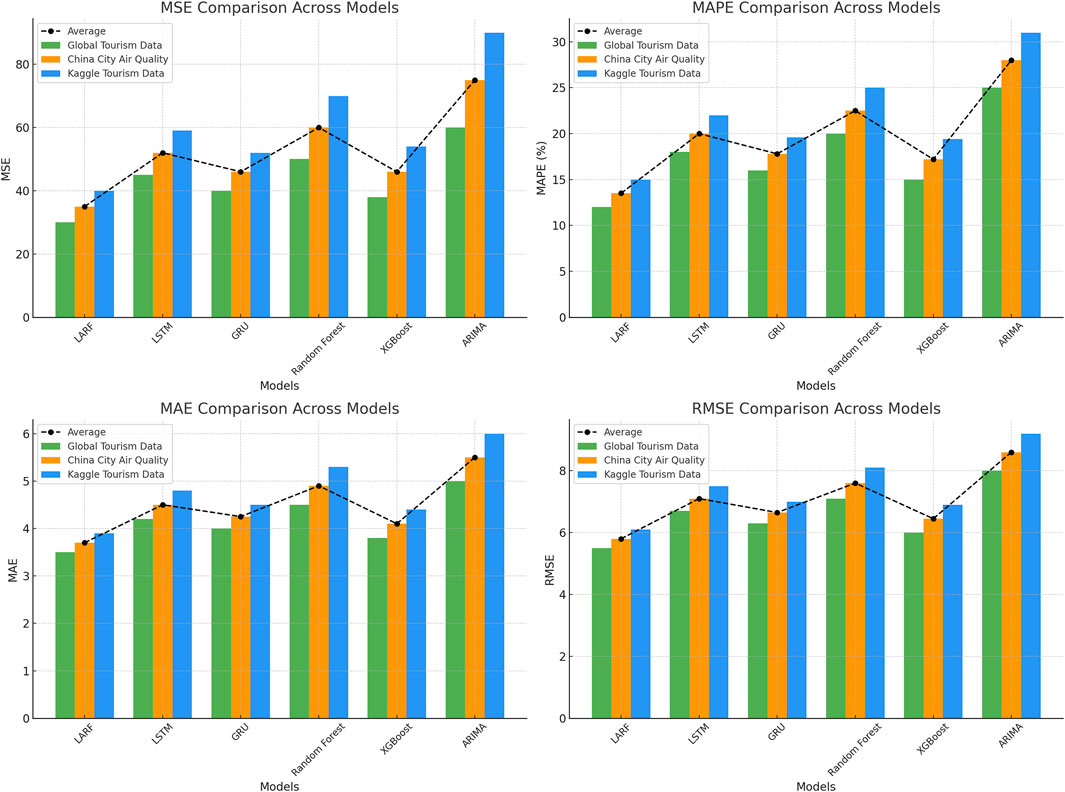
Figure 6. Visual comparison of performance indicators of multiple models on different data sets.
Through this visualization, it is clear to see the performance difference of different models on different datasets, while observing that LARF model performs well on all metrics, while ARIMA has the worst performance, especially on complex datasets such as Kaggle Tourism Data.
Now the ablation experiment is performed, in which the contribution of each module in the LARF model to the overall performance of the model is analyzed. By removing each module one by one, we systematically evaluate the specific role of each module in capturing time dependence, extracting key features, and modeling complex nonlinear relationships, and observe the changes of model performance (such as MSE, RMSE, MAE, MAPE) on different data sets, In order to measure the extent of each module’s impact on the model’s predictive capabilities. The experimental results are shown in Table 5.
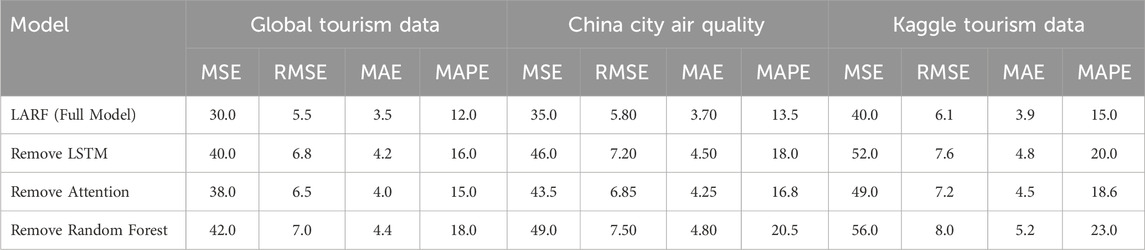
Table 5. Ablation study: performance after removing modules.
As shown in Table 5, the ablation experiment results show the impact of removing each module (LSTM, Attention, Random Forest) in the LARF model on the performance of the model. The LARF Full Model performs best on all datasets in terms of evaluation metrics (such as MSE of 30.0 and MAPE of 12.0 for Global Tourism Data), which verifies the effectiveness of the synergy of each module. MSE and MAPE rise significantly after removing the LSTM module, indicating the critical role of LSTM in capturing temporal dependencies. After removing the Attention module, the MAPE increases from 15.0 to 18.6, indicating the importance of Attention in extracting key time step information. After removing the Random Forest module, MSE and MAPE rise to 56.0 and 23.0 respectively on Kaggle Tourism Data, which verifies its advantages in nonlinear relationship modeling. In general, each module is indispensable for the performance improvement of LARF model.
These findings are further visualized in Figure 7, which presents a combined bar and line plot for the ablation experiment results across the three datasets and four evaluation metrics (MSE, RMSE, MAE, and MAPE). The bar chart clearly shows the performance of each model (Full LARF model and the ablated versions) on different datasets, with distinct colors representing Global Tourism Data, China City Air Quality, and Kaggle Tourism Data. The line plot connects the average performance values across datasets, highlighting the overall trend for each model. This visualization intuitively demonstrates the significant degradation in performance after removing individual modules, especially for metrics such as MAPE and MSE. It emphasizes the contribution of each module in maintaining the robustness and accuracy of the LARF model.
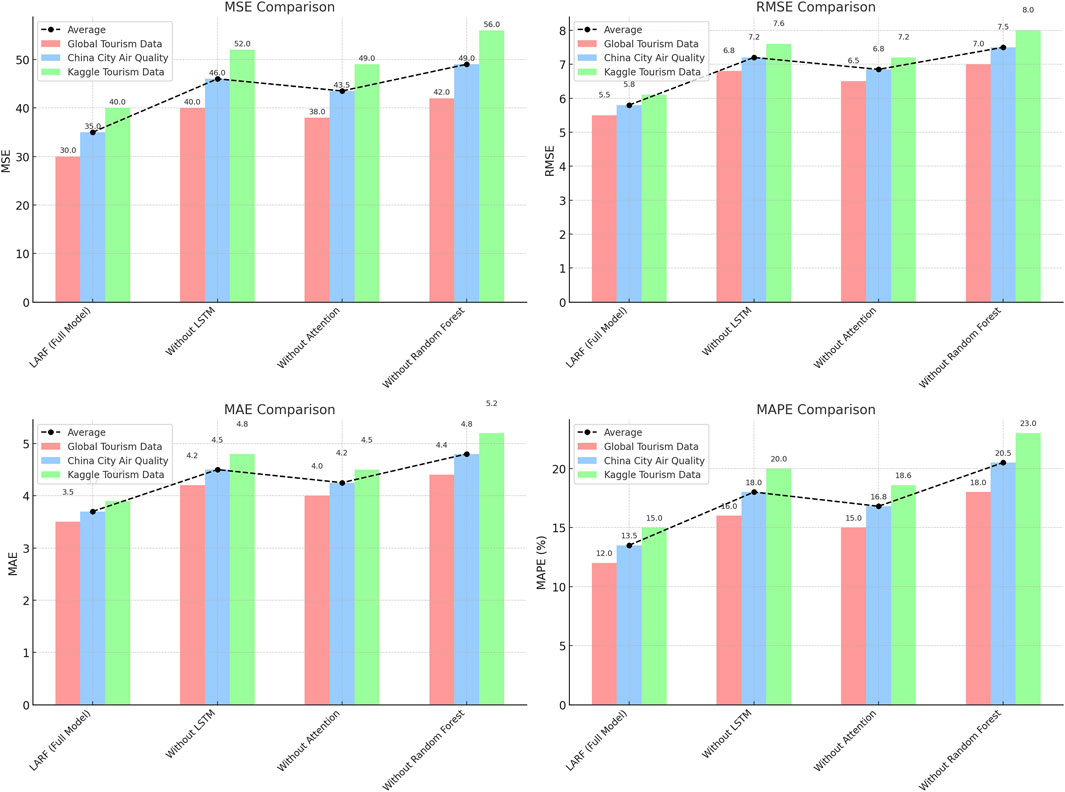
Figure 7. Ablation study: visualization of the performance after removing modules.
Finally, a feature importance analysis experiment is conducted, focusing on utilizing the LARF model to identify the most impactful input features for predicting the interaction between tourism development and environmental dynamics.
The results are illustrated in Figure 8, which displays the normalized significance of features derived from the random forest module for three datasets: Global Tourism Data, China City Air Quality and Tourism Data, and Kaggle Tourism and Pollution Dataset. Each panel in the figure corresponds to one dataset, with features represented along the x-axis and their normalized importance scores along the y-axis. The bar lengths reflect the contribution of each feature, enabling a clear comparison of their relative significance. This visualization effectively highlights the dominant features and their varying impacts across different datasets, providing an intuitive understanding of the factors influencing the tourism-environment relationship.
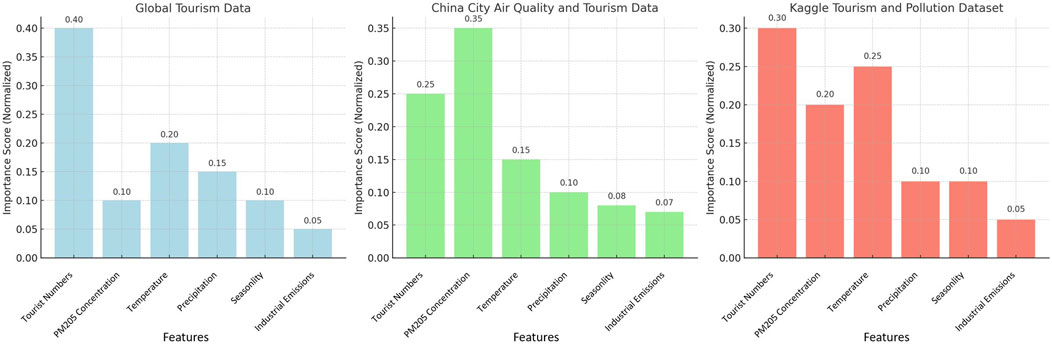
Figure 8. Tourism environment modeling feature importance scores for the three datasets.
In the Global Tourism Data, tourist arrival numbers are the most critical feature, boasting an importance score of 0.40. This highlights their pivotal role in shaping environmental variables. Other influential factors include temperature (0.20) and PM2.5 concentrations (0.15), indicating the significant impacts of air pollution and climatic conditions. Seasonality (0.10) and industrial emissions (0.05) contribute to a lesser degree. Regarding the China City Air Quality and Tourism Data, PM2.5 concentrations emerge as the most dominant feature, with an importance score of 0.35. This underscores the strong correlation between air quality and urban tourism activities. Tourist arrival numbers (0.25) and temperature (0.15) also play significant roles, while seasonality (0.10) and industrial emissions (0.07) capture additional patterns. In the Kaggle Tourism and Pollution Dataset, a more evenly distributed pattern of feature importance scores is evident. Tourist arrival numbers (0.30) and PM2.5 concentrations (0.25) are the top-ranked features, followed by temperature (0.15) and seasonality (0.10). Industrial emissions (0.05) have the least impact, suggesting their relatively minor influence on the predictive models. Collectively, these findings consistently underscore the crucial roles of tourist numbers and air pollution across different datasets. At the same time, they reveal dataset-specific nuances in the importance of other contributing factors.
Several key insights and implications are revealed from the feature importance analysis experiments in this paper. Features such as tourist arrivals and PM2.5 concentrations are consistently the most important in all datasets, highlighting their fundamental role in modeling the tourist-environment relationship. However, the importance of other features such as temperature and industrial emissions varied from dataset to dataset, reflecting regional or dataset differences in factors affecting the interaction of tourism and the environment. These findings provide feasible policy recommendations, such as prioritizing air quality management (e.g., controlling PM2.5 levels) and monitoring tourist numbers during peak seasons, to mitigate environmental impacts while promoting sustainable tourism practices.
5 Conclusion
This paper proposes a modeling method of coupling relationship between tourism development and environment based on LARF. Through the extraction of time series features, the identification of key time points and the modeling of nonlinear relationship, the complex interactive relationship between tourism activities and environment is comprehensively analyzed. It is observed that the influence of tourism activities on environmental conditions exhibits significant time-dependent and nonlinear characteristics, and the change of environmental quality will also produce dynamic feedback on the development of tourism. Through model experiments, the LARF model performs well in terms of prediction accuracy, ability to capture key features and robustness, which offers a valuable approach for examining the relationship tourism-environment interaction.
In comparison to existing studies, this paper presents both the confirmation of known conclusions and the revelation of new insights. While previous research has generally recognized the negative impacts of tourism on the environment—such as increased pollution during peak tourist seasons—this paper not only verifies these known patterns but also uncovers the long-term feedback relationships between environmental change and tourism development. Specifically, it highlights how environmental improvements can attract more tourists and the significant role of policy interventions in shaping the tourism-environment coupling. Additionally, while existing studies often rely on traditional linear models or single machine learning methods, which struggle to capture the complex nonlinear dynamics of tourism and environmental interactions, this paper introduces a hybrid approach combining deep learning with random forest models. This approach successfully captures the complex multivariate interactions, particularly in high-dimensional data and time-series analysis, thereby demonstrating superior modeling capabilities.
The advantages of this study are reflected in several aspects. First, the LSTM module effectively captures long-term dependencies within time-series data, the Attention mechanism enhances the model’s ability to focus on key moments during processing, and the Random Forest module further improves the model’s ability to express nonlinear relationships, significantly enhancing the accuracy of predictions. Second, this paper introduces a modular framework, making the model more scalable and adaptable to different regions and data scenarios. Furthermore, the model provides a theoretical basis for scientific policy-making and resource optimization by extracting multi-dimensional features and analyzing dynamic interactions. However, there are still some limitations. The model is highly dependent on the quality and availability of data, and it may show limitations when faced with missing or low-quality data. Additionally, the model’s computational complexity increases with its sophistication, and further verification is needed to assess its applicability for real-time predictions. Although the model captures the bidirectional coupling relationship between tourism and the environment, it does not fully address the causal analysis of specific impact factors. Future research could explore the integration of causal inference methods to improve the model’s interpretability.
This paper not only reveals the dynamic coupling characteristics of tourism and environment through LARF model, but also realizes theoretical innovation and expansion in modeling methods and practical applications, which provides a new perspective for research in related fields. However, there is still room for improvement. In the future, the performance of the model in data-scarce scenarios can be further optimized, and the modeling methods of causality can be explored to more comprehensively understand and predict the complex interaction between tourism and environmental systems.
Data availability statement
The original contributions presented in the study are included in the article/supplementary material, further inquiries can be directed to the corresponding author.
Author contributions
NS: Data curation, Methodology, Writing – original draft. YZ: Data curation, Resources, Validation, Writing – review and editing.
Funding
The author(s) declare that no financial support was received for the research and/or publication of this article.
Conflict of interest
The authors declare that the research was conducted in the absence of any commercial or financial relationships that could be construed as a potential conflict of interest.
Generative AI statement
The author(s) declare that no Generative AI was used in the creation of this manuscript.
Publisher’s note
All claims expressed in this article are solely those of the authors and do not necessarily represent those of their affiliated organizations, or those of the publisher, the editors and the reviewers. Any product that may be evaluated in this article, or claim that may be made by its manufacturer, is not guaranteed or endorsed by the publisher.
References
Ahmad, F., Draz, M. U., Su, L., Ozturk, I., and Rauf, A. (2018). Tourism and environmental pollution: evidence from the one belt one road provinces of western China. Sustainability 10, 3520. doi:10.3390/su10103520
Brtnickỳ, M., Pecina, V., Galiová, M. V., Prokeš, L., Zvěřina, O., Juřička, D., et al. (2020). The impact of tourism on extremely visited volcanic island: link between environmental pollution and transportation modes. Chemosphere 249, 126118. doi:10.1016/j.chemosphere.2020.126118
Demir, S., and Sahin, E. K. (2022). Comparison of tree-based machine learning algorithms for predicting liquefaction potential using canonical correlation forest, rotation forest, and random forest based on cpt data. Soil Dyn. Earthq. Eng. 154, 107130. doi:10.1016/j.soildyn.2021.107130
Djaballah, S., Saidi, L., Meftah, K., Hechifa, A., Bajaj, M., and Zaitsev, I. (2024). A hybrid lstm random forest model with grey wolf optimization for enhanced detection of multiple bearing faults. Sci. Rep. 14, 23997. doi:10.1038/s41598-024-75174-x
Duan, J., Gong, Y., Luo, J., and Zhao, Z. (2023). Air-quality prediction based on the arima-cnn-lstm combination model optimized by dung beetle optimizer. Sci. Rep. 13, 12127. doi:10.1038/s41598-023-36620-4
Fahim, S. R., Sarker, Y., Sarker, S. K., Sheikh, M. R. I., and Das, S. K. (2020). Self attention convolutional neural network with time series imaging based feature extraction for transmission line fault detection and classification. Electr. Power Syst. Res. 187, 106437. doi:10.1016/j.epsr.2020.106437
Fei, J., Lin, Y., Jiang, Q., Jiang, K., Li, P., and Ye, G. (2021). Spatiotemporal coupling coordination measurement on islands’ economy-environment-tourism system. Ocean and Coast. Manag. 212, 105793. doi:10.1016/j.ocecoaman.2021.105793
Feng, D. C., Wang, W. J., Mangalathu, S., Hu, G., and Wu, T. (2021). Implementing ensemble learning methods to predict the shear strength of rc deep beams with/without web reinforcements. Eng. Struct. 235, 111979. doi:10.1016/j.engstruct.2021.111979
Ghiasi, M. M., and Zendehboudi, S. (2021). Application of decision tree-based ensemble learning in the classification of breast cancer. Comput. Biol. Med. 128, 104089. doi:10.1016/j.compbiomed.2020.104089
Guseva, K., Darcy, S., Simon, E., Alteio, L. V., Montesinos-Navarro, A., and Kaiser, C. (2022). From diversity to complexity: microbial networks in soils. Soil Biol. Biochem. 169, 108604. doi:10.1016/j.soilbio.2022.108604
He, K., Ji, L., Wu, C. W. D., and Tso, K. F. G. (2021). Using sarima–cnn–lstm approach to forecast daily tourism demand. J. Hosp. Tour. Manag. 49, 25–33. doi:10.1016/j.jhtm.2021.08.022
Huang, J., Yu, X., An, D., Ning, X., Liu, J., and Tiwari, P. (2025). Uniformity and deformation: a benchmark for multi-fish real-time tracking in the farming. Expert Syst. Appl. 264, 125653. doi:10.1016/j.eswa.2024.125653
Huo, W., Li, W., Zhang, Z., Sun, C., Zhou, F., and Gong, G. (2021). Performance prediction of proton-exchange membrane fuel cell based on convolutional neural network and random forest feature selection. Energy Convers. Manag. 243, 114367. doi:10.1016/j.enconman.2021.114367
Irfan, M., Ullah, S., Razzaq, A., Cai, J., and Adebayo, T. S. (2023). Unleashing the dynamic impact of tourism industry on energy consumption, economic output, and environmental quality in China: a way forward towards environmental sustainability. J. Clean. Prod. 387, 135778. doi:10.1016/j.jclepro.2022.135778
Işık, C., Ahmad, M., Ongan, S., Ozdemir, D., Irfan, M., and Alvarado, R. (2021). Convergence analysis of the ecological footprint: theory and empirical evidence from the usmca countries. Environ. Sci. Pollut. Res. 28, 32648–32659. doi:10.1007/s11356-021-12993-9
Jiasen, L., Xiong, C., and Socher, R. (2020). Sentinel gate for modulating auxiliary information in a long short-term memory (lstm) neural network. U. S. Pat. 10.
Kang, J., Guo, X., Fang, L., Wang, X., and Fan, Z. (2022). Integration of internet search data to predict tourism trends using spatial-temporal xgboost composite model. Int. J. Geogr. Inf. Sci. 36, 236–252. doi:10.1080/13658816.2021.1934476
Khodayar, M., and Wang, J. (2020). Probabilistic time-varying parameter identification for load modeling: a deep generative approach. IEEE Trans. Industrial Inf. 17, 1625–1636. doi:10.1109/tii.2020.2971014
Kyrylov, Y., Hranovska, V., Boiko, V., Kwilinski, A., and Boiko, L. (2020). International tourism development in the context of increasing globalization risks: on the example of Ukraine’s integration into the global tourism industry. J. Risk Financial Manag. 13, 303. doi:10.3390/jrfm13120303
Li, M., and Guenier, A. W. (2024). Chatgpt and health communication: a systematic literature review. Int. J. E-Health Med. Commun. (IJEHMC) 15, 1–26. doi:10.4018/ijehmc.349980
Liu, L., Liu, J., and Han, J. (2021). Multi-head or single-head? an empirical comparison for transformer training. arXiv Prepr. arXiv:2106.09650.
Liu, S., Wu, K., Jiang, C., Huang, B., and Ma, D. (2023). Financial time-series forecasting: towards synergizing performance and interpretability within a hybrid machine learning approach. arXiv Prepr. arXiv:2401.00534.
Liu, Y., Wu, H., Rezaee, K., Khosravi, M. R., Khalaf, O. I., Khan, A. A., et al. (2022). Interaction-enhanced and time-aware graph convolutional network for successive point-of-interest recommendation in traveling enterprises. IEEE Trans. Industrial Inf. 19, 635–643. doi:10.1109/tii.2022.3200067
Lu, W., Jin, J., Wang, B., Li, K., Liang, C., Dong, J., et al. (2020). Intelligence in tourist destinations management: improved attention-based gated recurrent unit model for accurate tourist flow forecasting. Sustainability 12, 1390. doi:10.3390/su12041390
Ma, M., and Tang, J. (2022). Interactive coercive relationship and spatio-temporal coupling coordination degree between tourism urbanization and eco-environment: a case study in western China. Ecol. Indic. 142, 109149. doi:10.1016/j.ecolind.2022.109149
Malekloo, A., Ozer, E., AlHamaydeh, M., and Girolami, M. (2022). Machine learning and structural health monitoring overview with emerging technology and high-dimensional data source highlights. Struct. Health Monit. 21, 1906–1955. doi:10.1177/14759217211036880
Masenya, T. M. (2024). Digital transformation of medical libraries: positioning and pioneering electronic health record systems in South Africa. Int. J. E-Health Med. Commun. (IJEHMC) 15, 1–13. doi:10.4018/ijehmc.345402
Mi, J. X., Li, A. D., and Zhou, L. F. (2020). Review study of interpretation methods for future interpretable machine learning. IEEE Access 8, 191969–191985. doi:10.1109/access.2020.3032756
Mohammed, A., and Kora, R. (2023). A comprehensive review on ensemble deep learning: opportunities and challenges. J. King Saud University-Computer Inf. Sci. 35, 757–774. doi:10.1016/j.jksuci.2023.01.014
Muhammad, F., Khan, A., Razzaq, N., and Karim, R. (2021). Influence of tourism, governance, and foreign direct investment on energy consumption and co 2 emissions: a panel analysis of muslim countries. Environ. Sci. Pollut. Res. 28, 416–431. doi:10.1007/s11356-020-10502-y
Naveed, A., Ahmad, N., Aghdam, R. F., and Menegaki, A. N. (2022). What have we learned from environmental kuznets curve hypothesis? a citation-based systematic literature review and content analysis. Energy Strategy Rev. 44, 100946. doi:10.1016/j.esr.2022.100946
Pan, Y., Weng, G., Li, C., and Li, J. (2021). Coupling coordination and influencing factors among tourism carbon emission, tourism economic and tourism innovation. Int. J. Environ. Res. Public Health 18, 1601. doi:10.3390/ijerph18041601
Park, C., Lee, S., Lee, C. K., and Reisinger, Y. (2022). Volunteer tourists’ environmentally friendly behavior and support for sustainable tourism development using value-belief-norm theory: moderating role of altruism. J. Destination Mark. and Manag. 25, 100712. doi:10.1016/j.jdmm.2022.100712
Pierre, A. A., Akim, S. A., Semenyo, A. K., and Babiga, B. (2023). Peak electrical energy consumption prediction by arima, lstm, gru, arima-lstm and arima-gru approaches. Energies 16, 4739. doi:10.3390/en16124739
Pokhrel, K., Sanin, C., Sakib, M. K. H., Islam, M. R., and Szczerbicki, E. (2023). Improved skin disease classification with mask r-cnn and augmented dataset. Cybern. Syst., 1–15. doi:10.1080/01969722.2023.2296254
Polyzos, S., Samitas, A., and Spyridou, A. E. (2021). Tourism demand and the covid-19 pandemic: an lstm approach. Tour. Recreat. Res. 46, 175–187. doi:10.1080/02508281.2020.1777053
Robaina, M., Madaleno, M., Silva, S., Eusébio, C., Carneiro, M., Gama, C., et al. (2020). The relationship between tourism and air quality in five european countries. Econ. Analysis Policy 67, 261–272. doi:10.1016/j.eap.2020.07.012
Rosselló, J., Becken, S., and Santana-Gallego, M. (2020). The effects of natural disasters on international tourism: a global analysis. Tour. Manag. 79, 104080. doi:10.1016/j.tourman.2020.104080
Sahai, A. K., Rath, N., Sood, V., and Singh, M. P. (2020). Arima modelling and forecasting of covid-19 in top five affected countries. Diabetes and metabolic syndrome Clin. Res. and Rev. 14, 1419–1427. doi:10.1016/j.dsx.2020.07.042
Sahani, N., and Ghosh, T. (2021). Gis-based spatial prediction of recreational trail susceptibility in protected area of Sikkim himalaya using logistic regression, decision tree and random forest model. Ecol. Inf. 64, 101352. doi:10.1016/j.ecoinf.2021.101352
Sirisha, U. M., Belavagi, M. C., and Attigeri, G. (2022). Profit prediction using arima, sarima and lstm models in time series forecasting: a comparison. IEEE Access 10, 124715–124727. doi:10.1109/access.2022.3224938
Sun, D., Xu, J., Wen, H., and Wang, Y. (2020). An optimized random forest model and its generalization ability in landslide susceptibility mapping: application in two areas of three gorges reservoir, China. J. Earth Sci. 31, 1068–1086. doi:10.1007/s12583-020-1072-9
Wang, J., Li, X., Li, J., Sun, Q., and Wang, H. (2022). Ngcu: a new rnn model for time-series data prediction. Big Data Res. 27, 100296. doi:10.1016/j.bdr.2021.100296
Xiong, Y., and Zuo, R. (2020). Recognizing multivariate geochemical anomalies for mineral exploration by combining deep learning and one-class support vector machine. Comput. and geosciences 140, 104484. doi:10.1016/j.cageo.2020.104484
Yu, L., Zhang, X., Zhong, Z., Lai, Y., Zhang, H., and Szczerbicki, E. (2023). Adaptive2former: enhancing chromosome instance segmentation with adaptive query decoder. Cybern. Syst., 1–9. doi:10.1080/01969722.2023.2296249
Zargar, S. (2021). Introduction to sequence learning models: rnn, lstm, gru. Department of Mechanical and Aerospace Engineering. N. C. State Univ.
Zeng, J., Wen, Y., Bi, C., and Feiock, R. (2021). Effect of tourism development on urban air pollution in China: the moderating role of tourism infrastructure. J. Clean. Prod. 280, 124397. doi:10.1016/j.jclepro.2020.124397
Zhang, F., Sarker, M. N. I., and Lv, Y. (2022). Coupling coordination of the regional economy, tourism industry, and the ecological environment: evidence from western China. Sustainability 14, 1654. doi:10.3390/su14031654
Zhang, H., Yu, L., Wang, G., Tian, S., Yu, Z., Li, W., et al. (2025b). Cross-modal knowledge transfer for 3d point clouds via graph offset prediction. Pattern Recognit. 162, 111351. doi:10.1016/j.patcog.2025.111351
Zhang, L., Liu, J., Wei, Y., An, D., and Ning, X. (2025a). Self-supervised learning-based multi-source spectral fusion for fruit quality evaluation: a case study in mango fruit ripeness prediction. Inf. Fusion 117, 102814. doi:10.1016/j.inffus.2024.102814
Zhang, N., Ren, R., Zhang, Q., and Zhang, T. (2020). Air pollution and tourism development: an interplay. Ann. Tour. Res. 85, 103032. doi:10.1016/j.annals.2020.103032
Zheng, H., Wu, J., Song, R., Guo, L., and Xu, Z. (2024). Predicting financial enterprise stocks and economic data trends using machine learning time series analysis. Appl. Comput. Eng. 87, 26–32. doi:10.54254/2755-2721/87/20241562
Zhou, L., Zhang, X., and Dong, K. (2024). Does digital financial innovation contribute to promoting the high-quality development of the real economy? – mechanism analysis and spatial econometrics based on financial service efficiency. J. Xi’an Univ. Finance Econ. 37, 60–72. School of Business, Suzhou Vocational University; School of Economics and Management, Southeast University. doi:10.19331/j.cnki.jxufe.20231115.001
Keywords: tourism development, environmental pollution, time series modeling, sustainable tourism, environmental management, predictive modeling
Citation: Song N and Zhang Y (2025) Exploring the relationship between tourism development and environmental pollution using an LSTM-based time series model. Front. Environ. Sci. 13:1576039. doi: 10.3389/fenvs.2025.1576039
Received: 14 February 2025; Accepted: 02 May 2025;
Published: 15 May 2025.
Edited by:
Rui Zhang, University of Jinan, ChinaReviewed by:
Prakash Rao Ragiri, Netaji Subhas University of Technology, IndiaPeer Jeelani, University of Kashmir, India
Copyright © 2025 Song and Zhang. This is an open-access article distributed under the terms of the Creative Commons Attribution License (CC BY). The use, distribution or reproduction in other forums is permitted, provided the original author(s) and the copyright owner(s) are credited and that the original publication in this journal is cited, in accordance with accepted academic practice. No use, distribution or reproduction is permitted which does not comply with these terms.
*Correspondence: Nating Song, bmF0aW5nLnNvbmdAbWFpbC51c3RjLmVkdS5jbg==