 Chen Zhang
 Yanxiao Liu
- Fujian Provincial Key Laboratory for Subtropical Resources and Environment, College of Geographical Sciences, Fujian Normal University, Fuzhou, China
The driving forces and their spatiotemporal differences of pollutant discharge in 30 provinces in China from 2001 to 2020 were investigated by adopting the logarithmic mean divisia index (LMDI) method, distinguishing between industrial and domestic wastewater pollutant discharge. Our study results show that economic expansion was the dominant driver of chemical oxygen demand (COD) and NH3-N discharge in China, mainly due to the impact of rapid economic development in the developed eastern provinces. The gap among 30 provinces in the contribution related to the driving effects of industrial COD and NH3-N discharge greatly narrowed with time, tending toward the national average. It showed the significant effectiveness of industrial structure adjustment, clean production, and the technology of industrial wastewater treatment across the country. Industrial COD and NH3-N discharge has been reduced to a certain extent. However, with rapid economic growth and urbanization, the domestic sewage treatment volume was still increasing, and the growth rate was faster than that of GDP in some provinces. The technology of many provinces had gradually failed to meet the growing demand for treating domestic sewage pollutants. Consequently, the influencing contributions had significant regional differences among provinces. The governance of the water environment in China should attach importance to technological advances for domestic water conservation and wastewater treatment in the future.
Highlights
• The disparities of the influencing effects of industrial and domestic pollution discharge were disclosed.
• The spatiotemporal dynamics of the influencing effects of wastewater pollution discharge were investigated in China.
• The gap among 30 provinces in China in each effect’s contribution to industrial COD and NH3-N discharge was narrowing.
• A large gap remained among 30 provinces in China in each effect of domestic COD and NH3-N discharge.
1 Introduction
As economic development in China has entered a new normal, the development emphasis has shifted from pursuing speed to quality. The goal of improving the ecological environment has become an important element of high-quality development. Environmental pollution is still serious in China; water pollution incidents have occurred frequently, causing a constant water environmental crisis. Because of this, the governments have undertaken measures to improve the water environment (Cheng et al., 2022; Jin et al., 2014; Li et al., 2022). However, it is still insufficient in terms of the condition of rapid economic development (Liu et al., 2021; Xie et al., 2022; Yao et al., 2019). In recent years, some positive outcomes have emerged, and the volume of industrial wastewater discharge has decreased considerably in China. In contrast, domestic sewage discharge has continued to increase with rapid urbanization. In addition, significant differences between the changes of domestic and industrial pollutant discharge were found in terms of chemical oxygen demand (COD) and ammonia nitrogen (NH3-N). At the end of the 11th 5-year plan (2006–2010), the discharge of domestic COD and NH3-N was 1.8× and 3× the discharge of industrial COD and NH3-N (ChinaNBoSo, 2020). By the 13th 5-year plan (2016–2020), the ratios of domestic to industrial COD and NH3-N discharge increased to 6.7 and 3.2 (ChinaNBoSo, 2020). Accordingly, it is necessary to understand the driving mechanisms of the changes in water pollutant discharge in the economic transitional period in China.
China’s environmental pollution and economic growth nexus has received increasing attention in recent years and has emerged as an important topic among economists and policymakers. The most common argument in the theoretical research is that the environmental Kuznets curve (EKC) hypothesis holds that the levels of pollution first increase with economic growth and decline subsequently relative to economic growth in higher levels (Grossman and Krueger; Panayotou, 1993; Grosman and Krueger, 1994; Shen, 2006; Li et al., 2024; Ozturk et al., 2024; Al-Mulali et al., 2015). The EKC hypothesis and its empirical study are important values in understanding the dynamic change of water environmental quality and have indicative significance (Long et al., 2019; Chen et al., 2016). However, wastewater discharge is a complex process that involves all aspects of socio-economic development (Ruan and Yan, 2022). Numerous scholars in this field have examined the key influencing factors of environmental change (Dietz and Rosa, 1997; Chen et al., 2010; Shahbaz et al., 2014; Wang and Feng, 2017). Some scholars have selected variables from economic, structure, population, and technical effects. For example, Vincent (1997) adopted population density (Vincent, 1997). Cole (2004) used trade factors (Cole, 2004). Shen (2006) selected the secondary industry share, population density, per capita physical capital, and labor (Shen, 2006). Lee et al. (2010) chose political system-related factors (Lee et al., 2010). Zhang et al. (2017) focused on the total population and volume of urban water consumption per GDP (25). Cai et al. (2020) selected economic growth-per-capita GDP (26).
In relation to calculation methods, it is acknowledged that factor decomposition analysis has a wide range of applications in the environmental fields (Geng, 2011; Shao et al., 2014; Robaina-Alves et al., 2016). Many scholars apply the logarithmic mean divisia index (LMDI) method to the driving influences analysis of wastewater discharge (Ang and Choi, 1997; Jeong and Kim, 2013; Xu et al., 2014; Li et al., 2019; Rasul, 2016). For example, Zhao and Chen (2014) account for the Chinese agricultural water footprint from 1990 to 2009, decomposing the driving forces into diet structure effect, efficiency effect, economic activity effect, and population effect (Zhao and Chen, 2014). Geng et al. (2014) used the LMDI method and found that economic factors made a positive contribution to the industrial wastewater discharge, whereas the technical improvement considerably offset emission increases (Geng et al., 2014). Recently, we have realized that understanding the spatial matching between social, resource, and environmental factors when improving water quality, controlling wastewater discharge, and enhancing wastewater management is a problem we should consider (An et al., 2018). Zhang et al. (2021) constructed an LMDI decomposition model to quantitatively study the spatiotemporal distribution and driving effects in urban wastewater treatment (Zhang et al., 2021). Tian et al. (2023) explored the determinants of wastewater discharge reduction and divided Mainland China into seven regions to clarify the differences among distinct regions (Tian et al., 2023).
However, the studies on wastewater discharge analyzed by the LMDI method still have some limitations. Most studies only measured the decomposition effect of the total wastewater discharge or industrial wastewater discharge but lacked an analysis of domestic sewage pollution discharge (Chen et al., 2019; Wei et al., 2019; Chang and Zhu, 2021). In addition, most research on the spatial–temporal characteristics has focused on simple descriptions instead of relevant spatial analysis (Zhang et al., 2021; Jia et al., 2017). China has a vast territory, and due to the natural environment, economic condition, technology, and other factors, different regions have distinct wastewater discharge statuses and driving factors (Yang et al., 2015). However, regional heterogeneity has usually not been elaborated in existing studies (Ma et al., 2020); nor have investigations distinguished the drivers influencing industrial and domestic pollution discharge in different provinces.
Against this background, this paper addresses these issues. It makes efforts to decompose the spatiotemporal influencing effects of regional development in COD and NH3-N discharge in China, using the datasets at the Chinese provincial level from 2001 to 2020, which provide up-to-date information on the historic behavior of water pollution variables. The general contribution of this study is two-fold. On the one hand, the present study contributes to new knowledge by decomposing the analysis on the disparities of influencing effects of industrial and domestic pollution discharge. On the other hand, we employed the LMDI and multi-regional (M-R) model to investigate the spatiotemporal dynamic contributions of the influencing effects, which can help the government formulate more precise polices for regional wastewater discharge reduction. To the best of our knowledge, the differences in terms of industrial wastewater and domestic sewage have not been investigated. We believe that this study could open a way forward in achieving a specific viewpoint for future studies on the influence of pollution from development.
The remainder of this paper is organized as follows. The “Data and methods” section briefly describes the data and analytical methods and models used in this study. The “Results and discussion” section presents and discusses the results. The “Conclusions and future studies” section summarizes our findings and offers some concluding remarks and further research direction.
2 Data and methods
The decomposition models were proposed based on LMDI methods and the M-R model to analyze the influencing factors of COD and NH3-N discharge in China in terms of economic scale effect (ESE), urbanization effect (UE), industrial structure effect (ISE), and technology effect (TE). The analysis focused on two aspects: 1) the disparities between industrial and domestic pollution sources; 2) the spatiotemporal dynamics of the influencing effects. The technical roadmap of this study is shown in Figure 1.
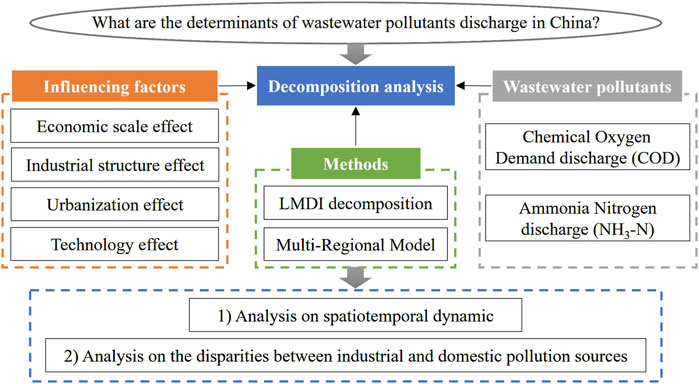
Figure 1. Technical roadmap of this study.
2.1 Proposed LMDI decomposition
The LMDI model can separate each factor’s contribution to the total index and trace causes for changes in the index. It is widely applied because it has no residuals and is transparent in interpreting decomposition results (Román-Collado and Casado Ruíz, 2024; Tian et al., 2025). For this reason, it has become a commonly used approach in studying the driving factors of environmental problems.
Based on the KAYA identify, the LMDI method in this study for decomposing the influence in COD and NH3-N discharge from economic development was constructed in the base year and target year as Equation 1.
where Vi denotes the whole volume of regional water pollution discharge, which varies depending on k drivers.
According to the LMDI additive principle, the specific expression of the decomposition is shown in Equation 2 and Equation 3.
where
The positive contribution degrees of the factors indicate that these factors can promote COD and NH3-N discharge. The negative contribution degrees imply that the driving factors tend to inhibit COD and NH3-N discharge.
2.2 The M-R decomposition
A spatial decomposition analysis was carried out to identify why differences exist among provinces, considering the COD and NH3-N discharge and decomposition factors. The spatial analysis is conducted using data from a specific year and is called a single-year spatial analysis (Ang, 2015). When the spatial comparison group consists of I (i ≥ 2) regions, the literature recommends applying the M-R model (Ang et al., 2016; Wu and Zeng, 2013). The M-R model allows for calculated direct comparisons between each region and a previously calculated reference entity. In this research, the reference region is constructed. Its attributes are given by the arithmetic average of all the provinces included in China. The pollution discharge of the reference region is given by the weighted average of all the provinces. The same procedure is applied to calculate the remaining attributes of the reference region.
The spatial difference between one province i and the reference province in year T can be decomposed as follows:
where
2.3 The decomposition model proposed in this study
In this study, the driving factors of industrial COD and NH3-N discharge are decomposed into economic scale, industrial structure, and technology. Domestic COD and NH3-N drivers are decomposed into economic scale, urbanization, and technology. Concretely, the technical effect could be further decomposed into water intensity, wastewater discharge intensity, and pollutant emission intensity. Therefore, Equation 1 can be expressed as Equations 6, 7:
The definition and the statistical description of all the variables in the above equations are shown in Table 1.
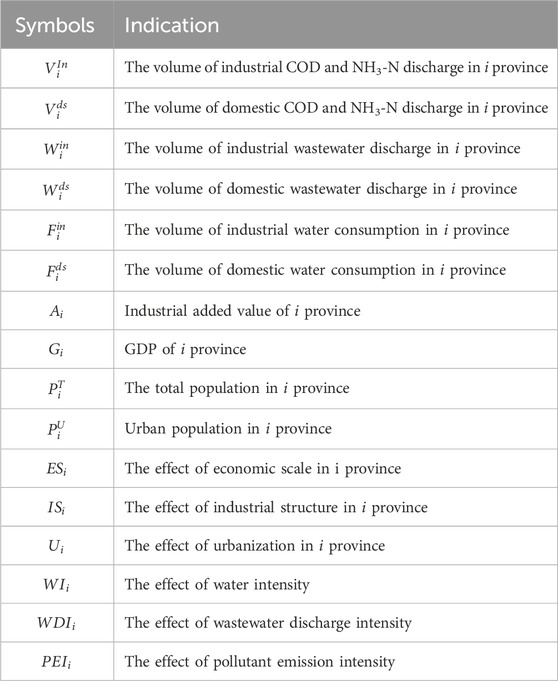
Table 1. Description of variables in the LMDI and M-R models.
2.4 The relative contribution rate of each factor
In order to take a comparison analysis of the contribution of the influencing effect within each region, the study adopted the relative contribution degree (
2.5 Data sources
Provincial wastewater, COD, and NH3-N discharge, respectively, from industrial and residential sources, covering the period from 2001 to 2020, were collected from the China Statistical Yearbook on Environment (2001–2020). GDP (
3 Results and discussion
3.1 Influencing the contribution ratio of the drivers at the national level
According to the results shown in Figure 2, both industrial COD and NH3-N discharge showed a downward trend in China from 2001 to 2020 due to the combined effect of regional economic growth, industrialization or urbanization, and technological advances. However, the total volume of domestic pollution discharge is increasingly higher than that of industrial pollution discharge in China. This is because the effect of economic growth caused a sharp reduction in industrial pollution discharge but a slight decrease in domestic pollution discharge, although the ESE has played an important role in causing COD and NH3-N discharge. Meanwhile, urbanization led to more domestic COD and NH3-N discharge at high levels. Industrialization had a negative effect on industrial COD and NH3-N discharge reduction during the periods of the 10th and 11th Five-Year Plans. However, the effect has become positive in controlling industrial COD and NH3-N discharge since the 12th Five-Year Plan. Management and controls have been implemented systematically over industries with high wastewater pollutant discharge since 2001 in China, through the adjustment and optimization of industrial structure and enhanced environmental protection policy. Some industries have substantially reduced COD and NH3-N discharge, especially manufacturing and food processing, textile, paper and paper products, smelting and pressing of ferrous metals, and production and supply of electric powder and heat powder. Moreover, technological advances also contributed to the reduction of COD and NH3-N discharge. It can be seen from Figure 2 that the TE can significantly reduce the industrial wastewater discharge when it is high, but when the industrial wastewater discharge is reduced to a certain extent, the TE is limited. Consequently, the industrial COD and NH3-N discharges have been reduced to a small amount, but the domestic COD and NH3-N discharges still remained at a high level. Domestic COD discharge was increasing.
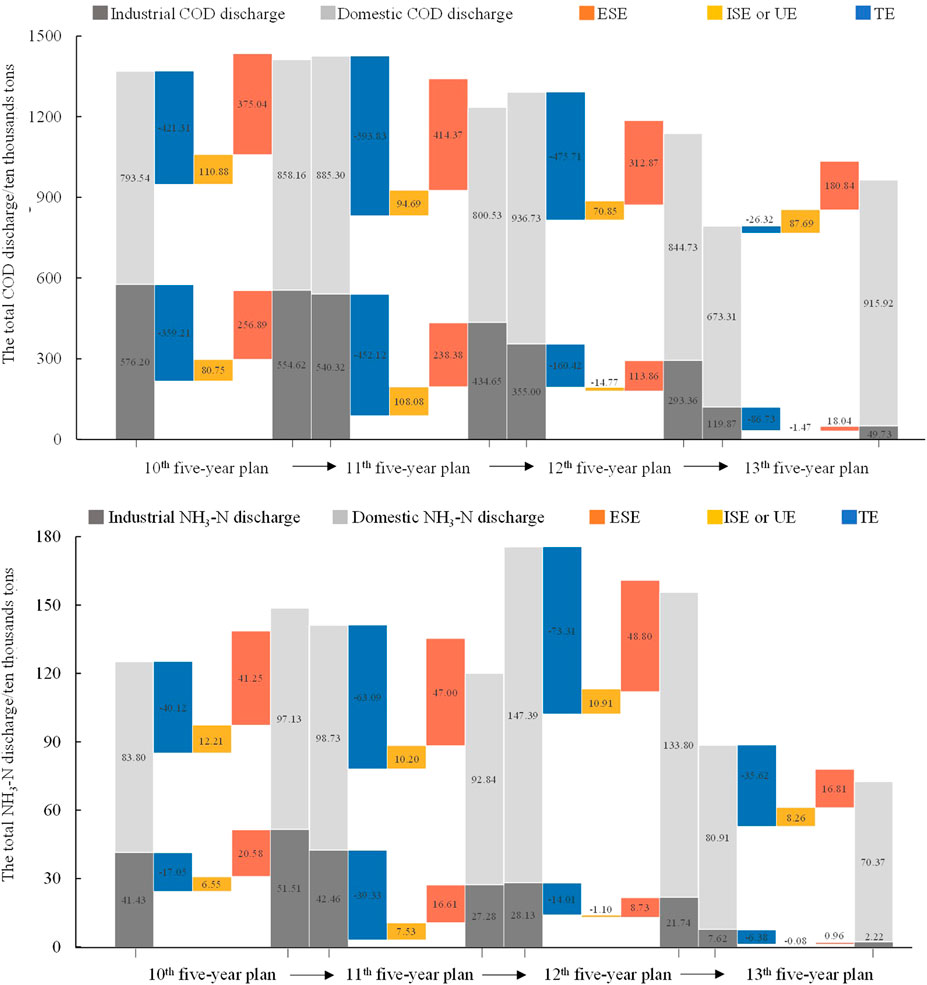
Figure 2. Decomposition of the influencing effects of COD and NH3-N discharge in China during the 10th, 11th, 12th, and 13th Five-Year Plans. ESE, ISE, UE, and TE, respectively, represent economic scale effect, industrialization effect, urbanization effect, and technology effect.
3.2 The temporal evolution of provincial decomposition analysis
3.2.1 The effect of economic scale
The results showed great differences by region in the temporal variation. Concretely, the ESE of all provinces was positively driven from 2011 to 2020, whether industrial or domestic COD and NH3-N discharge. Changes of the ESE showed a varied history curve with different levels of economic development. As depicted in Figure 3, the ESE of industrial COD and NH3-N discharge in the eastern developed provinces has declined continuously since the 10th Five-Year Plan. The effect increased in part of middle China first and then decreased from the 12th Five-Year Plan, as did the northeast region, which is relatively backward in economic development. In the western region, where the economy lags, industrial COD and NH3-N discharge only began to decrease since the 13th Five-Year Plan. The results reveal that the levels of pollution first increase with economic growth and decline subsequently relative to economic growth at higher levels, which follows the environmental Kuznets curve (EKC) hypothesis (Chen et al., 2010). The EKC relationship existed between economic growth and domestic COD and NH3-N discharge in China as well. However, quite a few areas, such as Anhui, Gansu, and Yunnan, have only reached the turning point of the EKC during the 13th Five-Year Plan. Thus, the ESE of some provinces declined, while others maintained a high level of domestic COD and NH3-N discharge.
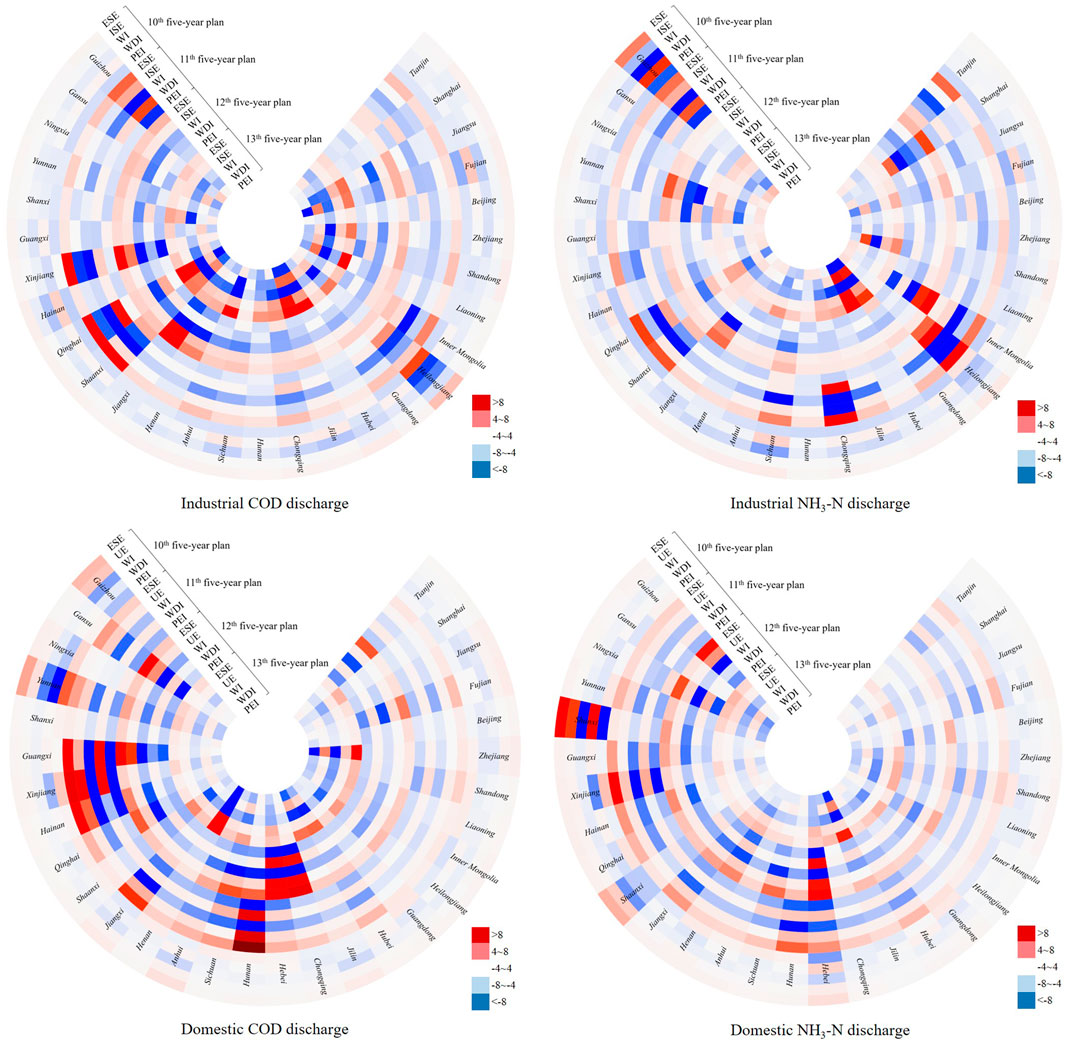
Figure 3. The contribution of the influencing effects of COD and NH3-N discharge of 30 provinces in China during the 10th, 11th, 12th, and 13th Five-Year Plans. ESE, ISE, UE, and TE, respectively, represent economic scale effect, industrialization effect, urbanization effect, and technology effect.
3.2.2 The effect of industrial structure and urbanization
As shown in Figure 3, the ISE of most areas has turned positive due to the reduction of industrial COD and NH3-N discharge in the 13th Five-Year Plan. A few areas, such as Anhui, Hunan, Sichuan, Yunnan, and Jilin, still discharge more industrial pollution, which is attributed to industrialization development. Industrial COD and NH3-N discharge in these provinces mainly came from the processing of food from agricultural products, the manufacture of foods, raw chemical materials, and chemical products. In addition, the manufacture of paper and paper products was a major contributor to industrial pollutant emissions in Anhui and Hunan. As a result of industrialization development, industrial wastewater pollution has been a serious problem in these areas. In the meantime, China was moving rapidly into urbanization. In all provinces, the UE has contributed to domestic COD and NH3-N discharge. During 2001–2020, the effects in some areas increased, while they decreased in other areas. The growth of the UE showed that the construction of urban environmental pollution treatment facilities has not caught up with the need for environmental pollution discharge caused by population agglomeration in areas such as Guangdong, Fujian, Sichuan, Guizhou, and Xinjiang. Meanwhile, the domestic COD and NH3-N discharge has decreased substantially in a few areas with high urbanization levels, including Shanghai, Tianjin, and Beijing. The results show that cities with high urbanization could increase efforts to improve infrastructure construction, facilitating the reduction of regional domestic COD and NH3-N discharge.
3.2.3 The effect of technology
In the aspect of TE, the development level of technology varies in different areas, so its effect on COD and NH3-N discharge reduction was uneven. The TE was all positive for the reduction of industrial COD and NH3-N discharge. During the period of the 13th Five-Year Plan, the contribution of the TE of the industrial COD and NH3-N discharge in each province in China tended to a similar degree. Concretely, the effects of industrial water intensity were always positive to water pollution reduction. The effects of pollutant intensity showed negative influences in the early stage and then changed gradually to positive influences in reducing industrial COD and NH3-N discharge with time. In comparison, the contribution of industrial wastewater intensity in nearly half of China has shown a disincentive to pollution reduction at varying levels until the period of the 13th Five-Year Plan.
In the aspect of domestic COD and NH3-N discharge, the TE also played a positive role in reducing pollution in the whole region from 2001 to 2015. However, half of the provinces had a small hindering effect on domestic pollution reduction during the period of the 13th Five-Year Plan. The WI (water intensity) effects were negative in all the provinces in China, which means technology advances of the WI reduce the domestic COD and NH3-N discharge. In contrast, the WDI (wastewater discharge intensity) and PEI (pollutant emission intensity) effects increased discharge in many provinces. It suggests that the technical level of some areas has gradually failed to meet the growing demand for domestic COD and NH3-N discharge and treatment as time advances. That is to say, the governance of the water environment in China should attach importance to technology advances for treating domestic COD and NH3-N discharge.
3.3 The spatial variation of provincial decomposition analysis
Overall, a great difference was noted in the spatial dynamic change of the drivers between industrial and domestic pollution discharge during 2001–2020, shown in Figure 4. The absolute value of each effect of industrial COD and NH3-N discharge showed a decreasing trend, indicating that the gap between these provinces in China was narrowing during 2001–2020. However, not much has changed in the regional disparity related to the ESE and TE of domestic COD and NH3-N discharge, and a slight reduction was shown in the UE of domestic pollution discharge.
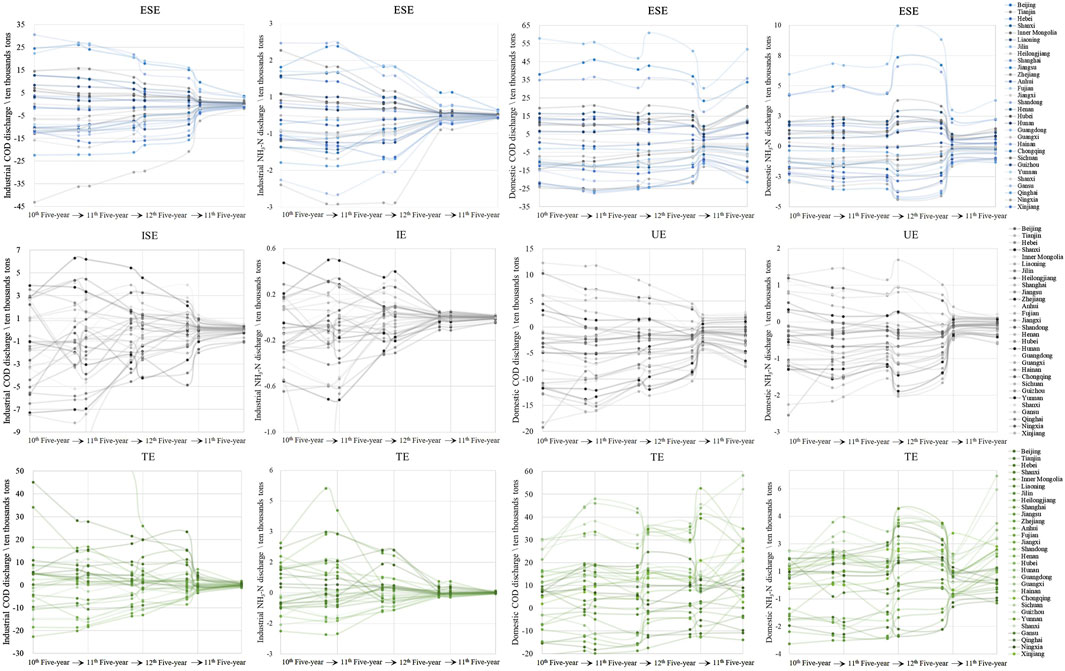
Figure 4. Spatial differences of the influencing effects of COD and NH3-N discharge of 30 provinces in China during the 10th, 11th, 12th, and 13th Five-Year Plans. ESE, ISE, UE, and TE, respectively, represent economic scale effect, industrialization effect, urbanization effect, and technology effect.
In terms of industrial COD and NH3-N discharge, the ESE values of 12 provinces are always positive, indicating that their economic growth caused more industrial COD and NH3-N discharge than the average level of China, especially in Jiangsu, Zhejiang, Guangdong, and Shandong, which had significantly higher values. In other words, the driving force of economic effects on industrial COD and NH3-N discharge in China mainly came from the economic growth of eastern developed areas during 2001–2020. However, these regions have gradually shifted from extensive economic expansion to high-quality economic development. Their industrial structure adjustment currently has a good effect on reducing industrial pollutant discharge. As shown in Figure 4, the ISE contributions of Guangdong, Hebei, Henan, Jiangsu, Shandong, and Zhejiang were higher than those of the reference region in China. The ISE contributions also increased in some underdeveloped regions, such as Anhui, Jilin, Jiangxi, Inner Mongolia, Ningxia, and Shaanxi, through industrial structure upgrading and optimization. Thus, the average value of the ISE in China remained negative in the 13th Five-Year Plan, promoting the reduction of industrial pollutant discharge on the whole. Structural adjustment also plays a positive role in technological advancement (Wu and Zeng, 2013). Almost half of the provinces had a significantly higher TE contribution than the reference region. It is mainly because the contributions of cleaner production technology effects and industrial pollution treatment technology effects were high in these provinces. Some provinces had relatively low contributions to the TE but then increased significantly, changing from negative to positive. For example, wastewater reduction in important sectors has achieved remarkable results in Fujian through the construction of a green manufacturing system and technological innovation, shifting traditional industries toward circular economy industries. The provinces of Hebei, Hubei, and Shandong have significantly reduced pollutant discharge from industrial wastewater via the upgrading of traditional industries with high water consumption, such as steel manufacturing and chemical engineering.
In the aspect of domestic COD and NH3-N discharge, the ESE of domestic COD and NH3-N discharge in more than half of the provinces was also larger than the average value in China, in line with their contribution to industrial pollution discharge. The spatial structure of the ESE has not changed much in domestic COD and NH3-N discharge, indicating that the improvement of regional economic levels has not alleviated the impact of economic expansion, driving the increase of domestic COD and NH3-N discharge. Especially, the economic centers of China, such as Beijing, Shanghai, Guangdong, Zhejiang, and Tianjin, which drive the economic development of the surrounding areas, urbanization also has a relatively large driving impact on the emission of domestic pollutants. The UE in domestic COD and NH3-N discharge was negative in most provinces but tended toward the average of China over time. In terms of the TE, the contributions of most provinces were positive. At the same time, a few provinces with better economic development were negative, including Beijing, Shanghai, Jiangsu, and Tianjin. That is to say, the TE in these provinces was lower than the average level of China, indicating that regional domestic sewage treatment capacity had not developed simultaneously in the process of economic growth and urbanization. Therefore, these regions should place greater emphasis on the improvement of domestic water conservation and the centralized treatment rate of domestic wastewater pollutants in the future.
4 Conclusions and future studies
4.1 Conclusions
Wastewater pollution discharge reduction is a comprehensive action that is intricately intertwined with socio-economic and environmental conditions, and the applicability and effectiveness of regional policy have become urgent concerns and exploration issues for water environment management under the new normal of China’s economy. This study identified the current distribution, the contribution, and historical (temporal) changes of the influencing drivers, and the differences between industrial and domestic pollutants, serving as a more precise and differentiated decision and policy tool to effectively manage wastewater.
During the period of 2001–2020, the expansion of economic scale was the dominant positive driver of COD and NH3-N discharge of wastewater in China, and the effects of industrialization and urbanization were relatively limited. The technical effect was always the main solution to reducing emissions of COD and NH3-N. However, some provinces have entered the technological bottleneck stage of water pollutant treatment.
In terms of temporal evolution, most provinces have emission trends that are similar to those of the whole country. The ESE in the eastern developed provinces has declined first, then in parts of middle China and the northeast region, which are relatively backward in economic development. The ESE in the western undeveloped region has only begun to decrease since the 13th Five-Year Plan, following the EKC hypothesis. ISE had increasing emission contributions during the 10th and 11th Five-Year Plans, but these became positive in industrial COD and NH3-N discharge reduction since the 12th Five-Year Plan. Meanwhile, the UE in all provinces contributed to domestic COD and NH3-N discharge. Over time, the effects of some areas increase and others decrease. During 2001–2020, the TE always had a positive influence on the reduction of industrial COD and NH3-N discharge in China. The TE in some provinces has shifted from a positive to a negative contribution to reducing domestic COD and NH3-N discharge since the 13th Five-Year Plan.
In terms of spatial variation, the contribution structure of each effect showed different characteristics between industrial and domestic pollution discharge as well. The gap among the spatial contributions related to the driving effects of industrial COD and NH3-N discharge narrowed with time, tending toward the national average. However, the contribution of each province held a relatively stable level, or showed a slight reduction, in terms of the influencing effects of domestic COD and NH3-N discharge. It showed the significant effectiveness of industrial structure adjustment, clean production, and the technology of industrial wastewater treatment across the country. As the industrial wastewater discharge was reduced to a certain extent, the influencing effects have been limited. With economic growth, the domestic sewage treatment volume was still increasing, and the growth rate was faster than that of GDP in some provinces. The technology of many provinces had gradually failed to meet the growing demand for domestic sewage treatment. Consequently, the influencing contributions had significant regional differences among provinces. The governance of the water environment in China should attach importance to technology advances for domestic water conservation and wastewater treatment in the future.
4.2 Future studies
Overall, we believe that the modeling approach presented in this paper can be replicated in other regions of the world. As the largest developing country as well as the fastest-growing developing country, China’s approach to wastewater pollution discharge and environmental issues is of great significance for other developing countries. This study not only helps to understand China’s problem of wastewater pollutant emission but also provides a reference for other developing countries facing similar problems. In further research, the authors hope to improve the research methods for studying China’s industrial and domestic wastewater pollution problems, using a smaller scale (for example, prefecture-level and county-level cities).
Data availability statement
The raw data supporting the conclusions of this article will be made available by the authors, without undue reservation.
Author contributions
CZ: conceptualization, funding acquisition, methodology, project administration, writing – original draft, and writing – review and editing. YL: formal analysis and writing – review and editing. LL: formal analysis and writing – review and editing. YYo: data curation and writing – review and editing. YYe: data curation and writing – review and editing.
Funding
The author(s) declare that financial support was received for the research and/or publication of this article. This work was supported by the National Natural Science Foundation of China (grant number 42201191) and the Natural Science Foundation of Fujian Province in China (grant number 2023J01086).
Conflict of interest
The authors declare that the research was conducted in the absence of any commercial or financial relationships that could be construed as a potential conflict of interest.
Generative AI statement
The author(s) declare that no Generative AI was used in the creation of this manuscript.
Publisher’s note
All claims expressed in this article are solely those of the authors and do not necessarily represent those of their affiliated organizations, or those of the publisher, the editors and the reviewers. Any product that may be evaluated in this article, or claim that may be made by its manufacturer, is not guaranteed or endorsed by the publisher.
References
Al-Mulali, U., Saboori, B., and Ozturk, I. (2015). Investigating the environmental Kuznets curve hypothesis in Vietnam. Energy Policy 76, 123–131. doi:10.1016/j.enpol.2014.11.019
An, M., He, W., Degefu, D. M., Liao, Z., Zhang, Z., and Yuan, L. (2018). Spatial patterns of urban wastewater discharge and treatment plants efficiency in China. Int. J. Environ. Res. Public Health 15 (9), 1892. doi:10.3390/ijerph15091892
Ang, B. W. (2015). LMDI decomposition approach: a guide for implementation. Energy Policy 86, 233–238. doi:10.1016/j.enpol.2015.07.007
Ang, B. W., and Choi, K. H. (1997). Decomposition of aggregate energy and gas emission intensities for industry: a refined Divisia index method. Energy J. 18 (3), 59–73. doi:10.5547/issn0195-6574-ej-vol18-no3-3
Ang, B. W., Su, B., and Wang, H. (2016). A spatial-temporal decomposition approach to performance assessment in energy and emissions. Energy Econ. 60, 112–121. doi:10.1016/j.eneco.2016.08.024
Cai, H., Mei, Y., Chen, J., Wu, Z., Lan, L., and Zhu, D. (2020). An analysis of the relation between water pollution and economic growth in China by considering the contemporaneous correlation of water pollutants. J. Clean. Prod. 276, 122783. doi:10.1016/j.jclepro.2020.122783
Chang, Y.-J., and Zhu, D. (2021). Water utilization and treatment efficiency of China's provinces and decoupling analysis based on policy implementation. Resour. Conservation Recycl. 168, 105270. doi:10.1016/j.resconrec.2020.105270
Chen, D., Jin, G., Zhang, Q., Arowolo, A. O., and Li, Y. (2016). Water ecological function zoning in heihe river basin, northwest China. Phys. Chem. Earth, Parts A/B/C 96, 74–83. doi:10.1016/j.pce.2016.08.005
Chen, K., Guo, Y., Liu, X., Jin, G., and Zhang, Z. (2019). Spatial-temporal pattern evolution of wastewater discharge in yangtze river economic zone from 2002 to 2015. Phys. Chem. Earth, Parts A/B/C. 110, 125–132. doi:10.1016/j.pce.2019.01.005
Chen, M., Lu, D., and Zha, L. (2010). The comprehensive evaluation of China’s urbanization and effects on resources and environment. J. Geogr. Sci. 20 (1), 17–30. doi:10.1007/s11442-010-0017-0
Cheng, J., Zou, R., Wang, H., and Geng, Z. (2022). How does China’s industrial wastewater shadow price evolve? The perspective of spatiotemporal characteristics and differences decomposition. Environ. Sci. Pollut. Res. 29 (20), 30363–30382. doi:10.1007/s11356-021-17942-0
ChinaNBoSo (2020). ChinaNBoSo. China statistical yearbook on environment. Beijing: China Statitics Press.
Cole, M. A. (2004). Trade, the pollution haven hypothesis and the environmental Kuznets curve: examining the linkages. Ecol. Econ. 48 (1), 71–81. doi:10.1016/j.ecolecon.2003.09.007
Dietz, T., and Rosa, E. A. (1997). Effects of population and affluence on CO2 emissions. Proc. Natl. Acad. Sci. U. S. A. 94 (1), 175–179. doi:10.1073/pnas.94.1.175
Geng, Y. (2011). Improve China's sustainability targets. Nature 477 (7363), 162. doi:10.1038/477162b
Geng, Y., Wang, M., Sarkis, J., Xue, B., Zhang, L., Fujita, T., et al. (2014). Spatial-temporal patterns and driving factors for industrial wastewater emission in China. J. Clean. Prod. 76, 116–124. doi:10.1016/j.jclepro.2014.04.047
Grosman, G. M., and Krueger, A. B. (1994). Economic growth and the environment. Q. J. Econ. 110 (2), 353. doi:10.2307/2118443
Grossman, G. M., and Krueger, A. B. (2025). Environmental impacts of a north-american free-trade agreement. Garber PM, Editor1991. 13-56.
Jeong, K., and Kim, S. (2013). LMDI decomposition analysis of greenhouse gas emissions in the Korean manufacturing sector. Energy Policy 62, 1245–1253. doi:10.1016/j.enpol.2013.06.077
Jia, J., Jian, H., Xie, D., Gu, Z., and Chen, C. (2017). Multi-perspectives’ comparisons and mitigating implications for the COD and NH3-N discharges into the wastewater from the industrial sector of China. Water 9 (3), 201. doi:10.3390/w9030201
Jin, L., Zhang, G., and Tian, H. (2014). Current state of sewage treatment in China. Water Res. 66, 85–98. doi:10.1016/j.watres.2014.08.014
Lee, C.-C., Chiu, Y.-B., and Sun, C.-H. (2010). The environmental Kuznets curve hypothesis for water pollution: do regions matter? Energy Policy 38 (1), 12–23. doi:10.1016/j.enpol.2009.05.004
Li, J., See, K. F., and Chi, J. (2019). Water resources and water pollution emissions in China's industrial sector: a green-biased technological progress analysis. J. Clean. Prod. 229, 1412–1426. doi:10.1016/j.jclepro.2019.03.216
Li, Q.-g., Liu, G.-h., Qi, L., Wang, H.-c., Ye, Z.-f., and Zhao, Q.-l. (2022). Heavy metal-contained wastewater in China: discharge, management and treatment. Sci. Total Environ. 808, 152091. doi:10.1016/j.scitotenv.2021.152091
Li, R., Wang, Q., and Guo, J. (2024). Revisiting the environmental Kuznets curve (EKC) hypothesis of carbon emissions: exploring the impact of geopolitical risks, natural resource rents, corrupt governance, and energy intensity. J. Environ. Manag. 351, 119663. doi:10.1016/j.jenvman.2023.119663
Liu, C., Cai, W., Zhai, M., Zhu, G., Zhang, C., and Jiang, Z. (2021). Decoupling of wastewater eco-environmental damage and China's economic development. Sci. Total Environ. 789, 147980. doi:10.1016/j.scitotenv.2021.147980
Long, H., Lin, B., Ou, Y., and Chen, Q. (2019). Spatio-temporal analysis of driving factors of water resources consumption in China. Sci. Total Environ. 690, 1321–1330. doi:10.1016/j.scitotenv.2019.06.311
Ma, B., Tian, G., and Kong, L. (2020). Spatial-temporal characteristics of China’s industrial wastewater discharge at different scales. Environ. Sci. Pollut. Res. 27 (8), 8103–8118. doi:10.1007/s11356-019-07488-7
Ozturk, I., Farooq, S., Majeed, M. T., and Skare, M. (2024). An empirical investigation of financial development and ecological footprint in South Asia: bridging the EKC and pollution haven hypotheses. Geosci. Front. 15 (4), 101588. doi:10.1016/j.gsf.2023.101588
Panayotou, T. (1993). Empirical tests and policy analysis of environmental degradation at different stages of economic development. Ilo Work. Pap. 4.
Rasul, G. (2016). Managing the food, water, and energy nexus for achieving the sustainable development goals in south asia. Environ. Dev. 18, 14–25. doi:10.1016/j.envdev.2015.12.001
Robaina-Alves, M., Moutinho, V., and Costa, R. (2016). Change in energy-related CO2 (carbon dioxide) emissions in Portuguese tourism: a decomposition analysis from 2000 to 2008. J. Clean. Prod. 111, 520–528. doi:10.1016/j.jclepro.2015.03.023
Román-Collado, R., and Casado Ruíz, V. (2024). Key effects contributing to changes in energy imports in the EU-27 between 2000 and 2020: a decomposition analysis based on the Sankey diagram. Energy Econ. 140, 108009. doi:10.1016/j.eneco.2024.108009
Ruan, F.-L., and Yan, L. (2022). Interactions among electricity consumption, disposable income, wastewater discharge, and economic growth: evidence from megacities in China from 1995 to 2018. Energy 260, 124910. doi:10.1016/j.energy.2022.124910
Shahbaz, M., Sbia, R., Hamdi, H., and Ozturk, I. (2014). Economic growth, electricity consumption, urbanization and environmental degradation relationship in United Arab Emirates. Ecol. Indic. 45, 622–631. doi:10.1016/j.ecolind.2014.05.022
Shao, C., Guan, Y., Wan, Z., Guo, C., Chu, C., and Ju, M. (2014). Performance and decomposition analyses of carbon emissions from industrial energy consumption in Tianjin, China. J. Clean. Prod. 64, 590–601. doi:10.1016/j.jclepro.2013.08.017
Shen, J. (2006). A simultaneous estimation of environmental Kuznets curve: evidence from China. China Econ. Rev. 17 (4), 383–394. doi:10.1016/j.chieco.2006.03.002
Tian, C., Sui, H., Chen, Y., Wang, W., and Deng, H. (2025). Estimating carbon emission reductions from China's “Zero-waste City” construction pilot program. Resour. Conservation Recycl. 212, 107975. doi:10.1016/j.resconrec.2024.107975
Tian, Y., Long, Z., and Li, Q. (2023). What are the determinants of wastewater discharge reduction in China? Decomposition analysis by LMDI. Environ. Sci. Pollut. Res. 30 (9), 23538–23552. doi:10.1007/s11356-022-23887-9
Vincent, J. R. (1997). Testing for environmental Kuznets curves within a developing country. Environ. Dev. Econ. 2 (4), 417–431. doi:10.1017/s1355770x97000223
Wang, M., and Feng, C. (2017). Decomposition of energy-related CO2 emissions in China: an empirical analysis based on provincial panel data of three sectors. Appl. Energy 190, 772–787. doi:10.1016/j.apenergy.2017.01.007
Wei, X., Wang, J., Wu, S., Xin, X., Wang, Z., and Liu, W. (2019). Comprehensive evaluation model for water environment carrying capacity based on VPOSRM framework: a case study in Wuhan, China. Sustain. Cities Soc. 50, 101640. doi:10.1016/j.scs.2019.101640
Wu, L., and Zeng, W. (2013). Research on the contribution of structure adjustment on carbon dioxide emissions reduction based on LMDI method. Procedia Comput. Sci. 17, 744–751. doi:10.1016/j.procs.2013.05.096
Xie, Y., Zeng, L., Wang, P., Wu, X., and Feng, T. (2022). Water cost for water purification: renewability assessment of a typical wastewater treatment plant in China. J. Clean. Prod. 349, 131474. doi:10.1016/j.jclepro.2022.131474
Xu, C., Chen, W., and Hong, J. (2014). Life-cycle environmental and economic assessment of sewage sludge treatment in China. J. Clean. Prod. 67, 79–87. doi:10.1016/j.jclepro.2013.12.002
Yang, G., Zhang, G., and Wang, H. (2015). Current state of sludge production, management, treatment and disposal in China. Water Res. 78, 60–73. doi:10.1016/j.watres.2015.04.002
Yao, L., He, L., and Chen, X. (2019). Scale and process design for sewage treatment plants in airports using multi-objective optimization model with uncertain influent concentration. Environ. Sci. Pollut. Res. 26 (14), 14534–14546. doi:10.1007/s11356-019-04622-3
Zhang, C., Wang, Y., Song, X., Kubota, J., He, Y., Tojo, J., et al. (2017). An integrated specification for the nexus of water pollution and economic growth in China: panel cointegration, long-run causality and environmental Kuznets curve. Sci. Total Environ. 609, 319–328. doi:10.1016/j.scitotenv.2017.07.107
Zhang, Z., Li, Y., Wang, X., Xu, Y., Liao, Y., Wan, Z., et al. (2021). Investigating the spatiotemporal dynamic evolution and driving factors of wastewater treatment efficiency in the context of China’s River Chief system. Ecol. Indic. 129, 107991. doi:10.1016/j.ecolind.2021.107991
Keywords: COD/NH3-N discharge, industrial and domestic pollution, influencing effects, spatiotemporal differentiation, logarithmic mean divisia index method
Citation: Zhang C, Liu Y, Lan L, You Y and Ye Y (2025) Influencing effects and spatiotemporal differentiation of pollutant discharge from industrial wastewater and domestic sewage in China. Front. Environ. Sci. 13:1576420. doi: 10.3389/fenvs.2025.1576420
Received: 13 February 2025; Accepted: 30 April 2025;
Published: 04 June 2025.
Edited by:
Buddhi Wijesiri, Queensland University of Technology, AustraliaReviewed by:
Ana Maria Antão-Geraldes, Ana Maria Antão-Geraldes, PortugalJiuhe Bu, Wuxi University, China
Copyright © 2025 Zhang, Liu, Lan, You and Ye. This is an open-access article distributed under the terms of the Creative Commons Attribution License (CC BY). The use, distribution or reproduction in other forums is permitted, provided the original author(s) and the copyright owner(s) are credited and that the original publication in this journal is cited, in accordance with accepted academic practice. No use, distribution or reproduction is permitted which does not comply with these terms.
*Correspondence: Chen Zhang, emNoZW5fbmp1QGhvdG1haWwuY29t