 Yun Liu
 Xibin Han
 Xiaodong Cui3*
- 1State Key Laboratory of Submarine Geoscience, Hangzhou, China
- 2Second Institute of Oceanography, Ministry of Natural Resources, Hangzhou, China
- 3College of Geodesy and Geomatics, Shandong University of Science and Technology, Qingdao, China
- 4Key Laboratory of Marine Ecosystem Dynamics, Ministry of Natural Resources, Hangzhou, China
Introduction: The Yangtze River Basin (YRB) is a region of immense economic and ecological significance in China, whose complex topography and climatic variability render it particularly susceptible to landslide disasters.
Methods: In this study, landslide spatial density (LSD) is adopted as a quantitative indicator and multiple linear regression analysis alongside the geographic detector method are employed to evaluate the influence of natural and anthropogenic factors on LSD. A Composite Human Activity Intensity Index (CHAII) is developed from nighttime light intensity, population density, and distances to impermeable surfaces and cultivated land. Factors analyzed include CHAII, slope, topographic ruggedness, precipitation, and distances to river and fault lines.
Results: Results reveal that precipitation and distance to fault are the most significant drivers of LSD across the YRB, with precipitation exhibiting the highest explanatory power. CHAII, precipitation, and topographic ruggedness show strong positive correlations with LSD, whereas slope, distance to river, and distance to fault are negatively correlated. Notably, slopes of 20°–30° correspond to reduced LSD, suggesting a localized mitigating effect. Regionally, intense precipitation in the upper YRB substantially amplifies landslide risk even under low levels of human activity, whereas in the middle YRB natural and anthropogenic factors jointly influence LSD, reflecting a transitional zone. In the lower YRB, interactions between human activity and natural factors become more pronounced, increasing spatial heterogeneity of LSD.
Discussion: The findings provide important scientific insights for landslide risk management and contribute to the sustainable development of the YRB.
1 Introduction
Landslides are geological disasters that occur when the soil and rock masses on slopes slide downward under the influence of gravity, resulting from both natural geological processes and human activities (Hungr et al., 2014). They are among the most hazardous and frequent geological disasters worldwide. In the context of global warming, China, with its complex geographical environment, frequent extreme climatic events, and accelerated urbanization, faces immeasurable human casualties and economic losses caused by landslides (Petley, 2012; Zhang and Zhang, 2014; Li et al., 2017; Lin and Wang, 2018; Zhang et al., 2020; Ge et al., 2024).
Landslides are typically triggered by a combination of natural and anthropogenic factors. Among natural causes, precipitation is recognized as the most direct and frequent trigger, particularly during periods of intense or prolonged rainfall (Zêzere et al., 2015). In addition, slope angle, topographic relief, geological structure, and lithology also play crucial roles in determining slope stability (Van Westen et al., 2008). Human activities such as deforestation, land reclamation, road construction, and urban sprawl can significantly alter surface conditions and hydrological processes, exacerbating the risk of landslides (Glade, 2003; Fan et al., 2020; Dai et al., 2002). Low-intensity human disturbances may also accumulate over time to trigger instability in marginally stable terrains. To mitigate landslide risks, scholars have proposed various prevention and control strategies, including engineering solutions, ecological restoration, land-use planning, and the development of early warning systems (Hong et al., 2007; Bao et al., 2022). With advances in remote sensing and GIS technologies, spatial modeling approaches—such as the information value model, logistic regression, certainty factor, and the geographic detector—have become widely used for landslide susceptibility assessment and zoning (Lee and Pradhan, 2007; Yilmaz, 2009).
As the largest water system in China, the Yangtze River Basin spans multiple geomorphic steps, making it a high-risk area for landslides (Tang et al., 2021). This region not only experiences frequent and widespread landslides, but their formation mechanisms are also exceptionally complex. Investigating the spatial distribution characteristics of landslide disasters and exploring their driving factors can effectively prevent landslides and mitigate disaster losses (Chen et al., 2020). Landslide Spatial Density (LSD) is commonly used as a key indicator to measure the degree of landslide clustering and is widely applied to assess landslide frequency and geographic distribution patterns (Tian et al., 2025). With the rapid development of “3S″ technologies and computer-based methods, LSD has become an effective tool for understanding landslide distribution patterns and their development through spatial analysis (Guzzetti et al., 2009; Ghaderpour et al., 2024). For example, Zhang et al. mapped historical landslide points across administrative units at various scales to analyze landslide spatial distribution (Zhang and Huang, 2018); Sepúlveda et al. investigated the relationship between disaster points, bedrock lithology, and precipitation patterns (Sepúlveda and Petley, 2015); and Qiu et al. used spatial point pattern analysis to illustrate the spatial distribution of landslide disaster points in Shaanxi Province (Qiu et al., 2019).
Most existing studies on landslides in the YRB focus on small scale regions such as the Three Gorges Reservoir area or single-factor analyses. Chang, for instance, applied deep learning algorithms to assess and predict landslide susceptibility in the Yichang section of the YRB (Chang et al., 2022); Wu summarized the main factors affecting slope stability in the Three Gorges area and used an integrated information model to evaluate and zone landslide risks in the region (Wu et al., 2004); Zeng established a quantitative risk assessment framework based on the relationship between water level changes in the Three Gorges Reservoir and landslides (Zeng et al., 2023). In addition, understanding how land use changes and urbanization patterns influence ecological processes has become a key concern in regional disaster studies. For instance, studies have revealed how green space morphology affects urban waterlogging under highly urbanized conditions (Zhang et al., 2025), and how land use evolution affects spatiotemporal patterns of habitat quality across China (Chen et al., 2025). These findings highlight the complex interactions between human-induced land surface changes and environmental risks, underscoring the importance of considering both anthropogenic and natural variables in landslide studies.
Despite these numerous studies, research on large-scale, multifactor driven mechanisms of landslides in the YRB remains scarce. Therefore, this study constructs a Composite Human Activity Intensity Index (CHAII), integrating population density, distance to cultivated land and impervious surfaces, and nighttime light data from 2000 to 2020, to measure human activity intensity. Additionally, we selected the following natural influencing factors: slope, topographic ruggedness, precipitation, distance to river, and distance to fault. Through multiple linear regression analysis and geographic detector methods, we examine the individual effects of these factors on LSD and explore the coupling relationships between different driving factors. The aim is to reveal the driving mechanisms of natural factors and human activities on LSD and provide important insights for landslide risk management in the YRB.
2 Materials and methods
2.1 Data and availability
The landslide point data used in this study are sourced from the Resource and Environmental Science Data Center (https://www.resdc.cn/data.aspx?DATAID=290), which includes a total of 50,836 landslide points collected from the provinces along the main channel of the Yangtze River over a 21-year period from 2000 to 2020 (Resdc, 2024). As the landslide point data include various types of disasters, such as landslides, slope failures, and debris flows, this study only considers landslide data. The provinces of Jiangsu, Zhejiang, and Shanghai are not included in the landslide disaster data in this dataset, so Anhui Province is used to represent the Lower Yangtze River Basin in this study. The study area is shown in Figure 1.
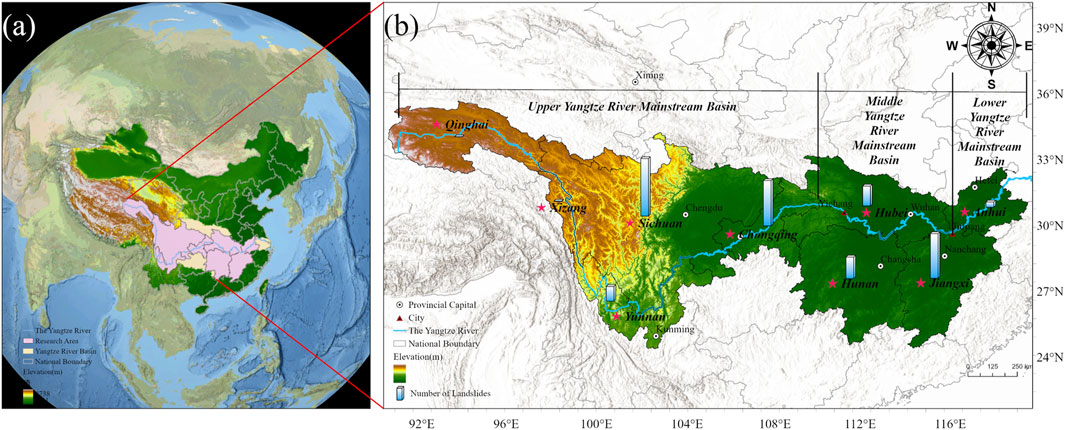
Figure 1. Overview of the study areas. (a) Global perspective of the YRB and the main channel of the YRB. (b) The main channel of the YRB, showing the topography and the landslide frequency statistics for the study area in this paper.
The landslide point data used in this study were obtained from the Resource and Environment Science and Data Center, where geological hazard events have been officially categorized into landslides, debris flows, slope failures, and rockfalls. To ensure consistency and accuracy in the research scope, only records explicitly labeled as “landslide” were retained during data preprocessing, while those classified as “slope failure,” “debris flow,” or “collapse” were excluded to eliminate potential classification bias. Since the dataset encompasses multiple types of geological hazards and lacks landslide records for Jiangsu, Zhejiang, and Shanghai, Anhui Province was selected to represent the downstream region of the Yangtze River Basin (Chang et al., 2023). This selection was based on several key considerations. First, compared to other downstream provinces, Anhui possesses relatively complete and continuous landslide records, enhancing data reliability and interregional comparability. Second, Anhui’s geographical position and diverse landforms—including plains, hills, and low mountains—enable it to capture the varied geomorphic characteristics of the lower basin. Third, the province’s high urbanization rate and intensive human activities exemplify typical anthropogenic influences on landslide distribution in downstream regions, providing a useful contrast to the more natural-condition-driven landslide patterns observed upstream and midstream. These factors collectively justify the use of Anhui as a representative case for downstream analysis.
The land cover data used in this study were sourced from the 30 m resolution annual land cover dataset developed by Yang and Huang (Yang and Huang, 2021), which can be downloaded from https://zenodo.org/records/5210928#. The land cover types include cropland, forest, grassland, water bodies, ice and snow, bare land, impervious surfaces, and wetlands.
The population density dataset was sourced from the WorldPop platform (https://hub.worldpop.org/geodata/listing?id=76) (Adams, 2024). The spatial resolution is 0.00833°. The elevation data were obtained from the 30-m resolution Digital Elevation Model (DEM) raster data provided by the Geospatial Data Cloud. These data were then clipped and processed for spatial analysis in ArcGIS Pro 3.1 to derive the slope and topographic ruggedness for the study area.
Precipitation data were sourced from the National Earth System Science Data Center (https://www.geodata.cn), providing annual rainfall data for China from 1982 to 2022 at a 1 km resolution (Peng et al., 2019). For this study, precipitation data from 2000 to 2020 were clipped to the study area, subjected to raster calculations, and standardized to produce a layer representing the average annual precipitation over the 21-year period. To ensure compatibility with the 30-m resolution of the DEM data, the precipitation data were resampled using a spatial aggregation method. Specifically, precipitation values were averaged within each 30-m grid cell, thereby aligning the resolution of the precipitation data with that of other spatial datasets and eliminating potential resolution mismatches.
River data (scale 1:1,000,000) were sourced from the National Platform for Basic Scientific and Technological Conditions—National Earth System Science Data Center—Lakes and Watershed Subcenter (http://lake.geodata.cn). The data selected includes first-to fifth-order rivers within the study area (Geodata, 2024).
The fault data were sourced from the 1:1,000,000 scale Digital Geological Map Spatial Database provided by the Geological Science Data Publishing System (Jianfeng et al., 2017). River and fault data were processed through clipping, Euclidean distance calculation, and raster calculator to determine the distances to rivers and faults within the study area.
All influencing factors were standardized to the [0,1] range after data preprocessing, and all analyses and calculations were performed in the WGS84 coordinate system. This standardization ensures comparability of the data on the same scale and eliminates the influence of unit differences on the analysis results.
2.2 CHAII
The Composite Human Activity Intensity Index (CHAII) is a quantitative measure of human activity intensity, calculated using data from night-time lights, distance to cropland and impervious surfaces, and population density. Night-time light data not only reflect the presence of human activity but also indicate its intensity (Zhao et al., 2021). The higher the average night-time light intensity at a location, the more frequent and intense human activity is likely to be in that area. However, night-time light data cannot effectively capture human activities in areas without illumination, such as agricultural land. Generally, human activities in and around cropland and impervious surfaces tend to be more prolonged, stable, and intense. The interaction between natural conditions and socioeconomic factors may lead to land use conflicts, particularly Multiple Linear Regression in areas where land use intersects with socioeconomic interests, resulting in significant physical changes. For instance, population growth leads to increased land demand, which triggers competition. The closer the proximity to cropland and impervious areas, the higher the population density tends to be, and the stronger the activity intensity (Lambin and Meyfroidt, 2011). Considering the high degree of urbanization and population density in the middle and lower reaches of the Yangtze River, this study incorporates population density as a variable in the representation of human activity intensity. The three indicators—distance to cropland and impervious surfaces, average night-time light intensity, and population density—effectively capture the influence of different levels of agricultural and urbanization development on human activity intensity. Therefore, the calculation formula for CHAII is as follows:
where NTL, AVG is the average night-time light intensity for the landslide point from 2000 to 2021, DOP_AVG is the average population density for the landslide point from 2000 to 2021, and IC, DIST is the average distance from the landslide point to impervious surfaces and cropland from 2000 to 2021. Norm () is the normalization function that scales the data to the range [0,1].
2.3 Multiple linear regression
A multiple linear regression model was used to analyze the relationship between LSD and its driving factors in the YRB. The selected driving factors include CHAII, slope, topographic ruggedness, precipitation, distance to river, and distance to fault. The model calculation formula is as follows:
where LSD represents the spatial density of landslides andεis an error term. β1–β6 are regression coefficients. S () is the standardized function. The mean of the standardized data was 0, and the standard deviation was 1. To match the spatial density of the landslides, we used the mean values of average annual precipitation (hereafter referred to as precipitation), distance to river, distance to fault and slope within a circular neighbourhood with an 8 km radius. Typically, landslides do not occur in flat areas, such as flat urban centres. Therefore, in the regression analysis, we only used the LSD, CHAII and other influencing factors at all the landslide points.
2.4 Geographic detector
Spatial heterogeneity is one of the fundamental characteristics of geographic phenomena, and the geographic detector is an effective method for detecting spatial heterogeneity. The geographic detector, proposed by Wang, is a statistical method for quantitatively assessing stratified heterogeneity. It has clear physical significance, makes fewer assumptions about the data, and can quantitatively describe the correlation between potential factors and geographic phenomena (Wang et al., 2010a), specifically the correlation between the six major influencing factors and LSD in this study. The principle of this method is to measure the explanatory power of independent variables on the dependent variable by comparing the spatial distribution consistency of the independent and dependent variables. The geographic detector consistsof four main components: risk detector, factor detector, ecological detector, and interaction detector (Wang et al., 2010b). In this study, the factor detector is used to explore the individual effects of different influencing factors on LSD in different river basins, and the interaction detector is applied to examine the coupling effects between factors and their driving mechanisms on LSD across various basins.
Factor Detector: To calculate the individual influence of the six driving factors—CHAII, slope, topographic ruggedness, precipitation, distance to river, and distance to fault—on the distribution of LSD, the following steps were taken: First, spatial overlay analysis was performed on the LSD and the driving factors such as CHAII; second, the influence factor regions were divided into different spatial categories; finally, the average difference of each driving factor (such as CHAII) was computed, and a significance test was conducted to assess the relative importance of the factors. The calculation formula is as follows:
In the formula, q represents the explanatory power of the influencing factor on LSD; Nh and N are the sample sizes of layer h (where h = 1,2, … ,L) and the study area, respectively, which correspond to the number of landslide points;σ_h2 and σ2 represent the variances of the Y values in layer h and the study area, respectively. The value of q ranges from [0, 1]. A larger q value indicates a stronger explanatory power of the factor on LSD, while a smaller q value indicates a weaker explanatory power. When q = 1, it indicates that the factor is unrelated to the geographic phenomenon.
Interaction Detector:The explanatory power of factors X1 and X2 on the regional variable Landslide Spatial Density (LSD) can be assessed through the following steps. First, the q-values for X1 and X2 are calculated, denoted as q (X1) and q (X2), respectively. Then, the q-value for the interaction between the two factors is computed, and a comparison of q (X1) and q (X2) is conducted to indicate the nature of their interaction (Guo et al., 2023; 2023; Peng et al., 2023). The interaction detector is used to identify the interaction between factors, specifically evaluating the effects of coupling (either enhancement or attenuation) and the individual contributions of each factor to LSD. The specific types of interaction are detailed in Table 1.
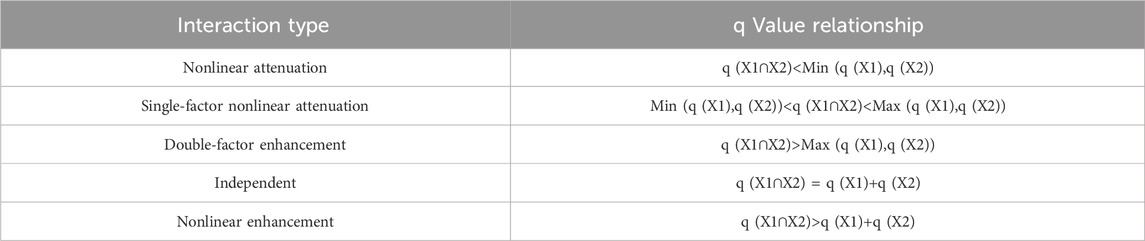
Table 1. Types of interaction between two driving variables on the response variable.
The geographic detector requires input variables to be categorical, meaning that continuous data must be discretized. Since geographic detectors cannot directly handle continuous data, and research has shown that differences in q-values can significantly increase under different discretization methods and numbers of categories (Meng et al., 2018), various discretization methods and classification quantities were tested during the experimental process. Ultimately, the methods and quantities outlined in Table 2 were selected based on statistical analysis to ensure the robustness and accuracy of the results. The choice of discretization methods was driven by the need to balance the preservation of data variability with the requirement for categorical variables, ensuring that the discretized categories meaningfully reflect the underlying distribution of each factor. For instance, the geometric interval method was applied to variables such as the Composite Human Activity Intensity Index (CHAII), slope, and distance to fault, as this method is well suited for variables exhibiting skewed or power-law distributions. In contrast, the natural breaks method was used for factors like precipitation and topographic relief, as it effectively captures intrinsic value groupings and thresholds within the data. The number of classes was set between 5 and 10 to balance resolution and the stability of q-values. All q-values presented in the analysis were derived from discretized variables using optimized classification parameters, ensuring consistency, interpretability, and statistical reliability.
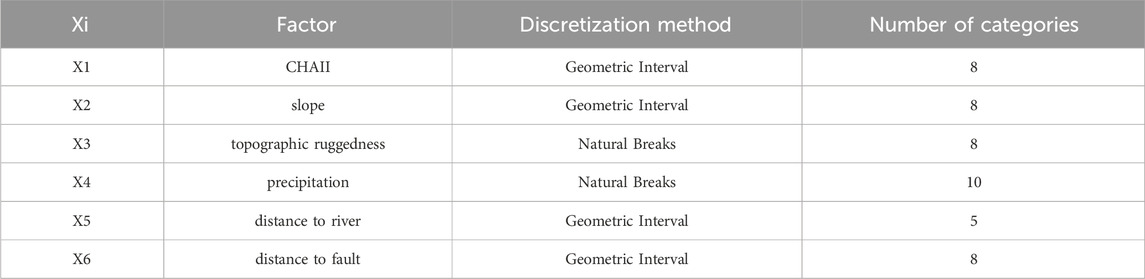
Table 2. The optimal discretization parameters for continuous factors were selected based on statistical analysis.
3 Results
3.1 The landslide distribution characteristics of the YRB from 2000 to 2020
Figure 2 shows the spatial distribution of landslide points and LSD distribution in the study area from 2000 to 2020. Significant differences are observed between the two, with both generally following a band shaped distribution along the main channel of the Yangtze River, particularly in the upper and middle reaches where landslides are more concentrated. According to the statistical data, the number of landslides in different provinces is as follows: 13 in Qinghai, 90 in Tibet, 13,978 in Sichuan, 3,580 in Yunnan, 11,023 in Chongqing, 4,827 in Hubei, 5,209 in Hunan, 10,842 in Jiangxi, and 1,274 in Anhui. Sichuan and Chongqing have the highest number of landslides and also exhibit very high LSD values. While Yunnan and Hubei have fewer landslides compared to Sichuan and Chongqing, they still show localized high LSD areas, mainly concentrated in mountainous regions and areas with heavy rainfall. Jiangxi, with a relatively high number of landslides and high LSD values, is primarily influenced by the region’s hilly terrain and human activities.
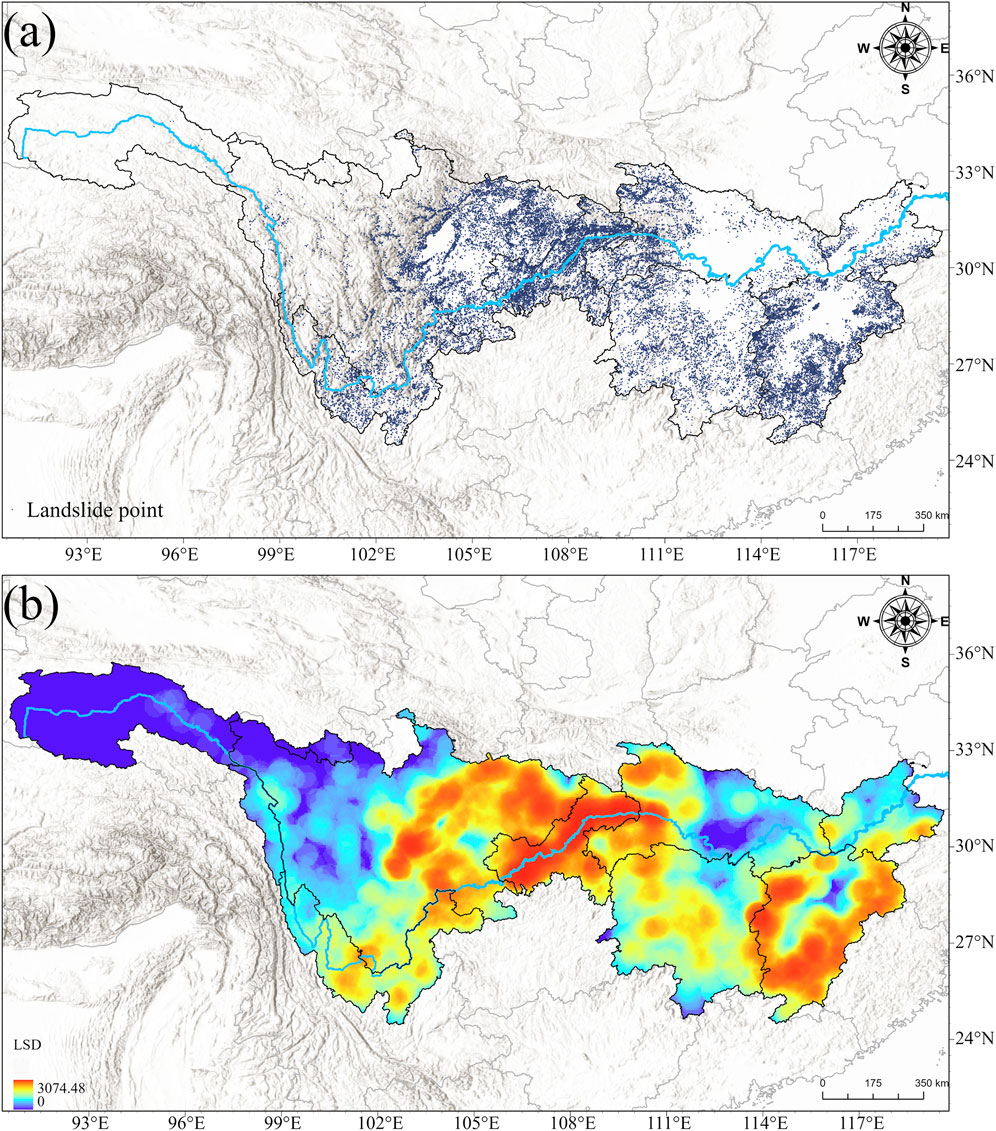
Figure 2. Landslide and LSD Distribution Map. (a) Distribution of landslide points in the study area. (b) Distribution of LSD in the study area.
3.2 Spatial distribution of LSD driving factors in the YRB
The results of the standardized processing of the six driving factors for LSD in the Yangtze River Basin are shown in Figure 3. The CHAII exhibits significant variation across different river sections and basins. The slope reveals the influence of topographic gradient on LSD in various regions of the Yangtze River Basin. The topographic ruggedness reflects the intensity of surface elevation changes. The precipitation data indicate higher annual rainfall in the middle and lower reaches of the Yangtze River. The distance to rivers and distance to faults reflect the spatial distribution characteristics of rivers and faults within the study area. The distance to rivers and distance to faultsreflect the spatial distribution characteristics of rivers and fault structures within the study area, and they play a significant role in influencing landslide spatial density. To quantitatively assess the spatial relationship between landslides and these natural factors, this study classified the distance values using the Geometrical Interval Method in GIS. In the spatial analysis, the Euclidean distance was first used to calculate the nearest distance from each landslide point to rivers and active faults, resulting in two distance-based variables: distance to river and distance to fault. These variables were then classified into multiple intervals to facilitate statistical analysis of their relationships with LSD. Specifically, the distance to river was divided into five classes: 0.000–0.037 km, 0.038–0.053 km, 0.054–0.090 km, 0.091–0.178 km, and 0.179–0.383 km. The distance to fault was classified into eight classes: 0.000–0.185 km, 0.186–0.480 km, 0.481–0.948 km, 0.949–1.690 km, 1.691–2.870 km, 2.871–4.743 km, 4.744–7.718 km, and 7.719–9.591 km.
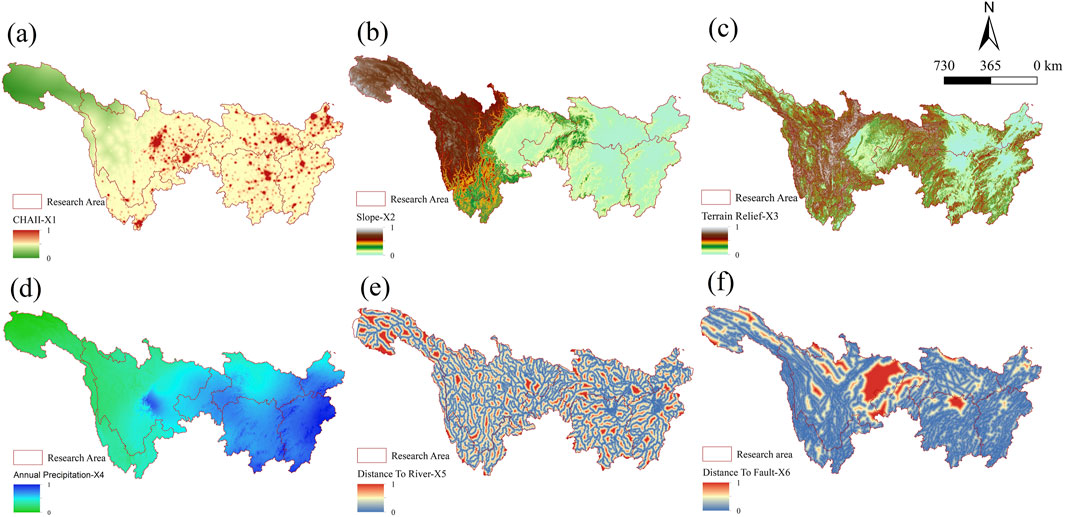
Figure 3. Presents the spatial distribution map of the standardized driving factors for LSD. Panels (a–f) correspond to CHAII, slope, topographic ruggedness, precipitation, distance to rivers, and distance to faults.
Figure 4 shows the results of the Pearson correlation coefficient analysis, which illustrates the linear relationships between the variables. The coefficient values range from [-1, 1], where a negative Pearson correlation coefficient indicates a negative linear relationship, and a positive coefficient indicates a positive linear relationship. The larger the absolute value of the correlation coefficient, the stronger the linear relationship between the influencing factors. Additionally, the Variance Inflation Factor (VIF) is commonly used to detect multicollinearity in models (Salmerón et al., 2024). If VIF >10, it indicates severe multicollinearity (O’brien, 2007). The results in Table 3 demonstrate that there is no strong linear correlation (greater than 0.8 or −0.8) between the influencing factors, except for precipitation and distance to faults, which have a correlation of 0.78. The correlation coefficients between other factors are all less than 0.2. Most of the significance coefficients (p-values) for the factors are p < 0.001, with the exception of the slope and distance to rivers, which have a p-value of 0.014. The VIF values for all independent variables are within an acceptable range, indicating that there is no severe multicollinearity issue. The VIF value for the distance to faults is 2.668, much lower than 10, confirming that the model’s results are reliable, and the explanatory power of each variable is relatively independent. These findings support the conclusion that the selected six influencing factors have no strong correlations, making them suitable for the LSD evaluation model.
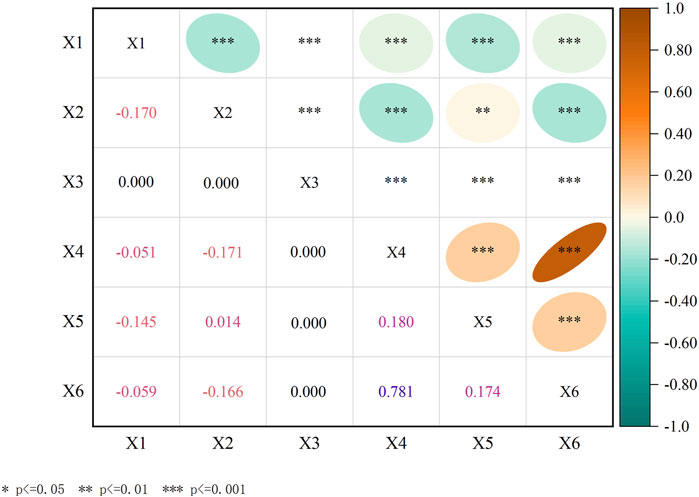
Figure 4. Results chart of pearson correlation coefficient.
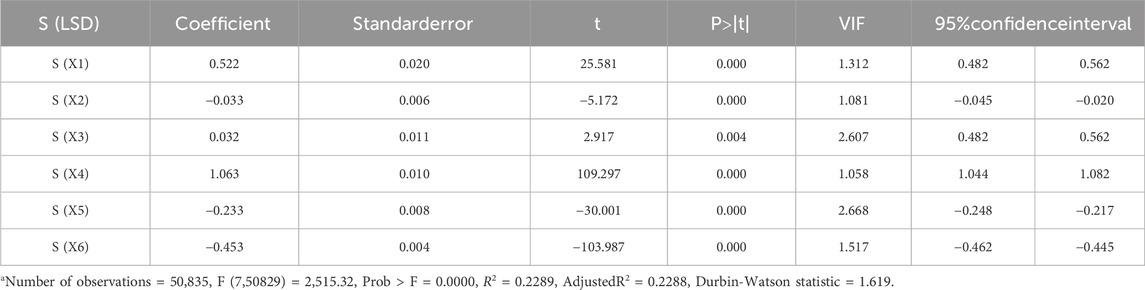
Table 3. Results of multiple linear regression analysis in the YRB.
The correlation analysis on the relationship between LSD and six influencing factors was conducted through the multiple linear regression method. The results are shown in Table 3. The R2 is 0.2288, and the adjusted R2 is 0.2289. Since natural disasters are affected by multiple factors, and there may be strong non-linear relationships and complex interactions among these factors, especially for complex disaster phenomena such as landslides, floods, and earthquakes. An R2 of 22.8% indicates that the model can explain approximately one-fourth of the variability, which is considered reasonable in many landslide studies (Pan et al., 2007; Van Westen et al., 2008; Tien Bui et al., 2012; Sudaryatno et al., 2020; Qi et al., 2024). The unstandardized coefficient B represents the direct impact of the influencing factors on LSD. The results of the multiple linear regression analysis show that among the positive correlations, rainfall (1.063) has the greatest impact on LSD, followed by CHAII (0.522) and terrain relief (0.032). The unstandardized coefficient of the annual average rainfall is 1.063, that is, for every standard unit increase in rainfall, LSD increases by 1.063 units. The standardized coefficient of CHAII is 0.522, which indicates that the increase in the intensity of human activities is positively correlated with LSD. The slope, distance from rivers, and distance from faults are significantly negatively correlated with LSD. The coefficient of the slope is −0.033, and this result shows that, when other variables are controlled, LSD has a slight downward trend as the slope increases. In addition, the coefficient of the distance from rivers is −0.233, meaning that the farther away from the river a region is, the lower the LSD. The coefficient of the distance from faults is −0.453, showing that the closer to the fault a region is, the higher the LSD.
3.3 Characteristics of driving factors for LSD in different river sections of the YRB
3.3.1 Individual effects of driving factors in different sections of the YRB
The analysis results of LSD and its driving factors in different reaches of the YRB using the factor detector in Geographic detector (Figure 5) display the relationships between LSD and multiple driving factors in different reaches of the YRB, and quantitatively reveal the relative explanatory power of each factor for LSD.
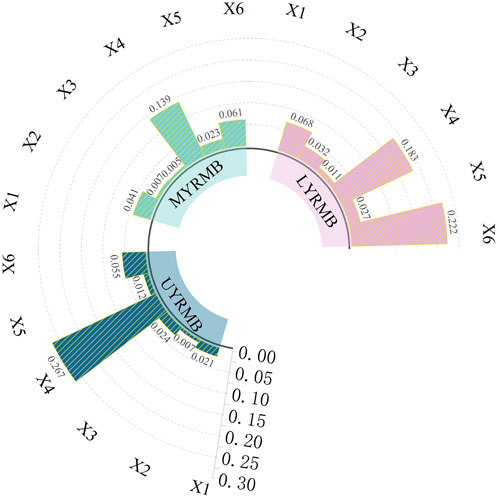
Figure 5. The q-values of the individual effects of LSD driving factors in different reaches of the YRB.
In the UYRB, the results of the factor detector in Geographic detector show that the p-values of all six influencing factors are 0.000, indicating a significant correlation between the selected factors and LSD. Ranked according to the q-values, precipitation (q = 0.266) is the strongest factor affecting the distribution of landslide spatial density, with an explanatory power reaching 26.6%, which is at a relatively high level [42,43]. The distance to faults (q = 0.055) is the second influencing factor. Topographic relief (q = 0.024) and CHAII (q = 0.021) are secondary factors. Although the slope (q = 0.007) is significant, its effect is relatively small.
In the analysis of the MYRB, the results of the factor detector in Geographic detector also show that the p-values of all six influencing factors are 0.000, further confirming the strong correlation between the factors and LSD. The ranking according to the q-values is as follows: rainfall (0.139), distance from faults (0.061), CHAII (0.040), distance to rivers (0.023), slope (0.007), and topographic relief (0.005). In comparison, although the slope (0.007) and the distance to rivers (0.023) have certain explanatory power, their impacts on the landslide spatial density are relatively weak.
In the LYRB, the results of the factor detector in Geographic detector show that the p-values of all six factors are 0.000. Except for the slightly higher p-value of topographic relief (p = 0.143), the other factors all have significant correlations with LSD. According to the q-values, the distance to faults (q = 0.222) becomes the most important influencing factor for landslides in the downstream area; precipitation (q = 0.183) is the second main factor, and its explanatory power is weakened compared with that in the UYRB and MYRB; the importance of CHAII (q = 0.068) is significantly increased in the LYRB; the influences of the distance from rivers (q = 0.027) and the slope (q = 0.032) are increased in the downstream area, while the influence of terrain relief (q = 0.011) is relatively the weakest in this area.
3.3.2 Coupling effect of driving factors in different river sections of the YRB
Figure 6 and Table 4 present the experimental results of the interaction detector in the geographic detector method for LSD and its driving factors across different river sections of the YRB.
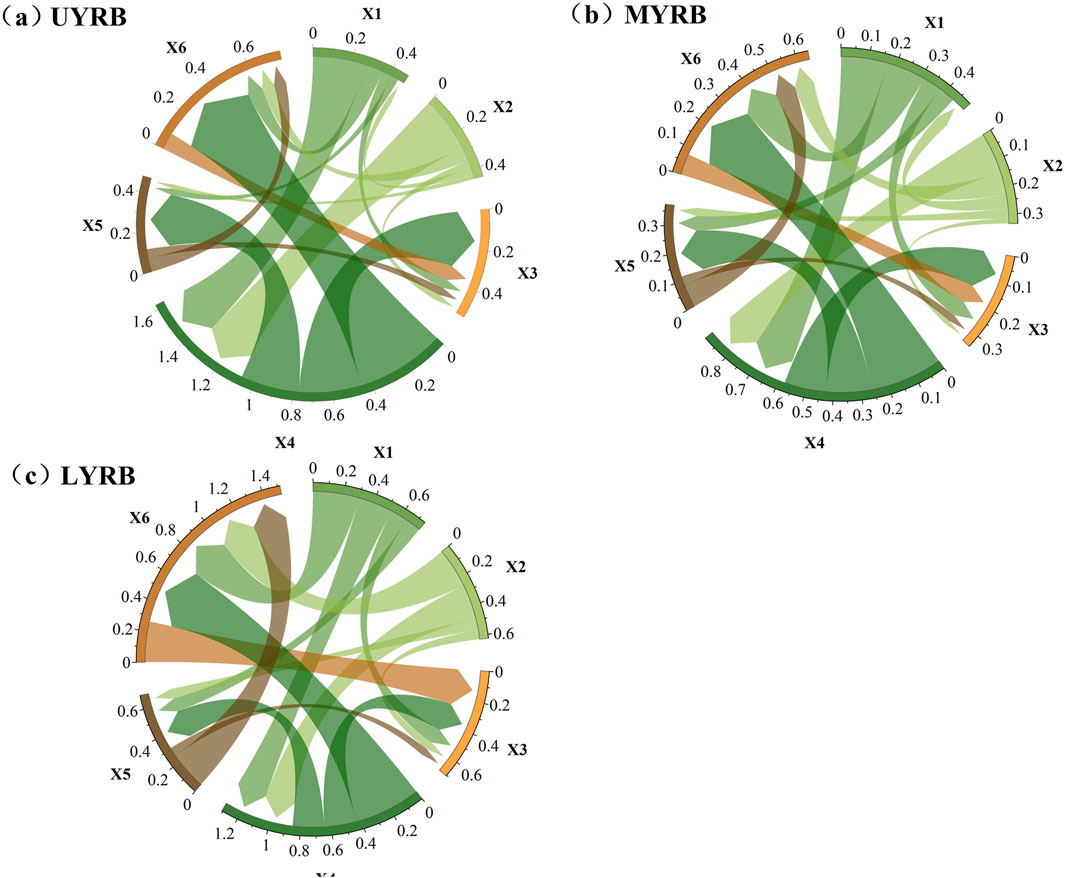
Figure 6. Interactive detection results of different regions in the YRB. Panels (a–c) correspond toUYRB, MYRB and LYRB.
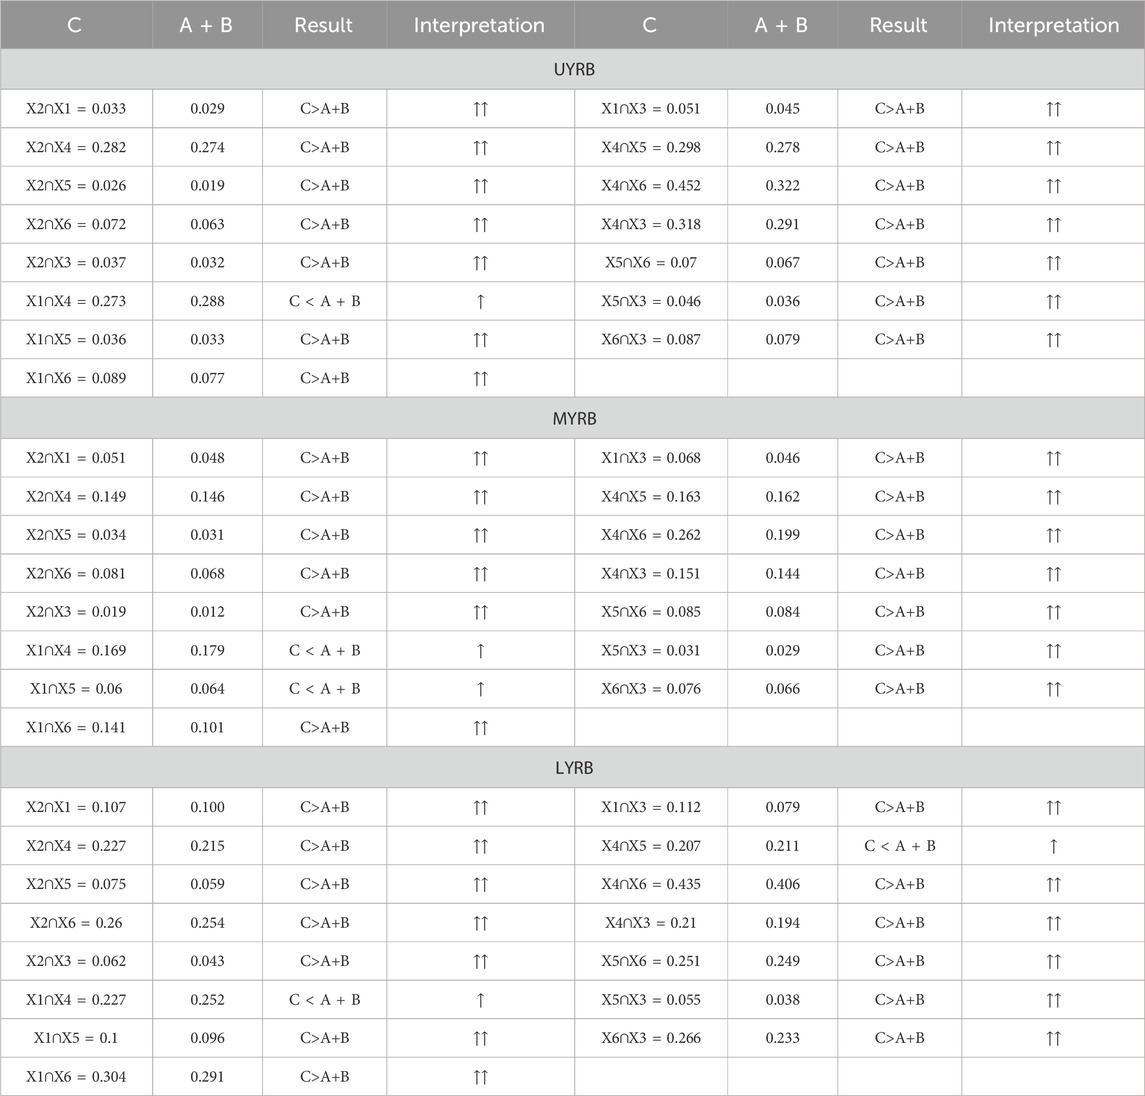
Table 4. Results of multiple linear regression analysis in the YRB.
The results of the interaction detector for the Upper Yangtze River Basin (UYRB) show that the interaction q-values between any two factors are significantly higher than those of the individual factors, indicating that the interaction types are predominantly double-factor enhancement (6.7%) and nonlinear enhancement (93.3%). The interaction q-values of all individual factors with other factors are higher than their respective single factor q-values. Among them, the interaction between precipitation and distance to fault has the highest q-value (0.452), which is a 69.5% increase compared to the individual factor q-value. Other key interaction factors include precipitation and topographic ruggedness (q = 0.291), precipitation and slope (q = 0.282), and precipitation and CHAII (q = 0.273), all exhibiting nonlinear enhancement and significantly improving the LSD distribution. However, the interaction between precipitation and CHAII (double-factor enhancement) shows only a 2.4% increase in the q-value compared to the individual factor. Among the lower-impact interactions, the interaction between slope and distance to river (q = 0.026), slope and CHAII (q = 0.033), and CHAII and distance to river (q = 0.036), though showing nonlinear enhancement, have weak explanatory power for LSD.
In the MYRB, the interaction types of influencing factors are predominantly nonlinear enhancement (86.7%), with double-factor enhancement accounting for 13.3%. The interaction between CHAII, precipitation, and distance to river is of double-factor enhancement type. The interaction q-value between CHAII and precipitation is 0.169, significantly higher than the single-factor q-value for CHAII (0.041). Additionally, the interaction between CHAII and fault has a q-value of 0.141, indicating a clear coupling effect. In the interactions of other factors, the q-values are generally below 0.1, with the interaction between slope and topographic ruggedness having the lowest q-value (0.019). Notably, the interaction between precipitation and distance to river has a q-value of 0.163, exhibiting nonlinear enhancement and surpassing the maximum individual q-values (0.139) of both factors. Similarly, the interaction between precipitation and topographic ruggedness has a q-value of 0.151, exceeding the maximum individual q-value (0.139).
In the LYRB, the interaction types mainly show nonlinear enhancement. The interaction between precipitation and distance to fault has the highest q-value of 0.406, significantly higher than the individual factor q-values, indicating a marked nonlinear enhancement effect. In the downstream region, the interaction between CHAII and distance to fault has a q-value of 0.304, and the interactions between precipitation and CHAII, as well as distance to river, are double-factor enhancements. The q-values of the remaining interactions are generally below 0.100, particularly the interaction between slope and topographic ruggedness (q = 0.011).
4 Discussion
4.1 Analysis of LSD and driving factors in the YRB
Precipitation, as the most significant natural factor affecting landslide spatial density (LSD), significantly increases LSD. According to the data used in this study, extreme precipitation in the upper reaches of the Yangtze River accounts for 69.3% (annual precipitation >1,000 mm), in the middle reaches 41.7% (annual precipitation >1,500 mm), and in the lower reaches 11.4% (annual precipitation >1,600 mm). In recent decades, the frequency of extreme precipitation has been highest in the upper reaches of the Yangtze River (Fang et al., 2018), and the extreme precipitation index for the YRB shows a continuous upward trend. The majority of the increase in the extreme precipitation index occurs in the middle and lower reaches of the Yangtze River (Yuan et al., 2021). This result aligns with the findings of this study, further confirming that annual precipitation is the dominant factor influencing LSD across the entire YRB. The study clearly indicates that annual precipitation significantly alters the LSD of the Yangtze River Basin, and related studies show that the frequency of extreme precipitation in the upper reaches of the Yangtze River has remained high in recent decades, with a continued increase in the extreme precipitation index from 1961 to 2020, particularly in the middle and lower reaches. This further supports the view that precipitation plays a dominant role in the landslide formation process in the Yangtze River Basin, with other factors being secondary.
This finding reflects the importance of precipitation as a hydrodynamic force. Once a large amount of precipitation enters the soil, it reduces soil suction and increases pore water pressure. As precipitation continues, the groundwater level gradually rises, leading to an increase in the weight of the soil, which reduces shear strength and exacerbates geological instability. Moreover, saturated soil layers are more likely to slide, as the addition of water reduces the friction between particles, making the soil particles less stable (Arbanas et al., 2021; Han et al., 2024). The increasing frequency of extreme precipitation events in the YRB will rapidly increase the moisture content both on the surface and underground (Zhang et al., 2024), this process may also be amplified by topographical conditions, such as on steep slopes or near fault zones, where the impact of precipitation becomes more pronounced, thereby increasing the occurrence of landslides (Chang et al., 2022).
Regarding human activity, the distribution of CHAII indicates the potential destructive role of human activities, especially in regions susceptible to disturbance. This result highlights the close connection between human activity interference and landslide occurrence, particularly in the urbanized and development dense areas of the middle and lower Yangtze River.
For the distance factors, the coefficients for distance to faults and distance to rivers are −0.453 and −0.233, respectively, indicating that regions closer to faults and rivers exhibit higher LSD. Areas near faults are more likely to be affected by geological structure changes and seismic activity, while areas near rivers are more susceptible to erosion and groundwater infiltration, increasing landslide risk. The increased rainfall in the YRB, coupled with a rise in extreme precipitation events, leads to higher erosion rates in areas near rivers, contributing to more frequent landslides. In the upper reaches, the impact of faults is particularly pronounced due to the steep terrain and high rainfall, with fault activities triggering large-scale landslides. Interaction analysis shows a nonlinear enhancement effect between CHAII and distance to faults, further suggesting that even in areas near faults where direct human activity impacts are limited, geological instability can still heighten landslide risk. Similar results are found in the middle and lower reaches, though the flatter terrain in these areas limits the triggering effect of fault activities on landslides. Previous studies have also supported this perspective. Ge et al. noted that fault activities enhance the likelihood of landslides, particularly in regions with dense or frequent fault activity (Feng et al., 2024). This shows that fault activities in the YRB not only directly cause geological instability but also indirectly increase landslide risk through hydrological effects and groundwater infiltration.
The slope coefficient is −0.033, indicating that, all else being equal, an increase in slope helps reduce LSD. Further multiple linear regression analysis of the slope reveals that when the slope is between 10° and 20°, it shows a positive correlation with LSD (q = 0.188), with an average annual precipitation of 1,076.148 mm. When the slope is between 20° and 30°, the slope is negatively correlated with LSD (q = −0.087), with an average annual precipitation of 1,236.331 mm. This result suggests that steeper slopes may reduce moisture retention, decreasing pore water pressure and thus lowering the risk of soil instability under certain conditions. In the interaction between slope and slope surface moisture, steeper slopes, due to rapid drainage and limited soil saturation, can reduce the risk of landslides caused by increased soil moisture. This phenomenon is reflected in studies of slope moisture dynamics, where some experiments suggest that steep slopes can stabilize soil by reducing moisture accumulation, lowering landslide risk (Pelascini et al., 2022). However, on the whole, the slope coefficient is small, at only −0.033, indicating that within certain ranges, an increase in slope can somewhat reduce LSD, but the impact is weak and not a primary factor. For most landslides, LSD increases with slope. However, under specific environmental conditions, an increase in slope may lead to a decrease in LSD.
On the other hand, the positive influence of topographic ruggedness highlights the positive correlation between terrain complexity and LSD. The contrasting relationships between slope and topographic ruggedness reflect their different mechanisms in landslide occurrence. Under steep slope conditions, reduced moisture retention on the slope leads to relatively low soil moisture content, thus decreasing geological instability and reducing landslide risk. Meanwhile, increased terrain complexity or ruggedness may concentrate water flow, thereby increasing the instability of surface soil. This interaction between topographic factors produces a relatively balanced impact on landslide risk over a large range of slopes. Steeper slopes primarily reduce landslide risk through rapid drainage and decreased soil moisture, whereas increased topographic ruggedness indicates terrain irregularity and potential water accumulation zones, which tend to have a higher landslide risk. Therefore, the association between the two suggests the complexity of terrain characteristics in landslide initiation mechanisms: steep slopes tend to reduce landslide occurrence within a certain slope range, while complex terrain structures increase the likelihood of localized landslides. This understanding is valuable in landslide risk assessment, as it helps to more precisely identify and distinguish the characteristics of high-risk areas.
4.2 Spatial heterogeneity of LSD and driving factors in different sub-basins of the yangtze river
The differences in natural geographical features and human activities in the Yangtze River Basin result in significant variations in LSD across different river sub-basins. Therefore, the factors affecting LSD and their interactions vary substantially across regions.
4.2.1 UYRB: Significant natural drivers in mountainous landslides
The results for the UYRB indicate that the interaction between precipitation and distance to fault significantly exceeds the individual influence of each factor on LSD. This result aligns with previous studies on the combined driving effects of precipitation and geological conditions in steep mountainous areas, confirming the triggering effect of precipitation on unstable slopes. In fault active areas, precipitation can rapidly increase surface saturation, weakening slope stability, and greatly increasing the likelihood of landslides. Additionally, the interaction between precipitation and topographic ruggedness is also high, further emphasizing the importance of the combined effect of precipitation and terrain variation in complex topographic areas. In the upper reaches, human activity has relatively little influence, with the interaction between CHAII and precipitation only enhancing LSD by 2.4%. This suggests that human activity has a minimal impact on landslide distribution in this region, which aligns with the relatively low human activity intensity in the upper reaches. Thus, landslide distribution in this region is primarily controlled by precipitation and geological conditions. The significant nonlinear enhancement effect further strengthens the spatial consistency of landslide disas-ters, supporting Stanley et al.'s conclusions on the impact of precipitation on landslides in complex terrain in plateau regions (Stanley et al., 2024).
4.2.2 MYRB: Combined natural and human activity effects
The MYRB, located at the transition zone between the Sichuan Basin and the Jianghan Plain, is characterized by hilly and basin like terrain. This area has experienced significant urbanization and agricultural intensification, leading to high land use intensity. The experimental results indicate that the interaction between annual precipitation and distance to fault exceeds the single effects of precipitation and faults. Precipitation exacerbates instability in geologically fragile zones, significantly increasing landslide risk. Particularly, the interaction between precipitation and CHAII has a q-value of 0.169, indicating that human activity under precipitation triggered conditions increases the probability of landslides. This phenomenon suggests that in the middle reaches, both natural and anthropogenic factors significantly enhance the occurrence of landslides. In areas with relatively mild terrain but high human activity, the driving factors of LSD transition from being primarily driven by natural factors to a combined influence of both natural and human activities. Human activities, such as road construction and land reclamation, may cause surface disturbance, which, when combined with precipitation, exacerbates slope instability. The q-value for the interaction between CHAII and precipitation increases by nearly three times, further verifying the amplifying effect of human activities under precipitation driven conditions.
4.2.3 LYRB: Complex LSD distribution in urbanized areas
The LYRB is relatively flat, but in some local hilly areas, the combined effects of precipitation and geological structures still play a major role in the distribution of landslide spatial density. According to the results in section 4.3.2, with urban expansion, impermeable surfaces such as buildings and roads increase, and drainage systems may not be sufficient to handle concentrated rainfall, leading to local instability and increased landslide risk. This phenomenon is consistent with Li et al.'s research on the coupling amplification effect of human activity on natural disaster risk distribution in the Yangtze River Delta, emphasizing that the impact of urbanization on natural disasters should not be over looked (Li et al., 2021). Moreover, the interaction between topographic ruggedness and precipitation in the lower reaches indicates that even in relatively flat terrains, the combined effects of natural and human activities can increase landslide risk, especially under shortterm intense rainfall conditions.
In summary, the driving mechanisms behind LSD in the different subbasins of the Yangtze River vary significantly with both natural and human activity factors. In the upper reaches, natural factors dominate, with precipitation and topographic complexity being the main influences. The nonlinear enhancement effect of precipitation and fault distance is prominent. In the middle reaches, the combined effect of natural and human activities becomes more pronounced, with human activities significantly amplifying the impact of precipitation on LSD. In the lower reaches, a “natural-human” composite model prevails, where both precipitation and geological activities, along with human interventions, significantly enhance LSD. These regional differences highlight the need for localized landslide risk management strategies that consider both natural conditions and human activity characteristics. Specifically, targeted prevention and control measures should be applied in high-risk areas, adapting to local environmental conditions and anthropogenic influences.
The observed spatial heterogeneity in LSD and its driving mechanisms implies that a “one-size-fits-all” approach to landslide risk mitigation is inadequate. Instead, risk management strategies should be tailored to local environmental and socioeconomic contexts. In the UYRB, efforts should focus on enhancing early warning systems and geotechnical monitoring in precipitation-prone, fault-dense areas. In the MYRB, integrated land-use planning and slope stabilization measures are crucial to mitigating the compound effects of natural and anthropogenic stressors. In the LYRB, urbanization has led to an increase in impermeable surfaces, its impact on landslide distribution is relatively small, mainly manifested in the rapid accumulation of water flow during heavy rainfall, which may increase the risk of local landslides due to the increase in impermeable surfaces. Therefore, future landslide risk management should focus on the interaction between active fault areas and rainfall, and take targeted measures such as strengthening landslide monitoring in fault areas, optimizing disaster prevention and warning systems, and increasing protection efforts during rainfall prone periods. These differentiated strategies not only align with the spatial heterogeneity of LSD but also ensure that mitigation efforts are both efficient and regionally appropriate.
4.3 Limited impact and complex coupling of human activity on LSD in the YRB
Tian et al. indicated that human activities are the primary triggering factors for landslides in the Yellow River Basin. Furthermore, the spatial variation in human-induced disturbances exacerbates the spatial heterogeneity of LSD, with the effects of human disturbance varying across different regions, amplifying LSD’s spatial heterogeneity (Tian et al., 2025). However, in the Yangtze River Basin, although there is spatial heterogeneity in human activity intensity across different sub-basins, the impact of human activities on LSD is relatively limited, with natural factors, particularly precipitation and distance to fault, serving as the dominant drivers of LSD. Research by Ge et al. also found that land use changes can influence landslide risk. In areas such as the Huang-Huai-Hai Plain, the Qinghai-Tibet Plateau, and the Loess Plateau, changes in land types have been found to mitigate landslide risk. Conversely, in other regions, these changes may exacerbate land-slide risk (Ge et al., 2024). In line with these findings, our analysis of the Land Use Type Area in the CHAII, including impervious surfaces and cultivated land, shows that the proportion of human activity-related land use types (cultivated land and impervious surfaces) remains constant at around 37%–38%. This is consistent with the conclusions drawn by Ge et al. Moreover, the interaction between CHAII and natural factors varies significantly across different regions of the Yangtze River Basin. Although the CHAII in the upper reaches is relatively low, its interaction with natural factors, such as annual precipitation, significantly amplifies landslide risk, with the interaction value increasing by as much as 92.1%. This phenomenon may be linked to the complex geological and hydrological conditions in the upper reaches of the Yangtze River. With increased precipitation, surface moisture in this region rises, leading to greater soil instability. Even low-intensity human activities can significantly facilitate landslide occurrence under these conditions. This finding supports the argument put forward by Ge et al. that in regions with complex geographical and hydrological environments, the impact of human activities on landslides becomes more pronounced.
5 Conclusion
This study utilizes multiple linear regression analysis, geographic detector factor detectors, and interaction detectors to assess both the individual and interactive effects of several factors, including CHAII (X1), slope (X2), precipitation (X3), topographic ruggedness (X4), distance to river (X5), and distance to fault (X6), on LSD in the YRB. The key findings are summarized as follows:
(1) In the YRB, CHAII, precipitation, and topographic ruggedness are positivelycorrelated with LSD, while slope, distance to fault, and distance to river exhibit negative correlations. Annual precipitation and proximity to faults are identified as the primary drivers of LSD in the basin. Notably, under specific environmental conditions, an increase in slope may result in a reduction in LSD, thereby mitigating landslide risks.
(2) Significant spatial variation in the driving mechanisms of landslide distribution is observed across the different sub-basins of the YRB. In the upper reaches, natural factors predominantly control landslide occurrence, with a marked distribution of landslides in mountainous areas. The middle reaches are characterized by a dual influence of both natural and human activities, while the lower reaches exhibit a complex LSD distribution, primarily driven by urbanization. These regional variations suggest that landslide risk management strategies should be region-specific, with tailored interventions that consider local natural conditions and human activity patterns, particularly in high-risk zones.
(3) While the intensity of human activity displays notable spatial heterogeneity across the YRB, its direct impact on landslide spatial density remains relatively minor. The dominant drivers of LSD are still natural factors, particularly precipitation and distance to fault. However, the influence of human activities on LSD varies significantly across regions. In the upper reaches of the Yangtze River, the interplay of complex geological and hydrological conditions amplifies the effect of precipitation on landslide risks. Under these circumstances, even low intensity human activities can significantly enhance landslide occurrence through interactive effects.
(4) Compared to other regions, the coupling effect between human activities and natural factors on LSD in the YRB is relatively complex, especially in areas with complicated geographical and hydrological conditions. Therefore, future landslide risk assessments in the YRB should focus on the interaction effects between natural factors and human activities to more accurately explore the spatial distribution and driving factors of landslide disasters.
Data availability statement
The original contributions presented in the study are included in the article/supplementary material, further inquiries can be directed to the corresponding authors.
Author contributions
YL: Validation, Writing – original draft, Writing – review and editing. XH: Conceptualization, Supervision, Writing – review and editing. XC: Methodology, Supervision, Writing – review and editing. XL: Funding acquisition, Writing – review and editing. HJ: Funding acquisition, Writing – review and editing.
Funding
The author(s) declare that financial support was received for the research and/or publication of this article. This research is funded by the National Key R&D Program of China (Grant No. 2023YFC2811305), Scientific Research Fund of the Second Institute of Oceanography, MNR (Grant No. SZ2405), and the National Natural Science Foundation of China (Grant No. U2244222).
Conflict of interest
The authors declare that the research was conducted in the absence of any commercial or financial relationships that could be construed as a potential conflict of interest.
Generative AI statement
The author(s) declare that no Generative AI was used in the creation of this manuscript.
Publisher’s note
All claims expressed in this article are solely those of the authors and do not necessarily represent those of their affiliated organizations, or those of the publisher, the editors and the reviewers. Any product that may be evaluated in this article, or claim that may be made by its manufacturer, is not guaranteed or endorsed by the publisher.
References
Adams, M. A. (2024). Population density. Available online at: https://hub.worldpop.org/geodata/listing?id=76 (Accessed December 18, 2024).5283–5284. doi:10.1007/978-3-031-17299-1_2209
Arbanas, Ž., Bobrowsky, P. T., Konagai, K., Sassa, K., and Takara, K. (2021). in Understanding and reducing landslide disaster risk: volume 6 specific topics in landslide science and applications (Cham: Springer International Publishing). doi:10.1007/978-3-030-60713-5
Bao, H., Zeng, C., Peng, Y., and Wu, S. (2022). The use of digital technologies for landslide disaster risk research and disaster risk management: progress and prospects. Environ. Earth Sci. 81, 446. doi:10.1007/s12665-022-10575-7
Chang, J., Fu, X., Zheng, M., and Hao, S. (2023). Temporal and spatial evolution and prediction of energy consumption carbon emissions based on night light data in Shanxi province. Environ. Sci. and Technol. 46, 81–89. doi:10.19672/j.cnki.1003-6504.1162.22.338
Chang, L., Zhang, R., and Wang, C. (2022). Evaluation and prediction of landslide susceptibility in yichang section of yangtze river basin based on integrated deep learning algorithm. Remote Sens. 14, 2717. doi:10.3390/rs14112717
Chen, J., Nie, W., Xie, W., Teng, D., and Wang, X. (2020). Spatial distribution characteristics and influencing factors of landslide disasters in Mountain cities. J. Chongqing Univ. 43, 87–96. doi:10.11835/j.issn.1000-582X.2020.08.010
Chen, Y., Zhang, F., and Lin, J. (2025). Projecting future land use evolution and its effect on spatiotemporal patterns of habitat quality in China. Appl. Sci. 15, 1042. doi:10.3390/app15031042
Dai, F. C., Lee, C. F., and Ngai, Y. Y. (2002). Landslide risk assessment and management: an overview. Eng. Geol. 64 (1), 65–87. doi:10.1016/s0013-7952(01)00093-x
Fan, X., Dufresne, A., Siva Subramanian, S., Strom, A., Hermanns, R., Tacconi Stefanelli, C., et al. (2020). The formation and impact of landslide dams – state of the art. Earth-Science Rev. 203, 103116. doi:10.1016/j.earscirev.2020.103116
Fang, J., Kong, F., Fang, J., and Zhao, L. (2018). Observed changes in hydrological extremes and flood disaster in yangtze river basin: Spatial–Temporal variability and climate change impacts. Nat. Hazards 93, 89–107. doi:10.1007/s11069-018-3290-3
Feng, W., Tang, Y., Ma, H., and Hong, B. (2024). Landslide hazard assessment of the fault zone considering the fault effect: a case study of the lixian–luojiabu fault zone in Gansu province (China). Front. Earth Sci. 12, 1420653. doi:10.3389/feart.2024.1420653
Ge, S., Wang, J., and Jiang, C. (2024). Projection of the precipitation-induced landslide risk in China by 2050. Environ. Res. Lett. 19, 024048. doi:10.1088/1748-9326/ad2435
Geodata (2024). Lake-drainage basin science data center. Available online at: http://lake.geodata.cn/(Accessed December 18, 2024).
Ghaderpour, E., Masciulli, C., Zocchi, M., Bozzano, F., Scarascia Mugnozza, G., and Mazzanti, P. (2024). Estimating reactivation times and velocities of slow-moving landslides via PS-InSAR and their relationship with precipitation in central Italy. Remote Sens. 16, 3055. doi:10.3390/rs16163055
Glade, T. (2003). Landslide occurrence as a response to land use change: a review of evidence from New Zealand. CATENA 51, 297–314. doi:10.1016/S0341-8162(02)00170-4
Guo, Q., Lai, X., Jia, Y., and Wei, F. (2023). Spatiotemporal pattern and driving factors of carbon emissions in Guangxi based on geographic detectors. Sustainability 15, 15477. doi:10.3390/su152115477
Guzzetti, F., Ardizzone, F., Cardinali, M., Rossi, M., and Valigi, D. (2009). Landslide volumes and landslide mobilization rates in Umbria, central Italy. Earth Planet. Sci. Lett. 279, 222–229. doi:10.1016/j.epsl.2009.01.005
Han, C., Hou, T., Shu, B., and Niu, Y. (2024). Formation mechanism and slope stability of the zhangjiayao landslide under extreme rainfall conditions. Indian Geotech. J. doi:10.1007/s40098-024-01078-2
Hong, Y., Adler, R., and Huffman, G. (2007). Use of satellite remote sensing data in the mapping of global landslide susceptibility. Nat. Hazards 43, 245–256. doi:10.1007/s11069-006-9104-z
Hungr, O., Leroueil, S., and Picarelli, L. (2014). The varnes classification of landslide types, an update. Landslides 11, 167–194. doi:10.1007/s10346-013-0436-y
Jianfeng, P., Xiaozhong, D., Kunying, H., Yong, Z., Anshu, C., Yanling, Z., et al. (2017). The national 1: 1000000 geological map spatial database. Geol. China 44, 8–18. doi:10.12029/gc2017Z102
Lambin, E. F., and Meyfroidt, P. (2011). Global land use change, economic globalization, and the looming land scarcity. Proc. Natl. Acad. Sci. U.S.A. 108, 3465–3472. doi:10.1073/pnas.1100480108
Lee, S., and Pradhan, B. (2007). Landslide hazard mapping at Selangor, Malaysia using frequency ratio and logistic regression models. Landslides 4, 33–41. doi:10.1007/s10346-006-0047-y
Li, G., Lei, Y., Yao, H., Wu, S., and Ge, J. (2017). The influence of land urbanization on landslides: an empirical estimation based on Chinese provincial panel data. Sci. Total Environ. 595, 681–690. doi:10.1016/j.scitotenv.2017.03.258
Li, H., Xu, E., and Zhang, H. (2021). Examining the coupling relationship between urbanization and natural disasters: a case study of the pearl river Delta, China. Int. J. Disaster Risk Reduct. 55, 102057. doi:10.1016/j.ijdrr.2021.102057
Lin, Q., and Wang, Y. (2018). Spatial and temporal analysis of a fatal landslide inventory in China from 1950 to 2016. Landslides 15, 2357–2372. doi:10.1007/s10346-018-1037-6
Meng, X., Gao, X., Li, S., Huang, W., and Lei, J. (2018). SBDM v1.0: a scaling-based discretization method for the geographical detector model. Geosci. Model Dev. Discuss. doi:10.5194/gmd-2018-274
O’brien, R. M. (2007). A caution regarding rules of thumb for variance inflation factors. Qual. Quant. 41, 673–690. doi:10.1007/s11135-006-9018-6
Pan, X., Nakamura, H., Tamotsu, N., and Nan, Z. (2007). A GIS-based landslide hazard assessment by multiple regression analysis. Editors P. Gong, and Y. Liu, 67541M. doi:10.1117/12.764899Nanjing, China
Pelascini, L., Steer, P., Mouyen, M., and Longuevergne, L. (2022). Finite-hillslope analysis of landslides triggered by excess pore water pressure: the roles of atmospheric pressure and rainfall infiltration during typhoons. Nat. Hazards Earth Syst. Sci. 22, 3125–3141. doi:10.5194/nhess-22-3125-2022
Peng, L., Sun, Y., Zhan, Z., Shi, W., and Zhang, M. (2023). FR-weighted GeoDetector for landslide susceptibility and driving factors analysis. Geomatics, Nat. Hazards Risk 14, 2205001. doi:10.1080/19475705.2023.2205001
Peng, S., Ding, Y., Liu, W., and Li, Z. (2019). 1 km monthly temperature and precipitation dataset for China from 1901 to 2017. Earth Syst. Sci. Data 11, 1931–1946. doi:10.5194/essd-11-1931-2019
Petley, D. (2012). Global patterns of loss of life from landslides. Geology 40, 927–930. doi:10.1130/G33217.1
Qi, T., Meng, X., and Zhao, Y. (2024). Landslide susceptibility assessment in active tectonic areas using machine learning algorithms. Remote Sens. 16, 2724. doi:10.3390/rs16152724
Qiu, H., Cui, Y., Yang, D., Pei, Y., Hu, S., Ma, S., et al. (2019). Spatiotemporal distribution of nonseismic landslides during the last 22 years in Shaanxi Province, China. IJGI 8, 505. doi:10.3390/ijgi8110505
Resdc (2024). Resource and environmental science and data platform. Available online at: https://www.resdc.cn/data.aspx?DATAID=290 (Accessed December 18, 2024).
Salmerón, R., García-García, C., and Pérez, J. (2024). A redefined variance inflation factor: overcoming the limitations of the variance inflation factor. Comput. Econ., 1–27. doi:10.1007/s10614-024-10575-8
Sepúlveda, S. A., and Petley, D. N. (2015). Regional trends and controlling factors of fatal landslides in Latin America and the Caribbean. NHESS. doi:10.5194/nhessd-3-2777-2015
Stanley, T. A., Soobitsky, R. B., Amatya, P. M., and Kirschbaum, D. B. (2024). Landslide hazard is projected to increase across high Mountain Asia. Earth’s Future 12, e2023EF004325. doi:10.1029/2023EF004325
Sudaryatno, S., Widayani, P., Wibowo, T. W., Pramono, B. A. S., Afifah, Z. N., Meikasari, A. D., et al. (2020). Multiple linear regression analysis of remote sensing data for determining vulnerability factors of landslide in PURWOREJO. IOP Conf. Ser. Earth Environ. Sci. 500, 012046. doi:10.1088/1755-1315/500/1/012046
Tang, X., Wang, H., Huang, D., and Zhang, J. (2021). Evaluation of landslide susceptibility in middle and lower reaches of Yangtze River. Bull. Soil Water Conservation 41, 166–172. doi:10.13961/j.cnki.stbctb.2021.03.023
Tian, N., Lan, H., Li, L., Peng, J., Fu, B., and Clague, J. J. (2025). Human activities are intensifying the spatial variation of landslides in the yellow river basin. Sci. Bull. 70 (2), 263–272. doi:10.1016/j.scib.2024.07.007
Tien Bui, D., Pradhan, B., Lofman, O., Revhaug, I., and Dick, O. B. (2012). Landslide susceptibility mapping at Hoa Binh province (vietnam) using an adaptive neuro-fuzzy inference system and GIS. Comput. and Geosciences 45, 199–211. doi:10.1016/j.cageo.2011.10.031
Van Westen, C. J., Castellanos, E., and Kuriakose, S. L. (2008). Spatial data for landslide susceptibility, hazard, and vulnerability assessment: an overview. Eng. Geol. 102, 112–131. doi:10.1016/j.enggeo.2008.03.010
Wang, J., Haining, R., and Cao, Z. (2010a). Sample surveying to estimate the mean of a heterogeneous surface: reducing the error variance through zoning. Int. J. Geogr. Inf. Sci. 24, 523–543. doi:10.1080/13658810902873512
Wang, J., Li, X., Christakos, G., Liao, Y., Zhang, T., Gu, X., et al. (2010b). Geographical detectors-based health risk assessment and its application in the neural tube defects study of the Heshun Region, China. Int. J. Geogr. Inf. Sci. 24, 107–127. doi:10.1080/13658810802443457
Wu, S., Jin, Y., Zhang, Y., Shi, J., Dong, C., Lei, W., et al. (2004). Investigations and assessment of the landslide hazards of Fengdu county in the reservoir region of the three gorges project on the yangtze river. Environ. Geol. 45, 560–566. doi:10.1007/s00254-003-0911-1
Yang, J., and Huang, X. (2021). The 30 m annual land cover dataset and its dynamics in China from 1990 to 2019. Earth Syst. Sci. Data 13, 3907–3925. doi:10.5194/essd-13-3907-2021
Yilmaz, I. (2009). Landslide susceptibility mapping using frequency ratio, logistic regression, artificial neural networks and their comparison: a case study from kat landslides (Tokat—Turkey). Comput. and Geosciences 35, 1125–1138. doi:10.1016/j.cageo.2008.08.007
Yuan, Z., Yin, J., Wei, M., and Yuan, Y. (2021). Spatio-temporal variations in the temperature and precipitation extremes in yangtze river basin, China during 1961–2020. Atmosphere 12, 1423. doi:10.3390/atmos12111423
Zeng, T., Yin, K., Gui, L., Peduto, D., Wu, L., Guo, Z., et al. (2023). Quantitative risk assessment of the shilongmen reservoir landslide in the three gorges area of China. Bull. Eng. Geol. Environ. 82, 214. doi:10.1007/s10064-023-03242-z
Zêzere, J. L., Vaz, T., Pereira, S., Oliveira, S. C., Marques, R., and Garcia, R. A. C. (2015). Rainfall thresholds for landslide activity in Portugal: a state of the art. Environ. Earth Sci. 73, 2917–2936. doi:10.1007/s12665-014-3672-0
Zhang, F., and Huang, X. (2018). Trend and spatiotemporal distribution of fatal landslides triggered by non-seismic effects in China. Landslides 15, 1663–1674. doi:10.1007/s10346-018-1007-z
Zhang, S., Li, C., Zhang, L., Peng, M., Zhan, L., and Xu, Q. (2020). Quantification of human vulnerability to earthquake-induced landslides using Bayesian network. Eng. Geol. 265, 105436. doi:10.1016/j.enggeo.2019.105436
Zhang, S., and Zhang, L. M. (2014). Human vulnerability to quick shallow landslides along road: fleeing process and modeling. Landslides 11, 1115–1129. doi:10.1007/s10346-014-0468-y
Zhang, W., Qiu, S., Lin, Z., Chen, Z., Yang, Y., Lin, J., et al. (2025). Assessing the influence of green space morphological spatial pattern on urban waterlogging: a case study of a highly-urbanized city. Environ. Res. 266, 120561. doi:10.1016/j.envres.2024.120561
Zhang, Y., Li, P., Xu, G., Li, Z., Wang, Z., Rao, Y., et al. (2024). Spatiotemporal variation characteristics of extreme precipitation in the mid–lower reaches of the yangtze river basin based on precipitation events. Sustainability 16, 9197. doi:10.3390/su16219197
Keywords: Yangtze River Basin, Landslide, human activities, spatial heterogeneity, multiple linear Regression, geographic detector
Citation: Liu Y, Han X, Cui X, Li X and Jin H (2025) Spatial heterogeneity of landslide distribution and its drivers in the Yangtze River Basin: a remote sensing and GIS-based multi-factor analysis. Front. Environ. Sci. 13:1576700. doi: 10.3389/fenvs.2025.1576700
Received: 14 February 2025; Accepted: 12 June 2025;
Published: 20 June 2025.
Edited by:
Erhan Sener, Süleyman Demirel University, TürkiyeReviewed by:
Oznur Karaca, Çanakkale Onsekiz Mart University, TürkiyeJinyao Lin, Guangzhou University, China
Copyright © 2025 Liu, Han, Cui, Li and Jin. This is an open-access article distributed under the terms of the Creative Commons Attribution License (CC BY). The use, distribution or reproduction in other forums is permitted, provided the original author(s) and the copyright owner(s) are credited and that the original publication in this journal is cited, in accordance with accepted academic practice. No use, distribution or reproduction is permitted which does not comply with these terms.
*Correspondence: Xibin Han, aGFueGliaW5Ac2lvLm9yZy5jbg==; Xiaodong Cui, eGlhb2Rvbmc2Nzc3QDEyNi5jb20=