 Naichang Zhang1
 Peng Li
 Tian Wang
- 1Power China Northwest Engineering Corporation Limited, Xi’an, China
- 2State Key Laboratory of Eco-Hydraulics in Northwest Arid Region of China, Xi’an University of Technology, Xi’an, China
- 3Shaanxi Union Research Center of University and Enterprise for River and Lake Ecosystems Protection and Restoration, Xi’an, China
Introduction: Soil erosion is a critical issue faced by many regions around the world, especially in the purple soil hilly areas. Rainfall and slope, as major driving factors of soil erosion, pose a significant challenge in quantifying their impact on hillslope runoff and sediment yield. While existing studies have revealed the effects of rainfall intensity and slope on soil erosion, a comprehensive analysis of the interactions between different rainfall types and slope is still lacking. To address this gap, this study, based on machine learning methods, explores the effects of rainfall type, rainfall amount, maximum 30-min rainfall intensity (I30), and slope on hillslope runoff depth (H) and erosion-induced sediment yield (S), and unveils the interactions among these factors.
Methods: The K-means clustering algorithm was used to classify 43 rainfall events into three types: A-type, B-type, and C-type. A-type is characterized by long duration, large rainfall amounts, and moderate intensity; B-type by short duration, small rainfall amounts, and high intensity; and C-type is intermediate between A-type and B-type. The Random Forest (RF) algorithm was employed to assess the impacts of these factors on runoff and sediment yield, along with a feature importance analysis.
Results: The results show that rainfall amount has the most significant impact on runoff and sediment yield. Under different rainfall types, the ranking of the effects of rainfall amount and I30 on H and S is as follows: rainfall amount (C>A>B), I30 (A>B>C). The impact of slope follows a trend of first increasing and then decreasing, with varying degrees of influence on H and S depending on the rainfall type.
Discussion: The novelty of this study lies in combining machine learning techniques to systematically evaluate, for the first time, the interactions between rainfall type and slope and their impact on hillslope runoff and sediment yield in purple soil hilly areas. This research not only provides a theoretical basis for soil erosion control but also offers scientific support for the precise prediction and management of soil conservation measures in purple soil regions.
1 Introduction
Purple soil was formed from purple rocks of the Jurassic and Cretaceous periods (Xiao et al., 2024), and is widely distributed in the middle and lower reaches of the Yangtze River in China (Zhang et al., 2004). It is rich in mineral nutrients, making it an important agricultural natural resource in the region (Chen et al., 2024). Purple soil is the main soil type in the sloping farmland of the Sichuan Basin, characterized by thin soil layers, low permeability, high hydrophobicity, and susceptibility to weathering (Zhang et al., 2023). Additionally, purple soil has low resistance to soil erosion, leading to severe soil erosion and nutrient loss in the area (Chu et al., 2020). Sediment deposition reduces reservoir storage capacity and increases the risk of flooding. Additionally, nutrient transfer leads to eutrophication of water bodies in the upper and middle reaches of the Yangtze River, exacerbating regional water environmental pressures (Gao et al., 2023; Xiao et al., 2024).
Slope is one of the primary contributors to hydraulic erosion, dynamic transport, and sediment transfer (Sun et al., 2022; Yan et al., 2024), and surface runoff plays a decisive role in the soil erosion process (Admas et al., 2022). Surface runoff is the driving force and carrier for sediment, nitrogen and phosphorus transport (Tapas et al., 2024), which on one hand leads to substantial loss of topsoil, and on the other, causes the loss of soluble and readily available nutrients during vegetation growth (Jia et al., 2007), reducing soil fertility. The purple soil distribution area receives abundant rainfall year-round, and most of the sloping farmlands in this region have steep slopes (≥10°), which causes severe soil and water loss. Yan et al. (2023) quantified the effects of five different crop types and rainfall conditions on slope runoff and soil erosion, and the results indicated that rainfall and runoff characteristics have a greater impact on runoff depth and soil loss rate than crop coverage. Chen et al. (2022) evaluated the impact of slope on runoff and sediment yield based on simulated rainfall methods and terrain models, revealing that slope gradient has a significant effect on both runoff and sediment yield. Therefore, rainfall and slope are two key factors influencing the soil erosion process in purple soil distribution areas. Based on a study of microtopographic dynamics in response to erosion processes on cultivated slopes in China’s Shaanxi Loess Region, Rao et al. (2024) revealed critical findings: Erosion and deposition predominantly occurred in the middle-lower slope segments, with 70% of the slope surface exhibiting elevation fluctuations below 10 mm, while topographic alterations reached 25 mm in remaining areas. Investigations on purple soil slopes demonstrated that soil profile thickness significantly modulates hydrological processes. The soil’s elevated clay fraction and permeability, combined with effective crop canopy coverage during rainy seasons, synergistically suppressed surface runoff generation (Liu et al., 2024). Notably, vegetation systems exert dual mechanisms in soil-water conservation: Canopy architecture enhances rainfall interception and dissipates raindrop kinetic energy, while root networks optimize soil porosity (particularly non-capillary pore development), thereby improving infiltration capacity, attenuating flow intensity, and intercepting sediment transport (Zhang et al., 2025).
For a long time, scholars have studied the mechanisms of runoff and sediment yield on purple soil slopes by adopting methods such as field monitoring, laboratory experiments, or a combination of both (Wang et al., 2024). Ma et al. (2017) analyzed the effects of different rain types on runoff and sediment yield on sloping farmland with different gradients, and the results showed that short-duration, high-intensity rainfall is the main type responsible for soil erosion. Sun et al. (2018) analyzed the impact of different rainfall intensities on runoff and sediment yield on purple soil slopes, pointing out that rainfall intensity and slope runoff were significantly positively correlated. Han et al. (2021) assessed the impact of slope gradient and rainfall intensity on runoff and sediment yield, and the results showed that, under the same rainfall intensity, the reduction in runoff decreases as slope increases, while soil erosion rates increase with steeper slopes.
Rainfall intensity and slope are key factors influencing soil erosion on hillslopes. The characteristics of rainfall, variations in slope, and their interactions play a decisive role in runoff, erosion, and sediment transport processes. While previous studies have explored the individual effects of rainfall intensity and slope on soil erosion, most have not thoroughly examined the complex interactions between rainfall type and slope, particularly under different rainfall types, where the impact of slope on runoff and sediment yield remains unclear. Furthermore, machine learning algorithms have been proven to be highly effective in spatial modeling analysis (Ahmed et al., 2024), yet their application in assessing the impact of soil erosion factors on soil erosion remains scarce. As such, existing research has yet to provide an effective framework for uncovering the specific mechanisms of the interaction between rainfall and slope in hillslope soil erosion, limiting our comprehensive understanding of the erosion process. At the same time, although machine learning methods can offer high prediction accuracy, especially in “black-box” systems, they lack transparent explanations of the model outcomes, making it difficult for researchers to understand the contribution of each predictor variable to the model output. Explaining model results is crucial for enhancing the model’s credibility and applicability (Abdollahi et al., 2024).
To fill this research gap, this study employs machine learning methods, combining the K-means clustering algorithm for rainfall type classification and the Random Forest (RF) algorithm to assess the effects of rainfall and slope on hillslope runoff and sediment yield. We propose that machine learning-based analytical methods can effectively reveal the interactions between rainfall type and slope, providing more precise scientific support for soil erosion control in purple soil hilly areas. This study aims to provide scientific data to support soil erosion control under different rainfall types and slope conditions, ultimately offering more targeted management measures for regional soil conservation.
2 Materials and methods
2.1 Research area
The Wanan small watershed is located in Wanan Village, Yunxi Township, Yanting County, Sichuan Province (Figure 1A), with a total area of about 12.36 km2, situated in the fourth tributary area of the Jialing River in the central Sichuan hilly region (Liu et al., 2022). The region has a mid-subtropical humid monsoon climate (Li et al., 2020), with an average annual temperature of 17.3°C, an annual precipitation of 836 mm, an annual evaporation of 604 mm, and an annual sunshine duration of 1,104 h (Chen et al., 2024). The main soil types include calcaric regosols, cumulic anthrosols, and calcaric fluvisols (Figure 1D). The soil profile typically extends to depths of 20–70 cm, with exceptional cases demonstrating thickness exceeding 100 cm in localized areas. Particle size analysis revealed a granulometric composition dominated by silt (86.91%), followed by clay (11.56%) and sand (1.51%). The pedochemical characteristics showed alkaline conditions (mean pH 8.2), moderate organic matter content (20.12 g kg−1), and favorable water retention properties with field capacity measured at 28.3%. Land use is mainly composed of cropland and forestland (Figure 1C). The primary crops are corn, wheat (Li et al., 2020). The main tree species are alder and cypress, which are gradually succeeded by pure cypress stands (Chen et al., 2024).
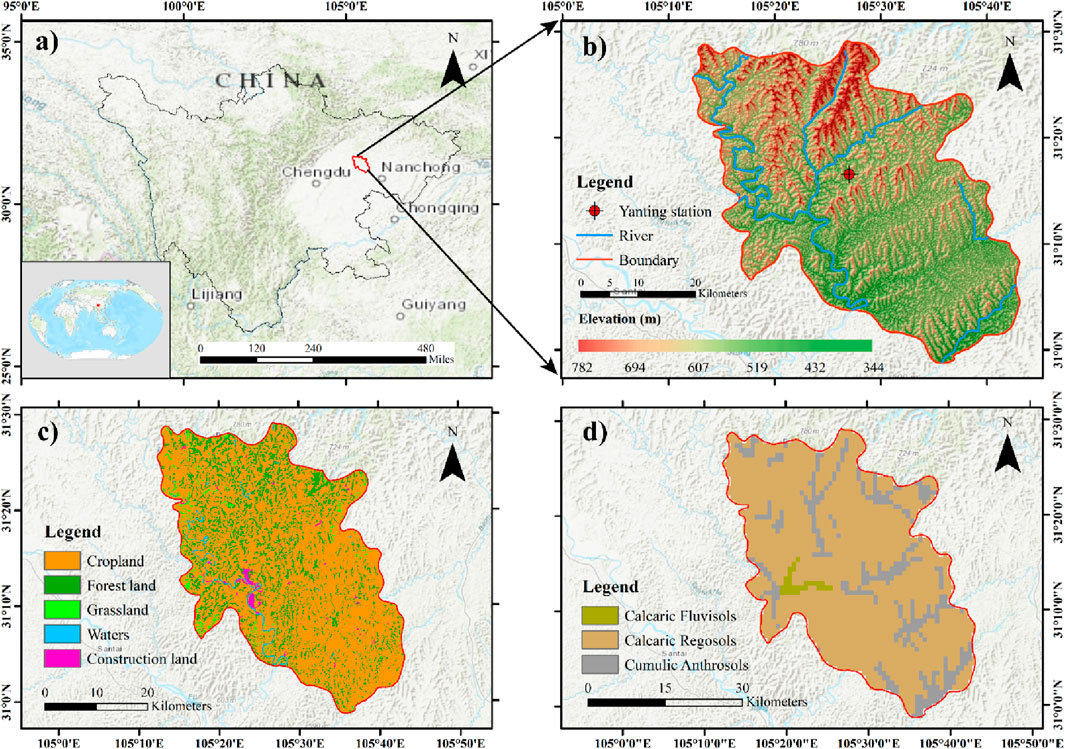
Figure 1. Map of the geographical location of the study area, (a) The location of the Wan’an small watershed in Sichuan Province, China; (b) The location of Yanting Hydrological Station in the Wan’an small watershed and the elevation map of the Wan’an small watershed; (c) The land cover map of Wan’an small watershed; (d) The soil type map of the Wan’an small watershed.
2.2 Data source
The data for this study were obtained from the Wanan Small Watershed Comprehensive Observation Station in Yanting County, Sichuan Province (Figure 2), covering meteorological and hydrological measurements from 2015 to 2019, including key indicators such as rainfall, runoff, and sediment yield. The Yanting Station established runoff plots with different slope gradients of 6.5°, 10°, 15°, 20°, and 25°. All runoff plots used a crop rotation system of winter wheat and summer maize to simulate local agricultural practices. In terms of cultivation management, sowing and fertilization followed traditional local practices, and no additional irrigation or fertilization was applied during the crop sowing period. Each runoff plot consists of three subplots, each with an area of 20 m × 5 m. To ensure the hydrological independence of the runoff systems, the plots are enclosed by concrete embankments to prevent lateral leakage. Additionally, in accordance with the structural characteristics of purple soil, a 60 cm thick concrete layer is poured at the lower end of the soil profile to simulate an impermeable interface between the soil and underlying rock. The backfilled soil follows the natural stratification of the original soil profile. At the base of each subplot, a collection trough is installed, and runoff from the trough is directed through a drainage pipe into a connected runoff pool for the collection of both runoff and sediment. The outlets and collection pools are kept fully independent to maintain hydrological independence. Furthermore, the plots are designed with varying slopes and soil types to simulate the spatial variability of soil and terrain in real-world conditions, enabling an in-depth investigation of the effects of these factors on slope runoff and erosion. The soil type, soil depth, farming practices, and fertilization methods were generally consistent across all runoff plots (Table 1). In total, 43 rainfall events with precipitation, runoff, and sediment during 2015–2019 were recorded.
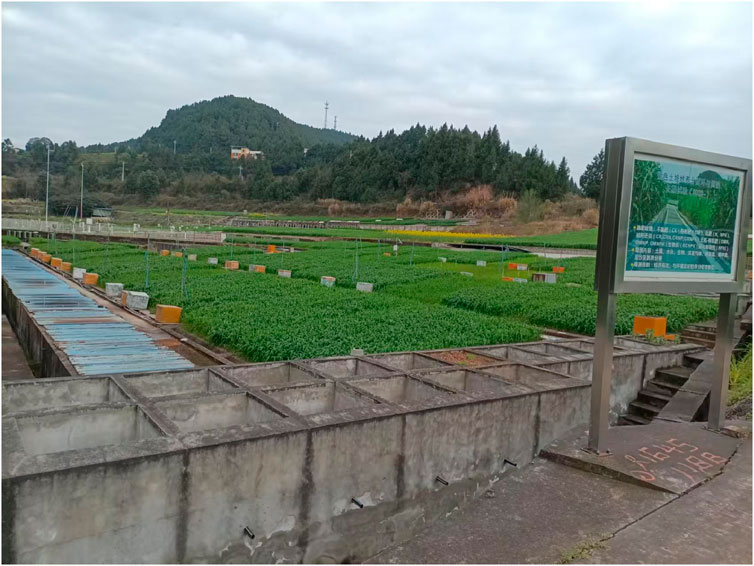
Figure 2. Runoff plot, in which wheat is planted.
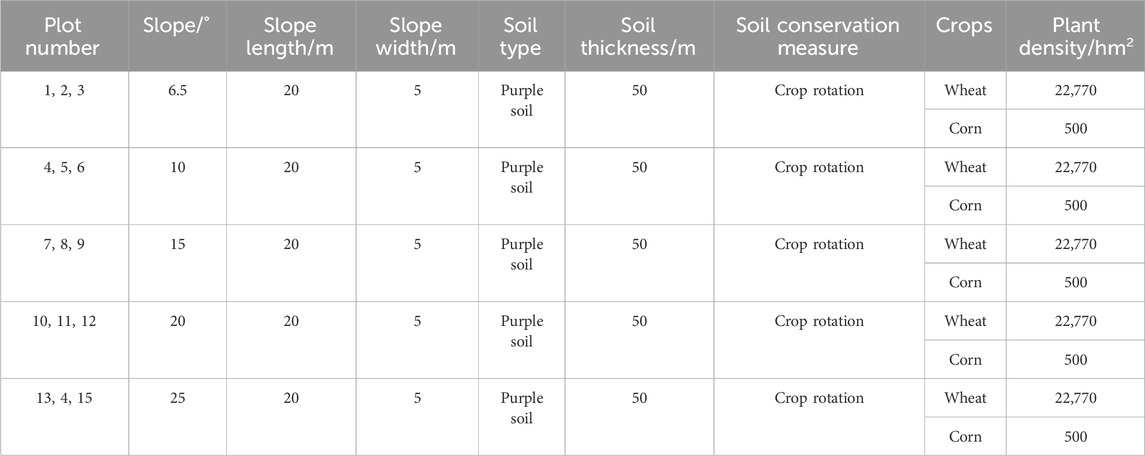
Table 1. 2015–2019 overview of runoff plot.
2.3 Methods
2.3.1 Clustering algorithm
The K-means clustering algorithm is a hard clustering algorithm under unsupervised learning (Mondal et al., 2016), which measures data object similarity using Euclidean distance, assuming that the smaller the distance, the greater the similarity (Guan et al., 2024). Before clustering, the number of clusters k is pre-set, and k initial cluster objects are then randomly selected from the dataset, with each representing the mean or center of a cluster. The remaining objects are then calculated based on their distances from all cluster centers and assigned to the nearest cluster, after which the mean of all clusters is recalculated as the new cluster center. This process is repeated until the cluster centers no longer change. The sum of squared errors is as follows (Guan et al., 2024):
Here, E represents the sum of squared errors within the cluster, and
2.3.2 Mann-Kendall rank order correlation trend test
H.B. Mann and M.G. Kendall introduced the Mann-Kendall test, commonly referred to as the M-K test (Mann, 1945; Kendall, 1948). Due to its robustness in handling extreme values, the Mann-Kendall test is widely adopted in hydrological studies (Chen and Grasby, 2009; Liu et al., 2021). In the MK test, the statistical variable S is:
where
When n ≥ 10, the statistical variable S follows a normal distribution with variance Var(S):
The standardized statistic Z is calculated by the following equation:
If the value of Z is greater than 0, the time series shows an upward trend; if the value of Z is less than 0, the time series shows a downward trend. Meanwhile, the significance of the upward or downward trend is categorized into three categories according to the ab-solute value of the statistic Z value: when |Z| > 1.65, i.e., P < 0.05; when |Z| > 1.96, i.e., P < 0.01; and when |Z| > 2.58, i.e., P < 0.001.
2.3.3 Random forest algorithm
Random Forest is an ensemble learning method that improves model accuracy and robustness by constructing multiple decision trees (Breiman, 2001). Each tree is generated using the Bootstrap Sampling method, which involves randomly selecting samples from the original dataset with replacement (Li et al., 2024). This means that each tree is trained on a different sub-set of samples, reducing the risk of model overfitting. During training, Random Forest us-es the Bootstrap Sampling method to generate training sets for each decision tree, and the unselected samples are referred to as Out Of Bag (OOB) data (Nie et al., 2022). OOB data is used to assess model error, providing an unbiased estimate of the model’s generalization ability.
Random Forest provides a method to evaluate feature importance. By calculating the contribution of each feature to the classification performance of the decision tree ensemble, its importance in the model is quantified. The Feature Importance Measures (FIM) represent the contribution of each feature, and the Out Of Bag (OOB) Error Rate is used as an evaluation metric to more accurately reflect the feature’s impact on the overall model (Zhao et al., 2022). The indicator function is defined as (Zhao et al., 2022):
The
Here,
Here,
2.3.4 Model performance evaluation
To assess the predictive capability of the model, this study employed various evaluation metrics, including Mean Absolute Error (MAE), Root Mean Square Error (RMSE), and Nash-Sutcliffe Efficiency (NSE). Among them, smaller MAE and RMSE values indicate lower prediction errors and higher accuracy, while a NSE value closer to 1 suggests a higher degree of agreement between the predicted and observed values, reflecting a stronger predictive ability of the model. The formulas are as follows:
where yo,i and ys,i represent the observed and predicted values, respectively; n represents the total number of samples; and i indicates the i sample, ranging from 1 to n.
2.3.5 Statistical analysis
In this study, the Random Forest (RF) algorithm was implemented using the random Forest package in the R software environment. A regression tree-based RF approach was chosen, as the objective was to predict continuous variables, specifically runoff depth and sediment yield, rather than to address classification problems. In the Random Forest model, each decision tree independently generates a prediction, and the final result is obtained by averaging the predictions of all trees. This ensemble technique effectively reduces the risk of overfitting and enhances the overall predictive accuracy of the model. To prevent overfitting or underfitting, 5-fold cross-validation was used in this study to evaluate the model’s performance. Graphical outputs were generated using Origin 2021.
3 Results
3.1 Determination and classification of erosive rainfall
3.1.1 Determination of erosive rainfall
A total of 43 erosive rainfall events (>12.7 mm) were selected during the 2015–2019 study period (Yang et al., 2025). Erosive rainfall mainly occurred from May to September each year (Figure 3), with average monthly occurrences of 1.5, 2.5, 2.75, 2, and 1.6 events, respectively. The average annual erosive rainfall was 493 mm, accounting for 57.57% of the average annual total rainfall of 856 mm. Erosive rainfall in the study area was mainly concentrated in the rainy season.
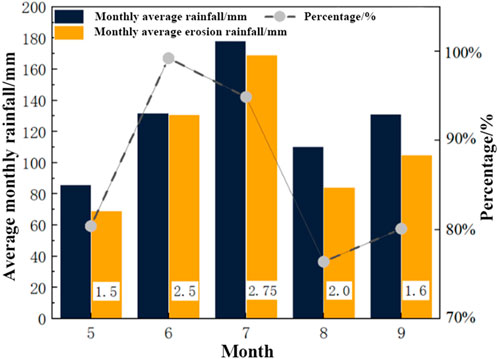
Figure 3. Statistics of erosive rainfall in months with frequent rainfall from 2015 to 2019.
3.1.2 Classification and characteristics of erosive rainfall types
The K-means clustering algorithm was used to perform cluster analysis on 43 erosive rainfall events, and the results were evaluated using a discriminant clustering method. In the analysis, rainfall amount (P), rainfall duration (D), and maximum 30-min rainfall intensity (I30) were selected as rainfall characteristic indicators. The study results categorized these 43 rainfall events into three rainfall types.
The scatter plots of the clustering functions for the three rainfall types are concentrated in different regions (Figure 4). The significance test value of the clustering function for Type B rainfall is P < 0.05, indicating that the group centroids of this type show significant differences, with clear clustering boundaries. Type B and Type C rainfall show greater dispersion along function 2 and function 1, while Type A rainfall is more concentrated. Type C rainfall shows the most significant variation in rainfall characteristics, while Type B has strong independent characteristics, and Type A is relatively stable in its rainfall features.
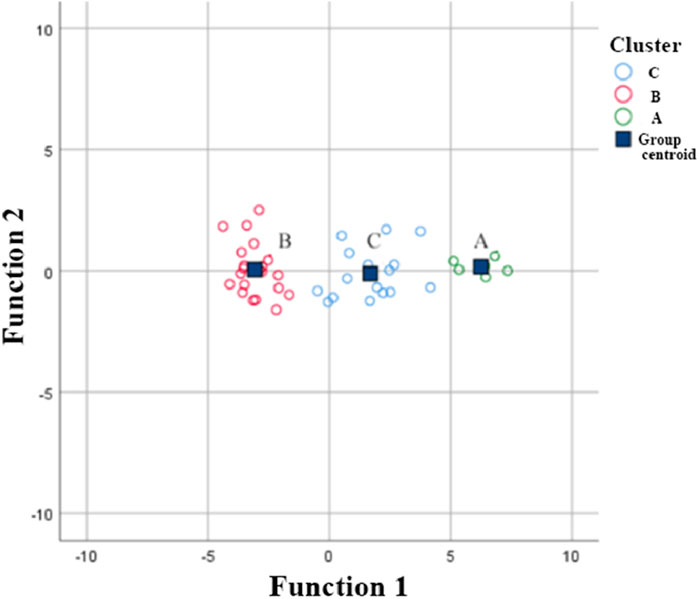
Figure 4. Scatter plot of erosive rainfall discrimination classification.
Table 2 shows the clustering results of the 43 rainfall events. The results show that the distribution of rainfall types is as follows: Type A accounts for 8.84%, Type B accounts for 68.7% (the main type), and Type C accounts for 37.2%. Type A rainfall has the longest average duration (46.29 h), the highest average rainfall amount (94.38 mm), and the lowest average maximum 30-min rainfall intensity (19.48 mm/h). Its individual event erosion intensity (S) ranges from 0.092 to 0.882 t/hm2, and the runoff depth (H) ranges from 1.99 to 21.61 mm. Type B rainfall has the shortest average duration (0.65 h), the lowest average rainfall amount (37.94 mm), and the highest average maximum 30-min rainfall intensity (39.01 mm/h). Its individual event erosion intensity (S) ranges from 0.0095 to 0.361 t/hm2, and the runoff depth (H) ranges from 0.782 to 4.846 mm. The Type C rainfall pattern exhibited intermediate characteristics between Type A and Type B, with mean values of rainfall duration (26.28 h), maximum 30-min intensity (24.78 mm/h), and total precipitation (63.08 mm) falling between those of the two established rainfall types.
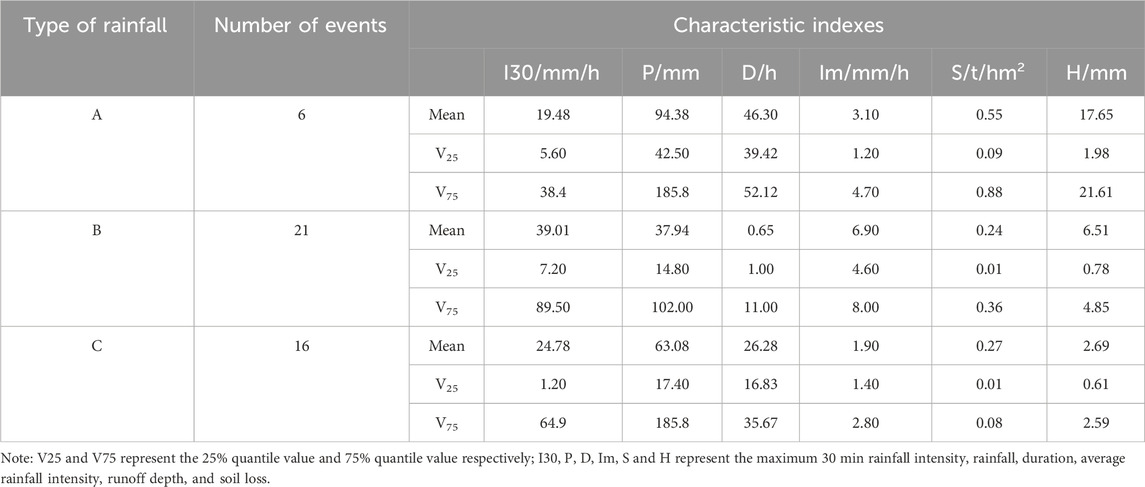
Table 2. Rainfall characteristics of different types of rain.
3.2 The relationship between rainfall characteristic indicators and runoff depth, erosion and sediment yield
3.2.1 Importance analysis of rainfall factors on runoff depth and erosion sediment yield
The clustering results identified three rainfall patterns: A, B, and C. Combined with the data from the 15 selected runoff plots, a total of 645 data points were obtained. This data will be consolidated according to different slopes (6.5°, 10°, 15°, 20°, and 25°) and used as input for the Random Forest model, with 75% randomly selected as the training set and 25% as the testing set.
We predicted runoff depth and sediment yield under different slope conditions and assessed the model’s performance accordingly (Table 3). At a 6.5° slope, the model’s prediction of runoff depth was less than ideal, with a Nash-Sutcliffe Efficiency (NSE) of only 0.58. However, under other slope conditions, the model demonstrated high accuracy in predicting both runoff depth and sediment yield, with NSE values exceeding 0.75.
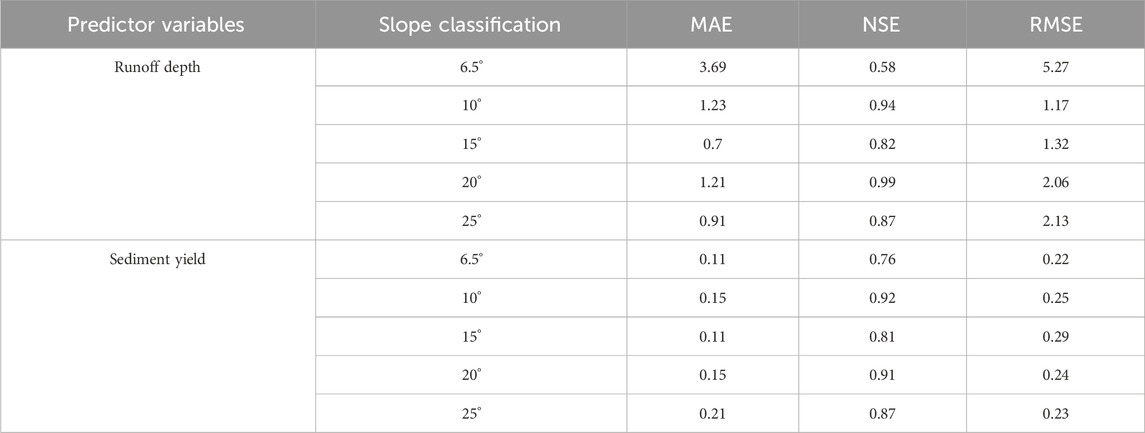
Table 3. Prediction evaluation of random forest model for hillslope runoff depth and sediment yield under different rainfall patterns.
Based on the model we developed, the feature importance scores from the Random Forest model were used in this study to identify the contributions of various rainfall factors and slope conditions to runoff depth and sediment yield. Rainfall characteristics are the main driving factors of runoff and erosion (Dos Santos et al., 2017). In this study, five rainfall factors were selected: rainfall duration (D), rainfall amount (P), maximum 30-min rainfall intensity (I30), average rainfall intensity (Im), and rainfall erosivity (F). Additionally, two compound rainfall factors were considered: the product of rainfall amount and average rainfall intensity (PIm), and the product of rainfall amount and maximum 30-min rainfall intensity (PI30), to comprehensively analyze the impact of rainfall on soil erosion. The importance of each factor on runoff depth (H) and sediment yield (S) was evaluated using the Random Forest (RF) algorithm (Zhu et al., 2020). For runoff generation, the number of decision trees for each slope was 380, 200, 400, 250, and 600; for sediment production, the number of decision trees for each slope was 500, 800, 400, 460, and 500. The number of split nodes for all models was set to 3.
As shown in Figure 5, PI30 has the highest importance for runoff generation, reaching a maximum of 40.85% at a slope of 5°, with P accounting for a large proportion, while I30 is less important and D has the lowest impact on runoff generation (2%). P has the greatest impact on sediment yield, reaching 41.87% at a slope of 20°. The importance of Im and I30 for sediment yield is as low as 5% and 3%, respectively, at their lowest. It can be concluded that P is the primary factor affecting runoff and sediment yield on slopes, and Type A rainfall with high rainfall and low intensity has the greatest erosive impact on corn slopes, which is consistent with previous findings.
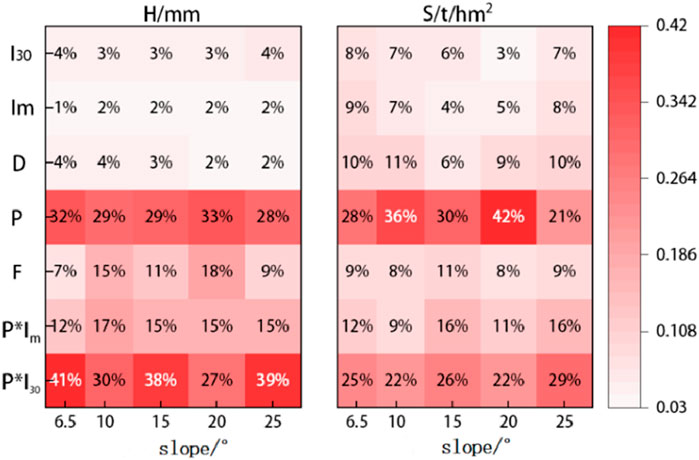
Figure 5. Rainfall factor to H, S importance score.
3.2.2 The influence of rainfall on slope runoff depth and erosion sediment yield
The Random Forest calculation results show that P has a significant influence on H and S. Under different rainfall types, the effect of P on H and S shows a linear increasing trend (Figure 6). Linear fitting results indicate that the slope of H with increasing P is 0.23, 0.22, and 0.33 for Type A, B, and C rainfalls, respectively, while the slope of S with increasing P is 0.08, 0.04, and 0.1, respectively. The results indicate that the erosive effect of rainfall on purple soil slopes varies across the three rainfall types. Based on the overall trend and fitting results, the order is Type C > Type A > Type B.

Figure 6. The relationship between P and H and S, (a) The impact of rainfall on slope runoff for different types of rainfall; (b) The effect of rainfall of different rainfall types on slope erosion and sediment yield.
3.2.3 The impact of maximum 30 min rainfall intensity on slope runoff depth and erosion sediment yield
As shown in Figure 7, there is a clear correlation between I30 and H, S. As I30 increases, a breakpoint is observed in the relationship for all three rainfall types. Before I30 reaches 17.3 mm/h and 23.4 mm/h, H and S increase slowly with I30, and the slope of the fitted line is close to zero. After I30 exceeds 17.3 mm/h and 23.4 mm/h, H and S increase rapidly, with a noticeable rise in the slope of the fitted line. To further confirm these critical points of I30, the Mann-Kendall test was used to evaluate the significance of the changes in slope. This test is particularly useful for detecting monotonic trends and was applied here to assess whether the slopes of H and S with increasing I30 are significantly different across the three rainfall types. The Mann-Kendall test identified the intersection points for runoff and sediment yield at 17.3 mm/h and 23.4 mm/h, respectively. Furthermore, to evaluate whether the slopes were significantly different, the confidence intervals for the slopes of H and S with increasing I30 for each rainfall type were compared. The slopes of H with increasing I30 for Type A, B, and C rainfall were 1.91, 0.32, and 0.064 mm, respectively, while the slopes of S with increasing I30 were 0.13, 0.036, and 0.004 t/km2, respectively. If the confidence intervals for two slopes did not overlap, it was concluded that the slopes were significantly different. Based on this analysis, the impact of I30 on runoff and sediment yield follows the order: Type A > Type B > Type C.
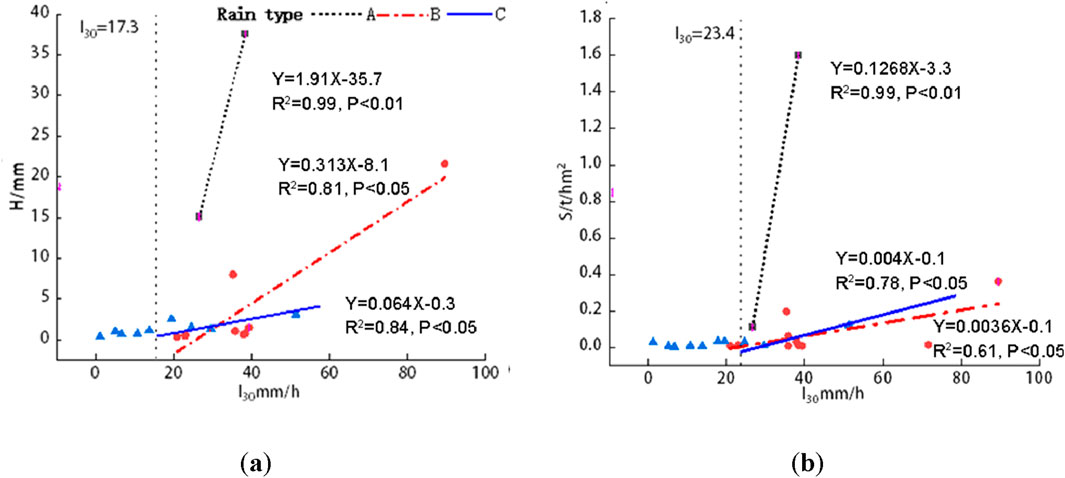
Figure 7. The relationship between I30 and H and S, (a) The effect of maximum 30 minute rainfall intensity on slope runoff depth under different rainfall types; (b) The effect of maximum 30 minute rainfall intensity on slope erosion and sediment yield under different rainfall types.
3.3 The impact of rainfall and slope on runoff and sediment production on slope surfaces
3.3.1 The influence of different rainfall types on slope runoff and sediment yield
Slope has a significant effect on soil erosion on purple soil slopes (Yang et al., 2023). The relation-ship between runoff depth, sediment yield, slope, and rainfall in the study area is shown in Figure 8.
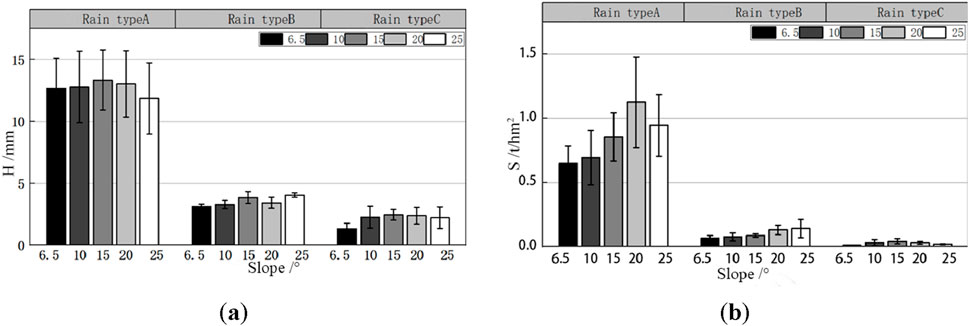
Figure 8. Characteristics of H and S under different rain patterns and slopes, (a) The influence of different rainfall patterns on slope runoff depth at different slopes; (b) The impact of different rainfall patterns on slope erosion and sediment yield at different slopes.
With changes in slope, the variation pattern of runoff depth on the slopes of runoff plots shows certain differences. Under Type A rainfall, H increases with the slope initially, reaches a peak at a slope of 15°, and then gradually decreases, forming a convex shape. Under Type B rainfall, H peaks at 15°, then decreases, and rises back to the peak at 25°. Based on Figure 9, this occurs because, under low rainfall, the influence of slope and rainfall on runoff generation is similar, causing fluctuations in runoff at 25°. Under the influence of Type C rainfall, the trend of H increasing with slope is similar to that under Type A rainfall, peaking at 15° with an increase of 8.57%, and then gradually decreasing.

Figure 9. Under different slope changes, (a) The effect of rainfall on slope runoff depth; (b) The effect of maximum 30 minute rainfall intensity on slope runoff depth; (c) The effect of rainfall on slope sediment yield; (d) The effect of maximum 30 minute rainfall intensity on slope sediment yield.
The variation pattern of S with slope differs under each rainfall type, but overall, it shows an initial increase followed by a decrease as the slope increases. Under Type A rainfall, S increases with the slope and reaches a peak at 20°. Under Type B rainfall, S continues to increase with the slope, reaching its maximum at 25°. Under Type C rainfall, the erosion amount peaks at a slope of 15°, with an increase of 37.95%, and then gradually decreases, forming a convex shape.
3.3.2 The influence of slope and important rainfall factors on slope runoff depth and erosion sediment yield
As shown in Figure 9, when rainfall is between 45.1 and 54.2 mm, the impact of rainfall on runoff generation increases significantly, with the maximum growth rate reaching 97.8%, and the influence of slope on runoff also increases simultaneously. When rainfall is between 54.2 and 102 mm, the influence of rainfall begins to decrease, while the influence of slope on runoff increases rapidly and reaches its maximum. At 100–185.8 mm, the effects of both rainfall and slope on runoff generation begin to decrease. When I30 is between 20.95 and 71.62, the impact of I30 and slope on runoff generation is minimal, but beyond this range, the influence increases significantly, with the maximum growth rates reaching 136.52% and 1498.14%, respectively. The larger the I30, the greater the impact of slope on sediment yield.
When rainfall is between 17.4 and 52.7 mm, the impact of rainfall and slope on sediment yield is relatively small. Between 52.7 and 54.2 mm, the impact of slope on sediment yield starts to increase and continues to rise, becoming significant when rainfall reaches 102 mm, and peaking at 185.5 mm. When the I30 value exceeds the critical threshold, the impact of slope on sediment yield is considerable in the range of 17.7–51.4. When I30 reaches 89.5, the effect of slope on sediment yield decreases significantly, while the effect of I30 on sediment yield increases substantially.
4 Discussion
The main goal of this research is to utilize machine learning methods to investigate the effects of different rainfall types and slope conditions on hillslope runoff and sediment yield. By employing techniques such as the K-means clustering algorithm for rainfall classification and the Random Forest algorithm for impact assessment, this study aims to provide a comprehensive analysis of how rainfall characteristics and slope interact to in-fluence soil erosion processes in purple soil hilly areas. This approach not only addresses existing gaps in the literature regarding the complex interactions between these factors but also offers valuable insights for effective soil erosion control and management strategies.
According to this study, Type A rainfall is characterized by low frequency, long duration, high rainfall amount, and low rainfall intensity. Despite the low intensity, its large rainfall amount and extended duration result in higher soil erosion intensity. Type B rainfall, with high frequency, short duration, small rainfall amount, and high intensity, has a moderate erosion effect on soil and should be a priority for soil and water conservation measures. Type C rainfall has a duration and rainfall amount between those of Type A and Type B, and its impact on soil erosion is the smallest. The erosion capacity of these rainfall events is ranked as: Type A > Type B ≥ Type C. This result emphasizes that there are differences in the impact of different types of rainfall on soil erosion. From this perspective, rainfall is an important factor in predicting or indicating the degree of soil erosion in the research area. Other previous studies have also confirmed that rainfall plays a crucial role in the process of soil erosion (Berndtsson and Larson, 1987; Dunne et al., 1991; Fang et al., 2012).
It is noteworthy that the sediment yield caused by B rainfall type is at a moderate level, but as the main rainfall type in the study area, characterized by short-duration heavy rainfall, its impact on soil erosion cannot be underestimated. Previous studies have shown that rainfall intensity is closely related to soil erosion. Cao et al. (Cao et al., 2020) have pointed out that rainfall intensity has a significant impact on surface soil erosion. During the interaction process between rainfall and the soil surface, high-intensity rainfall facilitates the formation of surface crusting and sealing, which can reduce infiltration and increase surface runoff (Vandervaere et al., 1997). The development of surface sealing promotes soil erosion because it increases sediment transport by accelerating surface flow (Assouline, 2004). The research results differ from those of the indoor simulated rainfall experiments (Geng et al., 2010). The study found that the canopy of corn plants can effectively buffer the kinetic energy of rainfall, reducing its ability to convert into erosive energy. As a result, rainfall mainly turns into stemflow and throughfall, which have less erosive energy, thereby mitigating soil erosion (Shou et al., 2016). However, the tall stalks of corn plants also have negative effects. Raindrops regain erosive energy at the edges and tips of corn leaves, intensifying splash erosion under the canopy and in-creasing the turbulence of slope runoff (Ma et al., 2015).
The influence of rainfall factors varies across plots with different slopes. For example, as the slope increases from 20° to 25°, the influence of P on runoff and sediment yield de-creases to 28.47% and 21.32%, while PI30 increases to 39.23% and 29.48%. The main rea-son is that the rainfall-receiving area of the 25° slope decreases, reducing the amount of rainfall on the slope, which causes the influence of I30 and Im on runoff to increase rap-idly. This result is consistent with the study by Chen et al. (2022), which found that under fixed conditions of terrain height and rainfall intensity, the total amount of slope runoff continuously decreases with an increase in slope gradient.
Overall, rainfall amount and compound rainfall factors have a significant impact on runoff and sediment yield, consistent with the statistical analysis results of other scholars on the relationship between rainfall characteristics and sediment yield (Foster et al., 1982; Zhang et al., 2021). As the slope increases, the importance of I30, average rainfall intensity, and duration decreases, but their importance gradually increases again beyond 20°. In general, most factors show significant changes in importance around a slope of 20°, indicating the presence of a critical slope at approximately 20° (Hu and Jin, 1999).
The importance of slope for runoff generation under each rainfall type is ranked as follows: Type B > Type C > Type A. For sediment yield, the effect of slope change is ranked as Type C > Type A > Type B across the three rainfall types. Under different rainfall types, H reaches its peak at a slope of 15°, while sediment yield peaks between 20° and 25°, de-pending on the rainfall type. This may be related to the critical slope in the erosion process (Jin, 1995). Figure 8 confirms that slope significantly influences runoff generation across the three rainfall types, and the peak runoff depth at corresponding slopes further validates the existence of a critical slope effect. The influence of slope on runoff generation first in-creases and then decreases with increasing rainfall, while it increases with I30 after reaching the critical values. The impact of slope on sediment yield also shows a trend of first increasing and then decreasing with rising I30, which is similar to the conclusion of Geng et al. (2010). The influence gradually increases as rainfall increases.
Although this study effectively analyzes the impact of rainfall and slope on surface runoff and sediment transport, we also recognize that erosive rainfall and sediment transport are complex processes influenced by multiple interacting factors, including soil properties, land use, vegetation cover, and other climatic variables. Therefore, this study simplifies erosive rainfall into three types (Type A, Type B, and Type C rainfall), without considering the potential interactions between these factors or the broader climatic context. For example, soil permeability, soil moisture content, and land use patterns can all significantly affect surface runoff and sediment processes, yet these factors were not individually considered in this study. Although we effectively classified rainfall types using the K-means clustering algorithm, the simplicity of this method may not have captured the complex nonlinear relationships between rainfall variables, especially the interactions between rainfall amount, duration, and intensity. Thus, the K-means clustering method may, in some cases, limit the accuracy of rainfall type classification. To improve classification accuracy, future research could consider using more advanced clustering methods, such as spectral clustering or deep learning models, which are better equipped to capture nonlinear relationships and patterns within rainfall data. Finally, this study primarily focuses on surface runoff and sediment transport processes in the purple soil hilly region. The applicability of the results and conclusions may be limited in other geographical are-as or under different soil types. Therefore, we recommend that future work incorporate field data from different regions to conduct broader validation and expansion studies, providing more comprehensive soil and water conservation management recommendations.
5 Conclusion
1) In the southwestern purple soil hilly region, erosive rainfall can be classified into three types: Type A (long duration, large rainfall, moderate intensity), Type B (short duration, high intensity, small rainfall), and Type C (moderate duration and rainfall, moderate intensity). Type B rainfall occurs frequently and with high intensity, contributing the most to slope erosion, while Type A rainfall significantly impacts slope erosion, despite its lower frequency. Type C rainfall has a relatively small effect on slope erosion.
2) Rainfall amount is the primary factor affecting slope water and sediment dis-charge, and the composite rainfall factor PI30 plays the most important role in runoff and sediment production. Under different rainfall types, the influence of rainfall amount on runoff depth and sediment discharge is as follows: Type C > Type A > Type B. With in-creasing slope, the impact of rainfall characteristics on water and sediment shows an initial increase followed by a decrease.
3) Slope significantly affects the water and sediment discharge of purple soil slopes. Under different rainfall types, the impact of slope on runoff and sediment varies, but generally shows an increasing-then-decreasing trend. The influence of slope on water and sediment is strongest under Type B rainfall, while the impact on sediment discharge is most significant under Type C rainfall.
Developing a model to explain the complexity and abrupt variations in observed trends remains an important challenge, but the current research has provided substantial insights into the relationship between rainfall characteristics and slope response. While numerous unanswered questions persist in this field, the findings significantly advance our understanding of these complex interactions.
The significance of this study lies in revealing the impact of rainfall and slope on slope water and sediment processes, particularly providing scientific support for soil and water conservation management and ecological protection. The findings can offer decision-making assistance to urban planners, land use managers, and hydrological designers, helping them develop more effective soil and water conservation measures, reduce soil erosion, and promote regional sustainable development.
Data availability statement
The data used in this paper is not publicly accessible at this time, as they are classified as government confidential data. Therefore, the authors do not have the right to disclose them.
Author contributions
NZ: Writing – original draft, Writing – review and editing. ZX: Conceptualization, Supervision, Writing – review and editing. PL: Conceptualization, Funding acquisition, Project administration, Supervision, Writing – review and editing. QC: Supervision, Writing – review and editing. GK: Writing – review and editing. FY: Writing – review and editing. YX: Visualization, Writing – review and editing. TW: Project administration, Writing – review and editing.
Funding
The author(s) declare that financial support was received for the research and/or publication of this article. This research was supported by the National Natural Science Foundation of China (Grant No. U2243201) and Natural Science Foundations of Shaanxi Province (Grant No. 2023-ZDLSF-65).
Conflict of interest
Authors NZ, ZX, and FY were employed by Power China Northwest Engineering Corporation Limited.
The remaining authors declare that the research was conducted in the absence of any commercial or financial relationships that could be construed as a potential conflict of interest.
Generative AI statement
The author(s) declare that no Generative AI was used in the creation of this manuscript.
Publisher’s note
All claims expressed in this article are solely those of the authors and do not necessarily represent those of their affiliated organizations, or those of the publisher, the editors and the reviewers. Any product that may be evaluated in this article, or claim that may be made by its manufacturer, is not guaranteed or endorsed by the publisher.
References
Abdollahi, A., Li, D., Deng, J., and Amini, A. (2024). An explainable artificial-intelligence-aided safety factor prediction of road embankments. Eng. Appl. Artif. Intell. 136, 108854. doi:10.1016/j.engappai.2024.108854
Admas, B. F., Gashaw, T., Adem, A. A., Worqlul, A. W., Dile, Y. T., and Molla, E. (2022). Identification of soil erosion hot-spot areas for prioritization of conservation measures using the swat model in ribb watershed, Ethiopia. Resour. Env. Sustain. 8, 100059. doi:10.1016/j.resenv.2022.100059
Ahmed, I. A., Talukdar, S., Baig, M. R. I., Shahfahad, M., Ramana, G. V., and Rahman, A. (2024). Quantifying soil erosion and influential factors in guwahati's urban watershed using statistical analysis, machine and deep learning. Remote Sens. Appl. 33, 101088. doi:10.1016/j.rsase.2023.101088
Assouline, S. (2004). Rainfall-induced soil surface sealing: a critical review of observations, conceptual models, and solutions. Vadose Zone J. 3 (2), 570–591. doi:10.2136/vzj2004.0570
Berndtsson, R., and Larson, M. (1987). Spatial variability of infiltration in a semi-arid environment. J. Hydrol. 90 (1), 117–133. doi:10.1016/0022-1694(87)90175-2
Cao, L., Wang, S., Peng, T., Cheng, Q., Zhang, L., Zhang, Z., et al. (2020). Monitoring of suspended sediment load and transport in an agroforestry watershed on a karst plateau, southwest China. Agric. Ecosyst. & Environ. 299, 106976. doi:10.1016/j.agee.2020.106976
Chen, Q., Wang, T., Li, Z., Zhang, J., Li, P., and Li, B. (2024). Research on water and sand prediction model of purple soil slope based on machine learning. Acta Pedol. Sin. 61 (02), 424–433. doi:10.11766/trxb202207020361
Chen, T., Shu, J., Han, L., Tian, G., Yang, G., and Lv, J. (2022). Modeling the effects of topography and slope gradient of an artificially formed slope on runoff, sediment yield, water and soil loss of sandy soil. Catena 212, 106060. doi:10.1016/j.catena.2022.106060
Chen, Z., and Grasby, S. E. (2009). Impact of decadal and century-scale oscillations on hydroclimate trend analyses. J. Hydrol. 365 (1-2), 122–133. doi:10.1016/j.jhydrol.2008.11.031
Chu, L., Sun, T., Wang, T., Li, Z., and Cai, C. (2020). Temporal and spatial heterogeneity of soil erosion and a quantitative analysis of its determinants in the three gorges reservoir area, China. Int. J. Env. Res. Pub. He. 17 (22), 8486. doi:10.3390/ijerph17228486
Dos Santos, J. C. N., de Andrade, E. M., Medeiros, P. H. A., Guerreiro, M. J. S., and de Queiroz Palácio, H. A. (2017). Effect of rainfall characteristics on runoff and water erosion for different land uses in a tropical semiarid region. Water Resour. Manag. 31 (1), 173–185. doi:10.1007/s11269-016-1517-1
Dunne, T., Zhang, W., and Aubry, B. F. (1991). Effects of rainfall, vegetation, and microtopography on infiltration and runoff. Water Resour. Res. 27 (9), 2271–2285. doi:10.1029/91WR01585
Fang, N., Shi, Z., Li, L., Guo, Z., Liu, Q., and Ai, L. (2012). The effects of rainfall regimes and land use changes on runoff and soil loss in a small mountainous watershed. Catena 99, 1–8. doi:10.1016/j.catena.2012.07.004
Foster, G. R., Lombardi, F., and Moldenhauer, W. C. (1982). Evaluation of rainfall-runoff erosivity factors for individual storms. T. Asabe 25 (1), 124–129. doi:10.13031/2013.33490
Gao, J., Shi, C., Yang, J., Yue, H., Liu, Y., and Chen, B. (2023). Analysis of spatiotemporal heterogeneity and influencing factors of soil erosion in a typical erosion zone of the southern red soil region, China. Ecol. Indic. 154, 110590. doi:10.1016/j.ecolind.2023.110590
Geng, X., Zhen, F., and Liu, L. (2010). Effect of rainfall intensity and slope gradient on soil erosion process on purple soil hill slopes. J. Sediment. Res. (06), 48–53. doi:10.16239/j.cnki.0468-155x.2010.06.012
Guan, Z., Yin, Y., Zhang, X., and Chen, Y. (2024). Estimating flash flood disaster susceptibility based on K-means clusterinoand ensemble learning approaches. J. Appl. Sci. 42 (03), 388–404. doi:10.3969/j.issn.0255-8297.2024.03.002
Han, D., Deng, J., Gu, C., Mu, X., Gao, P., and Gao, J. (2021). Effect of shrub-grass vegetation coverage and slope gradient on runoff and sediment yield under simulated rainfall. Int. J. Sediment. Res. 36 (1), 29–37. doi:10.1016/j.ijsrc.2020.05.004
Hu, S., and Jin, C. (1999). The oretical analysis and experimental studyon the critical slope of erosion. Acta Geogr. Sin. (04), 61–70. doi:10.11821/xb199904007
Jia, H., Lei, A., Lei, J., Ye, M., and Zhao, J. (2007). Effects of hydrological processes on nitrogen loss in purple soil. Water Resour. Manag. 89 (1), 89–97. doi:10.1016/j.agwat.2006.12.013
Jin, C. (1995). A theoretical study on critical erosion slope gradient. Acta Geogr. Sin. (03), 234–239. doi:10.11821/xb199503005
Kendall, M. G. (1948). Rank correlation methods. J. Ins. Actuaries. 75 (1), 140–141. doi:10.1017/S0020268100013019
Li, H., Ren, B., Zhou, M., Ma, J., Jiang, N., and Wang, Y. (2020). The process of runoff and sediment production of precipitation of small watersheds in hilly area. Soil Water Conserv. Chn. (03), 40–43. doi:10.14123/j.cnki.swcc.2020.0064
Li, J., Liu, J., Wang, Z., Feng, Q., Meng, F., Wang, H., et al. (2024). Refined mapping and spatiotemporal evolution analysis of winter wheat in the Yellow River Delta using sentinel-2 and the random forest algorithm. J. Agr. Resour. Env., 1–15. doi:10.13254/j.jare.2024.0107
Liu, G., Wu, X., Zhao, L., Wu, T., Hu, G., Li, R., et al. (2021). Soil water content in permafrost regions exhibited smaller interannual changes than non-permafrost regions during 1986–2016 on the qinghai-Tibetan plateau. Catena 207, 105668. doi:10.1016/j.catena.2021.105668
Liu, H., Zhang, J., Chen, S., Dong, Y., Tian, J., and Lin, C. (2024). Effect of soil thickness on crop production and nitrogen loss in sloping land. Agric. Water Manag. 304, 109080. doi:10.1016/j.agwat.2024.109080
Liu, Z., Mo, S., Li, B., and Jiang, K. (2022). Erosion and sediment transport characteristics of different flood types in the typical small watershed in hilly region of cen-tral sichuan. Soil Water Conserv. chn. (11), 48–52. doi:10.14123/j.cnki.swcc.2022.0273
Ma, B., Li, Z., Ma, P., and Wu, F. (2015). Effects of maize plants on the redistribution of water under simulated rainfall conditions. Acta Ecol. Sin. 35 (02), 497–507. doi:10.5846/stxb201303240505
Ma, X., Zhen, J., Wang, W., Chen, X., Qin, W., Dan, Z., et al. (2017). Characteristics of the runoff and sediment yield of sloping farmland in the purple soil area under different rainfall patterns. J. Soil Water Conserv. 31 (02), 17–21. doi:10.13870/j.cnki.stbcxb.2017.02.004
Mann, H. B. (1945). Nonparametric tests against trend. Econ. J. Econ. Soc. 13 (3), 245–259. doi:10.2307/1907187
Mondal, A., Ghosh, S., and Ghosh, A. (2016). Robust global and local fuzzy energy based active contour for image segmentation. Appl. Soft Comput. 47, 191–215. doi:10.1016/j.asoc.2016.05.026
Nie, X., Chen, H., Niu, Z., Zhang, L., Liu, W., Xing, S., et al. (2022). Digital SOC mapping in croplands using agricultural activity factors derived from time-series data in western fujian. Int. J. Geog. Inf. Sci. 24 (09), 1835–1852. doi:10.12082/dqxxkx.2022.220015
Rao, W., Zhang, Q., Qian, Z., Liu, J., and Zhao, G. (2024). Microtopographic response of tilled loess slopes during stages of water erosion development. Catena 245, 108309. doi:10.1016/j.catena.2024.108309
Shou, W., Musa, A., Liu, Z., Qian, J., Niu, C., and Guo, Y. (2016). Rainfall partitioning characteristics of three typical sand-fixing shrubs in horqin sand land, north-eastern China. Hydrol. Res. 48 (2), 571–583. doi:10.2166/nh.2016.177
Sun, L., Cha, X., Huang, S., Li, S., Chen, S., Bai, Y., et al. (2018). Effects of different rainfall intensity on the slope erosion process in purple soil. J. Soil Water Conserv. 32 (05), 18–23. doi:10.13870/j.cnki.stbcxb.2018.05.003
Sun, L., Zhang, B., Yin, Z., Guo, H., Siddique, K. H. M., Wu, S., et al. (2022). Assessing the performance of conservation measures for controlling slope runoff and erosion using field scouring experiments. Agr. Water manage. 259, 107212. doi:10.1016/j.agwat.2021.107212
Tapas, M. R., Etheridge, R., Tran, T., Finlay, C. G., Peralta, A. L., Bell, N., et al. (2024). A methodological framework for assessing sea level rise impacts on nitrate loading in coastal agricultural watersheds using swat+: a case study of the tar-pamlico river basin, North Carolina, USA. Sci. Total Environ. 951, 175523. doi:10.1016/j.scitotenv.2024.175523
Vandervaere, J. P., Peugeot, C., Vauclin, M., Angulo Jaramillo, R., and Lebel, T. (1997). Estimating hydraulic conductivity of crusted soils using disc infiltrometers and minitensiometers. J. Hydrol. 188-189, 203–223. doi:10.1016/S0022-1694(96)03160-5
Wang, X., Chen, W., Huang, G., Tong, S., Xu, X., Nie, Y., et al. (2024). Characteristics of runoff and nitrogen, phosphorus, and carbon loss in sloping cultivated lands in the typical hilly mountainous region of the Upper Yangtze River Basin. J. Env. Eng. Technol. 14 (5), 1589–1598. doi:10.12153/i.issn.1674-991X.20230920
Xiao, H., Xiang, R., Yan, R., Xia, Z., Guo, P., Gao, F., et al. (2024). Evaluating the influences hedgerow on soil erosion and nitrogen loss of purple soil sloping farmland under simulated rainfall. Ecol. Indic. 158, 111438. doi:10.1016/j.ecolind.2023.111438
Yan, Y., Hu, Z., Wang, L., Jiang, J., Dai, Q., Gan, F., et al. (2024). Impact of extreme rainfall events on soil erosion on karst slopes: a study of hydrodynamic mechanisms. J. Hydrol. 638, 131532. doi:10.1016/j.jhydrol.2024.131532
Yan, Y., Jiang, Y., Guo, M., Zhang, X., Chen, Y., and Xu, J. (2023). Effects of grain-forage crop type and natural rainfall regime on sloped runoff and soil erosion in the mollisols region of northeast China. Catena 222, 106888. doi:10.1016/j.catena.2022.106888
Yang, F., Wang, N., Zheng, Z., Li, T., He, S., Zhang, X., et al. (2023). Effects of microtopography change driven by seepage and slope gradients on hillslope erosion of purple soil. Catena 231, 107353. doi:10.1016/j.catena.2023.107353
Yang, Q., Xu, X., Tang, Q., and Jia, G. (2025). The spatiotemporal variations of global rainfall erosivity and erosive rainfall event based on half-hourly satellite rainfall data. Catena 252, 108831. doi:10.1016/j.catena.2025.108831
Zhang, J., Wang, J., Cheng, X., and Chen, J. (2021). Effects of rainfall on slope runoff and sediment yield under different crop measures in the jiangzi river minor watershed. J. Soil Water Conserv. 35 (02), 8–14. doi:10.13870/j.cnki.stbcxb.2021.02.002
Zhang, L., Gao, F., Liu, D., Wang, L., Xiang, R., Ye, C., et al. (2023). Estimating sheet erosion on purple soil hillslope treated with polyacrylamide (pam) in the three gorges reservoir area. J. Hydrol-Reg. Stud. 49, 101510. doi:10.1016/j.ejrh.2023.101510
Zhang, X., He, X., Wen, A., Walling, D. E., Feng, M., and Zou, X. (2004). Study on the dual isotope method of 137Cs and 210Pb for sediment sources in small watersheds in the hilly area of central Sichuan. Chn. Sci. Bull. 49 (15), 1537–1541. doi:10.1360/csb2004-49-15-1537
Zhang, X., Zhang, S., Zhang, F., Li, H., Shi, J., and Chen, J. (2025). Quantifying the effects of the soil erosion factors on water-eroded slopes. Catena 249, 108678. doi:10.1016/j.catena.2024.108678
Zhao, Q., Ye, C., and Lu, Y. (2022). A micro-motion feature lmportance evaluation algorithm based on random forest. Mod. Def. Technol. 50 (04), 124–131. doi:10.3969/j.issn.1009-086x.2022.04.014
Keywords: purple soil, random forest, clustering algorithm, slope scale, soil erosion
Citation: Zhang N, Xia Z, Li P, Chen Q, Ke G, Yue F, Xu Y and Wang T (2025) The impact of rainfall and slope on hillslope runoff and erosion depending on machine learning. Front. Environ. Sci. 13:1580149. doi: 10.3389/fenvs.2025.1580149
Received: 20 February 2025; Accepted: 08 April 2025;
Published: 24 April 2025.
Edited by:
Xudong Peng, Guizhou University, ChinaReviewed by:
Bingbing Zhu, Shaanxi Normal University, ChinaNan ShenChinese Academy of Sciences (CAS), China
Copyright © 2025 Zhang, Xia, Li, Chen, Ke, Yue, Xu and Wang. This is an open-access article distributed under the terms of the Creative Commons Attribution License (CC BY). The use, distribution or reproduction in other forums is permitted, provided the original author(s) and the copyright owner(s) are credited and that the original publication in this journal is cited, in accordance with accepted academic practice. No use, distribution or reproduction is permitted which does not comply with these terms.
*Correspondence: Peng Li, bGlwZW5nNzRAMTYzLmNvbQ==