 Xiaoli Zhou
 Ruotong Wang
 Mingyang Han
- College of Management, Minzu University of China, Beijing, China
Enhancing data elements to support environmental governance is a key initiative for promoting digital transformation and ecological development. This study constructs a quasi-natural experiment based on panel data of Chinese cities from 2010 to 2021, using the staggered rollout of open government data (OGD) platforms to evaluate their impact on air pollution (AP) and the underlying mechanisms. The results show that OGD significantly reduces annual average PM2.5 concentrations by approximately 1.55 units (p < 0.01), indicating a notable improvement in air quality. Mechanism analysis suggests that government data disclosure affects AP through three pathways: enhancing environmental regulation, stimulating green innovation, and optimizing industrial structure. A one-unit increase in these mediating variables reduces PM2.5 by approximately 0.02, 15.3, and 11.75 units, respectively (all p < 0.01). In addition, market size and market openness positively moderate the environmental effect of OGD. Heterogeneity analysis reveals regional variation. In Western China, OGD reduces PM2.5 by about 5.61 units (p < 0.01); in Eastern China, the reduction is 1.11 units (p < 0.05), while the effect is not significant in Central China. In the Yangtze River Economic Zone, OGD leads to a reduction of 1.42 units (p < 0.01), and 1.3 units (p < 0.01) in the non-Yangtze region. These findings provide theoretical and empirical support for improving open data policies and leveraging data elements in environmental governance.
1 Introduction
The ecological construction is an important cornerstone of sustainable development and a basic path to achieving harmonious coexistence between human beings and nature. In recent years, with the rapid development of big data, artificial intelligence, the Internet of Things, and other technologies, the public governance paradigm has realized a magnificent transformation, and the digital governance theory has increasingly gained prominence in public management scholarship. Digital governance theory emphasizes digital technology and public sector reform, and proposes to combine information systems with social governance (Wang et al., 2023). Digital technology provides a platform for governments and societies to understand each other, enabling governments and civil societies to act in concert with consistent goals and facilitating the formulation and implementation of relevant policy rules (Castro and Lopes, 2022). Data openness, as one such platform medium, can not only accelerate the integration of data elements into the production process and become a key driver of economic growth but also promote environmental protection and improve the effectiveness of ecological governance (Goldfarb and Tucker, 2019; Mahajan et al., 2021). Especially in the field of air pollution (AP), where governance is highly complex and dynamic, the data-driven governance model has emerged as a benchmark for effective policy implementation (Zhang et al., 2024).
In the current digital age, the potential of data as a factor of production has made it crucial (Oliveira et al., 2023). Existing studies focusing on comprehensive big data pilot zones have offered important guidance for understanding the environmental implications of data-driven policies (Lin, 2024; Shen et al., 2024). In contrast, open government data (OGD), as a key component of digital governance, emphasizes the practical implementation of data governance and ensures the accessibility of public data across diverse social actors. Therefore, assessing the impact of OGD on environmental governance from the perspective of data openness not only complements prior research but also contributes to a more holistic understanding of the role of data-driven approaches in advancing ecological civilization. OGD refers to the provision of necessary data by the government to society at no cost, which are unclassified data derived from public operations and are not subject to privacy restrictions (Janssen et al., 2012). To date, although no studies have directly examined the relationship between OGD and environmental governance, a growing body of research has produced in-depth theoretical and empirical work in areas closely related to OGD. Existing studies confirm that factors such as information disclosure, government attention, public participation, and digital technology all have positive effects on promoting environmental protection (Feng and He, 2020; Li et al., 2020; Zhou and Ding, 2023; Lin and Zhang, 2023). For instance, environmental information disclosure helps reduce carbon emissions and lowers pollutant concentrations (Shi et al., 2021; Tian et al., 2016); increased government environmental attention contributes to lowering regional emissions and enhancing air quality (Liu et al., 2023; Bao and Liu, 2022); and public participation in the environment has shifted from a formal to a substantive approach to environmental protection, which is significant in improving environmental governance (Tu et al., 2019; Zhang et al., 2019); digital technology can optimize industrial structure and promote the use of clean energy to reduce pollution emissions (Zeng and Yang, 2023). Without exception, these factors are all related to OGD, which is fundamentally driven by digital technology and aims to activate the ability of data resources to circulate in the market and further attract broad participation from society. Moreover, the opening up of environmental information datasets represents a further focus on government oversight and attention to the environment, increasing the tendency of companies to avoid polluting emissions. In this process, OGD demonstrates its potential ability to optimize environmental governance and its advantageous effects. There is a growing body of research evaluating the effects of OGD, with a primary focus on its internal processes, data quality, and institutional limitations (Parycek et al., 2014; Nikiforova and McBride, 2021; Wang and Shepherd, 2020). However, these studies tend to concentrate on the procedural aspects of data disclosure, while largely overlooking the broader economic and social implications of OGD. In particular, there is a notable lack of empirical research examining how the development and use of data elements affect ambient air quality. So, can OGD actually improve the effectiveness of environmental governance, especially ambient air quality? This question has a solid foundation at the level of theoretical analysis and construction, which requires empirical validation through rigorous scientific methods. In addition, research on OGD is mainly focused on North America and Europe (more than 65%), and there is a lack of research on Asia, especially China. Moreover, scholars tend to use qualitative methods (77.45%) and lack quantitative analysis and experimental research (Tai, 2021). Building on these gaps, this study adopts OGD as an analytical lens and constructs a quasi-natural experimental setting based on the launch of OGD platforms across Chinese cities. Using panel data from 2010 to 2021, it examines the impact of OGD on AP, investigates the underlying mechanisms that enhance pollution control effectiveness, and explores the broader ecological value of OGD at the macro level.
Compared with previous studies, this paper makes several potential marginal contributions: (1) It constitutes one of the first empirical efforts to evaluate the policy effects of OGD in the field of environmental governance, establishing a link between OGD initiatives and AP control, and providing exploratory evidence on the environmental value of data-driven governance. (2) It employs rigorous empirical identification strategies to assess the causal effects of OGD, thereby shedding light on its policy advantages and addressing existing theoretical gaps. (3) It further analyzes the underlying mechanisms and regional heterogeneity associated with OGD impacts, offering policy-relevant insights to improve data governance and promote ecological protection across different local contexts.
2 Institutional background and hypothesis
2.1 Institutional background
In 2012, Shanghai, China, took the lead in launching the trial operation of the Government Data Service Network, and Beijing launched the test of the Government Data Service Network in the same year. Subsequently, local governments in Tianjin and Guangdong launched OGD platforms to share public data and improve data utilization efficiency. China has also launched a series of policy measures to promote the OGD to society. For example, in 2017, General Office of the State Council issued the Implementation Plan for the Integration and Sharing of Government Information Systems, stating that a unified, standardized, interconnected, secure, and controllable data open website should be constructed relying on the national e-government extranet and the central government portal.
According to the China Local Government Data Openness Report, as of October 2020, 66% of China’s provincial-level administrative divisions (excluding Hong Kong, Macao, and Taiwan), 73% of sub-provincial-level jurisdictions, and 35% of prefecture-level governments had launched OGD platforms. Based on city-level statistics—including municipalities, provincial capitals, and prefecture-level cities—the total number of participating cities reached 138 (Figure 1). Among the various sectors represented on the platform, datasets related to resources, the environment, and ecological protection exhibit a medium to high degree of openness. Notably, environmental monitoring and impact assessment data are identified as standard datasets in official reports.
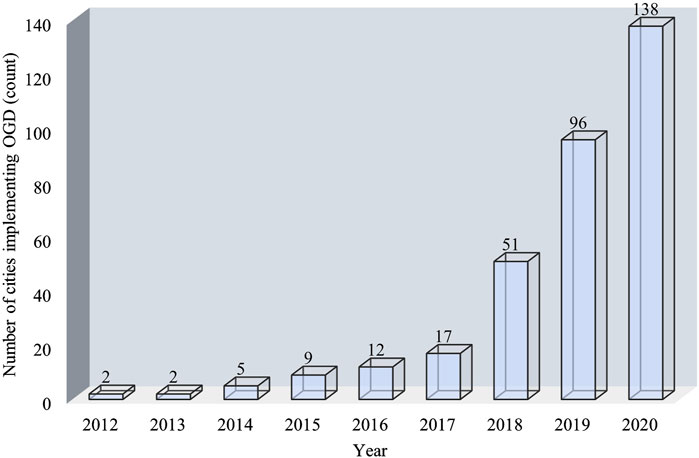
Figure 1. Number of cities implementing OGD (count).
As the relevant policy continue to promote and land, the progressive OGD platform online in various places provides a good experimental opportunity to carry out empirical assessment. Based on the multi-temporal characteristics of the platform launch, this paper intends to utilize the staggered difference-in-differences (DID) method to assess the actual effect of OGD by taking PM2.5 concentration as the object of examination of the effect of AP in ecological environment protection. Before carrying out the empirical test, this paper draws a time trend graph to generally show the annual average PM2.5 concentration trends of regions that are online with the OGD platform at different time points and regions that are not online, and compares them at the macro level (Figure 2).
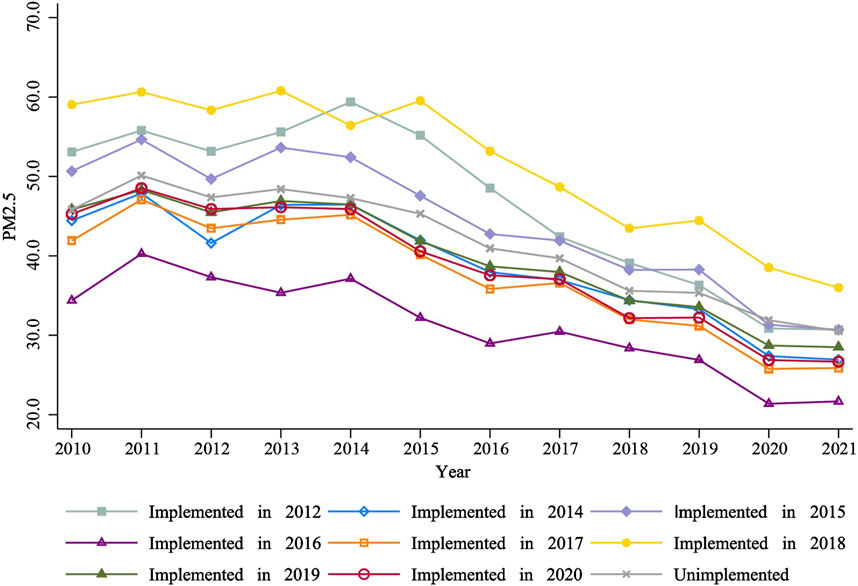
Figure 2. Temporal trend of annual mean PM2.5 concentration.
The average PM2.5 concentrations show a decreasing trend in longitudinal time. Although PM2.5 concentrations in some reformed areas were initially higher than those in non-reformed areas, a significant divergence in their reduction trajectories emerged as the reform advanced. Specifically, reformed areas experienced a markedly faster decline in PM2.5 levels compared to non-reformed areas. Before the platform online node, the changing trend of PM2.5 in the two types of areas basically remains the same, while after the node, the declining trend of PM2.5 in the reformed areas accelerates significantly. Therefore, from the results presented in Figure 2, there is indeed a specific improvement effect on AP management by the online OGD platform.
2.2 Hypotheses
2.2.1 OGD and AP
The positive impacts of digital technology on AP have been widely acknowledged in the academic literature (Chen and Yan, 2020; Che and Wang, 2022). Applied to social governance, digital technology can also significantly enhance the ability of environmental regulation and pollution control, optimize the government’s approach to environmental governance, and improve the efficiency of air pollutant emissions (He et al., 2024; Ren et al., 2023). Established studies qualitatively focus on the concept, advantages, and future challenges of environmental information governance with the help of specific cases and generally agree that information governance has a decisive role in improving environmental governance (Tan and Eguavoen, 2017; Kloppenburg et al., 2022). OGD involves many types of datasets, such as social security, healthcare, ecological environment, etc. The purpose of opening up information and data in related fields is not only to provide information to the public but also to break the “black box” of social operation by releasing important databases that have not been transparent in the past, enabling multiple stakeholders to gain new insights from open data, and providing new opportunities for the country’s future development. Data allows multiple stakeholders to gain new insights and contribute to national governance activities (Hardy and Manrushat, 2017). In particular, environmental civil society organizations dedicated to climate and environmental protection frequently leverage open data to monitor government and corporate behavior, and serve as key platforms for facilitating citizen participation in environmental governance. Environmental governance often necessitates the construction of a multi-actor mechanism to support sustainable development. OGD can enhance interactions between civil society and government (Yang and Rho, 2007; Evans and Campos, 2013), while also fostering civic engagement in environmental governance initiatives. OGD involves the processes of big data collection, big data analysis, and big data visualization, all of which cannot be separated from the support and drive of digital technology. Compared with traditional on-site environmental enforcement, intelligent detection systems, sensors, and large-scale algorithms powered by digital technologies can more efficiently acquire, process, and analyze airborne environmental data. Through open data platforms, these technologies enable intelligent interaction and information sharing, thereby contributing to more accurate monitoring and regulation of environmental conditions, and ultimately enhancing the effectiveness of AP control (Shen and Zhang, 2024). Based on the above logical inference, the central hypothesis of this paper can be proposed:
H1: OGD can reduce AP.
2.2.2 Mechanisms of OGD impacts on AP
First of all, the data in OGD is derived from public operations and is inevitably applied to public operations. It is data that can be accessed, used, or shared by any individual. OGD breaks down the information barriers between the government and innovation subjects such as enterprises, research institutions, universities, etc., so that innovation resources can be allocated more efficiently, which in turn helps social subjects to exert their subjective initiative and actively innovate under the national ecological and environmental protection policy. At present, data elements have been widely applied to enterprise-level innovations, including product and service development, business model restructuring, and technological advancement (Bresciani et al., 2021). These applications significantly enhance firms’ green innovation capabilities and improve the overall efficiency of urban green innovation (Song et al., 2019). Moreover, extensive evidence has confirmed the positive impact of green innovation on environmental governance outcomes (Albort-Morant et al., 2018; Takal and Tooranloo, 2021). Second, open data enhances transparency and accountability in related areas (e.g., transportation, environment, public services, etc.) (Attard et al., 2015). The government’s use of datasets to track environmental information such as the state of natural resources, the extent of pollution, and waste collection, and to make this information available to society in the form of a platform has dramatically increased civil society’s awareness of environmental monitoring (Lim, 2021), which in turn has helped to improve the efficiency of environmental policy implementation and the quality of environmental regulation (Huong and Thanh, 2022). Improved environmental regulation is also bound to reduce pollution emissions from heavy industrial enterprises and optimize the efficiency of environmental pollutant emissions, including air pollutants (Zhang et al., 2021). Finally, OGD can also bring considerable economic benefits and provide innovative solutions for social development (Bakıcı et al., 2013). OGD holds substantial economic potential for both firms and individual users. It can offer new opportunities for social entrepreneurs, particularly those aiming to develop innovative products and services based on data provided by public sector organizations (Yang et al., 2020). In other words, the data factor-driven model facilitates the optimal allocation of production factors, fosters the emergence of new business service models and formats, promotes technological advancement and product innovation, and enables the provision of personalized and customized offerings (Stylos et al., 2021; Ladeira et al., 2024). These mechanisms collectively inject momentum into the development of the tertiary sector, thereby supporting industrial transformation and upgrading while contributing to the reduction of environmental pollution (Zhou et al., 2013; Zhao et al., 2022). In summary, the hypothesis is proposed:
H2-1: OGD can reduce AP by promoting green innovation.
H2-2: OGD can reduce AP by improving the quality of environmental regulation.
H2-3: OGD can reduce AP by optimizing industrial structure.
Another critical dimension of OGD lies in its capacity to empower citizens by reducing information asymmetry and enhancing government transparency (Attard et al., 2015). By opening up public data, OGD facilitates broader stakeholder participation, enabling citizens not only to provide feedback on government performance but also to take part in policy formulation processes. In other words, the OGD implies the cession of government power, which reduces the government’s own intervention and provides the society with greater freedom and capacity space to participate more in the governance of economic life. Neoclassical theory suggests that too much government intervention will distort markets, leading to inefficient resource allocation and possible corruption. Particularly in terms of environmental governance, Fredriksson and Svensson (2003) argue that as the world’s largest developing country, in the context of pursuing economic growth, local governments in China have greater administrative approval powers and are vulnerable to “regulatory capture” by high-polluting firms, which in turn can reap economic. This can lead to corruption and influence the formulation of regional environmental policies. Existing government policies, such as command-and-control regulation and tendentious technological inputs, can increase industrial SO2 emissions and aggravate environmental pollution (Liu et al., 2019). Therefore, freer and more expansive markets tend to generate greater demand for data and facilitate more efficient data utilization (Gandomi and Haider, 2015), thereby contributing to improved outcomes in environmental governance. Accordingly, the following hypotheses can be formulated:
H3-1: The expansion of market size can enhance the effect of OGD on AP.
H3-2: Increased levels of market openness can enhance the impact of OGD on AP.
3 Methodology
3.1 Empirical model
DID is one of the most widely used research tools in social science research. It is very clear, intuitive, and easy to operate, and thus popular among policy effect evaluators (Baker et al., 2022). Local data openness has strong local characteristics and does not involve datasets from other cities. Therefore, the scope of the effect of government data openness on PM2.5 is strictly limited to the policy implementation area, and it is difficult to affect PM2.5 in neighboring areas through mechanisms such as cross-regional collaboration, pollution diffusion, or information spillovers. Depending on whether the treatment occurs simultaneously or at varying time points across units, DID models can be classified into single-period and staggered (or multiple-period) designs. This paper employs the latter to accommodate the variation in policy timing across cities. In order to accurately test the environmental effects of OGD, the study focuses on cities and constructs policy dummy variables: individuals who have implemented OGD policies at the city level are regarded as the “experimental group”, and those who have not implemented OGD policies are regarded as the “control group”:
First, in Equation 1,
3.2 Variables
Explained variable. The explained variables used geographic mean PM2.5 concentration (μg/m3) to measure the AP status, which is one of the commonly used environmental indicators in related fields (Wang and Ogawa, 2015; Qi et al., 2022).
Explanatory variables. This paper takes OGD construct dummy variables as the explanatory variables of the study, the specific meaning of which has been described in detail above.
Control variables. Education plays a vital role in enhancing citizens’ environmental awareness and fostering scientific and technological innovation, both of which are essential for advancing a green economy (Ma and Zhu, 2022). Government capacity, as a key institutional determinant, not only influences the level of OGD implementation but also serves as a major driver of environmental intervention intensity. Technological change promotes the adoption of environmentally friendly practices and green technologies, thereby enhancing environmental protection capacity (Chen et al., 2024). In addition, foreign direct investment and the level of economic development are closely associated with environmental quality and are frequently adopted as control variables in empirical studies. Therefore, in order to improve the accuracy and credibility of the estimation results and reduce potential bias, this study draws on the measurement strategies of Liu and Lin (2019), Yu et al. (2019), and Gu et al. (2022), and incorporates five control variables into the DID model: education investment (Edu), government self-sufficiency (Gov), economic development level (GDPP), science and technology input (Sci), and foreign investment level (FDI). Specifically, education and science investment are measured by the proportion of corresponding expenditures in the general government budget. Government self-sufficiency is calculated as the ratio of local fiscal revenue to expenditure. Economic development is proxied by the logarithm of GDP per capita. Foreign investment is represented by the ratio of actual utilized foreign capital to regional GDP.
Mediating variable. The rationality and scientificity of green innovation, environmental regulation quality, and industrial structure optimization as the mediating mechanisms of OGD and AP are proposed in the theoretical foundation section. Referring to the research practices of Dong et al. (2023), Yang et al. (2018), and Gu and Chen (2020), green innovation is measured by the total number of green invention patent grants and applications, the quality of environmental regulation is based on the comprehensive utilization rate of general industrial solid waste and the optimization of industrial structure is selected as the measurement of the value added of the tertiary industry.
Moderating variable. Drawing on previous studies (e.g., Ho et al., 2013; Niroomand et al., 2014), we further examine the underlying mechanism between OGD and AP by incorporating market size (MSize) and market openness (MOpen) as moderating variables. Market size is measured as the logarithm of total retail sales of consumer goods, while market openness is proxied by the logarithm of actual foreign capital utilization. We then center the moderating variables to reduce potential multicollinearity in the interaction terms.
3.3 Data and sample
Following the principles of availability, validity, and consistency of data selection, the detailed scheme of data selection is as follows: the time data of OGD is derived from the China Local Open Government Data Report released by the Digital and Mobile Governance Laboratory of Fudan University, which is China’s first and currently the most authoritative assessment report on OGD. The PM2.5 data used in this study are sourced from the global dataset released by the Atmospheric Composition Analysis Group at Washington University in St. Louis. The raw gridded data were first spatially cropped to the boundary of China and then averaged across raster cells within each city. The resulting values represent geographic mean PM2.5 concentrations, expressed in micrograms per cubic meter (μg/m3). The data related to urban economic and social development were obtained from China Industrial Statistical Yearbook, China Statistical Yearbook, and China Urban Statistical Yearbook. After processing, this paper extracts from them the relevant panel data of all Chinese cities (excluding Hong Kong and Macao Special Administrative Regions and Taiwan Province) from 2010–2021. In order to ensure the scientific validity of the study, the raw data in this paper were processed as follows: (1) Cities with serious missing data were excluded, and those with less missing data were linearly interpolated. (2) The DID method needs to ensure that there are at least two observation periods, so cities that first implemented OGD in 2021 were deleted. (3) To avoid the adverse effects of extreme values, a 1% winsorization was applied to all continuous variables. Finally, we obtain a total of 235 city data, 2,820 samples.
The study presents descriptive statistics comparing cities that have implemented OGD with those that have not (Table 1). First, regarding the control variables, only slight differences are observed between the treatment and control groups in terms of economic development, government self-sufficiency, science and education expenditure, and foreign investment, with similar standard deviations, minimums, and maximums. Second, for the mediating and moderating variables, cities that have implemented OGD exhibit slightly higher values in the comprehensive utilization rate of general industrial solid waste, value-added of the tertiary industry, the number of green patent authorizations, as well as greater market openness and larger market size—likely reflecting policy-driven incentives. Third, the sample sizes of the treatment and control groups are relatively balanced and sufficiently large, ensuring robustness in estimation. Overall, the differences in key variables are minor and the groups are generally comparable, validating the use of the staggered DID strategy.
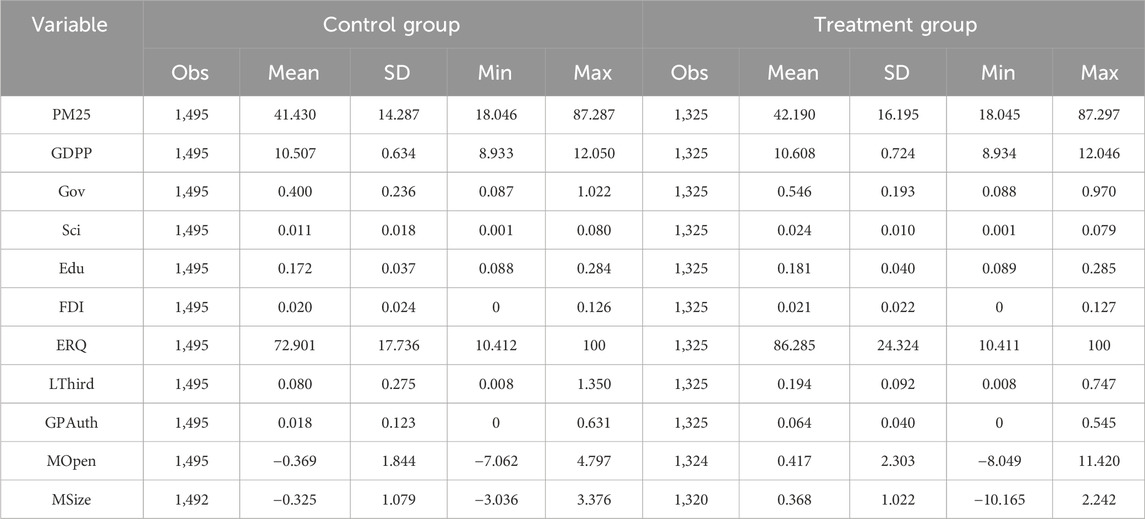
Table 1. Descriptive statistics.
4 Results and findings
4.1 Benchmark regression
In this paper, the environmental effects of OGD are evaluated by using staggered DID based on the introduction of city-fixed effects and time-fixed effects, and the results are shown in Table 2. First, the effects of explanatory variables on the explained variables are examined through Column (1) in Table 2, where the regression analysis directly uses the OGD shock with the annual average of PM2.5 concentration. It was found that the OGD led to a decrease of 1.566 units in PM2.5 concentration, which is significant at the 1% level. After that, control variables are added gradually in Column (2)-Column (6). Obviously, comparing Column (1) and Column (6), the absolute values of the coefficients of the core explanatory variables are relatively reduced, which indicates that the model absorbs some unobservable influences on the explanatory variables after adding control variables, and the model estimation results are more robust. With the gradual addition of control variables in the model, the coefficients and significance of OGD change less, indicating the robustness of the negative impact of OGD policy. Column (6) of Table 2 further controls for all city economic and social characteristics category variables on the basis of controlling for year and individual effects and finds that the coefficient of OGD is still significantly negative at the 1% level, resulting in a reduction of about 1.545 units in PM2.5 concentration. In conclusion, the benchmark regression results show that OGD helps to reduce PM2.5 concentration, optimize the AP control situation, and promote the improvement of regional air environment quality. Hypothesis H1 of this paper can be verified.
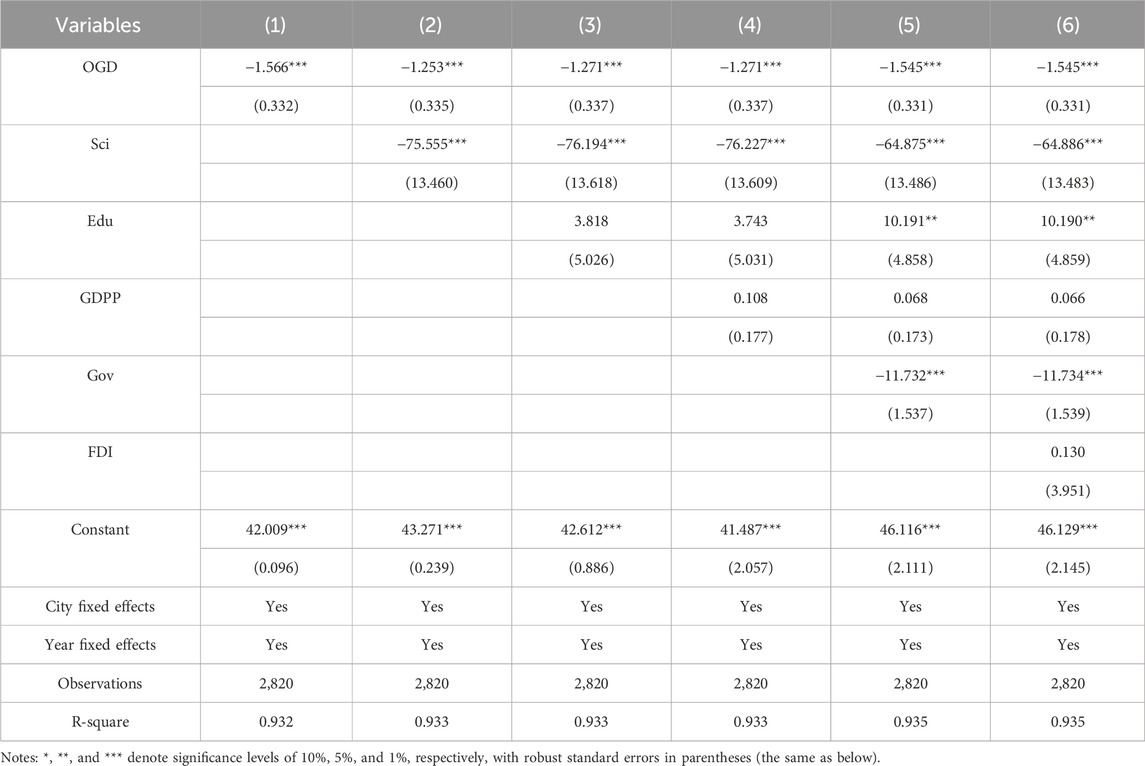
Table 2. Benchmark results.
4.2 Parallel trend test
Due to the long observation window and the staggered timing of policy implementation across cities, this study groups together the 5 years before and after the policy intervention. To further mitigate concerns regarding multicollinearity, the ex-ante period is set as the baseline, and the policy effects of OGD are estimated using the de-meaned staggered DID method proposed by Beck et al. (2010). The results are illustrated in Figure 3, with 95% confidence intervals. As shown in Figure 3, none of the coefficients in the pre-treatment periods are statistically significant, suggesting no systematic difference in AP trends between the treatment and control groups prior to the implementation of the policy. This finding supports the validity of the parallel trends assumption underlying the DID design. By contrast, the coefficients for the policy implementation year and the post-treatment periods are significantly negative, indicating that OGD has a suppressive effect on AP.
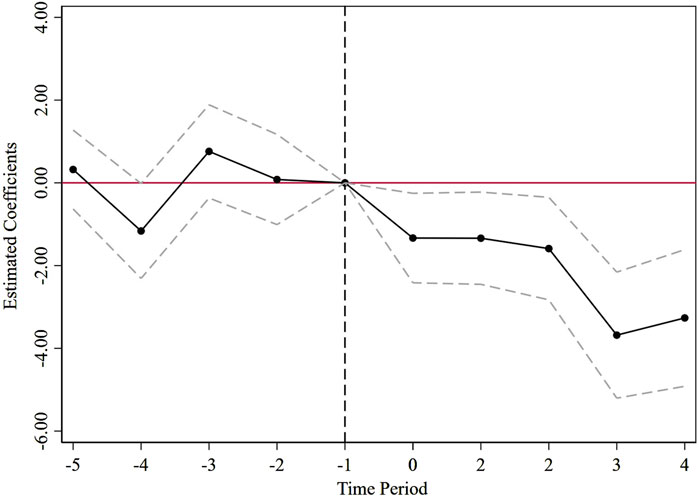
Figure 3. Parallel trend test.
4.3 Robustness check
4.3.1 Placebo test
Unlike the placebo test method for the classical DID model, for the staggered DID model, it is necessary to randomly generate both the experimental group dummy variable and the pseudo-policy shock dummy variable at the same time to randomize the interaction term formed by the two to simulate the estimation results under the null hypothesis. Afterward, the study reruns the simulated regression of the staggered DID model for each new variable generated. The simulated regression results generated after the above process were repeated 500 times, as shown in Figure 4. As illustrated in Figure 4, the estimated coefficients from the placebo simulations are mostly centered around zero, which deviates substantially from the actual estimate of −1.545. Additionally, the majority of these simulated coefficients have p-values exceeding 0.1, indicating they are statistically insignificant at the 10% level. Therefore, the baseline estimates of OGD policy effects are by no means obtained by chance, and the possibility that the baseline estimates are influenced by other policies or omitted variables can be basically ruled out.
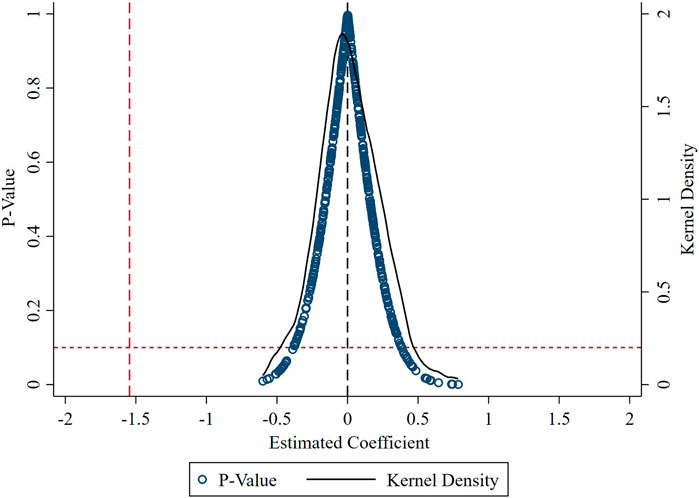
Figure 4. Placebo test.
4.3.2 PSM-DID
For the application of propensity score matching in DID modeling, the existing studies broadly follow two paths: one is to consider panel data as cross-sectional data and directly construct PSM for matching (Fan and Zhang, 2021), and the other is to refer to the period-by-period matching of Böckerman and Ilmakunnas (2009), where propensity score matching is carried out period-by-period at each time point to capture the differences between different time points. This study uses nearest neighbor matching to capture the changing characteristics of policy effects at different time points. In order to maximize the credibility and scientific validity of the study, this paper adopts the panel data transformation method and period-by-period matching method for propensity score matching. The specific steps of the panel data transformation method are as follows: Edu, Gov, GDPP, Sci, and FDI are set as covariates, the propensity scores of the treatment groups are estimated by logit regression model, and nearest-neighbor matching is performed according to the scores (Luo et al., 2023), the control group samples that meet the common support conditions with the cities implementing OGD are selected, and the samples that cannot support the standard conditions are eliminated. After that, we check whether the distribution of covariates is balanced after matching, analyze the matching effect, and re-estimate the effect of OGD policy on AP by using the staggered DID method, and the results are presented in Column (1) of Table 3. The specific steps of the year-by-year matching method are: also set Edu, Gov, GDPP, Sci, and FDI as covariates, match the urban samples year by year according to the year of the policy experiment, and check the balance of covariate distributions after matching in each year, to ensure that the differences in covariates between the treatment group and the control group are significantly reduced. Afterward, the matched data for each year are merged vertically into one dataset in order to perform a staggered DID test, the results of which are shown in Column (2) of Table 3.
Table 3. PSM-DID and adjusted sample.
Figures 5,6, display the kernel density plots of the treatment and control groups before and after matching, based on cross-sectional PSM and year-by-year PSM methods, respectively. In both cases, substantial deviation is observed between the two groups prior to matching, while post-matching curves exhibit closer alignment and reduced distance between mean lines. This indicates that both matching strategies effectively mitigate sample selection bias. Furthermore, the OGD coefficients reported in columns (1) and (2) of Table 3 remain significantly negative, consistent with the benchmark regression results presented in Table 2. These findings reinforce the robustness of the estimated treatment effects and suggest that OGD plays a significant role in enhancing AP control.
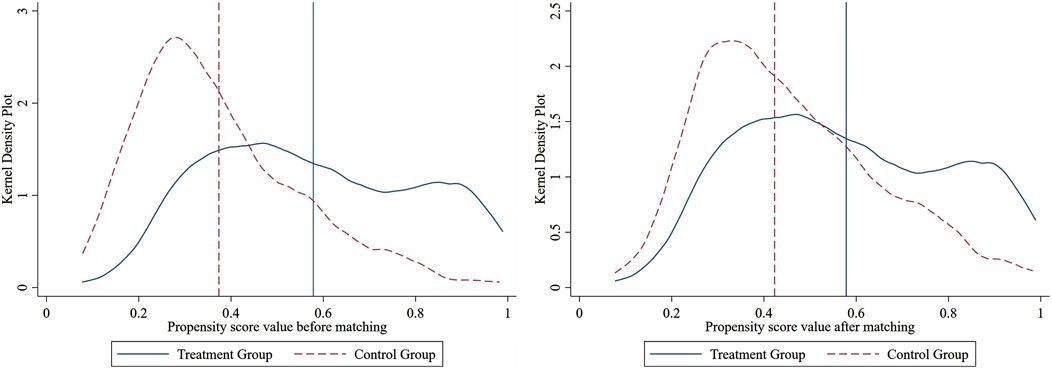
Figure 5. Kernel Density Plot before and after PSM of cross-sectional.
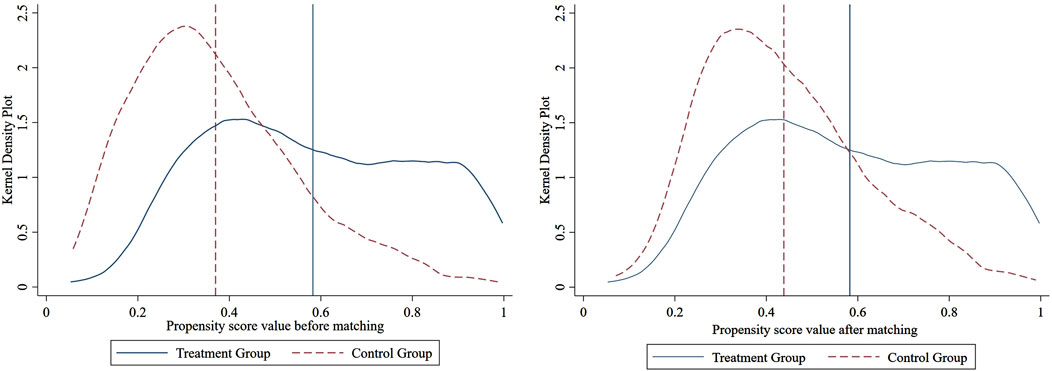
Figure 6. Kernel Density Plot before and after PSM of year-by-year.
4.3.3 Adjust the regression sample
First, considering that the COVID-19 pandemic may cause more significant fluctuations in policy implementation, the data for the year 2020–2021 are removed and regressed again, and although the absolute value of the coefficient of OGD is reduced, it is still significant at the 1% level. Secondly, municipalities are equivalent to provincial-level administrative regions and have a higher administrative level than other cities. Therefore, the data after deleting the municipality directly under the central government are regressed again, and it is found that the coefficient of OGD is still significant at the 1% level, and the coefficient change is relatively small. Lastly, the provincial capital city is a sub-provincial administrative region, which has a different administrative level compared with the ordinary prefectural-level cities, and the result of deleting the municipality directly under the central government, and then further deleting the provincial capital city, shows that the absolute value of the coefficient of OGD increases slightly and is significantly negative at the 1% level. Regardless of deleting special years or removing cities of higher administrative levels, OGD improves air quality and cuts AP. The above results are shown in columns (3), (4), and (5) of Table 3, respectively.
4.3.4 Lagging effect
In the era of global information explosion, the transmission and reception of information are not instantaneous but subject to specific time lags. After a government’s open data platform goes online, it takes time for social actors—such as the public, businesses, and research institutions—to access, understand, and apply the datasets. This asymmetry in information dissemination can result in a lagged impact of OGD on environmental improvement. Even when data are publicly available, their practical application may be delayed due to the cognitive and processing capacity limitations of users. With the ongoing introduction and implementation of top-level guidelines on open data, the management mechanisms of global OGD platforms have gradually improved, enriched by feedback from various stakeholders to enhance the efficiency of public data utilization. To analyze the policy’s lagged effects, while also testing the robustness of the benchmark regression results and reducing estimation error, this study constructs three interaction terms: OGD+1, OGD+2, and OGD+3, representing one-, two-, and three-year lags in policy implementation, respectively. The corresponding regression results are presented in Table 4. As shown in columns (1)–(4) of Table 4, the coefficients of OGD increase gradually in absolute value and are statistically significant at the 1% level. Notably, the environmental effect of OGD appears slightly weaker in the first lagged period (OGD+1) compared to the current phase. This may reflect adaptive friction in the initial stage of policy implementation—although the data have been made open, institutional integration, technological adoption, and public awareness are still at a formative stage (Janssen et al., 2012). As the institutional mechanisms mature and behavioral responses strengthen over time, the actual environmental performance of OGD becomes more pronounced in the second and third lagged periods. In particular, in the third lag year (OGD+3), the cities that implemented OGD policies experienced a reduction of 2.38 units in PM2.5 concentrations—approximately 0.84 units more than in the implementation year. This clearly indicates the existence of a time lag in the environmental effects of OGD and suggests that the improvement in air quality becomes more substantial in later years of policy implementation.
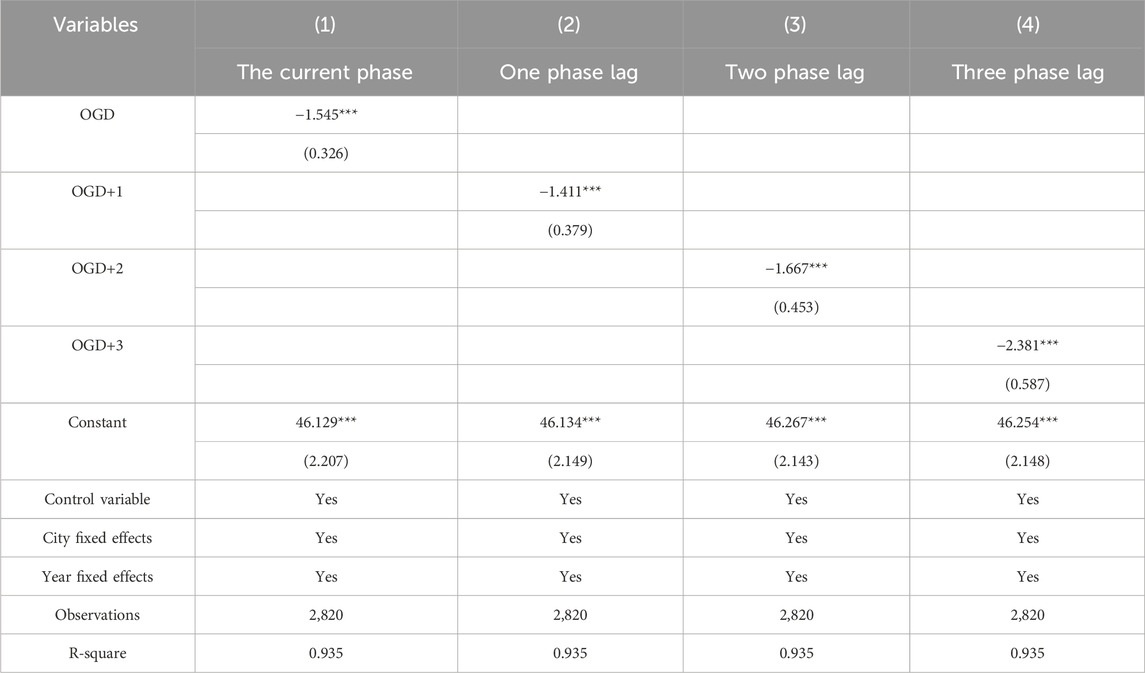
Table 4. Lag effect test.
4.3.5 Instrumental variable method
To further address potential endogeneity in the regression analysis, this study follows the approach of Li et al. (2024), Cheng (2023) by constructing an instrumental variable (SlopeX), defined as the interaction between the inverse of terrain slope and the number of Internet ports. The rationale is that regions with gentler terrain and more developed Internet infrastructure tend to have better information flow and more concentrated technological resources, making them more likely to launch OGD platforms. Importantly, neither topography nor Internet access directly affects AP, ensuring the exogeneity of the instrument.
A two-stage least squares estimation was employed to test for endogeneity, and the results are reported in Table 5. In the first-stage regression, the coefficient of SlopeX is 0.002 and is statistically significant at the 1% level, indicating a strong correlation with the endogenous variable OGD. The F-statistic of 30.50 (p < 0.01) further supports this conclusion. In addition, the Kleibergen-Paap rk LM statistic (38.54, p < 0.01) confirms that the model passes the under-identification test, while the Kleibergen-Paap rk Wald F-statistic (30.55) exceeds the Stock-Yogo critical value at the 10% threshold, ruling out weak instrument concerns. In the second stage, the estimated coefficient of OGD is −7.075, which is significantly negative at the 1% level and consistent with the baseline regression results. Moreover, both the Anderson-Rubin Wald test and the Stock-Wright LM S test significantly reject the null hypothesis (p < 0.01), further validating the strength and robustness of the instrumental variable approach.
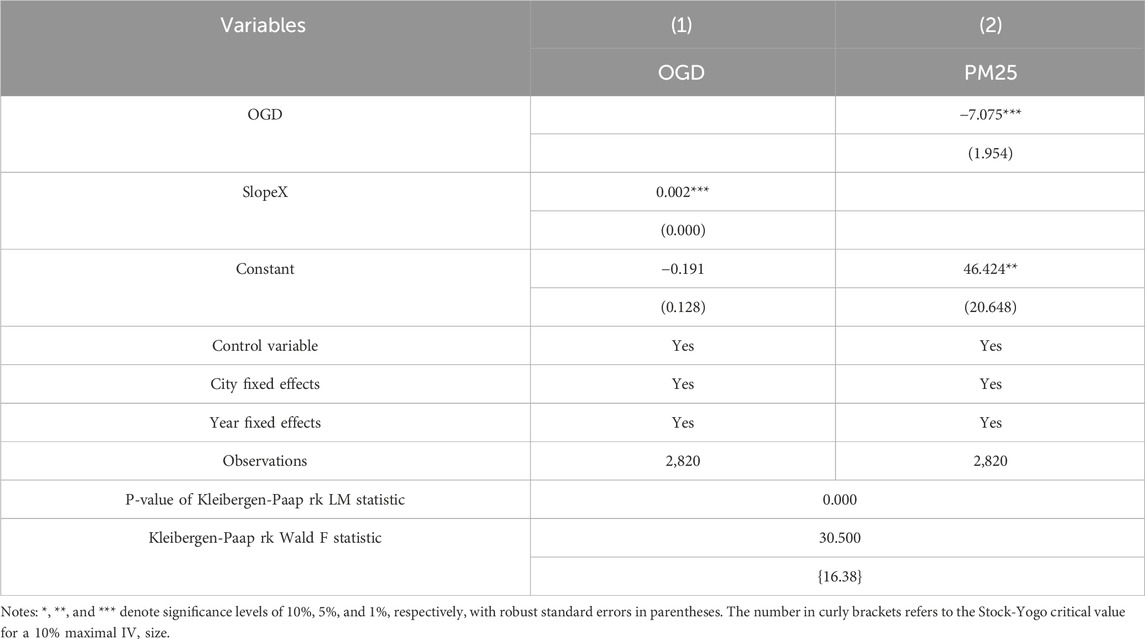
Table 5. IV estimation result.
5 Further discussion
5.1 Mechanism analysis
5.1.1 Mediation effect
The previous part reveals the improvement effect of OGD on AP through empirical tests. Theoretically, it identifies that OGD reduces AP through three aspects: stimulating the vitality of green innovation, improving the quality of environmental regulation, and promoting the optimization of industrial structure. Is the mechanism valid? To verify Hypothesis H2, the study employs a stepwise regression approach to test the mediating effect. Specifically, it first examines the significance of the relationship between OGD and the mediating variable, followed by testing the effect of the mediating variable on AP while controlling for OGD. Based on this logic, the model is extended from Equation 1 to formally test the mediating effect, as shown in the specifications below (Equations 3, 4):
where
First, from the presentation of the results in Columns (1)-(2) of Table 6, it can be seen that OGD in Column (1) has a significant contribution to improving the ERQ, which improves the ERQ by 3.22% (p < 0.01); the coefficients of the ERQ and the OGD in Column (2) are both negatively significant at 1% confidence level, indicating that ERQ plays a partially mediating role in the relationship between OGD and AP. Second, Columns (3)-(4) of Table 6 show that the regression coefficient of OGD with GPAuth is 0.034 (p < 0.01), and the regression coefficient of GPAuth with PM25 is −15.295 (p < 0.01), suggesting that OGD significantly inhibits AP by stimulating green innovation. Finally, a regression analysis was conducted to examine the relationship between OGD and the value added in the tertiary sector. The results show that OGD significantly increases the output of the tertiary industry by approximately 0.05 units (p < 0.01). Furthermore, tertiary industry value added is associated with a reduction in PM2.5 concentrations by approximately 0.963 units (p < 0.01), suggesting that OGD contributes to AP mitigation by promoting industrial restructuring and upgrading.
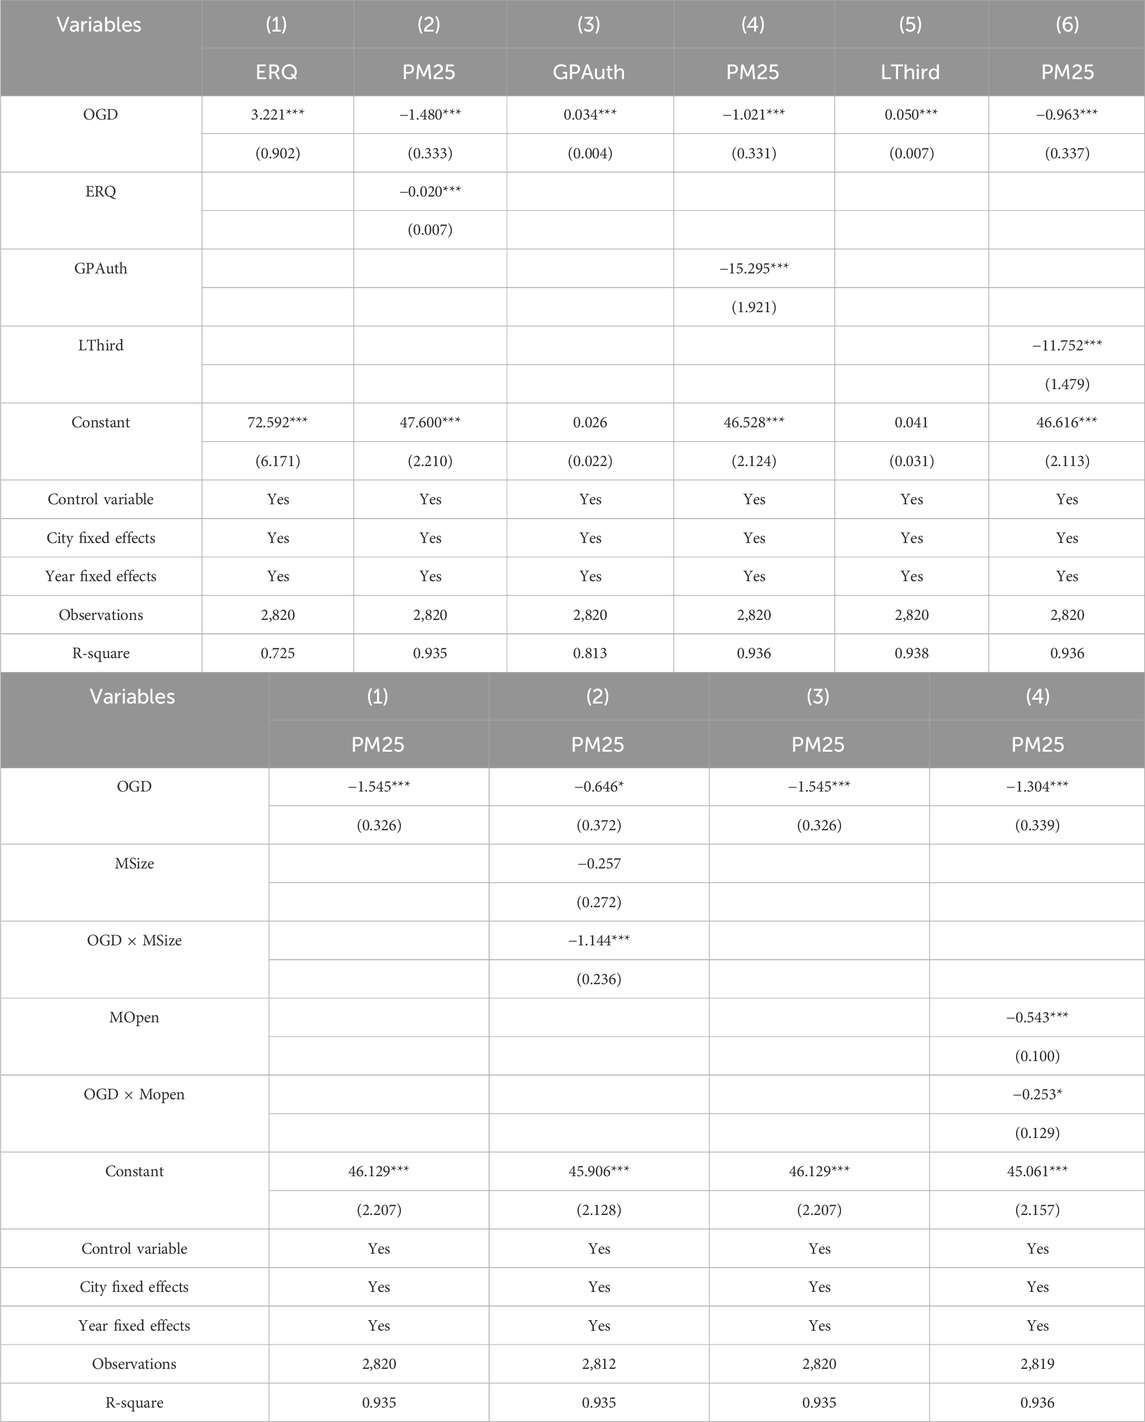
Table 6. Mechanism test.
5.1.2 Moderation effect
To test Hypothesis 3, this study develops the following model to examine the moderating effect of market factors in the relationship between OGD and AP, as formulated in Equations 5, 6:
Among them,
Table 6 reports the results of the analysis of the moderating effects. Column (2) shows that OGD × MSize is negatively significant at the 1% level, which indicates that the larger the market size, the stronger the weakening effect of OGD on AP. Column (4) shows that OGD × MOpen is negatively significant at 1% level, which indicates that the higher the market openness, the better the inhibiting effect of OGD on AP.
5.2 Heterogeneity analysis
The results of the regional heterogeneity analysis are shown in Table 7. The policy effect of OGD is significant only in the eastern and western regions—at the 5% level in the east and the 1% level in the west. The eastern region, as the frontier of reform and opening-up, benefits from advanced digital infrastructure, strong innovation capacity, and widespread network coverage, enabling more effective implementation of OGD, which partially supports the hypothesis. In contrast, the western region, despite weaker economic and digital foundations, exhibits a significant reduction in PM2.5 concentrations (by approximately 5.61 units), likely due to the “low-hanging fruit” effect. The prevalence of high-emission industries and a single energy mix allows environmental gains to be realized more easily, and OGD offers tools to quickly target such opportunities. The central region, situated between the east and west, holds intermediate levels of economic development and digital capacity, with fewer readily available gains and less policy differentiation. These factors jointly explain the weaker policy effect of OGD in that region. In short, the effect of OGD on AP is most significant in the western region, relatively significant in the eastern region, and not significant in the central region. This challenges traditional perceptions and has important policy implications.
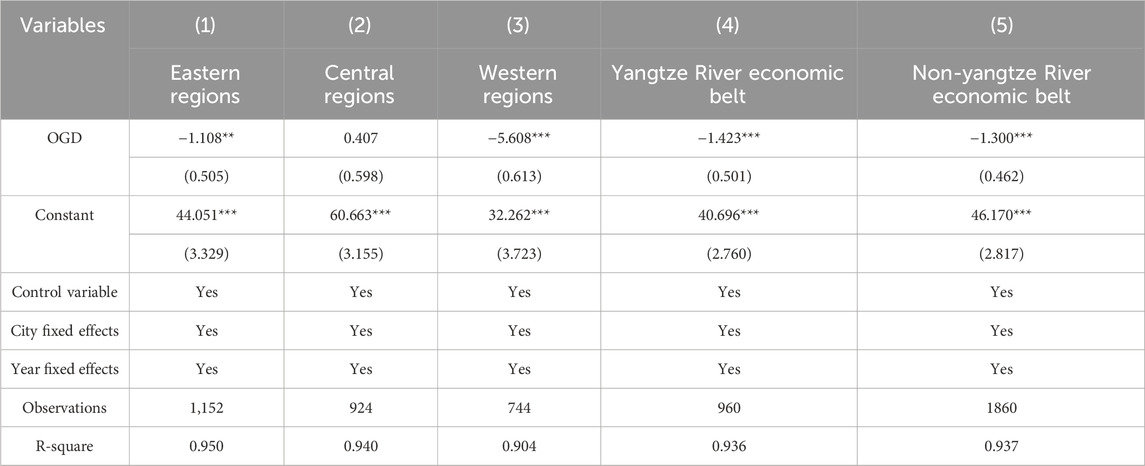
Table 7. Heterogeneity test.
Observing Columns (4) and (5) in Table 7, the coefficient of OGD is significant at the 1% confidence level in both the Yangtze River Economic Belt and the non-Yangtze River Economic Belt. However, the absolute value of the coefficient in the Yangtze River Economic Belt is larger than that in the non-Yangtze River Economic Belt. The Yangtze River Economic Belt is one of the important engines of China’s economic development, which not only possesses a higher level of innovation and technology but also has a higher implementation of ecological quality, environmental governance and protection, and green development and ecological civilization than the non-Yangtze River Economic Belt.
6 Conclusion and discussion
Eco-environmental protection has been elevated to a national strategy, and the relationship between environmental governance and multiple factors has been extensively studied. Using OGD as an entry point, this paper applies a staggered DID model based on panel data from 235 Chinese cities (2010–2021) and reaches three key findings: (1) OGD helps to reduce AP and improve urban air quality, and this result passes a variety of robustness tests. (2) OGD improves AP governance through three key mechanisms: promoting green innovation, enhancing environmental regulation, and optimizing industrial structure. By making environmental impact assessment data widely available, it reduces information asymmetry, supports data-driven decision-making, and increases regulatory efficiency. Larger market size and greater openness further strengthen the effect of OGD. Expanding markets generate more data and demand for its use, while openness encourages competition, prompting firms to adopt cleaner and more efficient technologies. (3) The positive effect of OGD on AP control is significant in the eastern and western regions of China, and the significant effect in the western region is better than that in the eastern region. OGD is significant in both the Yangtze River Economic Belt and the non-Yangtze River Economic Belt, but pollution control is better in the Yangtze River Economic Belt than in the non-Yangtze River Economic Belt.
Protecting the ecological environment is important for China to realize sustainable development. Based on the above findings, this paper proposes three policy recommendations to amplify the advantageous effects of open data on environmental governance: (1) To enhance the role of OGD in environmental governance, the government should further expand the scope, depth, and quality of data openness while managing data security risks. Priority should be given to collecting and disclosing more environmental resource datasets, applying desensitization and visualization technologies to improve data accessibility and interpretation for both market participants and civil society. (2) Efforts should be made to stimulate green innovation, improve the precision and efficiency of environmental regulation, and optimize the industrial structure. This can be achieved by establishing green innovation funds, promoting the use of open data in regulatory practices, and supporting the growth of green industries, particularly within the service sector. Reducing government intervention, lowering market entry barriers, and fostering openness to foreign capital will further amplify these effects. (3) Open data strategies should be tailored to regional characteristics, especially in the central region, where current policy effects are limited. Introducing third-party institutions to regularly evaluate implementation outcomes will enable dynamic monitoring and feedback. As the “low-hanging fruit” of pollution control diminishes, continued improvement of data interoperability and platform functionality will be essential to sustain the long-term impact of OGD.
This study also has certain limitations. On the one hand, due to the problem of data unavailability, the core variables of the study are relatively single, and a complex indicator system has not been constructed. On the other hand, different countries have different administrative systems, geographic regions, and development patterns, and the quasi-experimental analysis of the study is mainly centered on Chinese cities, which can provide practical references for other developing countries with similar scenarios. However, the extrapolation of the experimental conclusions may be insufficient for non-developing economies. Future studies could incorporate more diversified and extensive data to refine variable and indicator design, expand the experimental sample, and conduct deeper, category-specific analyses of influencing mechanisms and heterogeneity.
Data availability statement
The raw data supporting the conclusions of this article will be made available by the authors, without undue reservation.
Author contributions
XZ: Conceptualization, Data curation, Funding acquisition, Writing – original draft. RW: Data curation, Methodology, Software, Writing – original draft, Writing – review and editing. MH: Resources, Writing – review and editing.
Funding
The author(s) declare that financial support was received for the research and/or publication of this article. This work is supported by the Fundamental Research Funds for the Minzu University of China (grant no. 2024JCYJ18), and the Beijing Social Science Foundation Project (grant no. 24ZGB005).
Acknowledgments
The authors thank the Editors and referees for their helpful comments and suggestions.
Conflict of interest
The authors declare that the research was conducted in the absence of any commercial or financial relationships that could be construed as a potential conflict of interest.
Generative AI statement
The authors declare that no Generative AI was used in the creation of this manuscript.
Publisher’s note
All claims expressed in this article are solely those of the authors and do not necessarily represent those of their affiliated organizations, or those of the publisher, the editors and the reviewers. Any product that may be evaluated in this article, or claim that may be made by its manufacturer, is not guaranteed or endorsed by the publisher.
References
Albort-Morant, G., Leal-Rodríguez, A. L., and De Marchi, V. (2018). Absorptive capacity and relationship learning mechanisms as complementary drivers of green innovation performance. J. Knowl. Manag. 22 (2), 432–452. doi:10.1108/JKM-07-2017-0310
Attard, J., Orlandi, F., Scerri, S., and Auer, S. (2015). A systematic review of open government data initiatives. Gov. Inf. Q. 32 (4), 399–418. doi:10.1016/j.giq.2015.07.006
Baker, A. C., Larcker, D. F., and Wang, C. C. (2022). How much should we trust staggered difference-in-differences estimates? J. Financ. Econ. 144 (2), 370–395. doi:10.1016/j.jfineco.2022.01.004
Bakıcı, T., Almirall, E., and Wareham, J. (2013). A smart city initiative: the case of Barcelona. J. Knowl. Econ. 4 (2), 135–148. doi:10.1007/s13132-012-0084-9
Bao, R., and Liu, T. (2022). How does government attention matter in air pollution control? Evidence from government annual reports. Resour. Conservation Recycl. 185, 106435. doi:10.1016/j.resconrec.2022.106435
Beck, T., Levine, R., and Levkov, A. (2010). Big bad banks? The winners and losers from bank deregulation in the United States. J. Finance 65 (5), 1637–1667. doi:10.1111/j.1540-6261.2010.01589.x
Böckerman, P., and Ilmakunnas, P. (2009). Unemployment and self-assessed health: evidence from panel data. Health Econ. 18 (2), 161–179. doi:10.1002/hec.1361
Bresciani, S., Ciampi, F., Meli, F., and Ferraris, A. (2021). Using big data for co-innovation processes: Mapping the field of data-driven innovation, proposing theoretical developments and providing a research agenda. Int. J. Inf. Manag. 60, 102347. doi:10.1016/j.ijinfomgt.2021.102347
Castro, C., and Lopes, C. (2022). Digital government and sustainable development. J. Knowl. Econ. 13 (2), 880–903. doi:10.1007/s13132-021-00749-2
Che, S., and Wang, J. (2022). Digital economy development and haze pollution: evidence from China. Environ. Sci. Pollut. Res. 29, 73210–73226. doi:10.1007/s11356-022-20957-w
Chen, K., Li, Q., Shoaib, M., Ameer, W., and Jiang, T. (2024). Does improved digital governance in government promote natural resource management? Quasi-natural experiments based on smart city pilots. Resour. Policy 90, 104721. doi:10.1016/j.resourpol.2024.104721
Chen, W., and Yan, W. (2020). Impact of internet electronic commerce on SO2 pollution: evidence from China. Environ. Sci. Pollut. Res. 27 (20), 25801–25812. doi:10.1007/s11356-020-09027-1
Cheng, X. (2023). Estimating heterogeneous effects of internet use on environmental knowledge: taking population heterogeneity into consideration. PLos One ONE 18 (7), e0288495. doi:10.1371/journal.pone.0288495
Dong, S., Ren, G., Xue, Y., and Liu, K. (2023). How does green innovation affect air pollution? An analysis of 282 Chinese cities. Atmos. Pollut. Res. 14 (9), 101863. doi:10.1016/j.apr.2023.101863
Evans, A. M., and Campos, A. (2013). Open government initiatives: challenges of citizen participation. J. Policy Analysis Manag. 32 (1), 172–185. doi:10.1002/pam.21651
Fan, F., and Zhang, X. (2021). Transformation effect of resource-based cities based on PSM-DID model: an empirical analysis from China. Environ. Impact Assess. Rev. 91, 106648. doi:10.1016/j.eiar.2021.106648
Feng, Y., and He, F. (2020). The effect of environmental information disclosure on environmental quality: evidence from Chinese cities. J. Clean. Prod. 276, 124027. doi:10.1016/j.jclepro.2020.124027
Fredriksson, P. G., and Svensson, J. (2003). Political instability, corruption and policy formation: the case of environmental policy. J. Public Econ. 87 (7–8), 1383–1405. doi:10.1016/S0047-2727(02)00036-1
Gandomi, A., and Haider, M. (2015). Beyond the hype: big data concepts, methods, and analytics. Int. J. Inf. Manag. 35 (2), 137–144. doi:10.1016/j.ijinfomgt.2014.10.007
Goldfarb, A., and Tucker, C. (2019). Digital economics. J. Econ. Literature 57 (1), 3–43. doi:10.1257/jel.20171452
Gu, B., Liu, J., and Ji, Q. (2022). The effect of social sphere digitalization on green total factor productivity in China: Evidence from a dynamic spatial Durbin model. J. Environ. Manag. 320, 115946. doi:10.1016/j.jenvman.2022.115946
Gu, H., and Chen, Y. (2020). Using the grey model to analyze the impact of the primary, secondary, and tertiary industries on the public's attention to air pollution in three cities. Math. Problems Eng. 2020, 1–15. doi:10.1155/2020/6614570
Hardy, K., and Maurushat, A. (2017). Opening up government data for big data analysis and public benefit. Comput. Law & Secur. Rev. 33 (1), 30–37. doi:10.1016/j.clsr.2016.11.003
He, G., Jiang, H., and Zhu, Y. (2024). The effect of digital technology development on the improvement of environmental governance capacity: a case study of China. Ecol. Indic. 165, 112162. doi:10.1016/j.ecolind.2024.112162
Ho, C. S. F., Amir, K., Nasaruddin, L. S., and Abidin, N. F. Z. (2013). “Openness, market size and foreign direct investments,” in Emerging markets and financial resilience. Editors C. W. Hooy, R. Ali, and S. G. Rhee (Palgrave Macmillan), 135–148. doi:10.1057/9781137266613_8
Huong, T. T. L., and Thanh, T. T. (2022). Is digitalization a driver to enhance environmental performance? An empirical investigation of European countries. Sustain. Prod. Consum. 32, 230–247. doi:10.1016/j.spc.2022.05.009
Janssen, M., Charalabidis, Y., and Zuiderwijk, A. (2012). Benefits, adoption barriers and myths of open data and open government. Inf. Syst. Manag. 29 (4), 258–268. doi:10.1080/10580530.2012.716740
Kloppenburg, S., Gupta, A., Kruk, S. R., Makris, S., Bergsvik, R., Korenhof, P., et al. (2022). Scrutinizing environmental governance in a digital age: new ways of seeing, participating, and intervening. One Earth 5 (3), 232–241. doi:10.1016/j.oneear.2022.02.008
Ladeira, W. J., Santini, F. D. O., Rasul, T., Cheah, I., Elhajjar, S., Yasin, N., et al. (2024). Big data analytics and the use of artificial intelligence in the services industry: a meta-analysis. Serv. Industries J. 44 (15–16), 1117–1144. doi:10.1080/02642069.2023.2246471
Li, H., Zhang, Y., and Li, Y. (2024). The impact of the digital economy on the total factor productivity of manufacturing firms: empirical evidence from China. Technol. Forecast. Soc. Change 207, 123604. doi:10.1016/j.techfore.2024.123604
Li, Y., Dai, J., and Cui, L. (2020). The impact of digital technologies on economic and environmental performance in the context of Industry 4.0: a moderated mediation model. Int. J. Prod. Econ. 229, 107777. doi:10.1016/j.ijpe.2020.107777
Lim, T. C. (2021). Patterns in environmental priorities revealed through government open data portals. Telematics Inf. 64, 101678. doi:10.1016/j.tele.2021.101678
Lin, B., and Zhang, A. (2023). Can government environmental regulation promote low-carbon development in heavy polluting industries? Environ. Impact Assess. Rev. 99, 106991. doi:10.1016/j.eiar.2023.106991
Lin, Z. (2024). Data-driven solutions: uncovering the hidden potential of big data technologies in building low-carbon cities. Comput. & Industrial Eng. 197, 110543. doi:10.1016/j.cie.2023.110543
Liu, K., and Lin, B. (2019). Research on influencing factors of environmental pollution in China: a spatial econometric analysis. J. Clean. Prod. 206, 356–364. doi:10.1016/j.jclepro.2018.09.167
Liu, Y., Wang, S., Qiao, Z., Wang, Y., Ding, Y., and Miao, C. (2019). Estimating the dynamic effects of socioeconomic development on industrial SO2 emissions in Chinese cities using a DPSIR causal framework. Resour. Conservation Recycl. 150, 104450. doi:10.1016/j.resconrec.2019.104450
Liu, Z., Tang, Y., Wilson, J., Tao, X., Lv, B., Wang, Z., et al. (2023). Influence of government attention on environmental quality: an analysis of 30 provinces in China. Environ. Impact Assess. Rev. 100, 107084. doi:10.1016/j.eiar.2023.107084
Luo, C., Qiang, W., and Lee, H. F. (2023). Does the low-carbon city pilot policy work in China? A company-level analysis based on the PSM-DID model. J. Environ. Manag. 337, 117725. doi:10.1016/j.jenvman.2023.117725
Ma, D., and Zhu, Q. (2022). Innovation in emerging economies: research on the digital economy driving high-quality green development. J. Bus. Res. 145, 801–813. doi:10.1016/j.jbusres.2022.03.041
Mahajan, S., Luo, C. H., Wu, D. Y., and Chen, L. J. (2021). From Do-It-Yourself (DIY) to Do-It-Together (DIT): reflections on designing a citizen-driven air quality monitoring framework in Taiwan. Sustain. Cities Soc. 66, 102628. doi:10.1016/j.scs.2020.102628
Nikiforova, A., and McBride, K. (2021). Open government data portal usability: a user-centred usability analysis of 41 open government data portals. Telematics Inf. 58, 101539. doi:10.1016/j.tele.2020.101539
Niroomand, F., Hajilee, M., and Al Nasser, O. M. (2014). Financial market development and trade openness: evidence from emerging economies. Appl. Econ. 46 (13), 1490–1498. doi:10.1080/00036846.2013.866207
Oliveira, V. H. O. D., Pinheiro, P. G., and Pinto, N. G. M. (2023). From open government to open government data: a bibliometric view. Electron. Gov. Int. J. 19 (6), 667–692. doi:10.1504/EG.2023.10055613
Parycek, P., Höchtl, J., and Ginner, M. (2014). Open government data implementation evaluation. J. Theor. Appl. Electron. Commer. Res. 9 (2), 80–99. doi:10.4067/S0718-18762014000200007
Qi, G., Wang, Z., Wang, Z., and Wei, L. (2022). Has industrial upgrading improved air pollution? — Evidence from China's digital economy. Sustainability 14 (14), 8967. doi:10.3390/su14148967
Ren, S., Hao, Y., and Wu, H. (2023). Digitalization and environmental governance: does internet development reduce environmental pollution? J. Environ. Plan. Manag. 66 (7), 1533–1562. doi:10.1080/09640568.2022.2033959
Shen, N., Zhang, G., Zhou, J., Zhang, L., Wu, L., Zhang, J., et al. (2024). Can big data policy drive urban carbon unlocking efficiency? A new approach based on double machine learning. J. Environ. Manag. 372, 123296. doi:10.1016/j.jenvman.2024.123296
Shen, Y., and Zhang, X. (2024). Blue sky protection campaign: assessing the role of digital technology in reducing air pollution. Systems 12 (2), 55. doi:10.3390/systems12020055
Shi, D., Bu, C., and Xue, H. (2021). Deterrence effects of disclosure: The impact of environmental information disclosure on emission reduction of firms. Energy Econ. 104, 105680. doi:10.1016/j.eneco.2021.105680
Song, M., Fisher, R., and Kwoh, Y. (2019). Technological challenges of green innovation and sustainable resource management with large scale data. Technol. Forecast. Soc. Change 144, 361–368. doi:10.1016/j.techfore.2018.06.004
Stylos, N., Zwiegelaar, J., and Buhalis, D. (2021). Big data empowered agility for dynamic, volatile, and time-sensitive service industries: the case of tourism sector. Int. J. Contemp. Hosp. Manag. 33 (3), 1015–1036. doi:10.1108/IJCHM-07-2020-0644
Tai, K. T. (2021). Open government research over a decade: a systematic review. Gov. Inf. Q. 38 (2), 101566. doi:10.1016/j.giq.2021.101566
Takalo, S. K., Tooranloo, H. S., and Shahabaldini parizi, Z. (2021). Green innovation: a systematic literature review. J. Clean. Prod. 279, 122474. doi:10.1016/j.jclepro.2020.122474
Tan, J., and Eguavoen, I. (2017). Digital environmental governance in China: information disclosure, pollution control, and environmental activism in the Yellow River Delta. Water Altern. 10 (3), 910–929. doi:10.3390/su13179758
Tian, X. L., Guo, Q. G., Han, C., and Ahmad, N. (2016). Different extent of environmental information disclosure across Chinese cities: contributing factors and correlation with local pollution. Glob. Environ. Change 39, 244–257. doi:10.1016/j.gloenvcha.2016.05.014
Tu, Z., Hu, T., and Shen, R. (2019). Evaluating public participation impact on environmental protection and ecological efficiency in China: evidence from PITI disclosure. China Econ. Rev. 55, 111–123. doi:10.1016/j.chieco.2019.03.010
Wang, J., and Ogawa, S. (2015). Effects of meteorological conditions on PM2.5 concentrations in Nagasaki, Japan. Int. J. Environ. Res. Public Health 12 (8), 9089–9101. doi:10.3390/ijerph120809089
Wang, V., and Shepherd, D. (2020). Exploring the extent of openness of open government data—a critique of open government datasets in the UK. Gov. Inf. Q. 37 (1), 101405. doi:10.1016/j.giq.2019.101405
Wang, Y., Zhang, X., Lin, F., and Peng, M. (2023). The role of digital governance on carbon emission performance: evidence from the cities in Yangtze River Delta, China. Environ. Res. Commun. 5 (8), 085013. doi:10.1088/2515-7620/acf2dc
Yang, B., Ali, M., Nazir, M. R., Ullah, W., and Qayyum, M. (2020). Financial instability and CO2 emissions: cross-country evidence. Air Qual. Atmos. & Health 13 (4), 459–468. doi:10.1007/s11869-019-00774-2
Yang, J., Guo, H., Liu, B., Shi, R., Zhang, B., and Ye, W. (2018). Environmental regulation and the pollution haven hypothesis: do environmental regulation measures matter? J. Clean. Prod. 202, 993–1000. doi:10.1016/j.jclepro.2018.08.144
Yang, K., and Rho, S. Y. (2007). E-government for better performance: promises, realities, and challenges. Int. J. Public Adm. 30 (11), 1197–1217. doi:10.1080/01900690701225556
Yu, Y., Yang, X., and Li, K. (2019). Effects of the terms and characteristics of cadres on environmental pollution: evidence from 230 cities in China. J. Environ. Manag. 232, 179–187. doi:10.1016/j.jenvman.2018.11.002
Zeng, J., and Yang, M. (2023). Digital technology and carbon emissions: evidence from China. J. Clean. Prod. 430, 139765. doi:10.1016/j.jclepro.2023.139765
Zhang, G., Deng, N., Mou, H., Zhang, Z. G., and Chen, X. (2019). The impact of the policy and behavior of public participation on environmental governance performance: empirical analysis based on provincial panel data in China. Energy Policy 129, 1347–1354. doi:10.1016/j.enpol.2019.03.021
Zhang, J., Liang, F., and Gao, P. (2024). Can big data reduce urban environmental pollution? Evidence from China's digital technology experimental zone. PLos One 19 (10), e0288429. doi:10.1371/journal.pone.0288429
Zhang, L., Wang, Q., and Zhang, M. (2021). Environmental regulation and CO2 emissions: based on strategic interaction of environmental governance. Ecol. Complex. 45, 100893. doi:10.1016/j.ecocom.2020.100893
Zhao, J., Jiang, Q., Dong, X., Dong, K., and Jiang, H. (2022). How does industrial structure adjustment reduce CO2 emissions? Spatial and mediation effects analysis for China. Energy Econ. 105, 105704. doi:10.1016/j.eneco.2021.105704
Zhou, B., and Ding, H. (2023). How public attention drives corporate environmental protection: effects and channels. Technol. Forecast. Soc. Change 191, 122486. doi:10.1016/j.techfore.2023.122486
Keywords: open government data, air pollution, mechanism analysis, regional heterogeneity, difference-in-differences
Citation: Zhou X, Wang R and Han M (2025) Uncovering the black box of public data: the contribution of open government data to air pollution control. Front. Environ. Sci. 13:1580362. doi: 10.3389/fenvs.2025.1580362
Received: 20 February 2025; Accepted: 30 April 2025;
Published: 15 May 2025.
Edited by:
Le Wen, Auckland University of Technology, New ZealandReviewed by:
Xiong Weiwei, UMR8212 Laboratoire des Sciences du Climat et de l'Environnement (LSCE), FranceZihao Lin, Sun Yat-sen University, China
Copyright © 2025 Zhou, Wang and Han. This is an open-access article distributed under the terms of the Creative Commons Attribution License (CC BY). The use, distribution or reproduction in other forums is permitted, provided the original author(s) and the copyright owner(s) are credited and that the original publication in this journal is cited, in accordance with accepted academic practice. No use, distribution or reproduction is permitted which does not comply with these terms.
*Correspondence: Mingyang Han, bWF0ZXJpYWwwNTA0QDE2My5jb20=