 Shengjie Cui
 Shuixia Zhao
 Chao Li1*
 Tomasz Kolerski
- 1College of Water Conservancy and Civil Engineering, Inner Mongolia Agricultural University, Hohhot, Inner Mongolia, China
- 2Yinshanbeilu Grassland Ecohydrology National Observation and Research Station, China Institute of Water Resources and Hydropower Research, Beijing, China
- 3Institute of Pastoral Hydraulic Research, Ministry of Water Resources, Hohhot, Inner Mongolia, China
- 4Faculty of Civil and Environmental Engineering, Gdánsk University of Technology, Gdánsk, Poland
- 5College of Geographical Science, Inner Mongolia Normal University, Hohhot, China
Net ecosystem productivity (NEP) is a critical indicator for characterizing the carbon cycle dynamics within terrestrial ecosystems. This study employs six different combinations of methods for calculating Net Primary Productivity (NPP) and heterotrophic soil respiration
1 Introduction
The acceleration of global industrialization has precipitated a substantial increase in greenhouse gas emissions, particularly CO2 (Raihan et al., 2022). According to the synthesis report of the Sixth Assessment Report (AR6) by the United Nations Intergovernmental Panel on Climate Change (IPCC) in 2023, atmospheric CO2 concentrations have surged to their highest levels in nearly two million years, accompanied by a global temperature rise of 1.1°C above pre-industrial levels (IPCC, 2023). These changes have triggered unprecedented climatic shifts worldwide, with extreme weather events such as intense heatwaves, heavy precipitation, and prolonged droughts becoming increasingly frequent, thereby disrupting the carbon balance within ecosystems (Kelong et al., 2011). To mitigate the adverse effects of carbon cycle imbalances on ecological systems and human livelihoods, the international community has emphasized the importance of enhancing carbon sinks, making their development across various ecosystems a critical strategy for achieving national “dual carbon” goals (Yu et al., 2022). Consequently, investigating the spatiotemporal dynamics of ecosystem carbon cycles and their driving factors is essential for advancing ecological civilization and ensuring the sustainability and security of human society. Inner Mongolia, situated within an arid and semi-arid region, represents the most extensive and diverse ecological functional area in northern China. The alterations in its ecosystem carbon storage have a considerable impact on the global ecosystem carbon cycle (Cao et al., 2023; Jiang et al., 2019; Meng et al., 2020). Therefore, investigating the spatiotemporal distribution patterns of terrestrial Net Ecosystem Productivity (NEP) and its drivers in Inner Mongolia is of significant scientific importance, enabling a scientifically informed explanation of the regional ecosystem carbon cycle and facilitating the rational use of forest and grassland resources.
Gross Primary Productivity (GPP), Net Primary Productivity (NPP), and NEP are key indicators of ecosystem carbon cycling, reflecting the response of different ecosystems to climate change and the productive capacity of plant communities under natural environmental conditions (Zhou et al., 2020; Hou et al., 2023; Zheng et al., 2023; Huang et al., 2023a; Li et al., 2022; Liu et al., 2022; Ding et al., 2025). NEP, representing NPP minus the products of photosynthesis consumed by heterotrophic soil respiration (
The carbon cycle in terrestrial ecosystems is influenced by a complex array of environmental factors, making the exploration of its drivers and dominant factors a prominent focus in global carbon change research. Correlation analysis, random forest modelling, regression analysis, and other machine learning techniques are the primary research methods. For instance, Lu et al. (2023) found that NEP in Xinjiang is more sensitive to rainfall, while Wang et al. (2022a) observed that climatic factors had the largest contribution to NEP changes in the mountainous arid regions of northwestern China, with anthropogenic activities contributing negatively. Zhang et al. (2024) identified elevation as the dominant factor influencing NEP changes in Heilongjiang Province, and Cao et al. (2022) found precipitation to be the main climatic factor influencing the spatial distribution of NEP in the Yellow River Basin. Variations in NEP patterns, driving factors, and spatial distribution within the same region are markedly influenced by regional subsurface conditions and vegetation types (Huang et al., 2023b; Wang et al., 2022b; Bejagam and Sharma, 2022). Current research methodologies are limited by their dependence on singular carbon sink estimation models and exhibit insufficient comparative analysis of carbon sink estimation outcomes from alternative models.
Forest and grassland ecosystems, indispensable components of terrestrial ecosystems, play a crucial role in the global carbon cycle (Ahlström et al., 2015; Bai and Cotrufo, 2022). Data from the third national land survey indicate that the forested area in Inner Mongolia is 24.37 × 10⁴ km2 (23%), encompassing the temperate coniferous forest belt, the mid-temperate deciduous broadleaf forest belt, and the warm-temperate deciduous broadleaf forest belt. The grassland area extends to 54.37 × 10⁴ km2, representing the most extensive terrestrial ecosystem in Inner Mongolia, with meadow steppes, typical steppes, desert steppes, and grassland desertification areas accounting for 5.57%, 37.10%, 10.75%, and 11.55%, respectively. The total cropland area is 11.50 × 10⁴ km2. These ecosystems are essential terrestrial ecological resources for achieving the dual carbon targets (Balasubramanian et al., 2020; Liu et al., 2019). As a vital livestock and grassland production base in China and a northern ecological security barrier, Inner Mongolia is significantly affected by pronounced spatiotemporal climate variations and frequent interannual extreme climate events, resulting in an unclear understanding of the regional NEP and its driving factors.
This paper estimates monthly NEP in the study area from 2001 to 2021 using six NPP and
2 Materials and methods
2.1 Research area
The Inner Mongolia Autonomous Region is located in northern China, spanning from 37°24′-53°23′N to 97°12′-126°04′E. Encompassing the northeastern, northern, and northwestern parts of the country, it stretches approximately 2,400 km from east to west and 1,700 km from north to south. The region’s diverse landscape includes forested and grassy areas in the east, expansive grasslands in the central region, and predominantly barren terrain in the west, as depicted in Figure 1.
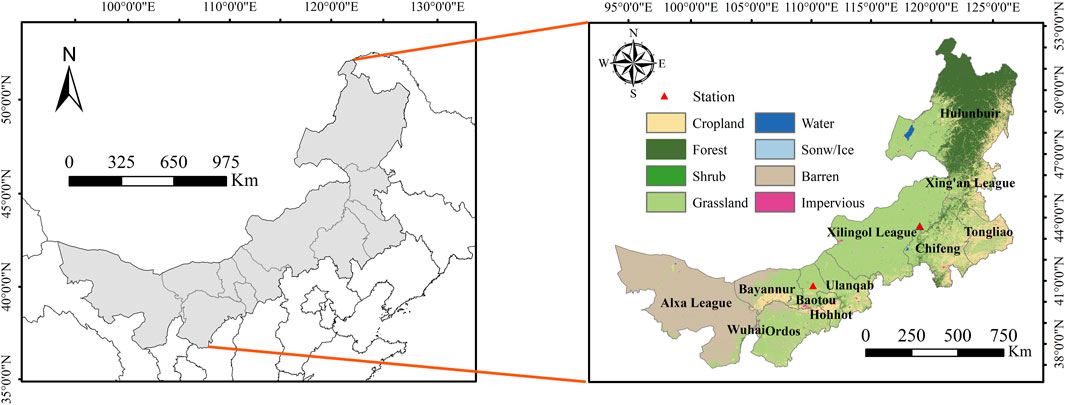
Figure 1. Overview of the study area.
With an average altitude exceeding 1,000 m, the region’s topography is characterized by higher elevations in the southwest compared to the northeast. Inner Mongolia experiences a medium-temperate continental monsoon climate, marked by distinct seasonal variations. The climate transitions from humid and semi-humid conditions in the east to semi-arid and arid conditions in the west. Annual average temperatures range from 0°C to 8°C, while precipitation varies significantly across the region, from 50 mm to 450 mm annually. The annual total solar radiation here ranges from 5,400 to 5,900 MJ·m−2, with an average of about 5600 MJ·m-2. The spatial distribution of this resource shows a gradual increase from the northeast to the southwest.
Due to the diverse underlying surfaces across different zones, there are notable variations in annual potential evapotranspiration. For instance, areas near the Greater Khingan Mountains have potential evapotranspiration values below 1,200 mm, whereas most other regions exceed this threshold. It is important to note that Inner Mongolia’s ecological environment is relatively fragile, with frequent occurrences of extreme droughts.
2.2 Data sourcing and preprocessing
The meteorological and remote sensing datasets utilized in this study, covering a comprehensive time span from 2001 to 2021, are systematically presented in Table 1. These datasets encompass a wide range of variables, including but not limited to precipitation (PRE), temperature (TEM), solar radiation (SOL), potential evapotranspiration (PET), and vegetation indices (NDVI), which are critical for analyzing the climatic and environmental dynamics over the two-decade period. The integration of these multi-source data provides a robust foundation for the subsequent analysis and modeling efforts in this research.
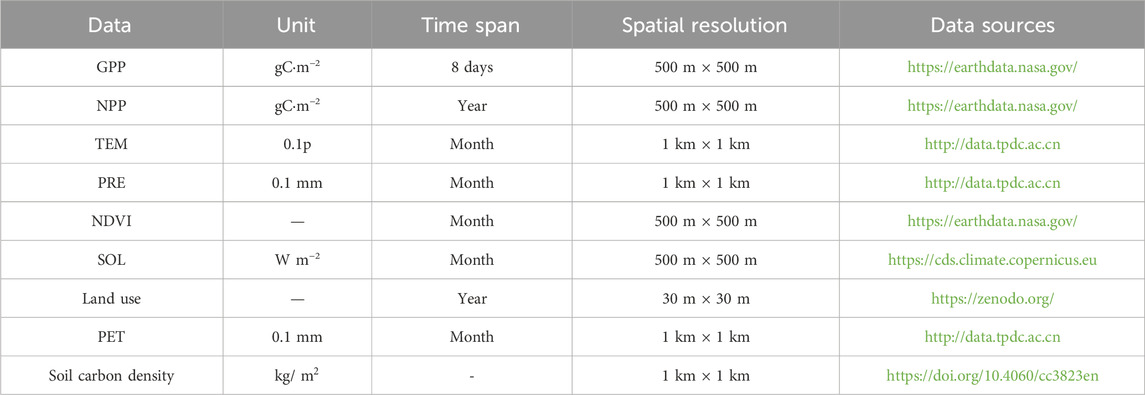
Table 1. Data sources and units.
The carbon flux data associated with vortex measurements, obtained from the desert grassland site (Damao Station) (Song et al., 2022) and the typical grassland site (Xiwuqi Banner Station) (Tan et al., 2023), were meticulously selected for model validation.
The meteorological and remote sensing raster datasets underwent standardized preprocessing in terms of spatial extent and resolution using ArcGIS. This preprocessing included raster projection transformation, resampling, and clipping procedures to ensure consistency across the datasets.
2.3 Research methods
2.3.1 NPP estimation model
The estimation of NPP in this study utilized MODIS annual NPP and 8-day GPP products, in conjunction with the CASA models. The monthly NPP formula derived from MODIS products is presented as Equations 1, 2:
Where
The present study employs the CASA model to compute monthly NPP (Piao et al., 2001), reducing the estimation time scale to 1 month and refining the input parameters of the model for enhanced accuracy. Finally, NPP data is estimated to have a temporal resolution of 1 month and a spatial resolution of 1 km. The NPP estimation in this model is based on the assimilated photosynthetic active radiation (APAR) by plants and their effective utilization of light energy (ε). The estimation formula is shown in Equation 3:
Where,
Where,
When the average TEM of a month is 10°C higher or 13°C lower than the optimum TEM
Where EET represents the actual evapotranspiration of the region.
Where
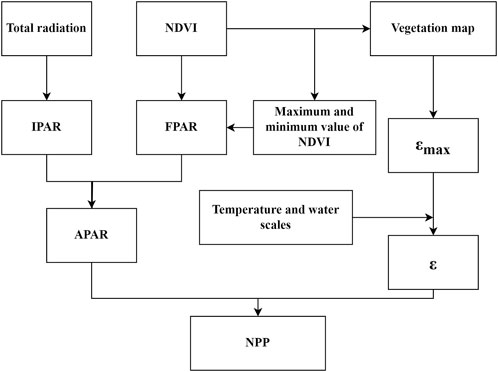
Figure 2. Flowchart for estimating NPP with CASA model.
2.3.2
The
The calculation formula of the soil microbial heterotrophic respiration model established by Pei is as Equation 9:
Where,
The GSMSR model is primarily utilized for the computation of
Where
The
The
2.3.3 NEP estimation model
Without considering the influence of other natural and human factors, NEP is equal to the difference between vegetation NPP and
Where,
2.3.4 Correlation and significance analysis
The key climate factors influencing regional NEP changes were identified as PRE, TEM, SOL, and PET. Their spatial correlation with NEP at both annual and growing season scales was analyzed at the pixel level. The correlation coefficient (r) was calculated using the Equation 14.
Where
T-test is used to determine whether the correlation between NEP and climate factors is significant. The calculation formula of the T-value is as Equation 15:
If the absolute value of t is greater than t0.05 it means that the correlation between the two groups of variables passes the 0.05 level significance test; otherwise, it means that the correlation is not significant.
2.3.5 NEP trend analysis
The trend of the NEP long-time series was analyzed using the Theil-Sen (Sen) median analysis combined with the Mann-Kendall (M-K) test method. Sen median analysis is a robust nonparametric trend statistical method (Cai and Yu, 2009), and its calculation formula is as Equation 16:
Where
Sen median analysis lacks a statistical significance test for trend analysis, thus the M-K test was employed for evaluation. The M-K test is a non-parametric statistical test that can be utilized to determine the presence of a significant trend in a time series. The formula for the M-K test is as Equations 17–19:
Where n ≥ 10 indicates a normal distribution for the statistic S, with S representing the test statistic, n denoting the length of the time series, sgn indicating the symbolic function, and Var(S) representing variance. For this study’s time series length of 21 (2001–2021), after standardizing the test statistics, the calculation by Equation 20.
The threshold of the test statistic Z is set under various significance levels to determine the statistical significance of the trend. Specifically, when |Z| exceeds 1.96, it indicates that the trends pass the significance test at the confidence level of 95%.
2.3.6 NEP driver analysis
The method of partial derivative correlation was employed to quantitatively assess the respective contributions of climate factors and human activity factors to NEP (Liu and Sun, 2016). The calculation formula is provided as Equation 21.
Where
Here,
The specific discrimination method and contribution rate calculation are shown in Table 2:
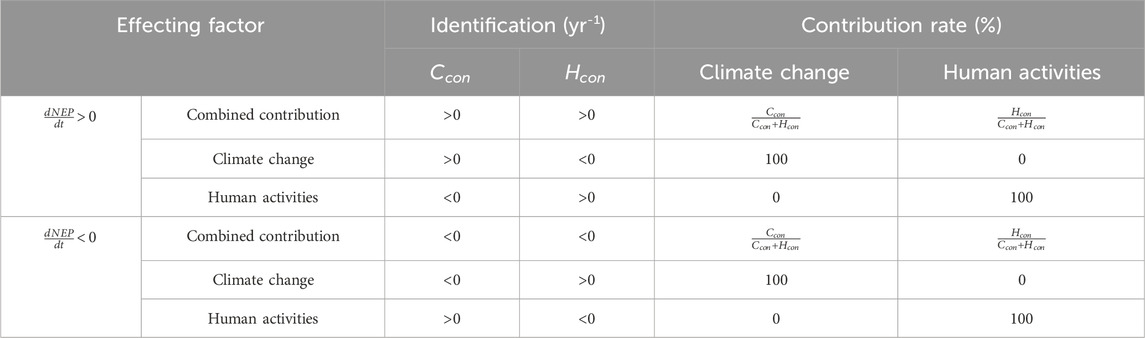
Table 2. Method for identifying primary factors influencing NEP changes in Inner Mongolia and the calculation principle for contribution rates.
3 Results
3.1 Model validation
In this study, the NPP values were estimated using two approaches: one based on MODIS NPP data and the other based on the CASA model. These NPP estimates were then coupled with the
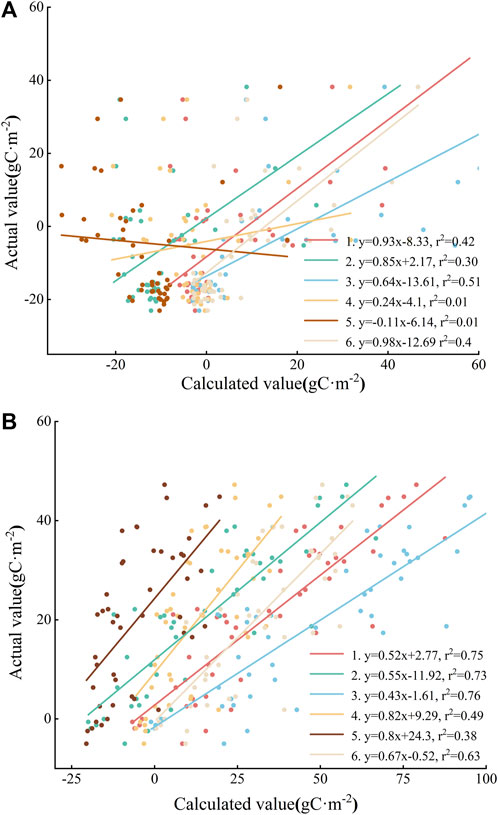
Figure 3. Comparison of calculated and measured NEP values across various grassland types (A). Desert grassland, (B). Typical grassland 1. Formula (1) + (9); 2. Formula (1) + (10) + (12); 3. Formula (1) + (10) + (11); 4. Formula (3) + (9); 5. Formula (3) + (10) + (12); 6. Formula (3) + (10) + (11)
3.2 NEP spatiotemporal distribution in Inner Mongolia
3.2.1 Interannual spatiotemporal distribution of NEP in Inner Mongolia
Figure 4 illustrates the interannual and spatial distribution of NEP in Inner Mongolia from 2001 to 2021. Over the past 21 years, the overall NEP has shown an increasing trend. The mean annual NEP ranged between 114.96 and 201.05 gC·m−2·a−1, with an annual average of 168.73 gC·m−2·a−1. The minimum value was observed in 2001, while the maximum occurred in 2018, indicating distinct interannual variability with an annual trend of 0.91. Spatially, NEP in Inner Mongolia exhibits a pattern of higher values in the northeast and lower values in the southwest, reflecting clear regional differences. Furthermore, different ecosystem types exhibit varying levels of NEP, with forests > cropland > grassland having corresponding annual averages of 419.14 gC·m−2·a−1, 228.19 gC·m−2·a−1, and 158.48 gC·m−2·a−1.
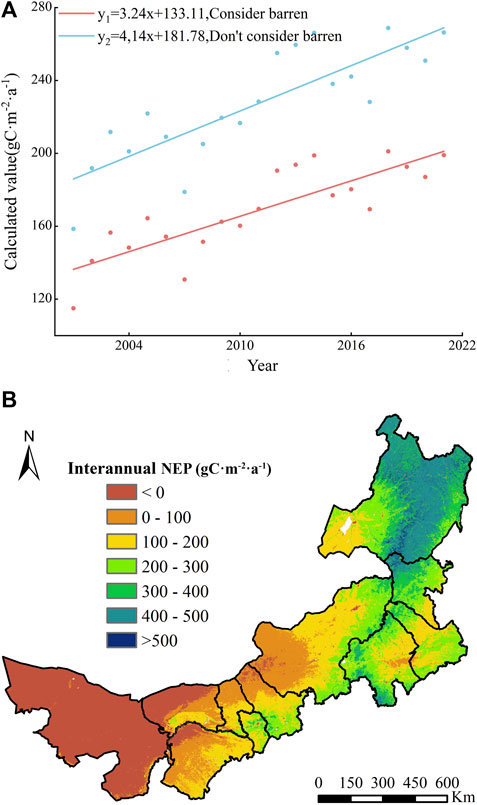
Figure 4. Spatial and temporal variation trend of interannual NEP in Inner Mongolia (A) Temporal scale; (B) Spatial scale.
3.2.2 Spatial and temporal distribution of NEP during the growing season in Inner Mongolia
The vegetation growth season in Inner Mongolia was defined as May to September. The spatial and temporal NEP distribution during this period was analyzed, as illustrated in Figures 5, 6.
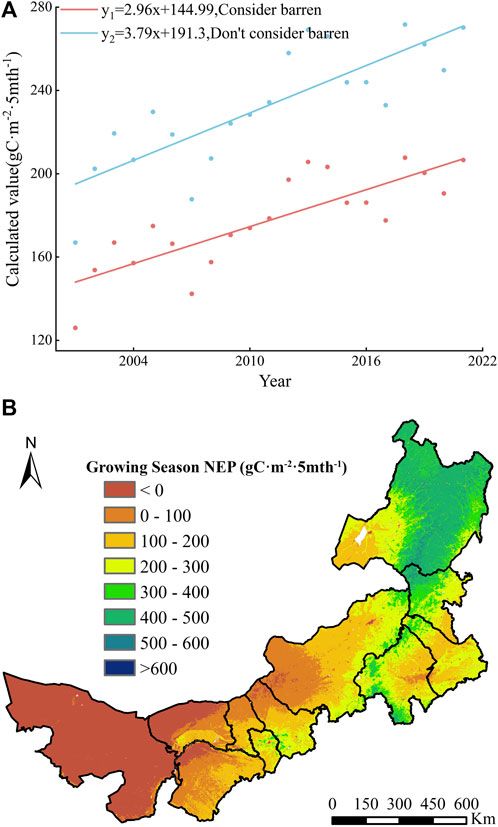
Figure 5. Spatial and temporal variation of NEP in Inner Mongolia during the growing season (A) Temporal scale; (B) Spatial scale.
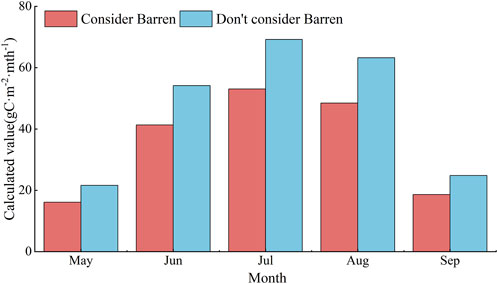
Figure 6. Monthly average NEP during the growing season.
The long-term average NEP values throughout the growing season range from 125.96 to 207.69 gC·m−2·5 mth−1, peaking in July at 53.04 gC·m−2·mth−1, marking a significant carbon sink phase. Spatial analysis indicates that NEP patterns during the growing season remain consistent across years, with distinct regional characteristics. Specifically, different ecosystem types show a hierarchy of NEP as in the following order: forest > cropland > grassland, with corresponding monthly averages of 84.81, 46.41, and 32.95 gC·m−2·mth−1.
3.2.3 Interannual and growing season variation of NEP in Inner Mongolia
To further quantify the temporal variation trend of NEP in Inner Mongolia from 2001 to 2021, both the M-K test and the Sen median estimator were employed. These methods were used to investigate the interannual and seasonal growth patterns at a regional level as illustrated in Figure 7. NEP exhibits pronounced spatial differences, with a general trend of “higher in the northeast and lower in the southwest.” Moreover, forests demonstrate the highest upward trend followed by grassland and cropland. Due to the unfavorable vegetation site conditions in barren areas, NEP tends to be predominantly negative. Consequently, the results for the entire region are significantly influenced by the NEP in western barren areas, both during the growing season and throughout the year. Moreover, an overall weak or downward trend was observed. Significance tests reveal that, except for the western barren area which did not meet a significance level of 0.05, all other regions exhibited significant changes in trend. Therefore, our subsequent analysis will primarily focus on NEP variations within vegetated areas while omitting a detailed examination of the western barren.
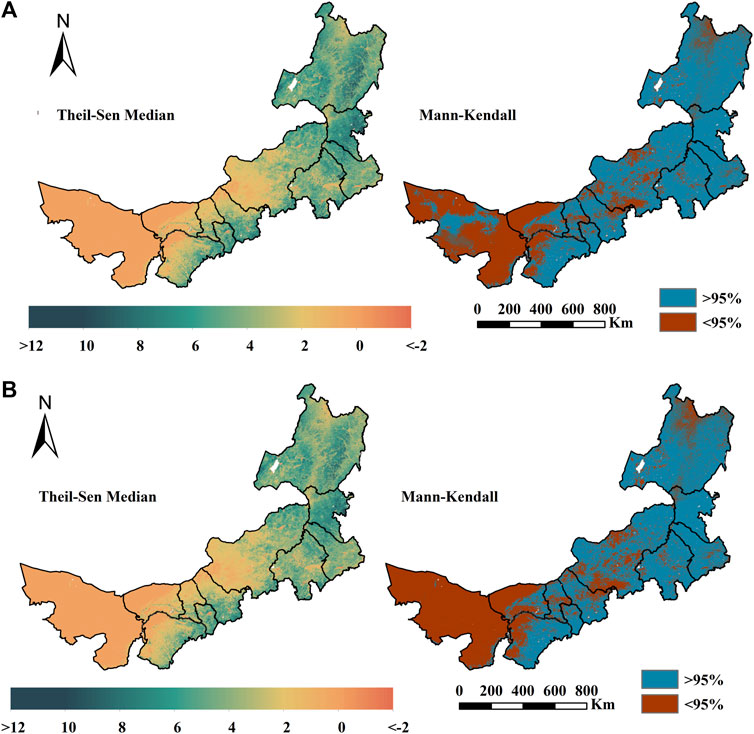
Figure 7. The trend of NEP variations and its significance test in Inner Mongolia (A) interannual, (B). Growing season.
3.3 Analysis of NEP drivers in Inner Mongolia
3.3.1 Correlation analysis
The spatial and average correlation coefficients between NEP and meteorological driving factors (PRE, TEM, SOL, and PET) in Inner Mongolia are illustrated in Figures 8, 9.
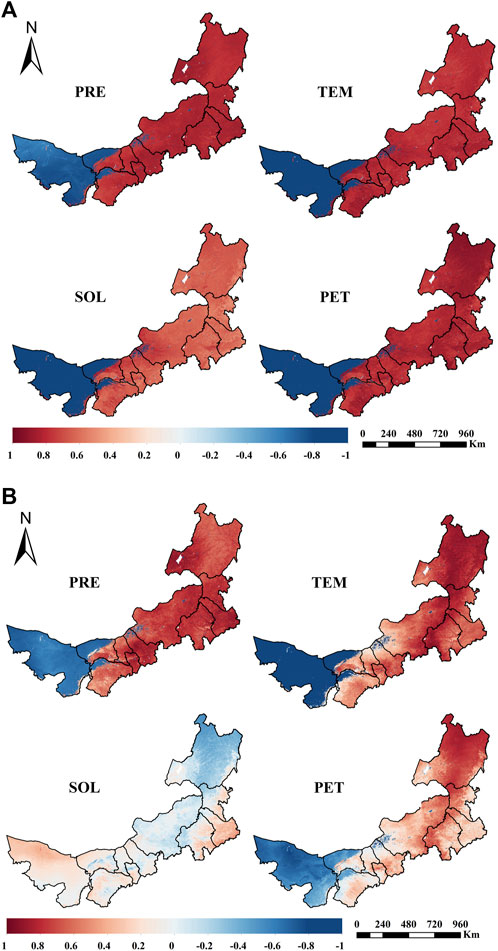
Figure 8. Spatial correlation between NEP and various meteorological factors (A). Interannual, (B). Growing season.
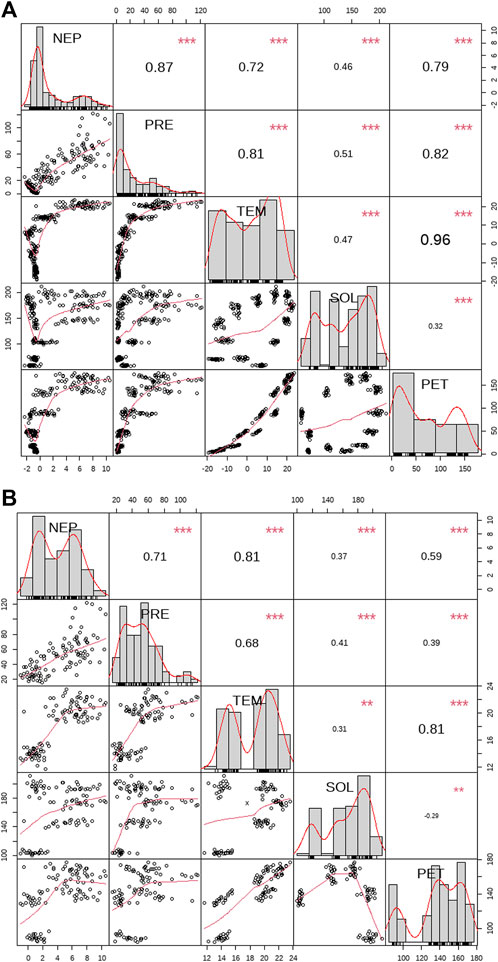
Figure 9. The correlation coefficient between NEP and various meteorological factors (A). Interannual, (B). Growing season (The red * represents the significance level of the correlation between variables. ** indicate a significance level of p < 0.01; and *** indicate a significance level of p < 0.001.).
NEP exhibits a positive correlation with various meteorological factors, except for certain areas in barren and desert grasslands. Particularly, in the eastern part of the forest and grassland areas, NEP demonstrates the most significant positive response to meteorological factors. Conversely, cultivated land displays a weak positive correlation with these factors. Notably, the disparity between PET and TEM manifests itself as the most pronounced difference. There was a weak to moderate negative correlation between NEP and meteorological factors in the barren grasslands located at the Yinshanbeilu in central and western China. Specifically, during the growing season, there was a significant decrease in the correlation between SOL and PET with NEP. Additionally, the positive interannual effect observed in certain regions during this period was hindered due to the influences of regional underlying surface conditions. The impact of PRE on NEP differs across different land types, with grassland and cultivated land being more affected compared to forest areas. Conversely, TEM and PET exhibit an opposite trend. Based on the correlation coefficients, PRE shows the strongest correlation (0.868), followed by PET and TEM (0.785 and 0.721, respectively), while SOL demonstrates the weakest correlation (0.456). During the growing season, TEM exhibits the highest correlation (0.811), followed by PRE (0.709), PET (0.588), and SOL (0.371).
3.3.2 Contribution analysis
① Contribution rate of climate factors to NEP change. To further investigate the contributions of climate factors and human activities to changes in NEP in Inner Mongolia, we employed the partial derivative correlation analysis. The contribution rates of meteorological factors to NEP during the interannual and growing seasons are illustrated in Figure 10. It is evident that on the interannual scale, PRE has the greatest contribution to forest and meadow areas in the eastern region, while the impact of NEP on TEM-coupled PRE is more significant in the western region. The contribution rate of PET to NEP remains unstable due to its comprehensive dependence on vegetation conditions, TEM, and SOL. In certain cultivated land and desert grassland areas, there is a transition from positive to negative contribution to NEP. Throughout the growing season, the impact of PRE on forests and grasslands in eastern China was paramount, while the influence of PET significantly diminished in comparison to interannual variations. The contribution of SOL to the NEP changes in the eastern forest and grassland areas was more significant. However, the contribution of the TEM is low, and the changing trend of spatial distribution is not significant.
② Contribution of climate factors and human activities to NEP. Table 3 shows the contribution of climate factors and human activity to NEP changes in Inner Mongolia (Positive and negative denote positive and negative contribution effects, respectively). The primary drivers of interannual NEP variation in the study area, excluding the western barren, are predominantly climate-related, with human activities contributing 24% to this change. There are some differences between the driving factors of the growing season and the interannual ones. The influence of climate factors and human activities on NEP in the study area is 45.36% and 54.64%, respectively. PRE is the main factor affecting NEP during the growth season in Inner Mongolia, and the contribution rate of TEM and SOL to the region as a whole has a certain inhibitory effect.
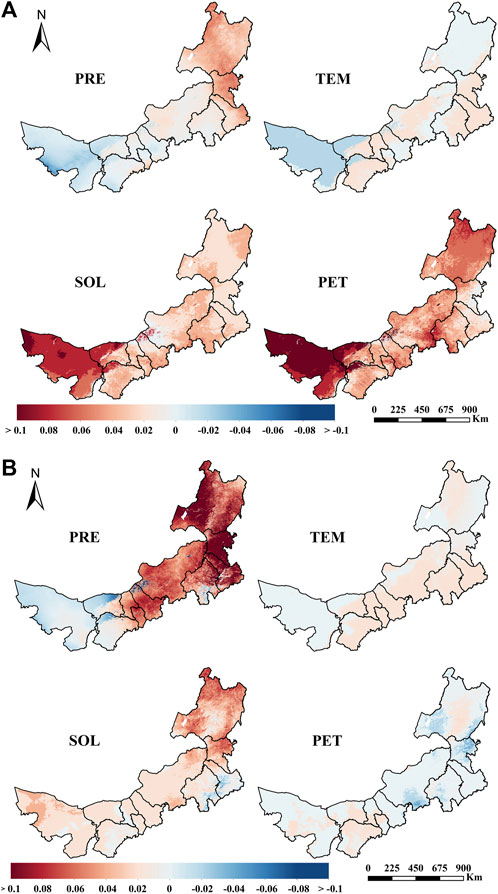
Figure 10. Contribution of meteorological factors to NEP (A). Interannual, (B). Growing season.
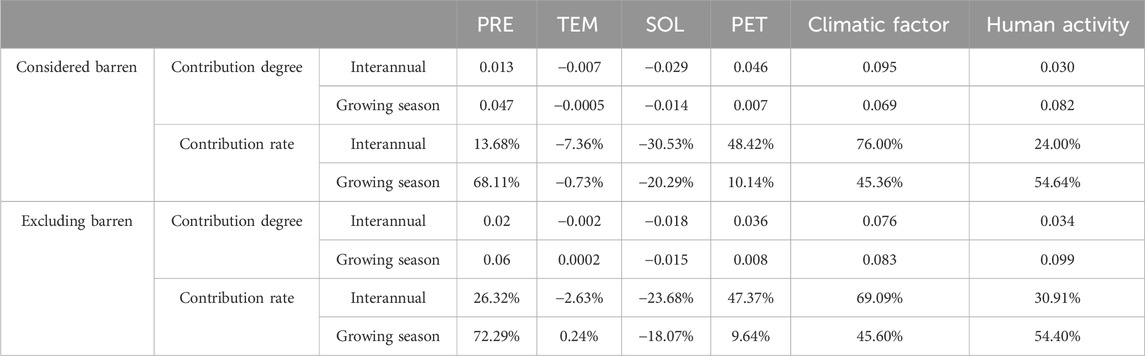
Table 3. 2001–2021 Contribution magnitude and rate of each factor in Inner Mongolia.
Considering the potential impact of NEP instability on research outcomes in the western barren region, this study provides a supplementary analysis of climate factors and human activities on NEP in non-vegetated barren areas. As presented in Table 3 it is evident that human activities have significantly contributed to changes in NEP, while rainfall has shown a significant influence among climate factors.
Figure 11 illustrates the contribution of various influencing factors to NEP in Inner Mongolia, with positive and negative areas distinguished. Human activities and climate factors make up over 60% of the positive contribution to NEP in Inner Mongolia, while the negative impact of climate change on NEP surpasses that of the human activities. The most significant negative contributions come from SOL and TEM, whereas more than 80% of PRE can promote regional NEP changes.
③ Analysis of driving factors of NEP change in Inner Mongolia. The primary driving factors behind the NEP spatial change trend in Inner Mongolia were examined, as illustrated in Figure 12, by integrating the classification criteria of contribution rate of different driving factors presented in Table 2. It can be seen that climate change and human activities have impacted over 60% of Inner Mongolia, primarily concentrated in the eastern and southern regions. Furthermore, a decrease of approximately 20% in NEP was attributed to climate factors, mainly occurring in the western barren area. The increase of NEP in the Yinshanbeilu and west of Ordos is predominantly influenced by climate factors, while human activities dominate the rise of NEP in southwest Alashan and south Ordos.
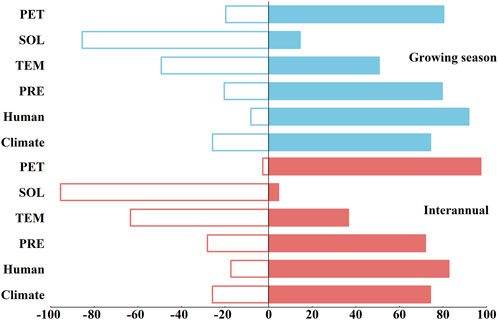
Figure 11. The ratio of positive to negative contribution areas of each influencing factor to NEP.
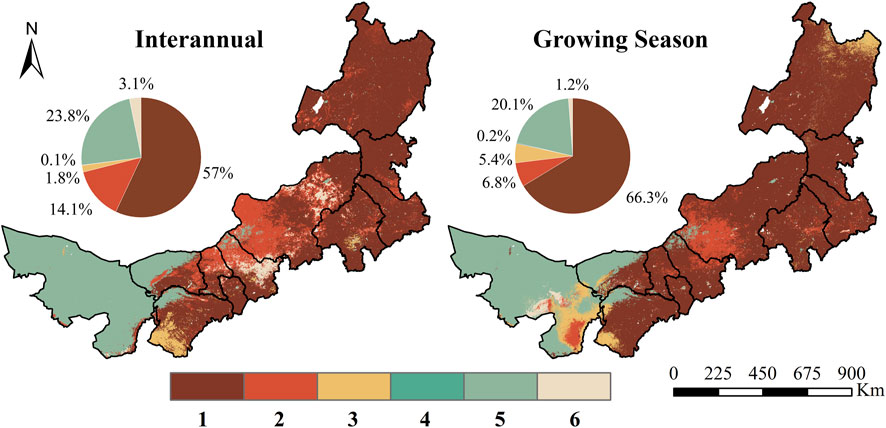
Figure 12. The dominant factors of annual and growing season NEP in Inner Mongolia from 2001 to 2021 (1. NEP increases due to climate and human factors; 2. NEP increases due to climate factors; 3. NEP increases due to human activities; 4. NEP decreases due to climate and human factors; 5. NEP decrease due to climate; 6. NEP decrease due to human factors).
4 Discussion
4.1 Uncertainty analysis of NEP estimation
In this paper, based on different estimation models of NPP and soil heterotrophic respiration, the NEP values of vegetation net primary productivity in the study area from 2001 to 2021 was derived under the six combination models, and it was found that the NEP values obtained from the results of different models had large deviations. This is because changes in NEP are jointly influenced by NPP and soil heterotrophic respiration and by a combination of controlling variables such as vegetation cover, SOL, PRE, TEM, PET, subsurface characteristics, soil organic carbon density, etc. Existing studies of NEP are mainly based on soil monitoring, remote sensing inversion, and model simulation, and these data sources have limitations in terms of accuracy and generality. The NEP values obtained from ground monitoring are insufficient to encompass the entire study area; the NEP derived from remote sensing inversion is influenced by cloud cover and atmospheric conditions, while the NPP estimation model is constrained by variations in spatial and regional scales across different models, the resolution of remote sensing data, pre-processing techniques, and the impact of parameter weighting, among other factors. Consequently, discrepancies persist in the regional boundaries and parameter rates of various land covers, including forests, grasslands, and croplands, as well as at the global scale. The estimation of
4.2 Spatiotemporal variation trends of NEP
In terms of time trends, the NEP of Inner Mongolia shows an overall upward trend from 2001 to 2021, which is consistent with the findings of Zhai et al. (2024) and Liang et al. (2023). This is partly due to a series of ecological restoration and management projects implemented in Inner Mongolia since 1978, such as the “Three North” Protective Forest Project, the Beijing-Tianjin Wind and Sand Source Management Project, the Grassland Ecological Protection and Restoration Project, the Soil and Water Conservation and Desertification Management Project, etc., which have resulted in significant vegetation restoration in Inner Mongolia (Kang et al., 2021). On the one hand, the increase in vegetation cover has increased vegetation photosynthesis and carbon sequestration capacity of regional ecosystems. On the other hand, It has mitigated soil erosion to some degree, enhanced soil organic carbon levels, and diminished carbon emissions from soil disturbances, increasing NEP (Sha et al., 2022; Qiu et al., 2021; Tian et al., 2022). Conversely, NEP in western Inner Mongolia exhibited no significant alterations or a declining trend, as this region predominantly comprises desert grasslands and barrens, characterized by minimal vegetation cover and reduced carbon sequestration capacity, while elevated soil temperatures augmented microbial respiration. This results in the release of more soil carbon into the atmosphere in the form of carbon dioxide, coupled with a fragile regional ecological environment and a more pronounced response to extreme climatic events such as drought, all of which can lead to a decline in NEP (Guan et al., 2021).
Annual carbon sequestration by vegetation occurs in the growing season. Because soil microorganisms are active in the growing season due to higher TEM and high PRE, the carbon sequestration capacity is significantly higher than in the non-growing season (Yun et al., 2022). The variation in NEP throughout the growing season is the primary factor affecting the annual regional change in NEP. The significant decrease in NEP values in the study area in 2007, 2010, and 2016 was due to extreme drought events in these years, where low PRE and high TEM resulted in the closure or partial closure of plant stomata, limiting carbon dioxide uptake and reducing the rate of photosynthesis (Kapoor et al., 2020; Hu et al., 2023). Furthermore, higher TEM can expedite soil organic matter decomposition and augment soil respiration, leading to a decreased NEP.
The present study also unveiled substantial spatial heterogeneity in the vegetation’s carbon sequestration capacity within Inner Mongolia, exhibiting a distinct east-west distribution pattern that corresponds to the regional underlying vegetation types. These findings are consistent with previous investigations conducted by Zhai et al. (2024) and Hao et al. (2023). Furthermore, the investigated areas displayed notable disparities in both vegetation types and carbon sequestration capacity, which were influenced by various meteorological factors such as mean TEM, PRE, and elevation. The overall ranking of these characteristics was as follows: forest > grassland > cropland > impervious > barren; within the grassland ecosystem, meadow steppe surpassed typical steppe and barren steppe.
4.3 Analysis of driving factors influencing carbon sink/source
Climate change is one of the key factors affecting the productivity level of vegetation. Some scholars believe that TEM and PRE are the most dominant factors affecting the change of vegetation carbon cycle (Wei et al., 2014). Some scholars conclude that SOL and PET also have an important effect on vegetation carbon sequestration capacity, while TEM has a relatively small effect on vegetation carbon sequestration capacity (Li et al., 2020). Therefore, in this study, four key factors (PRE, TEM, SOL, and PET) affecting the changes in NEP were screened for the analysis of climate-driven factors. Different climate factors have different effects on the vegetative carbon sequestration capacity. PRE supplies the requisite water for vegetative growth, and enhances plant productivity and biomass, thereby augmenting the carbon sequestration potential of vegetation. In Inner Mongolia, is mostly arid or semi-arid, and water is the main factor limiting vegetation growth (WEI et al., 2014; Zhang et al., 2019). TEM can change the activity of plant enzymes, which in turn affects the vegetative photosynthesis rate and its carbon sequestration capacity. Generally, elevated TEM enhance plant photosynthesis; however, the relationship between photosynthesis rate and TEM is not linear. If TEM surpass the optimal range for plant growth, they may inhibit photosynthesis, leading to a reduction in Net Ecosystem Production (Moore et al., 2021). SOL can affect the photosynthesis active radiation received by the plant. PET has an impact on plant photosynthesis by affecting vegetation transpiration and soil moisture (Post et al., 1992). According to the analyses in this study, PRE is the main meteorological factor affecting NEP changes in Inner Mongolia.
Positive anthropogenic contributions can significantly increase the carbon sequestration capacity of vegetation, while negative anthropogenic activities have a decreasing effect. This study shows that more than 90% of the anthropogenic contributions in Inner Mongolia are positive, as can be seen from the land transfer matrix from 2000 to 2020 (Table 4).
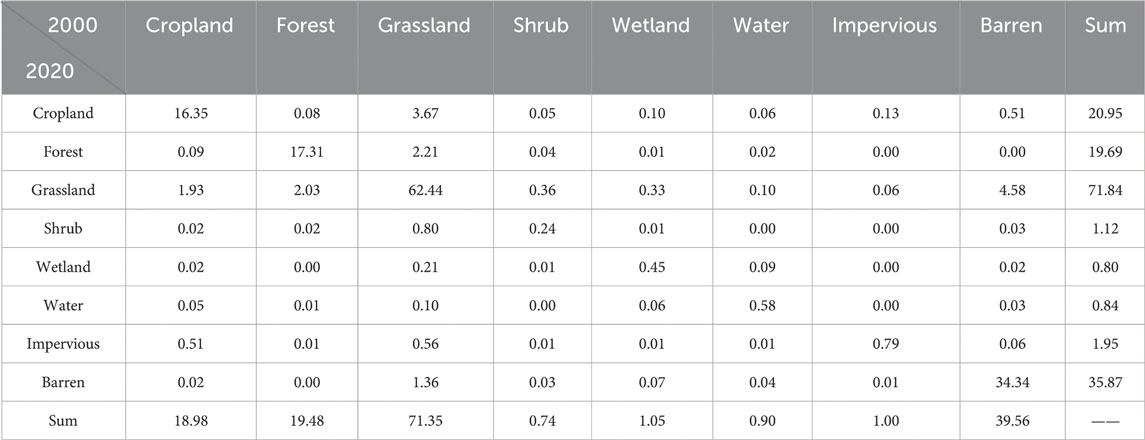
Table 4. Land transfer matrix table (unit:104km2).
The area of cropland, forest, grassland, and shrubland increased by 10.36%, 1.08%, 0.69%, and 52. 2% while the bare land area decreased by 9.33%. This indicates the importance of the Inner Mongolia Sand Control Project which has improved the regional ecosystem environment. These measures have played an important role in the increase of vegetation NEP, reflecting the positive role of human activities. A major negative role of human activities is manifested in the degradation of grassland due to overgrazing and intense grazing which have led to the degradation of the aboveground biomass. Land degradation has resulted in the reduction of grassland productive capacity. Some scholars found that the changes in grassland ecosystems in Inner Mongolia from 1999 to 2015 were mainly due to human activities by as much as 78.8% (Wang et al., 2021). This suggests that although China has implemented ecological protection and construction projects such as “returning pasture to grass” and “natural grassland protection” in grassland areas, many areas are still in a state of overgrazing.
5 Conclusion
This study utilized monthly multi-source remote sensing data, meteorological data, and ground-measured carbon flux data from 2001 to 2021 in Inner Mongolia. The CASA model, MODIS NPP data, and the
1) The NEP model, which integrates MODIS NPP products with the GSMSR model and the
2) The annual average NEP in Inner Mongolia from 2001 to 2021 was 168.73 gC·m−2·a−1. The multi-year average NEP during the growing season was 177.57 gC·m−2·5 mth−1. The seasonal variation in NEP was distinct, with the region acting as a carbon sink from May to September and as a carbon source during the remaining months. There was a seasonal transition between carbon sink and source behavior. The peak NEP value occurred in July, reaching 53.04 gC·m−2·mth−1. Due to ecological restoration and management efforts, NEP showed a fluctuating upward trend, with vegetation conditions improving year by year.
3) The large east-west extent of Inner Mongolia and the diverse climatic conditions led to significant spatial heterogeneity in NEP. Vegetation ecosystems showed higher density in the northeastern regions compared to the sparser southwestern areas. The arid western region, experiencing warming and drying trends, exhibited a tendency toward carbon source behavior, substantially influencing both annual and growing season NEP patterns.
4) All Climatic conditions collectively influence the magnitude and variation of NEP. Based on correlation coefficients, PRE emerged as the primary meteorological driver of interannual NEP variations in Inner Mongolia. TEM and PRE during the growing season jointly influenced NEP. In terms of contribution rates, PRE remained the dominant meteorological factor affecting NEP changes in the study area.
5) When considering barren and non-barren areas, the contribution rates of climate change and human activities to NEP variations were relatively similar. Over 55% of areas with increasing NEP were influenced by both climate change and anthropogenic activities, predominantly located in the eastern and south-central regions of Inner Mongolia. In contrast, climate factors were the primary drivers of the approximately 20% decline in NEP, mainly observed in the arid western regions of Inner Mongolia.
Data availability statement
The original contributions presented in the study are included in the article/Supplementary Material, further inquiries can be directed to the corresponding authors.
Author contributions
SC: Writing – original draft. SZ: Conceptualization, Funding acquisition, Writing – review and editing. CL: Formal Analysis, Supervision, Writing – review and editing. YW: Data curation, Validation, Writing – review and editing. TK: Supervision, Writing – review and editing. MZ: Resources, Software, Writing – review and editing.
Funding
The author(s) declare that financial support was received for the research and/or publication of this article. We acknowledge the financial support from the IWHR Research & Development Support Program (No. MKKH2024JK020, No. MK0145B022021), First-Class Discipline Research Special Project (YLXKZX-NSD-027), the Inner Mongolia Autonomous Region Science and Technology Support Program (No. 2023JBGS0007, No. 2024MS04002, No. 2023YFSH0002, No. 2023MS05023), the Basic Scientific Research Business Fee of Directly-affiliated Universities in Inner Mongolia Autonomous Region (No. BR231516), the IWHR Internationally-oriented Talents Program, and the Inner Mongolia Autonomous Region’s Start-up Support Program Project for Returned Overseas Students’ Innovation and Entrepreneurship.
Acknowledgments
We would like to thank Editage (www.editage.cn) for English language editing, thank Professor Shusen Wang from the Remote Sensing Center of Canada for review & editing, and validation.
Conflict of interest
The authors declare that the research was conducted in the absence of any commercial or financial relationships that could be construed as a potential conflict of interest.
Generative AI statement
The author(s) declare that no Generative AI was used in the creation of this manuscript.
Publisher’s note
All claims expressed in this article are solely those of the authors and do not necessarily represent those of their affiliated organizations, or those of the publisher, the editors and the reviewers. Any product that may be evaluated in this article, or claim that may be made by its manufacturer, is not guaranteed or endorsed by the publisher.
References
Ahlström, A., Raupach, M. R., Schurgers, G., Smith, B., Arneth, A., Jung, M., et al. (2015). The dominant role of semi-arid ecosystems in the trend and variability of the land CO2 sink. Science 348 (6237), 895–899. doi:10.1126/science.aaa1668
Bai, Y., and Cotrufo, M. F. (2022). Grassland soil carbon sequestration: Current understanding, challenges, and solutions. Science 377 (6606), 603–608. doi:10.1126/science.abo2380
Balasubramanian, D., Zhou, W. J., Ji, H. L., Grace, J., Bai, X. L., Song, Q. H., et al. (2020). Environmental and management controls of soil carbon storage in grasslands of southwestern China. J. Environ. Manag. 254, 109810. doi:10.1016/j.jenvman.2019.109810
Bejagam, V., and Sharma, A. (2022). Impact of climatic changes and anthropogenic activities on ecosystem net primary productivity in India during 2001–2019. Ecol. Inf. 70, 101732. doi:10.1016/j.ecoinf.2022.101732
Berg, P., Huettel, M., Glud, R. N., Reimers, C. E., and Attard, K. M. (2022). Aquatic eddy covariance: the method and its contributions to defining oxygen and carbon fluxes in marine environments. Annu. Rev. Mar. Sci. 14 (1), 431–455. doi:10.1146/annurev-marine-042121-012329
Bond-Lamberty, B., Wang, C., and Gower, S. T. (2004). A global relationship between the heterotrophic and autotrophic components of soil respiration. Glob. Change Biol. 10 (10), 1756–1766. doi:10.1111/j.1365-2486.2004.00816.x
Cai, B., and Yu, R. (2009). Advance and evaluation in the long time series vegetation trends research based on remote sensing. J. Remote Sens. 13 (6), 1170–1186. doi:10.11834/jrs.20090614
Cao, S., He, Y., Zhang, L., Sun, Q., Zhang, Y., Li, H., et al. (2023). Spatiotemporal dynamics of vegetation net ecosystem productivity and its response to drought in Northwest China. GIScience and Remote Sens. 60 (1), 2194597. doi:10.1080/15481603.2023.2194597
Cao, Y., Sun, Y., Jiang, Y., and Wan, J. (2022). Analysis on temporal-spatial variations and driving factors of net ecosystem productivity in the Yellow River Basin. Ecol. Environ. 31 (11), 2101. doi:10.16258/j.cnki.1674-5906.2022.11.001
Chen, Z., Zhu, Z., Zhang, X., Jiao, Y., Cheng, Y., Wang, S., et al. (2024). Study on spatio-temporal evolution of ecosystem services, spatio-temporal pattern of tradeoff/synergy relationship and its driving factors in Shendong mining area. Front. Environ. Sci. 12, 1445833. doi:10.3389/fenvs.2024.1445833
Ding, S., Sun, Q., Guo, Y., and Wei, X. (2025). The spatiotemporal evolution and prediction of vegetation NPP in the Huangshui river basin of Qilian Mountains. Front. Environ. Sci. 12, 1459669. doi:10.3389/fenvs.2024.1459669
Guan, C., Zhang, P., Zhao, C., and Li, X. (2021). Effects of warming and rainfall pulses on soil respiration in a biological soil crust-dominated desert ecosystem. Geoderma 381, 114683. doi:10.1016/j.geoderma.2020.114683
Hao, L., Zhai, Y., Qi, W., and Lan, Q. (2023). Spatial-temporal dynamics of vegetation carbon sources/sinks in Inner Mongolia from 2001 to 2020 and its response to climate change. Ecol. Environ. 32 (5), 825. doi:10.16258/j.cnki.1674-5906.2023.05.001
Hou, Q., Yang, H., Wu, J., and Yu, X. (2023). Carbon budget response to climate change varies with grassland type in Qilian Mountains, China. Glob. Ecol. Conservation 47, e02670. doi:10.1016/j.gecco.2023.e02670
Hu, L., Wang, Z., Huang, M., Sun, H., and Wang, Q. (2023). A remote sensing based method for assessing the impact of O3 on the net primary productivity of terrestrial ecosystems in China. Front. Environ. Sci. 11, 1112874. doi:10.3389/fenvs.2023.1112874
Huang, C., Sun, C., Nguyen, M., Wu, Q., He, C., Yang, H., et al. (2023a). Spatio-temporal dynamics of terrestrial Net ecosystem productivity in the ASEAN from 2001 to 2020 based on remote sensing and improved CASA model. Ecol. Indic. 154, 110920. doi:10.1016/j.ecolind.2023.110920
Huang, Y., Wang, F., Zhang, L., Zhao, J., Zheng, H., Zhang, F., et al. (2023b). Changes and net ecosystem productivity of terrestrial ecosystems and their influencing factors in China from 2000 to 2019. Front. Plant Sci. 14, 1120064. doi:10.3389/fpls.2023.1120064
IPCC (2023). “Climate change 2023: synthesis report. Contribution of Working groups I, II, and III to the Sixth assessment report of the Intergovernmental Panel on climate change Core Writing Team,”. Editors H. Lee, and J. Romero (Geneva, Switzerland: IPCC), 35–115.
Jiang, Y., Zhang, Q., Niu, J., and Wu, J. (2019). Pastoral population growth and land use policy has significantly impacted livestock structure in Inner Mongolia—a case study in the Xilinhot region. Sustainability 11 (24), 7208. doi:10.3390/su11247208
Kang, Y., Guo, E., Wang, Y., Bao, Y., Bao, Y., and Mandula, N. (2021). Monitoring vegetation change and its potential drivers in Inner Mongolia from 2000 to 2019. Remote Sens. 13 (17), 3357. doi:10.3390/rs13173357
Kapoor, D., Bhardwaj, S., Landi, M., Sharma, A., Ramakrishnan, M., and Sharma, A. (2020). The impact of drought in plant metabolism: How to exploit tolerance mechanisms to increase crop production. Appl. Sci. 10 (16), 5692. doi:10.3390/app10165692
Kelong, C., Yanli, H., Sheng-kui, C., Jin, M. S., Guangchao, C., and Hui, L. (2011). The study of vegetation carbon storage in Qinghai lake valley based on remote sensing and CASA model. Procedia Environ. Sci. 10, 1568–1574. doi:10.1016/j.proenv.2011.09.249
Lees, K. J., Quaife, T., Artz, R. R. E., Khomik, M., and Clark, J. M. (2018). Potential for using remote sensing to estimate carbon fluxes across northern peatlands–A review. Sci. Total Environ. 615, 857–874. doi:10.1016/j.scitotenv.2017.09.103
Li, L., Zha, Y., Zhang, J., Li, Y., and Lyu, H. (2020). Effect of terrestrial vegetation growth on climate change in China. J. Environ. Manag. 262, 110321. doi:10.1016/j.jenvman.2020.110321
Li, X., Lin, G., Jiang, D., Fu, J., and Wang, Y. (2022). Spatiotemporal evolution characteristics and the climatic response of carbon sources and sinks in the Chinese grassland ecosystem from 2010 to 2020. Sustainability 14 (14), 8461. doi:10.3390/su14148461
Liang, L., Wang, Q., Qiu, S., Geng, D., and Wang, S. (2023). NEP estimation of terrestrial ecosystems in China using an improved CASA model and soil respiration model. IEEE J. Sel. Top. Appl. Earth Observations Remote Sens. 16, 10203–10215. doi:10.1109/jstars.2023.3325774
Liu, L., Sayer, E. J., Deng, M., Li, P., Liu, W., Wang, X., et al. (2022). The grassland carbon cycle: mechanisms, responses to global changes, and potential contribution to carbon neutrality. Fundam. Res. 3 (2), 209–218. doi:10.1016/j.fmre.2022.09.028
Liu, M., Dries, L., Huang, J., Min, S., and Tang, J. (2019). The impacts of the eco-environmental policy on grassland degradation and livestock production in Inner Mongolia, China: an empirical analysis based on the simultaneous equation model. Land Use Policy 88, 104167. doi:10.1016/j.landusepol.2019.104167
Liu, W., and Sun, F. (2016). Assessing estimates of evaporative demand in climate models using observed pan evaporation over China. J. Geophys. Res. Atmos. 121 (14), 8329–8349. doi:10.1002/2016jd025166
Lu, X., Chen, Y., Sun, Y., Xu, Y., Xin, Y., and Mo, Y. (2023). Spatial and temporal variations of net ecosystem productivity in Xinjiang Autonomous Region, China-based on remote sensing. Front. Plant Sci. 14, 1146388. doi:10.3389/fpls.2023.1146388
Mendes, K. R., Campos, S., da Silva, L. L., Mutti, P. R., Ferreira, R. R., Medeiros, S. S., et al. (2020). Seasonal variation in net ecosystem CO2 exchange of a Brazilian seasonally dry tropical forest. Sci. Rep. 10 (1), 9454. doi:10.1038/s41598-020-66415-w
Meng, Z., Dang, X., Gao, Y., Meng, Z., Dang, X., and Gao, Y. (2020). Land degradation action plan in Inner Mongolia. Public-private Partnersh. desertification control Inn. Mong., 171–194. doi:10.1007/978-981-13-7499-9_6
Moore, C. E., Meacham-Hensold, K., Lemonnier, P., Slattery, R. A., Benjamin, C., Bernacchi, C. J., et al. (2021). The effect of increasing temperature on crop photosynthesis: from enzymes to ecosystems. J. Exp. Bot. 72 (8), 2822–2844. doi:10.1093/jxb/erab090
Ouyang, X., Wang, J., Chen, X., Zhao, X., Ye, H., Watson, A. E., et al. (2021). Applying a projection pursuit model for evaluation of ecological quality in Jiangxi Province, China. Ecol. Indic. 133, 108414. doi:10.1016/j.ecolind.2021.108414
Pei, Z. Y., Ouyang, H., Zhou, C. P., and Xu, X. L. (2009). Carbon balance in an alpine steppe in the Qinghai-Tibet Plateau. J. Integra. Plant. Biol. 51 (5), 521–526. doi:10.1111/j.1744-7909.2009.00813.x
Piao, S. L., Fang, J. Y., and Guo, Q. H. (2001). Application of CASA model to the estimation of Chinese terrestrial net primary productivity. Chin. J. Plant Ecol. 25 (5), 603. Available online at: https://www.plant-ecology.com/EN/Y2001/V25/I5/603
Post, W. M., Pastor, J., King, A. W., and Emanuel, W. R. (1992). Aspects of the interaction between vegetation and soil under global change. Water, Air, Soil Pollut. 64, 345–363. doi:10.1007/bf00477110
Qiu, L., Zhu, H., Liu, J., Yao, Y., Wang, X., Rong, G., et al. (2021). Soil erosion significantly reduces organic carbon and nitrogen mineralization in a simulated experiment. Agric. Ecosyst. and Environ. 307, 107232. doi:10.1016/j.agee.2020.107232
Qiu, S., Liang, L., Geng, D., Wang, Q., Mu, J., and Shi, Y. (2022). Remote sensing estimation of European NEP based on improved CASA model and soil respiration model. 10th Int. Conf. Agro-Geoinformatics (Agro-Geoinformatics), IEEE 2022, 1–6. doi:10.1109/agro-geoinformatics55649.2022.9858994
Qu, S., Wang, L., Lin, A., Yu, D., Yuan, M., and Li, C. (2020). Distinguishing the impacts of climate change and anthropogenic factors on vegetation dynamics in the Yangtze River Basin, China. Ecol. Indic. 108, 105724. doi:10.1016/j.ecolind.2019.105724
Raihan, A., Muhtasim, D. A., Farhana, S., Pavel, M. I., Faruk, O., Rahman, M., et al. (2022). Nexus between carbon emissions, economic growth, renewable energy use, urbanization, industrialization, technological innovation, and forest area towards achieving environmental sustainability in Bangladesh. Energy Clim. Change 3, 100080. doi:10.1016/j.egycc.2022.100080
Sha, Z., Bai, Y., Li, R., Lan, H., Zhang, X., Li, J., et al. (2022). The global carbon sink potential of terrestrial vegetation can be increased substantially by optimal land management. Commun. Earth and Environ. 3 (1), 8. doi:10.1038/s43247-021-00333-1
Shi, Z. (2015). “Spatial-temporal simulation of vegetation carbon sink and its Influential factors based on CASA and GSMSR model,” in Shaanxi Province (Yangling: Northwest A&F University).
Song, C., Wang, G., Hu, Z., Zhang, T., Huang, K., Chen, X., et al. (2020). Net ecosystem carbon budget of a grassland ecosystem in central Qinghai-Tibet Plateau: integrating terrestrial and aquatic carbon fluxes at catchment scale. Agric. For. Meteorology 290, 108021. doi:10.1016/j.agrformet.2020.108021
Song, J., Zhou, L., and Zhou, G. (2023). A dataset of carbon and water fluxes of the temperate desert steppe in Damao Banner, Inner Mongolia (2015–2018). Science Data Bank. doi:10.57760/sciencedb.o00119.00043
Tan, X., Zhang, B., and Chen, S. (2023). A dataset of observational key parameters in carbon and water fluxes in a semi-arid steppe, Inner Mongolia (2012–2020): based on a long-term manipulative experiment of precipitation pattern. Sci. Data Bank. 2023-02-10. doi:10.11922/11-6035.csd.2023.0052.zh
Tang, X., Fan, S., Qi, L., Guan, F., Du, M., and Zhang, H. (2016). Soil respiration and net ecosystem production in relation to intensive management in Moso bamboo forests. Catena 137, 219–228. doi:10.1016/j.catena.2015.09.008
Tian, H., Ji, X., and Zhang, F. (2022). Spatiotemporal variations of vegetation net primary productivity and its response to meteorological factors across the Yellow River Basin during the period 1981–2020. Front. Environ. Sci. 10, 949564. doi:10.3389/fenvs.2022.949564
Wang, C., Zhao, W., and Zhang, Y. (2022a). The change in net ecosystem productivity and its driving Mechanism in a mountain ecosystem of arid regions, northwest China. Remote Sens. 14, 4046. doi:10.3390/rs14164046
Wang, J., Yang, Y., Zuo, C., Gu, F., and He, H. (2021). Impacts of human activities and climate change on gross primary productivity of the terrestrial ecosystems in China. Acta Ecol. Sin. 41 (18), 7085–7099. doi:10.5846/stxb202104130956
Wang, M., Zhao, J., Wang, S., and Chen, B. (2022b). Regional contributions and climate attributions to interannual variation of global net ecosystems production by an ECOSYSTEM processed model driven by remote sensing data over the past 35 years. Remote Sens. 14 (13), 3208. doi:10.3390/rs14133208
Wei, Z. F., Ren, Z. Y., and Zhang, C. (2014). Changes of vegetation cover and its correlation with precipitation and temperature in Northwest China. Bull. Soil Water Conservation 34 (3), 283–289. doi:10.13961/j.cnki.stbctb.2014.03.056
Wu, L., Wang, S., Bai, X., Tian, Y., Luo, G., Wang, J., et al. (2020). Climate change weakens the positive effect of human activities on karst vegetation productivity restoration in southern China. Ecol. Indic. 115, 106392. doi:10.1016/j.ecolind.2020.106392
Xu, M., Guo, B., and Zhang, R. (2024). Variations of terrestrial net ecosystem productivity in China driven by climate change and human activity from 2010 to 2020. Forests 15, 1484. doi:10.3390/f15091484
Yu, G., Zheng, Z., Wang, Q., Fu, Y., Zhuang, J., Sun, X., et al. (2010). Spatiotemporal pattern of soil respiration of terrestrial ecosystems in China: the development of a geostatistical model and its simulation. Environ. Sci. and Technol. 44 (16), 6074–6080. doi:10.1021/es100979s
Yu, G., Zhu, J., Li, X., and He, N. (2022). Technological approaches to enhance ecosystem carbon sink in China: Nature-based solutions. Bull. Chin. Acad. Sci. 37 (4), 490–501. doi:10.16418/j.issn.1000-3045.20220121002
Yun, H., Tang, J., D’Imperio, L., Wang, X., Qu, Y., Liu, L., et al. (2022). Warming and increased respiration have transformed an alpine steppe ecosystem on the Tibetan Plateau from a carbon dioxide sink into a source. J. Geophys. Res. Biogeosciences 127 (1), e2021JG006406. doi:10.1029/2021jg006406
Zhai, Y., Wang, X., Hao, L., Qi, W., Wang, Y., Geng, J., et al. (2024). Multi-time scale analysis of net ecosystem productivity pattern in Inner Mongolia from 2001 to 2020. Ecol. Environ. Sci. 33 (2), 167–179. doi:10.16258/j.cnki.1674-5906.2024.02.001
Zhang, H., He, Z., Zhang, L., Cong, R., and Wei, W. (2024). Spatial–temporal changes and driving factor analysis of net ecosystem productivity in Heilongjiang Province from 2010 to 2020. Land 13, 1316. doi:10.3390/land13081316
Zhang, H., Lv, X., Ni, Y., Zhang, Q., Wang, J., and Ma, L. (2025). Time-lag effects of NEP and NPP to meteorological factors in the source regions of the Yangtze and Yellow Rivers. Front. Plant Sci. 15, 1502384. doi:10.3389/fpls.2024.1502384
Zhang, S., Chen, H., Fu, Y., Niu, H., Yang, Y., and Zhang, B. (2019). Fractional vegetation cover estimation of different vegetation types in the Qaidam Basin. Sustainability 11 (3), 864. doi:10.3390/su11030864
Zheng, J., Zhang, Y., Wang, X., Zhu, J., Zhao, G., Zheng, Z., et al. (2023). Estimation of net ecosystem productivity on the Tibetan plateau grassland from 1982 to 2018 based on random forest model. Remote Sens. 15 (9), 2375. doi:10.3390/rs15092375
Zhi, L., Chai, Y., Sun, C., Li, R., and Hu, T. (2024). Spatiotemporal evolution and driving factors of vegetation net ecosystem productivity in Henan Province over the past 20 years. Front. Environ. Sci. 12, 1400425. doi:10.3389/fenvs.2024.1400425
Zhou, W., Li, J., Yue, T., Zhou, W., Li, J., and Yue, T. (2020). Research progress of the grassland carbon cycle and grassland degradation in China. Remote Sens. Monit. Eval. Degraded Grassl. China Account. Grassl. Carbon Source Carbon Sink, 1–16. doi:10.1007/978-981-32-9382-3_1
Zou, C., Li, H., Chen, D., Fan, J., Liu, Z., Xu, X., et al. (2022). Spatial-temporal changes of carbon source/sink in terrestrial vegetation ecosystem and response to meteorological factors in Yangtze River Delta Region (China). Sustainability 14 (16), 10051. doi:10.3390/su141610051
Keywords: net ecosystem productivity, CASA model, MODIS NPP, driving factors, Inner Mongolia
Citation: Cui S, Zhao S, Li C, Wu Y, Kolerski T and Zhang M (2025) Modelling and evaluation of net ecosystem productivity and its driving factors in Inner Mongolia. Front. Environ. Sci. 13:1581983. doi: 10.3389/fenvs.2025.1581983
Received: 23 February 2025; Accepted: 07 April 2025;
Published: 30 April 2025.
Edited by:
Jing Zhao, Xi’an University of Technology, ChinaReviewed by:
Sukun Cheng, University of Reading, United KingdomKai Feng, North China University of Water Resources and Electric Power, China
Biyao Zhai, Nanjing Hydraulic Research Institute, China
Copyright © 2025 Cui, Zhao, Li, Wu, Kolerski and Zhang. This is an open-access article distributed under the terms of the Creative Commons Attribution License (CC BY). The use, distribution or reproduction in other forums is permitted, provided the original author(s) and the copyright owner(s) are credited and that the original publication in this journal is cited, in accordance with accepted academic practice. No use, distribution or reproduction is permitted which does not comply with these terms.
*Correspondence: Chao Li, bm1uZGxjQGltYXUuZWR1LmNu; Shuixia Zhao, emhhb3N4QGl3aHIuY29t