 Jaan Pärn1*
 Mikk Espenberg1
 Kaido Soosaar1
 Kuno Kasak1,2
 Sandeep Thayamkottu1
 Thomas Schindler1
 Reti Ranniku1,3
 Kristina Sohar1
 Lizardo Fachín Malaverri4
 Lulie Melling5
 Ülo Mander1
- 1Institute of Ecology and Earth Sciences, University of Tartu, Tartu, Estonia
- 2Department of Environmental Science, Policy, & Management, University of California Berkeley, Berkeley, CA, United States
- 3Department of Biological and Agricultural Engineering, University of Arkansas, Fayetteville, NC, United States
- 4Peruvian Amazon Research Institute (IIAP), Iquitos, Peru
- 5Sarawak Tropical Peat Research Institute, Sarawak, Malaysia
Tropical peatland ecosystems significantly influence Earth’s climate through their greenhouse gas exchange. Permanently wet peatlands take up carbon dioxide in plants and accumulate organic carbon in soil but release methane. Man-made drainage of peat releases carbon dioxide and nitrous oxide. Exchange of the greenhouse gases in relationship with tropical conditions are poorly understood. This is a global-scale field study of fluxes of three greenhouse gases – carbon dioxide, methane and nitrous oxide – and their environmental drivers across the full moisture range of tropical peatlands. We show that net emission of carbon dioxide dominates greenhouse gas budgets in drained tropical peatlands while nitrous oxide emission is the second most important contributor. Tropical peat swamp forests in their natural wet states are large greenhouse gas sinks and should be a global conservation and restoration priority.
1 Introduction
Peatlands function as a substantial reservoir of carbon (C) and nitrogen (N) (Leifeld and Menichetti, 2018; Loisel et al., 2021). In undisturbed conditions, specifically within permanently waterlogged peat swamp forests, C accumulates in the peat over extended periods, spanning tens of thousands of years (Mell et al., 2005; Ruwaimana et al., 2020). Natural and anthropogenic disturbances have a potential to release the stored C and N as greenhouse gases (GHG). This potential is particularly high in tropical peatland (IPCC Masson-Del et al., 2021). Drought, an increasingly prevalent ecological change in tropical zones, accelerates ecosystem alterations by shortening the growth period (IPCC Masson-Del et al., 2021), and elevating ecosystem respiration (ER) of carbon dioxide (CO2) (Karhu et al., 2014; Jassey et al., 2021). In dry seasons, ER may surpass gross primary production (GPP) by an average of 600 mg C day-1, even when the soil is still wet (Griffis et al., 2020; Pärn et al., 2023). Severe drought, inundation or the alteration between these may intensify the C losses. Thus, we are still short of fully understanding the total effect of soil-moisture variations on the net ecosystem exchange (NEE) of CO2 in low-latitude peatlands (Zhao et al., 2023). In addition to the aerobic C exchange pathways, water regime and peat O2 limitation determine anoxic decomposition of peat, producing methane (CH4) (Melling et al., 2005; Teh et al., 2017; Hergoualc’h et al., 2020). It is a potent greenhouse gas, exhibiting a global warming potential equivalent to 28 times that of CO2 (IPCC Masson-Del et al., 2021). The CH4 generated in deep peat escapes to the topsoil, where it may be either consumed by methanotrophs or be emitted. The latter can happen in the tropics either directly through the peat or facilitated through plant conduits (Pangala et al., 2017; Soosaar et al., 2022). As a result, the hydroclimate, biogeochemistry of distinct peat layers, as well as the type of vegetation and land use, emerge as potential influencing factors for CH4 emissions in tropical peatlands. In addition to the C-based GHG fluxes, variations in soil water content influence dynamics of nitrous oxide (N2O) emissions. Specifically, suboxic processes occurring within N-rich peat under moderate water content (50%–60%) lead to production of N2O (Pärn et al., 2023; Hergoualc’h et al., 2020; Melillo et al., 2001; Jauhiainen et al., 2012; Melling et al., 2007; Ru et al., 2012; Hu et al., 2015; Pärn et al., 2018). Globally, regions like the Amazon rainforest, Congo, and Southeast Asia exhibit the highest N2O emissions (Pärn et al., 2018; Ricaud et al., 2009). Amazonia alone yields 1,300 Gg N2O-N yr-1 (Melillo et al., 2001). Conversion of peatlands for agriculture, particularly in Southeast Asia, produces huge amounts of N2O (Melling et al., 2007; Hadi et al., 2000). Brazil, with its high fertilization rates, is another major contributor to the global rise in N2O emissions (Thompson et al., 2019). The role of tropical peatlands in global N2O emissions remains poorly understood (van Lent and Verchot, 2015; Guilhen et al., 2020; Swails et al., 2024). Peat swamps in Peru and Southeast Asia exhibit varying N2O emissions, with a Peruvian palm peat swamp producing 0.5–2.6 kg N2O-N ha-1 yr-1 and Southeast Asian peat swamp forests producing 2.7 ± 1.7 kg N2O-N ha-1 yr-1 (average ± standard deviation) (van Le et al., 2019). However, the source of N2O (nitrate (NO3−) or ammonium (NH4+)) and their susceptibility to climatic changes, such as water table, oxygen (O2), and temperature fluctuations, remain unclear.
Studies on mineral soil are deemed unreliable for comprehending the impact of climate change on peatlands due to their fundamentally different biogeochemistry (Rydin and Jeglum, 2013). Where undrained, peatlands are water-saturated throughout the year, shielding the C and N stocks (Turetsky et al., 2015). However, deforestation, often with fire, jeopardizes the C and N stocks (Swails et al., 2024; Turetsky et al., 2015; Lilleskov et al., 2019). Few studies have compared greenhouse gas fluxes across different land uses and water regimes in tropical peatlands (Swails et al., 2024). Here, we analyse GHG exchange based on field chamber measurements of ER, N2O and CH4 fluxes and satellite data of gross primary production (GPP) in 12 tropical peatlands in South America, Africa and Southeast Asia (Figure 1) during the wet and dry seasons (Pärn et al., 2018; Bahram et al., 2022; Pärn et al., 2025). We further investigate explanatory factors of the GHG fluxes across full tropical ranges of soil temperature, drainage intensity, and soil chemistry.
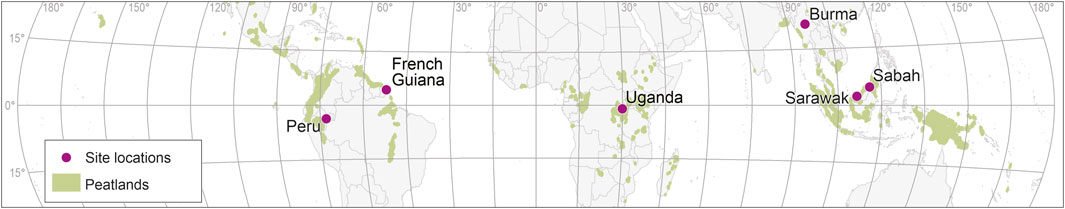
Figure 1. Location of peatland study sites. Each location contains at least one natural peatland and an equivalent peatland under direct human impact. Data from (Pärn et al., 2025; Bahram et al., 2022). Global peatland map: (Leifeld and Menichetti, 2018).
2 Methods
2.1 Field sampling and analyses
We conducted a survey of CO2, CH4 and N2O fluxes and potentially controlling environmental variables at peatland sites in French Guiana, Uganda, Burma, and the Malaysian Borneo state of Sabah during a dry season (i.e., water table below annual average) of each site between 2013 and 2016 (Pärn et al., 2018; Bahram et al., 2022; Pärn et al., 2025), and the Peruvian Amazon (Pärn et al., 2023) and the Malaysian Borneo state of Sarawak during both a dry and rainy season (water table above annual average) of each site between 2019 and 2022. We selected a total of 12 forested, fen, grassland, arable and oil palm plantation sites in the rainy tropical (A) climate zones of the Köppen classification from our global wetland soil database (Pärn et al., 2023; Pärn et al., 2018; Bahram et al., 2022; Pärn et al., 2025) (Figure 1). The hydrology and trophic status of the natural sites ranged from groundwater-fed swamps and fens to rain-fed peat swamp forests. We also selected the sites to represent the full typical range of land uses of the rainy tropical belt. Accordingly, our sites represent peatlands that have been arable for >5 years (Borneo, Burma, Peru and Uganda), intensively (more than once a year) grazed peat pastures (French Guiana, Uganda and Burma), and swamp forests (Peru and Borneo) under no direct human influence in each study region.
To capture the full variety of ER (in mg CO2 m-2 h-1), CH4 and N2O fluxes (both in mg m-2 h-1) fluxes at a site, we set up study sites equipped with 8–10 opaque chambers each, arranged along 100 m of terrain. The gas concentrations were sampled using the static chamber method with PVC collars of 0.5 m diameter and 0.1 m depth installed in the soil. We used white 65 L PVC truncated conical gas sampling chambers. We did not use extra cover against sunlight, but the chamber design is still generally regarded as opaque (Pärn et al., 2025). We calculated individual CO2, CH4 and N2O fluxes using changes in concentration during 1 hour within the chamber. To that end, the gas was sampled at 20-min intervals (0, 20, 40 and 60 min) and the fluxes calculated from the samples using a Shimadzu (Japan) GC-2014 gas chromatograph, instrumented with Loftfield-type autosamplers at the University of Tartu. An individual gas flux was calculated from linear regression obtained from consecutive concentrations. We collected soil samples of 150–200 g from the chambers at 0–10 cm depth after the final gas sampling and transported them to laboratories in Tartu (Pärn et al., 2018; Bahram et al., 2022; Pärn et al., 2025).
As the estimate of ER in the study locations with trees (Peru swamp forest and all Borneo sites), we used the ER data from representative eddy covariance flux towers (PE-QFR: Quistococha for the Peruvian swamp forest, MY-MLM: Maludam for the Borneo swamp forests and MY: Betong for the Borneo oil palm plantations).
2.2 GPP calculation
As the estimate of GPP in the study locations with trees (Peru swamp forest and all Borneo sites), we used the GPP data from representative eddy covariance flux towers (PE-QFR: Quistococha for the Peruvian swamp forest, MY-MLM: Maludam for the Borneo swamp forests and MY: Betong for the Borneo oil palm plantations).
As the estimate of GPP in the non-forested (i.e., fen, pasture and arable) study locations, we used the MOD17A2H V006 product (Running et al., 2015) developed from the MODIS sensor onboard the Terra and Aqua remote sensing satellites synchronously with the study weeks (Watts et al., 2021; Dąbrowska-Zielińska et al., 2022). MOD17A2H V006 is based on the radiation use efficiency concept (Monteith, 1972) with three major components. The first assumption is that GPP is directly related to the solar energy absorbed by plants. Second, the concept assumes a connection between absorbed solar energy and satellite-derived spectral indices such as NDVI. The third assumption is that for biophysical reasons, the actual conversion efficiency of absorbed solar energy is lower than the theoretical value. The calculation of GPP (Equation 1) requires radiation use efficiency and absorbed photosynthetically active radiation (APAR) measurements. APAR calculates the available leaf area index (LAI) to absorb incident solar energy. This estimate is then converted into GPP by multiplying APAR with radiation use efficiency (ε) (Equations 1,, 2). Remote sensing data usually provide the fraction of photosynthetically active radiation (FPAR; Equation 3). APAR can be calculated by Equation 4 (Sellers, 1987). This requires estimation of incidental photosynthetically active radiation (IPAR) (Equation 5), which is extracted from the GMAO/NASA dataset (Friedl and Sulla-Menashe, 2020).
ε max is the maximum radiation conversion efficiency in kg C MJ-1 which is obtained from the Biome Properties Look-Up Table (BPLUT) of the at-launch land cover product of MODIS (MOD12). Tmin scalar and VPD scalar are the ramp functions of Tmin and VPD.
This calculation requires the following parameters extractable from the GMAO/NASA dataset (Running et al., 2015):
Tminmax (°C) – the daily minimum temperature at which ε = ε max for an optimal VPD.
Tminmin (°C) – the daily minimum temperature at which ε = 0 at any VPD.
VPDmax (Pa) – the daylight average vapor pressure deficit at which ε = ε max for an optimal Tmin.
VPDmax (Pa) – the daylight average vapor pressure deficit at which ε = 0.0 at any Tmin.
SWRrad – incident shortwave radiation used for calculating IPAR.
We extracted GPP values for our sites from the dataset (kg C m-2 8 days-1) for the ground measurement dates and expressed the values in mg C m-2 h-1. A >50% underestimate of the negative effect of drought on the MODIS GPP product has been suspected (Stocker et al., 2019). We tested the significance of this possible underestimate by multiplying the GHG exchange values from our dry (<0.4 m3 m-3 SWC) by a factor of 0.5 and using them in the regression analyses. The patterns of GHG exchange values vs SWC after this reduction became less pronounced but retained their significance.
2.3 NEE calculation
Net ecosystem exchange (NEE) is the integral parameter for the fluxes of CO2 into and out of terrestrial ecosystems. Combination of satellite-based GPP products with synchronous ground chamber- and flux tower-based ER measurements is a widely applied approach to gauge NEE over landscapes (Watts et al., 2021; Dąbrowska-Zielińska et al., 2022) as was the objective here. As the estimate of NEE in the study locations with trees (Peru swamp forest and all Borneo sites), we used the NEE data from representative eddy covariance flux towers (PE-QFR: Quistococha for the Peruvian swamp forest, MY-MLM: Maludam for the Borneo swamp forests and MY: Betong for the Borneo oil palm plantations). For the open peatlands in Peru, French Guiana, Uganda and Burma we calculated NEE from the synchronously measured chamber-based ER (Section 2.1) and remotely sensed GPP product (Section 2.2) as follows (Equation 6):
GHG exchange was calculated for each chamber following Equation 7.
where:
GHG exchange was the greenhouse gas exchange in CO2 equivalents (CO2eq), CH4 was the field-observed methane flux, mg CH4 m-2 h-1, GWPCH4 was 27 CO2eq = the 100-year global warming potential of non-fossil CH4 (IPCC Masson-Del et al., 2021), N2O was the field-observed nitrous oxide flux, mg N2O m-2 h-1, GWPN2O was 273 CO2eq = the 100-year global warming potential of N2O (IPCC Masson-Del et al., 2021), and NEE was the net ecosystem exchange of CO2 (Equation 6).
We considered carbon, N2O and CH4 runoff as insignificant (Taillardat et al., 2022) although they may evade in drained peatlands (Taillardat et al., 2022; Wilson et al., 2016; Nishina et al., 2023).
2.4 Laboratory soil chemical and physical analyses
Soil pH was determined using a 1M KCl solution; soil NH4 and NO3 were determined on a 2M KCl extract of soil by flow-injection analysis (APHA, 2005). Total N and C contents of oven-dry samples were determined by a dry-combustion method on a varioMAX CNS elemental analyser (Elementar Analysensysteme GmbH, Germany). Organic matter content of dry matter was determined by loss on ignition (McLaren and Cameron, 2012). We determined SWC from gravimetric water content (GWC), dry matter content and empirically established bulk densities of mineral and organic matter fractions (Pärn et al., 2018) and calibrated them with field measurements using a handheld GS3 sensor connected to a ProCheck handheld reader (Decagon Devices, Pullman, WA, United States) and a Teros 12 sensor (METER Group, United States).
2.5 Relationships between GHG and environmental factors
We calculated correlations between our individual GHG fluxes and their total CO2eq exchange values, environmental factors, relative abundances of functional groups of microbes and ratios between them. We used linear and non-parametric GAM models applying variable smoothness factors (starting from minimal smoothness k = 3). We assessed normality of our data using visual approaches and the Shapiro-Wilk test. Where necessary, we log-transformed the values. For the GHG flux rates, we considered the following environmental predictor variables: soil temperature, water table, volumetric SWC, soil chemistry (pH, total C %, organic matter, total N %, C:N ratio, ammonium, nitrate), water oxygen content. We calculated Pearson correlations using the R programming language (stats and mgcv packages). We reported correlations with a significance level of p = 0.05.
3 Results and discussion
The CO2 and N2O fluxes did not show a clear pattern with soil temperature (Figure 2) within the 15°C–29°C range of our observation, with the highest ER fluxes measured in the swamp forests with ∼26°C soil temperature (Supplementary data). This is lower than textbook knowledge on a soil temperature optimum of 30°C for the soil microbial processes (Voroney, 2007). The root cause of ER and N2O emissions seems to be loss of soil water content and elevated water O2 with intensive agricultural drainage (Figures 2–4). High (neutral) soil pH was the third independent driving factor behind the high ER rates (Figure 2), probably supporting high bacterial activity and plant respiration (Voroney, 2007).
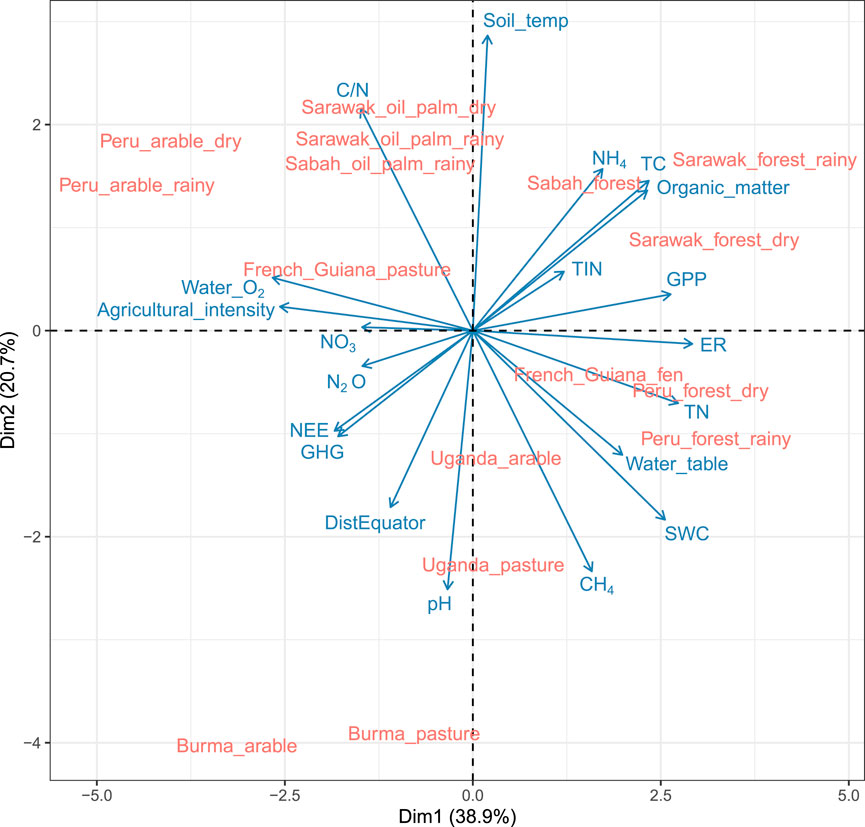
Figure 2. Principal component plot of study sites, GHG fluxes and environmental factors. SWC, soil water content. WT, water table height. GPP, gross primary production. TN, total soil nitrogen. TIN, total inorganic nitrogen. SOM, soil organic matter content. TC, total soil carbon content. NH4, soil ammonium content. Soil_temp, soil temperature at 10 cm depth. C/N, carbon to nitrogen ratio. Agricultural_intensity, intensity of agricultural land use at a discrete scale of 0 … 3: (0) no agriculture (Leifeld and Menichetti, 2018), moderate grazing or mowing (Loisel et al., 2021), intensive grazing or mowing and (Mell et al., 2005) arable. NO3, soil nitrate content. N2O, N2O emission. NEE, net ecosystem exchange of CO2. ER, ecosystem respiration of CO2. CH4, methane emission. See Supplementary Data for the source data.
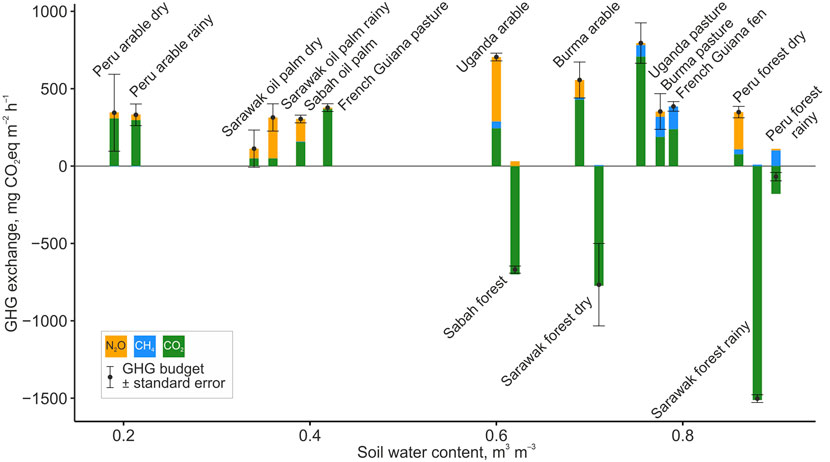
Figure 3. GHG exchange in peatland sites between ecosystem and atmosphere along the soil water content gradient. Breakdown of GHG budgets into individual fluxes along soil water content gradient. Site average (bars for individual gases and points for total GHG budget) and standard error (whiskers) are shown.
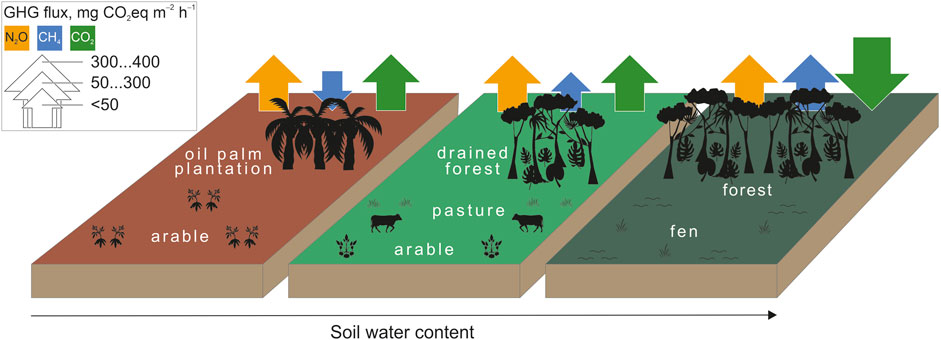
Figure 4. GHG fluxes and land use along the soil water content gradient.
CO2 dominated the GHG budgets (Figures 3, 4). The wetter (SWC >0.6 m3 m–3) peat swamp forests were net CO2 and thus overall GHG sinks. This corroborates the IPCC (IPCC Masson-Del et al., 2021) and several global studies (Swails et al., 2024) reporting CO2 as the dominant GHG (excluding water vapour and ozone). The moderately and severely drained pastures and arable were mostly sources of CO2 (Figure 3). This broadly follows the known pattern of CO2 and total GHG emissions along the global soil moisture gradient (Pärn et al., 2025).
N2O emission contributed overall 88 mg CO2-equivalent m–2 h–1. The moderately drained pastures and arable lands contributed the largest N2O fluxes (Figures 3, 4). The peak N2O emissions in moderately drained peat soils is well known (Pärn et al., 2018). At the two extremes of the SWC spectrum, the dry Peruvian arable field (<0.25 m3 m–3 SWC) and the wet but aerobic NH4-rich Peruvian swamp forest emitted considerable amounts of N2O, 41 and 90 mg CO2-equivalent m–2 h–1, respectively. Our N2O emissions contrasted the earlier-reported negligible emissions from a Peruvian palm peat swamp forest (Teh et al., 2017) and were relatively high compared to the average 31 ± 22 µg N2O-N m–2 h–1 (average ± standard deviation across studies) from the 410 ± 120 mg dry kg–1 soil NH4+-N in Southeast Asian wetland forests (van Lent and Verchot, 2015). Our measured fluxes were higher than model-predicted emissions of 21 µg N2O-N m–2 h–1 for the Amazon Basin (Guilhen et al., 2020). Our N2O emissions were log-log linear positively related to soil nitrate content and formed a unimodal relationship with SWC (Pärn et al., 2018). However, a large part of the soil N2O never leaves the forest canopy space (Mander et al., 2021), either due to physical processes or the canopy microbiome (van Groenigen et al., 2015; Guerrieri et al., 2021). Alternatively, nitrogen-fixing cryptogamic covers on forest canopy surfaces can add NH4+into the budget as a source of N2O (Lenhart et al., 2015).
Surprisingly for peatlands, CH4 comprised only a minor share of the GHG budgets–on average, 35 mg CO2-equivalent m–2 h–1 across the full soil moisture spectrum. The emissions followed SWC in a unimodal GAM function that peaked at 0.8 m3 m–3 SWC (k = 6; R2 = 0.51), which corresponded to anoxic conditions created by stagnant ground-level water table, and decreased again towards the fully submerged peatlands under mobile water. Turetsky and colleagues (53) have shown a similar distribution in extratropical peatlands. Similarly, our wetter peat soils (>0.76 m3 m–3 SWC) produced practically all the CH4 while the drier peat soils (<0.6 m3 m–3 SWC) emitted CH4 negligibly (<4 mg CO2-equivalent m–2 h–1) or took it up (Figures 3, 4). Our observed CH4 fluxes agreed with reports from Brazilian swamp forest soils (igapo and varzea) (Pangala et al., 2017). The moderate explanatory power of our GAM model can be explained by the intrinsic confinement of CH4 emissions to individual emission hot spots (Becker et al., 2008). However, as CH4 is a minor component of GHG exchange (Figure 2), the >40% uncertainty in CH4 flux estimates does not translate into large uncertainty in GHG exchange across the tropical belt. Permanently anoxic environments normally show high CH4 production (Pärn et al., 2025; Turetsky et al., 2014). In the forests, however, tree trunks and leaves can conduct or produce additional CH4 into the atmosphere (Pangala et al., 2017; Soosaar et al., 2022).
4 Conclusion
The tropical peatlands showed high GHG turnover rates, varying between mostly sinks of CO2 in the wet peatlands and mostly sources of CO2 in the drained peatlands. N2O was the second most important part of the GHG budgets, particularly in the moderately drained nitrogen-rich peatlands. The resulting high GHG emissions demand close monitoring of soil moisture and nitrogen in tropical peatlands. We highlight the need to consider not only carbon but all three main greenhouse gases (CO2, N2O and CH4) in tropical peatland GHG budgets. Management of tropical peatlands should be aware of the impact changes in soil moisture and nitrogen availability have on GHG emissions. Conservation of swamp forests is the safest way to keep up the carbon uptake and minimise the GHG emissions. Future impacts of global change on GHG exchange and the state of peatland ecosystems will be accordingly determined by drying and mineralisation of peat. Future studies will have to account for the production and consumption rates of CH4 as well as N2O in all parts of the soil–tree–atmosphere continuum.
Data availability statement
The original contributions presented in the study are included in the article/Supplementary Material, further inquiries can be directed to the corresponding author.
Author contributions
JP: Investigation, Data curation, Formal Analysis, Writing – original draft. ME: Data curation, Formal Analysis, Visualization, Writing – review and editing. KaS: Investigation, Writing – review and editing. KK: Investigation, Writing – review and editing. ST: Data curation, Investigation, Writing – review and editing. TS: Investigation, Writing – review and editing. RR: Investigation, Writing – review and editing. KrS: Conceptualization, Visualization, Writing – review and editing. LiM: Investigation, Writing – review and editing. LuM: Investigation, Resources, Writing – review and editing. UM: Conceptualization, Funding acquisition, Investigation, Project administration, Resources, Visualization, Writing – review and editing.
Funding
The author(s) declare that financial support was received for the research and/or publication of this article. The study was supported by the Estonian Research Council (IUT2-16, PRG-352, PRG-609, PRG2032, PSG1044, MOBERC20 and MOBERC44), European Research Council (ERC) under grant agreement No 101096403, European Commission through the HORIZON-WIDERA ‘Living Labs for Wetland Forest Research’ Twinning project No 101079192 and the European Regional Development Fund (MOBTP101 returning researcher grant by the Mobilitas Pluss programme, and Centres of Excellence ENVIRON, grant number TK-107, and EcolChange, grant number TK-131), as well as the European Social Fund (Doctoral School of Earth Sciences and Ecology).
Acknowledgments
We are grateful to G. Gabiri, J.B. Gallagher, J. Järveoja, C. Luswata, M. Maddison, T. Pae, A.A. Rabar, F. Sangok, M. Tenywa, G.X. GW, S.S. Zaw, M. Öpik, W. A. Muñoz, J. L. Jibaja Aspajo, R. I. Negron-Juarez, J. Rengifo, D. J. Garay Dinis, A. G. Arista Oversluijs, M. C. Ávila Fucos, R. Chávez Vásquez, R. Huaje Wampuch, E. Peas García, S. Cordova Horna, T. Pacheco Gómez, J. D. Urquiza Muñoz, R. Tello Espinoza for help with site selection and field investigation.
Conflict of interest
The authors declare that the research was conducted in the absence of any commercial or financial relationships that could be construed as a potential conflict of interest.
Generative AI statement
The author(s) declare that no Generative AI was used in the creation of this manuscript.
Publisher’s note
All claims expressed in this article are solely those of the authors and do not necessarily represent those of their affiliated organizations, or those of the publisher, the editors and the reviewers. Any product that may be evaluated in this article, or claim that may be made by its manufacturer, is not guaranteed or endorsed by the publisher.
Supplementary material
The Supplementary Material for this article can be found online at: https://www.frontiersin.org/articles/10.3389/fenvs.2025.1585537/full#supplementary-material
References
APHA (2005). Standard methods for the examination of water and wastewater. 21st Edition. Washington DC: American Public Health Association/American Water Works Association/Water Environment Federation.
Bahram, M., Espenberg, M., Pärn, J., Lehtovirta-Morley, L., Anslan, S., Kasak, K., et al. (2022). Structure and function of the soil microbiome underlying N2O emissions from global wetlands. Nat. Commun. 13, 1430. doi:10.1038/s41467-022-29161-3
Becker, T., Kutzbach, L., Forbrich, I., Schneider, J., Jager, D., Thees, B., et al. (2008). Do we miss the hot spots? – the use of very high resolution aerial photographs to quantify carbon fluxes in peatlands. Biogeosciences 5, 1387–1393. doi:10.5194/bg-5-1387-2008
Dąbrowska-Zielińska, K., Kwiatkowska-Malina, J., Malinowski, R., Kowalik, W., Budzyńska, M., Bartold, M., et al. (2022). Spatiotemporal estimation of gross primary production for terrestrial wetlands using satellite and field data. Remote Sens. Appl. Soc. Envir 27, 100786. doi:10.1016/j.rsase.2022.100786
Friedl, M., and Sulla-Menashe, D. (2020). MCD12Q1 MODIS/Terra+Aqua land cover type yearly L3 global 500m SIN grid V006. NASA EOSDIS Land Process. DAAC. doi:10.5067/MODIS/MCD12Q1.006
Griffis, T. J., Roman, D., Wood, J., Deventer, J., Fachin, L., Rengifo, J., et al. (2020). Hydrometeorological sensitivities of net ecosystem carbon dioxide and methane exchange of an Amazonian palm swamp peatland. Agric For Meteorol 295, 108167. doi:10.1016/j.agrformet.2020.108167
Guerrieri, R., Templer, P., and Magnani, F. (2021). Canopy exchange and modification of nitrogen fluxes in forest ecosystems. Curr For Rep 7, 115–137. doi:10.1007/s40725-021-00141-y
Guilhen, J., Verchot, L. V., Martius, C., de la Cruz, M., Asencios, A., Cosio, E. G., et al. (2020). Denitrification and associated nitrous oxide and carbon dioxide emissions from the Amazonian wetlands. Biogeosciences 17, 4297–4311. doi:10.5194/bg-17-4297-2020
Hadi, A., Inubushi, K., Furukawa, Y., Purnomo, E., Rasmadi, M., and Tsuruta, H. (2000). Effect of land-use changes on nitrous oxide (N2O) emission from tropical peatlands. Chemosphere–Glob Chang. Sci. 2, 347–358. doi:10.1016/s1465-9972(00)00030-1
Hergoualc’h, K., Dezzeo, N., Verchot, L. V., Martius, C., van Lent, J., del Aguila-Pasquel, J., et al. (2020). Spatial and temporal variability of soil N2O and CH4 fluxes along a degradation gradient in a palm swamp peat forest in the Peruvian amazon. Glob. Chang. Biol. 26, 7198–7216. doi:10.1111/gcb.15354
Hu, H. W., Chen, D., and He, J. Z. (2015). Microbial regulation of terrestrial nitrous oxide formation: understanding the biological pathways for prediction of emission rates. FEMS Microbiol. Rev. 39, 729–749. doi:10.1093/femsre/fuv021
IPCC (2021). Climate change 2021: the physical science basis. in Contribution of working group I to the sixth assessment report of the intergovernmental panel on climate change. V. Masson-Delmotte, P. Zhai, A. Pirani, S. L. Connors, C. Péan, S. Bergeret al. (Cambridge University Press).
Jassey, V. E. J., Reczuga, M. K., Zielińska, M., Słowińska, S., Robroek, B. J. M., Mariotte, P., et al. (2021). Tipping point in plant–fungal interactions under severe drought causes abrupt rise in peatland ecosystem respiration. Glob. Chang. Biol. 24, 972–986. doi:10.1111/gcb.13928
Jauhiainen, J., Hooijer, A., Page, S. E., Kusin, K., Limin, S., Raison, R. J., et al. (2012). Nitrous oxide fluxes from tropical peat with different disturbance history and management. Biogeosciences 9, 1337–1350. doi:10.5194/bg-9-1337-2012
Karhu, K., Auffret, M. D., Dungait, J. A. J., Hopkins, D. W., Prosser, J. I., Singh, B. K., et al. (2014). Temperature sensitivity of soil respiration rates enhanced by microbial community response. Nature 513, 81–84. doi:10.1038/nature13604
Leifeld, J., and Menichetti, L. (2018). The underappreciated potential of peatlands in global climate change mitigation strategies. Nat. Commun. 9, 1071. doi:10.1038/s41467-018-03406-6
Lenhart, K., Weber, B., Elbert, W., Steinkamp, J., Clough, T., Crutzen, P., et al. (2015). Nitrous oxide and methane emissions from cryptogamic covers. Glob. Chang. Biol. 21, 3889–3900. doi:10.1111/gcb.12995
Lilleskov, E., McCullough, K., Hergoualc’h, K., del Castillo Torres, D., Chimner, R., Murdiyarso, D., et al. (2019). Is Indonesian peatland loss a cautionary tale for Peru? A two-country comparison of the magnitude and causes of tropical peatland degradation. Mitig. Adapt Strateg. Glob. Chang. 24, 591–623. doi:10.1007/s11027-018-9790-3
Loisel, J., Gallego-Sala, A. V., Amesbury, M. J., Magnan, G., Anshari, G., Beilman, D. W., et al. (2021). Expert assessment of future vulnerability of the global peatland carbon sink. Nat. Clim. Chang. 11, 70–77. doi:10.1038/s41558-020-00944-0
Mander, Ü., Krasnova, A., Escuer-Gatius, J., Espenberg, M., Schindler, T., Machacova, K., et al. (2021). Forest canopy mitigates soil N2O emission during hot moments. Clim. Atmos. Sci. 4, 39. doi:10.1038/s41612-021-00194-7
McLaren, R. G., and Cameron, K. C. (2012). Soil science: sustainable production and environmental protection. Wallingford, UK: Oxford University Press.
Melillo, J. M., Steudler, P. A., Feigl, B. J., Neill, C., Garcia, D., Piccolo, M. C., et al. (2001). Nitrous oxide emissions from forests and pastures of various ages in the Brazilian amazon. J. Geophys Res. Atmos. 106, 34179–34188. doi:10.1029/2000jd000036
Melling, L., Hatano, R., and Goh, K. J. (2005). Methane fluxes from three ecosystems in tropical peatland of Sarawak, Malaysia. Soil Biol. Biochem. 37, 1445–1453. doi:10.1016/j.soilbio.2005.01.001
Melling, L., Hatano, R., and Goh, K. J. (2005). Soil CO2 flux from three ecosystems in tropical peatland of Sarawak, Malaysia. Tellus B 57, 1–11. doi:10.1111/j.1600-0889.2005.00129.x
Melling, L., Hatano, R., and Goh, K. J. (2007). Nitrous oxide emissions from three ecosystems in tropical peatland of Sarawak, Malaysia. Soil Sci. Plant Nutr. 53, 792–805. doi:10.1111/j.1747-0765.2007.00196.x
Monteith, J. L. (1972). Solar radiation and productivity in tropical ecosystems. J. Appl. Ecol. 9, 747–766. doi:10.2307/2401901
Nishina, K., Melling, L., Toyoda, S., Itoh, M., Terajima, K., Waili, J. W., et al. (2023). Dissolved N2O concentrations in oil palm plantation drainage in a peat swamp of Malaysia. Sci. Total Environ. 872, 162062. doi:10.1016/j.scitotenv.2023.162062
Pangala, S. R. al, Enrich-Prast, A., Basso, L. S., Peixoto, R. B., Bastviken, D., Hornibrook, E. R. C., et al. (2017). Large emissions from floodplain trees close the amazon methane budget. Nature 552, 230–234. doi:10.1038/nature24639
Pärn, J., Soosaar, K., Schindler, T., Machacova, K., Muñoz, W. A., Fachín, L., et al. (2023). Effects of water table fluctuation on greenhouse gas emissions from wetland soils in the Peruvian amazon. Wetlands 43, 62. doi:10.1007/s13157-023-01709-z
Pärn, J., Thayamkottu, S., Öpik, M., Bahram, M., Tedersoo, L., Espenberg, M., et al. (2025). Soil moisture and microbiome explain greenhouse gas exchange in global peatlands. Sci. Rep. 15 (1), 10153. doi:10.1038/s41598-025-92891-z
Pärn, J., Verhoeven, J. T. A., Butterbach-Bahl, K., Dise, N. B., Ullah, S., Aasa, A., et al. (2018). Nitrogen-rich organic soils under warm well-drained conditions are global nitrous oxide emission hotspots. Nat. Commun. 9, 1135. doi:10.1038/s41467-018-03540-1
Ricaud, P., Barret, B., Mariage, V., Attié, J. L., Bousserez, N., Peuch, V. H., et al. (2009). Equatorial total column of nitrous oxide as measured by IASI on MetOp-A: implications for transport processes. Atmos. Chem. Phys. 9, 3947–3956. doi:10.5194/acp-9-3947-2009
Rubol, S., Silver, W. L., and Bellin, A. (2012). Hydrologic control on redox and nitrogen dynamics in a peatland soil. Sci. Total Environ. 432, 37–46. doi:10.1016/j.scitotenv.2012.05.073
Running, S., Mu, Q., and Zhao, M. (2015). MOD17A2H MODIS/terra gross primary productivity 8-Day L4 global 500m SIN grid V006. Distrib. by NASA EOSDIS Land Process. DAAC. doi:10.5067/MODIS/MOD17A2H.006
Ruwaimana, M., Anshari, G. Z., Silva, L. C., and Gavin, D. G. (2020). The oldest extant tropical peatland in the world: a major carbon reservoir for at least 47,000 years. Environ. Res. Lett. 15, 114027. doi:10.1088/1748-9326/abb853
Sellers, P. J. (1987). Canopy reflectance, photosynthesis, and transpiration, II. The role of biophysics in the linearity of their interdependence. Remote Sens. Environ. 21, 143–183. doi:10.1016/0034-4257(87)90051-4
Soosaar, K., Pärn, J., Maddison, M., Teemusk, A., Augustin, J., Mander, Ü., et al. (2022). High methane emission from palm stems and nitrous oxide emission from the soil in a Peruvian amazon peat swamp forest. Front For Glob Change 5, 36. doi:10.3389/ffgc.2022.849186
Stocker, B. D., Zscheischler, J., Keenan, T. F., Prentice, I. C., Seneviratne, S. I., and Peñuelas, J. (2019). Drought impacts on terrestrial primary production underestimated by satellite monitoring. Nat. Geosci. 12, 264–270. doi:10.1038/s41561-019-0318-6
Swails, E., Frolking, S., Deng, J., and Hergoualc’h, K. (2024). Degradation increases peat greenhouse gas emissions in undrained tropical peat swamp forests. Biogeochemistry 67, 59–74. doi:10.1007/s10533-023-01110-2
Taillardat, P., Bodmer, P., Deblois, C. P., Ponçot, A., Prijac, A., Riahi, K., et al. (2022). Carbon dioxide and methane dynamics in a peatland headwater stream: origins, processes and implications. J. Geophys Res. Biogeosci 127, e2022JG006855. doi:10.1029/2022jg006855
Teh, Y. A., Wayne, M., Berrio, J. C., Boom, A., and Page, S. E. (2017). Seasonal variability in methane and nitrous oxide fluxes from tropical peatlands in the western amazon basin. Biogeosciences 14, 3669–3683. doi:10.5194/bg-14-3669-2017
Thompson, R. L., Lassaletta, L., Patra, P. K., Wilson, C., Wells, K. C., Gressent, A., et al. (2019). Acceleration of global N2O emissions seen from two decades of atmospheric inversion. Nat. Clim. Chang. 9, 993–998. doi:10.1038/s41558-019-0613-7
Turetsky, M. R., Benscoter, B., Page, S., Rein, G., van der Werf, G. R., and Watts, A. (2015). Global vulnerability of peatlands to fire and carbon loss. Nat. Geosci. 8, 11–14. doi:10.1038/ngeo2325
Turetsky, M. R., Kotowska, A., Bubier, J., Dise, N. B., Crill, P., Hornibrook, E. R. C., et al. (2014). A synthesis of methane emissions from 71 northern, temperate, and subtropical wetlands. Glob. Chang. Biol. 20, 2183–2197. doi:10.1111/gcb.12580
van Lent, J., Hergoualc'h, K., and Verchot, L. V. (2019). Greenhouse gas emissions along a peat swamp forest degradation gradient in the Peruvian amazon: soil moisture and palm roots effects. Mitig. Adapt Strateg. Glob. Chang. 24, 625–643. doi:10.1007/s11027-018-9796-x
van Groenigen, J. W., Huygens, D., Boeckx, P., Kuyper, T. W., Lubbers, I. M., Rütting, T., et al. (2015). The soil N cycle: new insights and key challenges. Soil 1 (1), 235–256. doi:10.5194/soil-1-235-2015
van Lent, J., and Verchot, L. V. (2015). Reviews and syntheses: soil N2O and NO emissions from land use and land-use change in the tropics and subtropics: a meta-analysis. Biogeosciences 12, 7299–7313. doi:10.5194/bg-12-7299-2015
Voroney, R. P. (2007). “The soil habitat,” in Soil microbiology, ecology, and biogeochemistry (Academic Press, Elsevier), 25–52.
Watts, J. D., Kimball, J. S., Jones, L. A., Schroeder, R., McDonald, K. C., Zona, D., et al. (2021). Soil respiration strongly offsets carbon uptake in Alaska and northwest Canada. Environ. Res. Lett. 16, 084051. doi:10.1088/1748-9326/ac1222
Wilson, D., Blain, D., Couwenberg, J., Evans, C. D., Murdiyarso, D., Page, S., et al. (2016). Greenhouse gas emission factors associated with rewetting of organic soils. Mires Peat 17. Article 04. doi:10.19189/MaP.2016.OMB.222
Keywords: ammonium, carbon dioxide, methane, nitrate, nitrous oxide, peatland forest, plantation, soil moisture introduction
Citation: Pärn J, Espenberg M, Soosaar K, Kasak K, Thayamkottu S, Schindler T, Ranniku R, Sohar K, Malaverri LF, Melling L and Mander Ü (2025) Importance of N2O in greenhouse gas budgets of tropical peatlands. Front. Environ. Sci. 13:1585537. doi: 10.3389/fenvs.2025.1585537
Received: 28 February 2025; Accepted: 25 June 2025;
Published: 25 July 2025.
Edited by:
Jianghua Wu, Memorial University of Newfoundland, CanadaReviewed by:
Fumiaki Takakai, Akita Prefectural University, JapanMingzhi Lu, Northeast Normal University, China
Copyright © 2025 Pärn, Espenberg, Soosaar, Kasak, Thayamkottu, Schindler, Ranniku, Sohar, Malaverri, Melling and Mander. This is an open-access article distributed under the terms of the Creative Commons Attribution License (CC BY). The use, distribution or reproduction in other forums is permitted, provided the original author(s) and the copyright owner(s) are credited and that the original publication in this journal is cited, in accordance with accepted academic practice. No use, distribution or reproduction is permitted which does not comply with these terms.
*Correspondence: Jaan Pärn, amFhbi5wYXJuQHV0LmVl