 Yatong Guo1Wei Wang2Xitang Zhang3Chun Liu4,5Youxiao Wang6Wenqi Chen6Xucong Wan6Xinyu Zhang6Yu Lin6*
 Xuya Zhang7*
 Yaohui Liu5,6
- 1Shandong Communication Administration, Jinan, China
- 2Jinan Emergency Management Technical Service Center, Jinan, China
- 3Shandong Sports Lottery Administration Center, Jinan, China
- 4School of Computer Science and Technology, Chongqing University of Posts and Telecommunications, Chongqing, China
- 5Chongqing Big Data Collaborative Innovation Center, Chongqing, China
- 6School of Surveying and Geo-Informatics, Shandong Jianzhu University, Jinan, China
- 7Chinese Academy of Environmental Planning, Beijing, China
Cities along the lower reaches of the Yangtze River (CLRYR) have highlighted human-land conflicts with their rapid urban expansion. Fully assessing the landscape ecological risk (LER) of the region and its response in the context of urbanization is of great significance for regional sustainable development. To address this issue, this study explores the spatiotemporal evolution of LER in CLRYR from the perspective of “production-living-ecological” space (PLES), and evaluates the decoupling status of urbanization processes and LER in different cities, aiming to provide scientific reference for policymakers. The results indicate that the mean LER value increased from 0.2508 in 2000 to 0.2573 in 2020, with an increase in LER fluctuations. From a spatial distribution perspective, the proportion of medium risk is the highest, consistently above 30%; The lowest risk proportion is less than 3%. From 2000 to 2020, the Moran’s I values for LER in the CLRYR were 0.4773, 0.4014, 0.3326, 0.2462, and 0.4779, respectively, indicating a significant positive correlation. Through decoupling model analysis, it was found that only Wuxi, Suzhou, and Changzhou achieved strong decoupling between economic growth and LER between 2010 and 2020. The findings of this study provide an important scientific basis for a deeper understanding of the complex relationship between urbanization and ecological risks in CLRYR and also lay a theoretical foundation for promoting the implementation of green development strategies in the region.
1 Introduction
In recent years, there has been a significant surge in the urban population and the proliferation of cities and towns, concurrent with rapid economic development (China, 1994; Yi et al., 2021; Yu, 2021). Urbanization has conferred numerous benefits upon populations, including enhanced material living standards and the fulfillment of diverse cultural needs (Zhu et al., 2023). However, the traditional urbanization model in its early stages was predominantly fueled by land finance and industrialization. This approach led to an irrational spatial distribution and inefficient utilization of regional land, placing significant pressure on ecosystems and giving rise to numerous associated risks, both direct and indirect (Li, Zhou, and Yi, 2022; Xu et al., 2021). Effective avoidance, active adaptation, and comprehensive management of ecological risks first require a scientific and accurate assessment of ecological risks in a specific region (Cao and Shen, 1991).
Landscape ecological risk (LER) assessment can reveal the potential adverse outcomes resulting from the interaction between landscape patterns and ecological processes under the influence of natural or human factors (Zhang et al., 2024; Qian et al., 2022). In recent years, the means of LER assessment have been diversified, and the results are of great practical significance for the development of risk mitigation strategies and the allocation of limited resources, which has become one of the hot topics in ecology and geography (Peng et al., 2015; Fagiewicz, 2014). Special attention should be paid to the fact that land, as a macro-representation of the surface landscape, carries the dual importance of human activities and ecosystem functions (Xu and Yang, 2024). LER assessment, grounded in landscape patterns, identifies land use change as the causal factor and constructs a regional-scale LER model using landscape pattern indexes (Du et al., 2023; Li et al., 2020; Wang W. et al., 2023; Zeng et al., 2022). This approach can effectively illustrate the influences of anthropogenic disturbances on landscape structure, functions, and processes within a specific region, providing a comprehensive evaluation of LER across multiple scales. Ai et al. (2022), Wang et al. (2021a), Ju et al. (2021) evaluated LER and gave possible corresponding measures for land use in different character areas of islands, nature reserves, and peninsulas, respectively. Gao et al. (2022) used the PLUS model to simulate land use in Nanjing 2025 under multiple scenarios and assessed LER under multiple scenarios through a comprehensive indicator system.
To address spatial incoherence in land use, China introduced the concept in 2012 of creating intensive and efficient production areas, suitable living environments, and ecologically pristine spaces characterized by scenic landscapes (Wang et al., 2022; Huang et al., 2024)—termed as “production-living-ecological” space (PLES). This initiative aims to achieve harmonious coexistence between humanity and nature (Wu et al., 2021). The introduction of the PLES concept, structured around distinct land use functions, has spurred the emergence of related research findings (Zhang and Li, 2022; Liu C. et al., 2024; Zhang, Zheng, and Qin, 2023; Zhang S. et al., 2022). Wang J. et al. (2023), Zhang R. et al. (2022) analyzed land pattern changes and their drivers from a PLES perspective. Wang et al. (2022) assessed the spatiotemporal dynamics of ecosystem service values in the Dongliao Basin and revealed the mechanisms of its response to changes in PLES. However, research integrating LER with PLES perspectives remains relatively sparse. In contrast to studies focusing solely on land use types, an approach rooted in PLES can effectively demonstrate the holistic nature and distinctions among production, living, and ecological spaces, thereby enhancing the spatial portrayal of land use functionalities (Liang et al., 2022).
During urbanization, there exists a reciprocal influence and constraint between urban development and the ecological environment (Zhao et al., 2017). On one hand, various pollutants generated during urbanization can damage the ecological environment, leading to ecological challenges. Conversely, the degradation of the ecological environment can impede the pace of urbanization. The harmonious development of urbanization and the ecological environment is crucial for achieving sustainable development in cities and regions. Presently, research predominantly concentrates on LER conditions and their spatiotemporal variations in specific locales such as watersheds, provinces, and mining areas. However, there is limited exploration regarding the specific interplay between these factors and urban development. Thus, the adoption of the “decoupling” theory aids in precisely describing the correlation between urbanization levels and LER. Coined initially by the Organization for Economic Co-operation and Development (OECD) towards the close of the previous century, the “decoupling” concept delineates the process of disentangling economic growth from environmental stresses (Kong et al., 2021). In 2005, Tapio expanded on the concept of “decoupling elasticity” derived from decoupling theory, advancing an elasticity decoupling model (Tapio, 2005). Compared with the OECD decoupling model, Tapio’s theory is characterized by its enhanced objectivity and accuracy. It underscores absolute decoupling scenarios and further distinguishes between weak and strong decoupling scenarios depending on the elasticity coefficients and accordingly (Yang and Li, 2023).
The cities along the lower reaches of the Yangtze River (CLRYR) are located in the central core of the Yangtze River Delta, renowned as China’s most economically dynamic region and a prominent example of rapid urbanization (Tan et al., 2021). Against the background of rapid socio-economic development, the region faces significant challenges of landscape fragmentation and escalating human-land conflicts (Yang et al., 2022). Owing to their distinctive geographical placement, the ecological condition of these cities exerts a direct impact on the ecosystem of the Yangtze River Basin. Therefore, CLRYR was chosen as the study area to quantitatively evaluate its LER and comprehensively investigate the correlation between urbanization levels and LER. These findings will hold significant practical implications for enhancing land resource management, safeguarding ecosystem stability and security, and fostering harmonious coexistence between humanity and nature. They will serve as a scientific foundation for pursuing sustainable development in the CLRYR region and provide a theoretical framework for exploring the interplay between societal development and natural ecosystems.
The subsequent structure of this study unfolds as follows: Section 2 provides a brief overview of the current situation and the supporting data within the study area. Section 3 outlines the methodological framework and theoretical principles that underpin this study. Section 4 presents the analysis of the results, offering a comprehensive assessment of the functional spatial changes in the CLRYR area from the perspective of PLES, alongside an exploration of the spatiotemporal dynamics of LER. This section also examines the region’s urbanization development and analyzes its interconnected relationship with LER. In Section 5, suggestions for the development of CLRYR were proposed and the limitations of this study were discussed. Finally, Section 6 summarizes the main findings of this study.
2 Study area and data sources
2.1 Study area
The Yangtze River, the largest river in China, has a total length of over 6,300 km. Originating from Tanggula Mountain in Qinghai Province, the mainstream flows from west to east through 11 provincial administrative regions and finally flows into the East China Sea on Chongming Island in Shanghai (Liu L. et al., 2023). The main channel of the Yangtze River flows from west to east, encompassing numerous tributaries and characterized by distinctive geographical features and considerable developmental opportunities (Kong et al., 2019). The Yangtze River region encompasses three major urban agglomerations in China, with particular emphasis on the downstream Yangtze River Delta region, which holds a crucial role in China’s economic advancement. Known for its high economic activity, urbanization rate, and innovation capacity, it ranks among the nation’s leaders in these aspects and occupies a strategic position in China’s comprehensive modernization and opening-up efforts. Nevertheless, the region grapples with significant challenges related to land use conflicts, and the ecological health directly impacts the broader Yangtze River Basin ecosystem.
Therefore, this study mainly focuses on cities in the CLRYR region covered by the Yangtze River Delta (as shown in Figure 1), including Shanghai City; Anqing, Chizhou, Tongling, Ma’anshan, and Wuhu in Anhui Province; as well as Nanjing, Zhenjiang, Yangzhou, Taizhou, Changzhou, Nantong, Wuxi, and Suzhou in Jiangsu Province. The downstream area features a blend of hills and plains that are conducive to agriculture and habitation. It is the longest and most mature area for land development and utilization in the Yangtze River Basin.
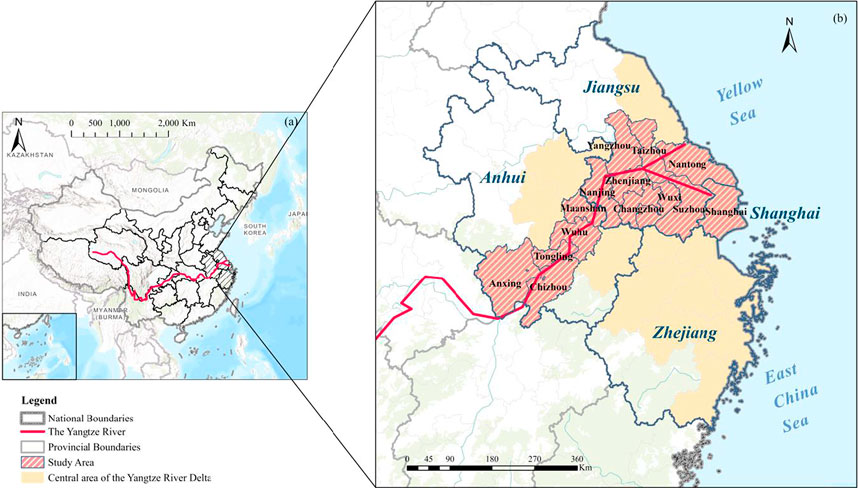
Figure 1. The geographical location of the study area.
2.2 Data sources
The research object of this study is 14 cities located in CLRYR and the research period is from 2000 to 2020. This study mainly relies on land use data and statistical yearbook data for analysis. The land use data, which is the basis for constructing the LER model, is derived from the China multi-period land use dataset (CNLUCC) from the resource and environmental science data platform (http://www.resdc.cn/). This dataset employs a two-level classification system. At the first level, it categorizes land into six types: cropland, forest, grassland, water, built-up land, and unused land. Subsequently, the second level refines these categories into 25 types based on the initial classifications. Based on the secondary classification criteria and the differentiation between land use functions and land use types, drawing on existing research results (Deng and Yang, 2021; Li and Wu, 2022), a connection table between the PLES structure and land use types is established (as shown in Table 1). To investigate the spatiotemporal dynamics of LER amidst urbanization, this study references prior research and data comprehensiveness to select pertinent urbanization assessment indicators. These indicators are chosen based on the four principal dimensions of population, spatial configuration, economic development, and societal factors (Yi et al., 2024; Geng and Han, 2020). The statistical yearbook data spanning 2000 to 2020 from each city constitute crucial foundational data for constructing this indicator framework.
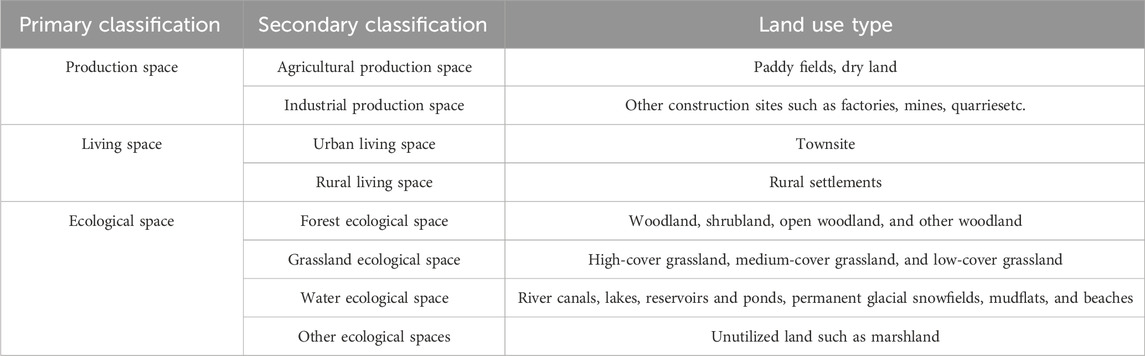
Table 1. PLES classification system of the CLRYR.
3 Methodology
The technical approach comprises several key components, outlined in Figure 2. Firstly, based on the reclassification tool in ArcGIS software, land use data is reclassified according to three functional categories: production, living, and ecological spaces. This facilitates analysis of the spatiotemporal evolution and transitions among different functional land types. Secondly, a grid-based approach divides the study area into equal-sized fishing net units, enabling the classification of land use data into units for risk assessment. The landscape ecological risk index (LERI) for each unit is computed using an assessment model, and the spatial distribution of LER across the CLRYR area from 2000 to 2020 is derived through kriging interpolation. Concurrently, specific spatiotemporal assessments of LER within each city are conducted using mean statistics and Moran’s I. Subsequently, multidimensional indicators are selected to construct an urbanization assessment system for evaluating urbanization levels. Moreover, the migration of the center of gravity and standard deviation ellipse (SDE) are employed to illustrate changes in the urbanization direction of CLRYR. Finally, by analyzing the ratio of LERI change rates to urbanization change rates, the study assesses the decoupling relationship between urbanization and ecosystems, proposing targeted ecological protection measures accordingly.
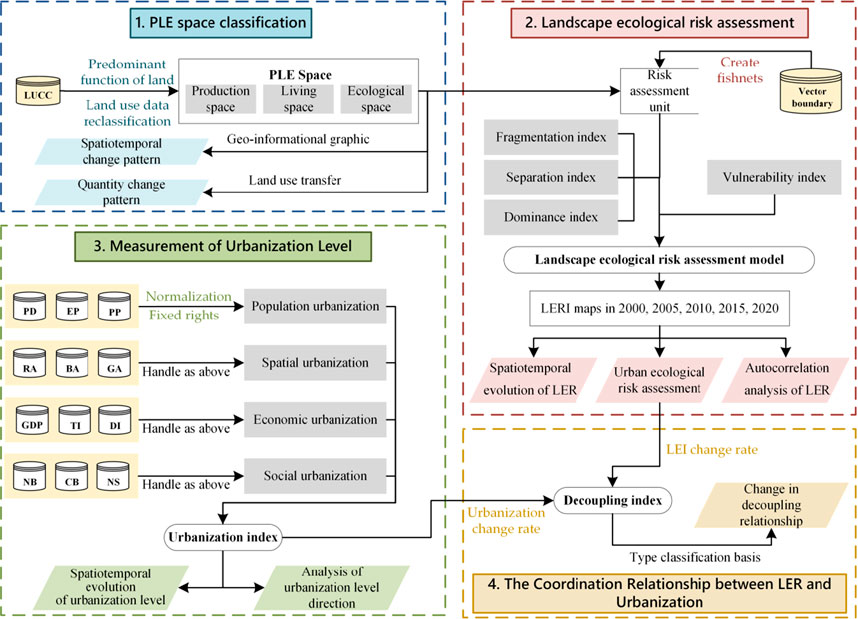
Figure 2. The workflow of this study.
3.1 LER assessment model
The LER value quantifies the resistance of an area to external disturbances. A higher LER indicates lower resistance to disturbances, and conversely. According to the principles of landscape ecology, the minimum unit for evaluation should be 2–5 times the average patch area. Considering the average patch size and characteristics of the study area, the CLRYR region was divided into 4,029 risk units using the ArcMap fishing net tool, with each unit measuring
where
3.1.1 Landscape interference index (
The calculation principle of landscape interference index can be found in Equations 2–5:
Where a, b, and c are the weights of the landscape fragmentation index (
3.1.2 Landscape vulnerability index (
The landscape vulnerability index reflects the sensitivity of different landscape types to external disturbances, where higher values indicate greater vulnerability. Referring to the results of existing studies (Du et al., 2023), this study assigns weights to eight land use types, which are urban living space, rural living space, forest ecological space, grassland ecological space, agricultural production space, water ecological space, industrial production space, and other ecological space in ascending order. By normalizing the weights using the arctangent function, the vulnerability indexes were obtained as 0.5000, 0.7048, 0.7952, 0.8440, 0.8743, 0.8949, 0.9097, and 0.9208, respectively. The calculation principle of landscape vulnerability index can be found in Equation 6:
Where
3.2 Urbanization level evaluation system
The entropy value method provides an objective approach by calculating entropy weights for each indicator, thereby effectively quantifying and assessing the significance and impact of various indicators (Wang et al., 2021b). Hence, this study adopts Shannon’s entropy concept to develop an urbanization index system tailored for the CLRYR area, with the resulting weights of each index presented in Table 2. Given that the selected indicators vary in scale and units but are all positively oriented, standardization is necessary before weight calculation. The standardized formula is shown in Equation 7.
Where
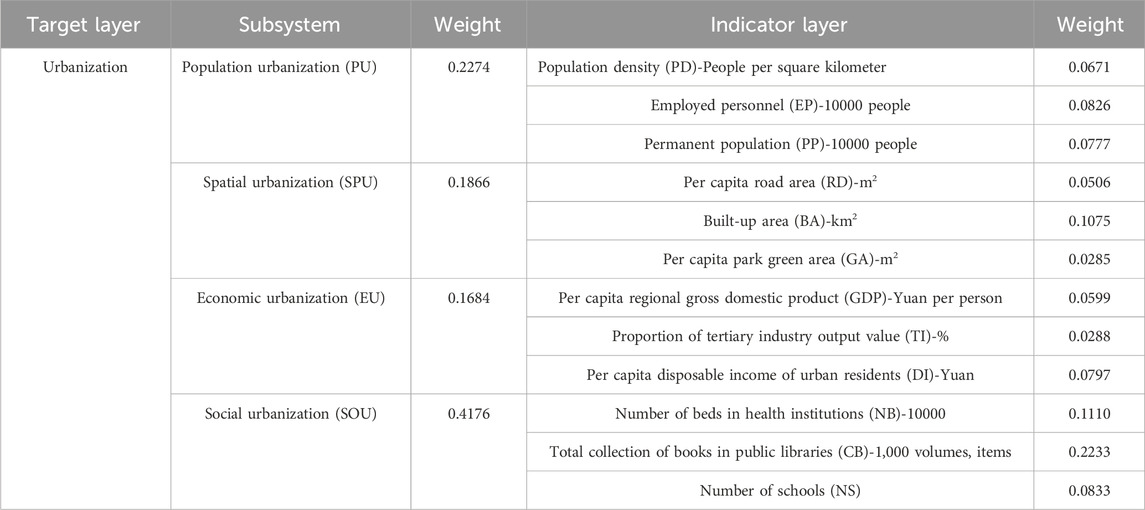
Table 2. The evaluation index system for the urbanization of CLRYR.
To avoid extreme values of the weights, such as 0 and 1, the normalized indicator values are shifted, i.e., the overall normalized value is made to add 0.0001 before the subsequent weights are calculated (as shown in Equation 8):
Calculate the proportion of the
Calculate the information entropy of the
Calculate urbanization index (as shown in Equation 11):
Where
3.3 Spatial autocorrelation
In this study, global Moran’s I was employed to evaluate the spatial correlation across the entire CLRYR region, aiming to identify any global spatial clustering phenomenon (Liu et al., 2023a). Concurrently, local spatial autocorrelation analysis was utilized to examine spatial correlation within specific regions, providing further insights into local spatial clustering patterns (Liu Y. et al., 2024).
3.4 SDE method
SDE is a statistical tool used to accurately characterize the spatial distribution of study elements (Lefever, 1926). In this study, the parameters such as coordinates of the center of the ellipse, azimuth, and the standard deviation of the long and short semi-axes are employed to reflect the spatial change trend of the urbanization level in the CLRYR. The specific calculation formula can be found in the reference (Zhang Y. et al., 2022).
3.5 Tapio decoupling model
In this study, the tapio decoupling model was introduced to analyze the relationship between urbanization level and LER in the CLRYR region, to measure the resilience of LER to change in the urbanization process, i.e., the degree of decoupling between the two. The method is based on the ratio of the rate of change in LER to the rate of change in urbanization level, termed the decoupling index, to quantitatively describe this relationship (Dong et al., 2021). Based on the value of the decoupling index and its positive and negative situations, the type of decoupling state and its trend can be determined (Kong et al., 2019). The specific formulas and classification criteria of the model are shown in Equation 12 and Table 3, respectively.
Where
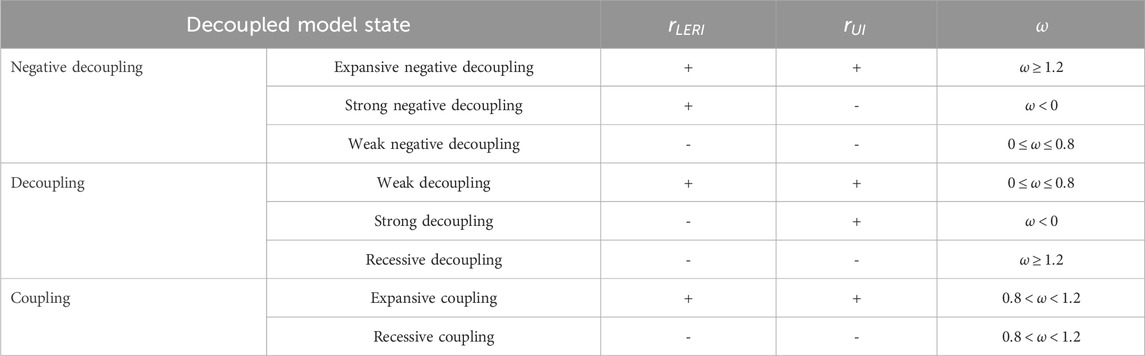
Table 3. Types of decoupling states.
4 Results
4.1 The spatiotemporal distribution of PLES
Land use types are the product of the interaction between human activities and natural environmental factors, reflecting the impact of human social activities on ecosystems. This study explores the spatiotemporal evolution law of land use in CLRYR from the perspective of PLES from 2000 to 2020 in terms of spatial distribution (as shown in Figure 3), quantity structure (as shown in Figure 4) and type transfer (as shown in Figure 5). The production space forms a wide distribution in the eastern part of CLRYR, which is the dominant area of PLES. In the secondary production space, agricultural production areas notably exceed industrial zones. Nevertheless, there has been a declining trend in the agricultural production space over the years, while the industrial production space shows a corresponding increase. The living space exhibits a radial distribution pattern, primarily concentrated near the Yangtze River coast, with a noticeable trend of outward expansion. This expansion is particularly pronounced in Shanghai, where the concentration of living space is most prominent. Guided by national policies, the extent of each ecological space type remained relatively stable from 2000 to 2020. Forest and grassland ecological spaces predominated during this period concentrated notably in Anqing, Chizhou, and Tongling. Water ecological space was primarily observed along the main branches and tributaries of the Yangtze River, as well as in areas surrounding Taihu Lake.
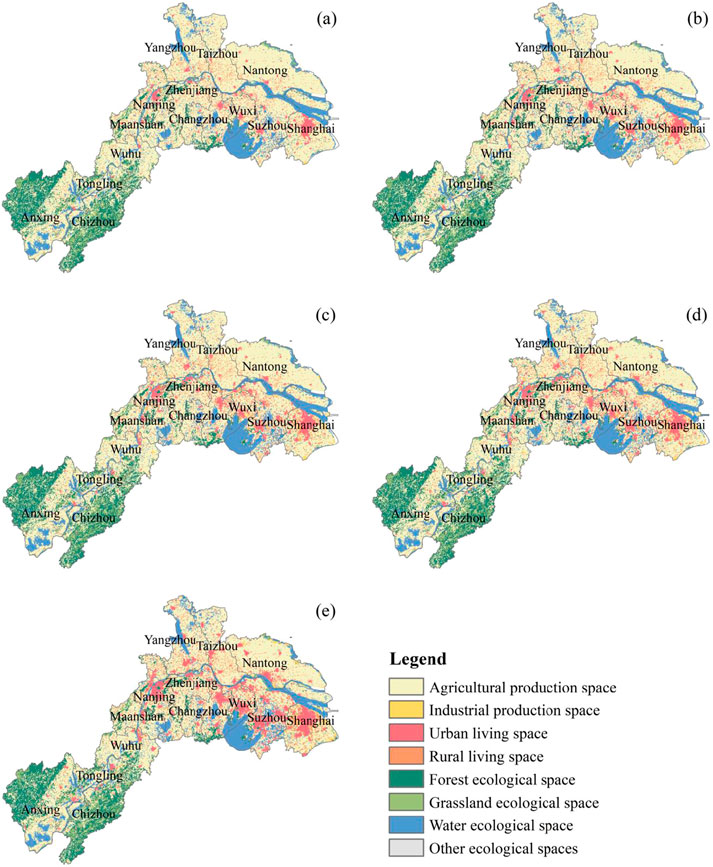
Figure 3. Spatial distribution of PLES in CLRYR region in 2000 (a), 2005 (b), 2010 (c), 2015 (d), and 2020 (e).
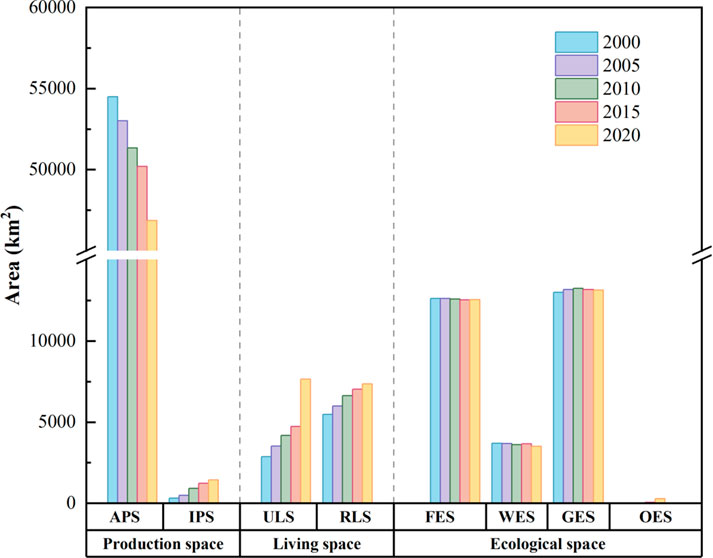
Figure 4. Area changes of each PLES type. Note: APS, IPS, ULS, RLS, FES, WES, GES, and OES represent agricultural production space, industrial production space, urban living space, rural living space, forest ecological space, water ecological space, grassland ecological space, and other ecological spaces, respectively.
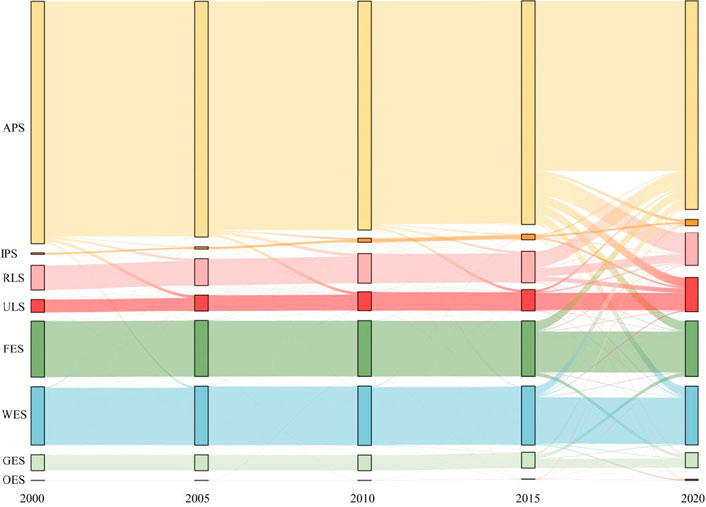
Figure 5. Change matrix PLES in CLRYR from 2000 to 2020.
Using GIS spatial analysis techniques, we computed the land use transfer matrix for PLES classification maps annually from 2000 to 2020, quantitatively exploring changes between each land use type, depicted in Figure 5. Regarding the types of transfers both into and out of various categories, the complexity has increased notably from 2000 to 2020, particularly accelerating between 2015 and 2020. In quantitative terms, the number of transfers of each type rose from 2015 to 2020, with the transfer of agricultural production space to living space being more obvious. This trend underscores the accelerated urbanization within the CLRYR, driven by substantial demands for land resources for urban development. Collectively, these shifts illustrate the rapid urbanization and restructuring of PLES within the CLRYR region over the past two decades, with significant implications for local development strategies, resource management, and social stability.
4.2 The spatiotemporal dynamics of LER
4.2.1 LER characteristics of the CLRYR region
To explore the heterogeneity of LER within the CLRYR, this study adopts the establishment of risk units to evaluate the risk of the whole. The results show that the mean LER value within the region from 2000 to 2020 is 0.2508, 0.2524, 0.2547, 0.2576, and 0.2573 in order. The LER of the CLRYR region shows a slightly increasing trend and is more stable from 2015 to 2020. Based on the 2000 LERI, the natural breaks method was used to classify five risk levels: [0, 0.1901] for lowest risk, (0.1901, 0.2362] for lower risk, (0.2362, 0.2670] for medium risk, (0.2670, 0.3053] for higher risk, and (0.3053, 0.4897] for highest risk. In this way, the spatial distribution of LER levels from 2000 to 2020 (as shown in Figure 6) and the area proportion of each level (as shown in Figure 7) were obtained. In the spatial distribution of LER levels in the CLRYR region, regions categorized as lower risk, medium risk, and higher risk predominate. Specifically, higher risk areas are mainly located in several cities in the southwestern part of the study area, whereas lower risk is primarily centered in Nantong City in the northeastern part. Over time, there has been varying growth in the proportion of lowest and highest risk areas: lowest risk areas are notably concentrated in cities such as Shanghai, Nanjing, Nantong, Suzhou, Changzhou, and Anqing, whereas highest risk areas have expanded annually from their initial base and are dispersed among multiple cities.
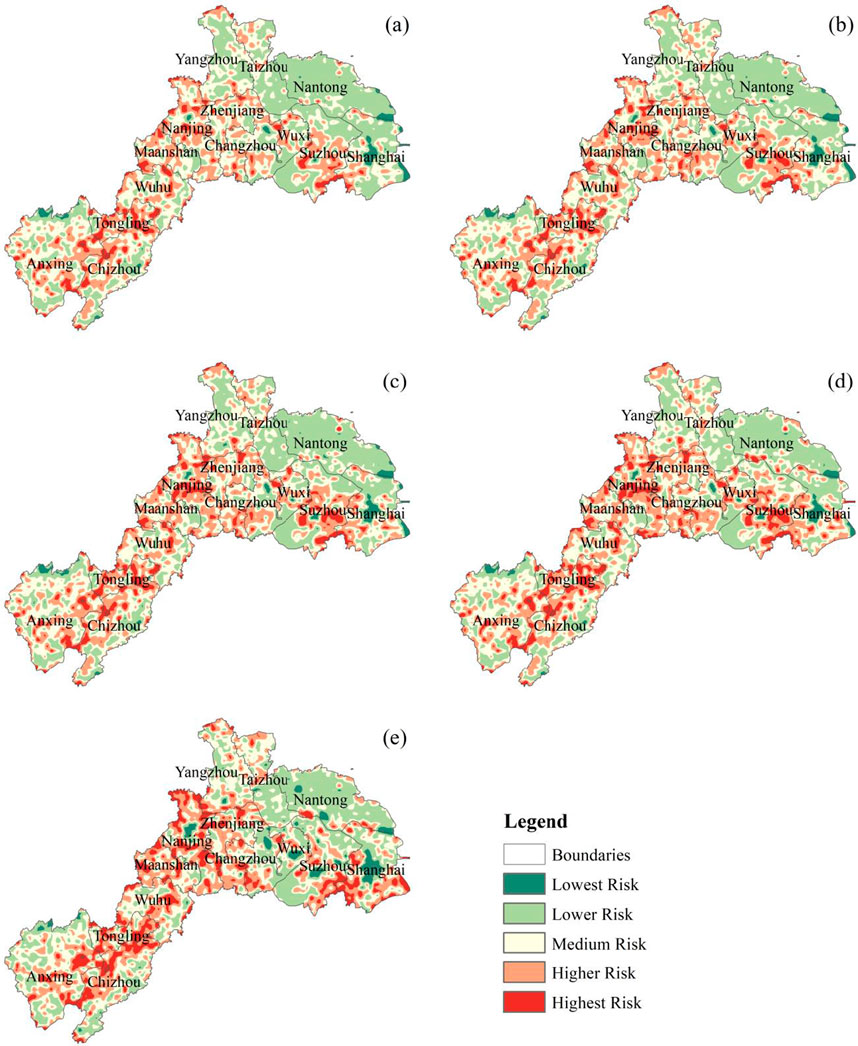
Figure 6. Distribution of LER levels in the CLRYR region in 2000 (a), 2005 (b), 2010 (c), 2015 (d), and 2020 (e).
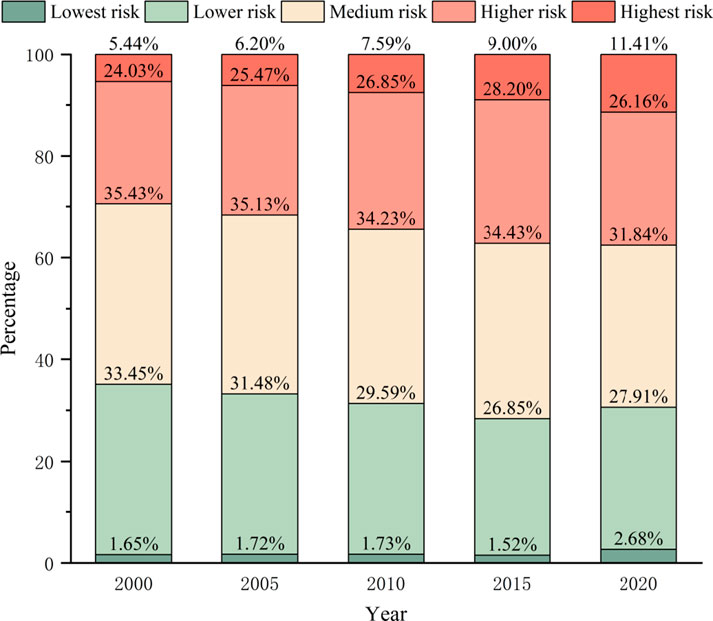
Figure 7. The proportion of areas with different LER levels.
4.2.2 Comparison of LER in various cities in CLRYR
The overall spatial distribution of LER does not sufficiently capture the disparities in LERI among different cities. Consequently, this study undertook a detailed analysis of LER across these cities, aiming to delineate their spatial distributions, and trends, and provide a foundational framework for formulating effective management and control strategies tailored to varying risk levels. Through a statistical examination of the mean LERI in each city, the study identified a general upward trend in LER across most cities (as shown in Figure 8). For example, Tongling, Wuhu, Ma’anshan, and Chizhou in Anhui Province, as well as Zhenjiang, Nanjing, Yangzhou, Taizhou, and Nantong in Jiangsu Province and Shanghai, exhibited consistent annual increases in the LERI. Conversely, certain cities maintained relatively stable LER levels, exemplified by Anqing City in Anhui Province, possibly influenced by regional environmental protection policies and urban development strategies. Moreover, specific cities experienced periods of decreased LER, including Changzhou, Wuxi, and Suzhou in Jiangsu Province, observed particularly in 2020, indicative of the efficacy of localized ecological restoration and environmental management initiatives.
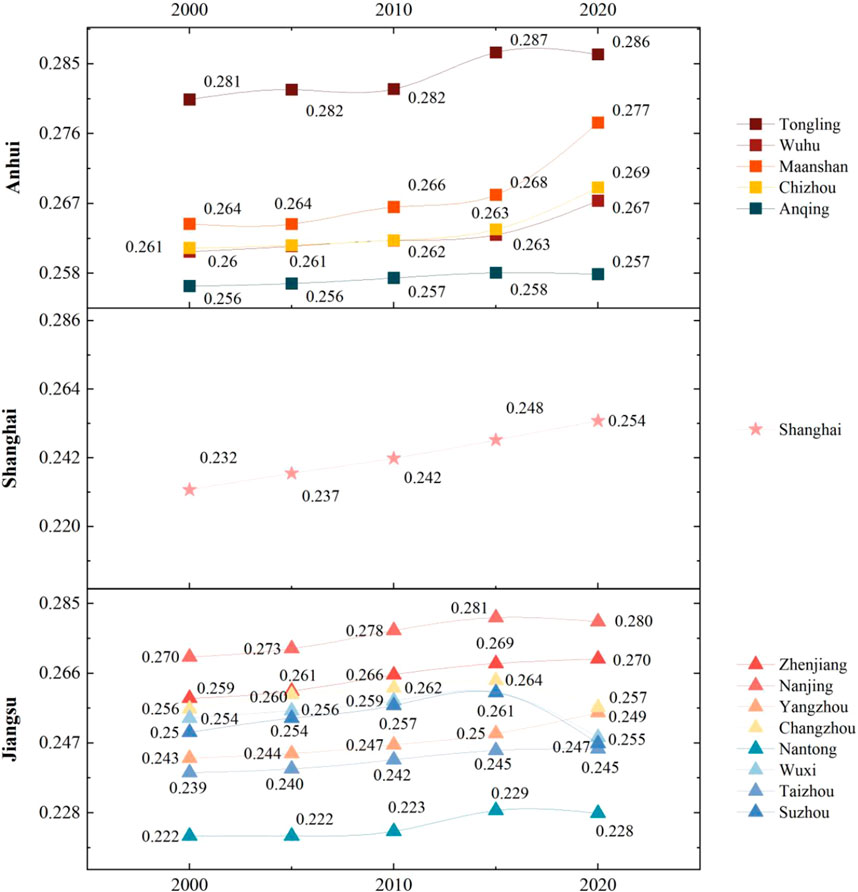
Figure 8. LERI values of 14 cities in the CLRYR region from 2000 to 2020.
4.2.3 Spatial autocorrelation analysis
To explore the spatial distribution pattern of LER from 2000 to 2020 in CLRYR, this study analyzed its spatial autocorrelation. Table 4 illustrates that the autocorrelation analysis of LER from 2000 to 2020 in CLRYR passed the significance test, and the global Moran’s I of 0.4733, 0.4014, 0.3326, 0.2462, and 0.4779 were all greater than 0 indicating that the spatial showed significant positive autocorrelation. Over time, Moran’s I showed a decreasing and then increasing trend, reflecting the dynamic evolution of the clustering effect of LER in the region. From 2000 to 2020, the clustering effect of the spatial distribution of LER decreased, followed by a resurgence to its peak in 2020. To further explore the spatial clustering characteristics of LER, local spatial autocorrelation analysis was conducted.
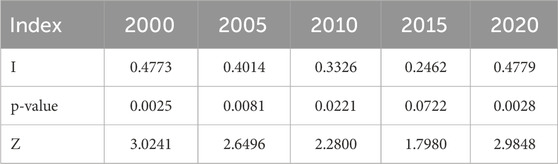
Table 4. Moran’s I result for LERI in CLRYR region.
Figure 9 depicts the local indicators of spatial association (LISA) clustering map of LER from 2000 to 2020. The findings highlight Wuhu as consistently demonstrating high-high agglomeration, indicating persistent spatial clustering of LER in the region over the entire period. In response to the current situation where land use in Wuhu is mainly based on agricultural production space, it is urgent to strengthen the protection and efficient utilization of cropland, and strictly limit the occupation of cropland by the urbanization process. Therefore, measures should be taken to optimize the land use structure and ensure the sustainability of agricultural land and its compatibility with ecological functions. In addition, by increasing green space coverage and constructing ecological corridors, the urban ecological environment can be effectively improved, ecosystem service functions can be enhanced, landscape fragmentation can be reduced, and the connectivity and stability of regional ecosystems can be improved. In contrast, cities situated near the Yangtze River estuary, such as Nantong and Shanghai, predominantly exhibit low-low agglomeration characteristics, suggesting sustained stability in ecological risk within these areas. It is noteworthy that the occurrence of low-high agglomeration was uniquely observed in Anqing in 2015, whereas high-low agglomeration was noted in Suzhou. This shift may be attributed to local environmental policies, shifts in economic structures, and natural geographic factors. The implementation of ecological restoration measures in Anqing from 2000 to 2020 contributed to stabilizing LER levels in that area, contrasting with neighboring cities where LER continued to increase. This dynamic underscores the low-high agglomeration pattern of Anqing distinct in LER during the specified period. Conversely, in regions like Suzhou, known for its picturesque landscapes and thriving tourism economy, the enhancement of LER may correlate closely with robust economic activities. Economic development typically coincides with urbanization and extensive infrastructure projects, factors that could potentially amplify the accumulation and dissemination of LER.
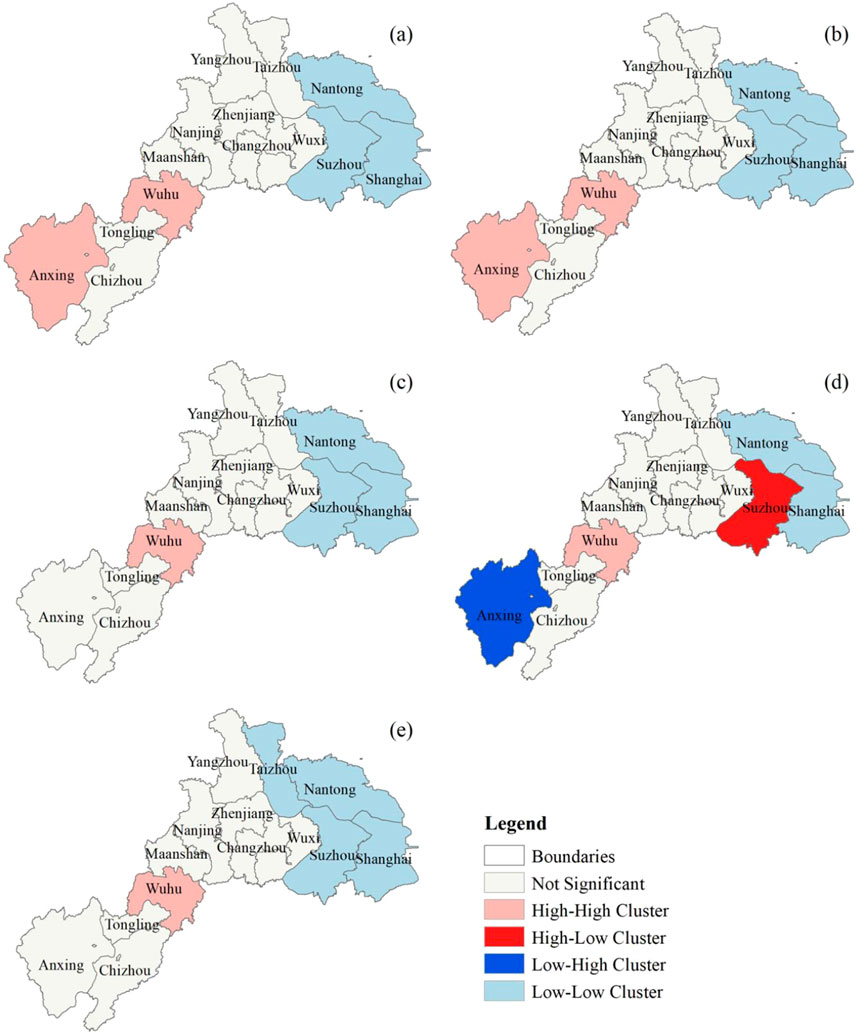
Figure 9. Spatial autocorrelation of LERI in 2000 (a), 2005 (b), 2010 (c), 2015 (d), and 2020 (e).
4.3 The response of LER in the context of CLRYR urbanization
4.3.1 Evolution of the spatiotemporal dynamics of the level of urbanization in the CLRYR region
The comprehensive evaluation of the urbanization level of the CLRYR region from 2000 to 2020 could reveal the characteristics of the spatial distribution of the urbanization process in the CLRYR region and its trends in different years. The results in Figure 10 show that the spatial urbanization index (SPUI), economic urbanization index (EUI), and UI of all cities show a steady increase year by year, albeit with a few cities experiencing declines in population urbanization index (PUI) and social urbanization index (SOUI). The sudden epidemic in 2019 (Liu et al., 2023b) caused a serious impact in all aspects, especially the employment-population was seriously affected, resulting in a decline in PUI in most cities. Compared with the period from 2000 to 2010, the increment of cities with rising PUI between 2010 and 2020 is significantly smaller. Based on the raw statistical yearbook data, certain components of the SOUI exhibit consistent growth, such as the number of beds in health institutions and the total library collections across cities. However, China’s policies on school consolidation and the reduction of rural schools have led to varying declines in the number of schools, particularly elementary schools, annually across different cities. Consequently, this has resulted in diverse changes in each city’s SOUI. Nevertheless, overall urbanization levels in the region continue to ascend steadily.
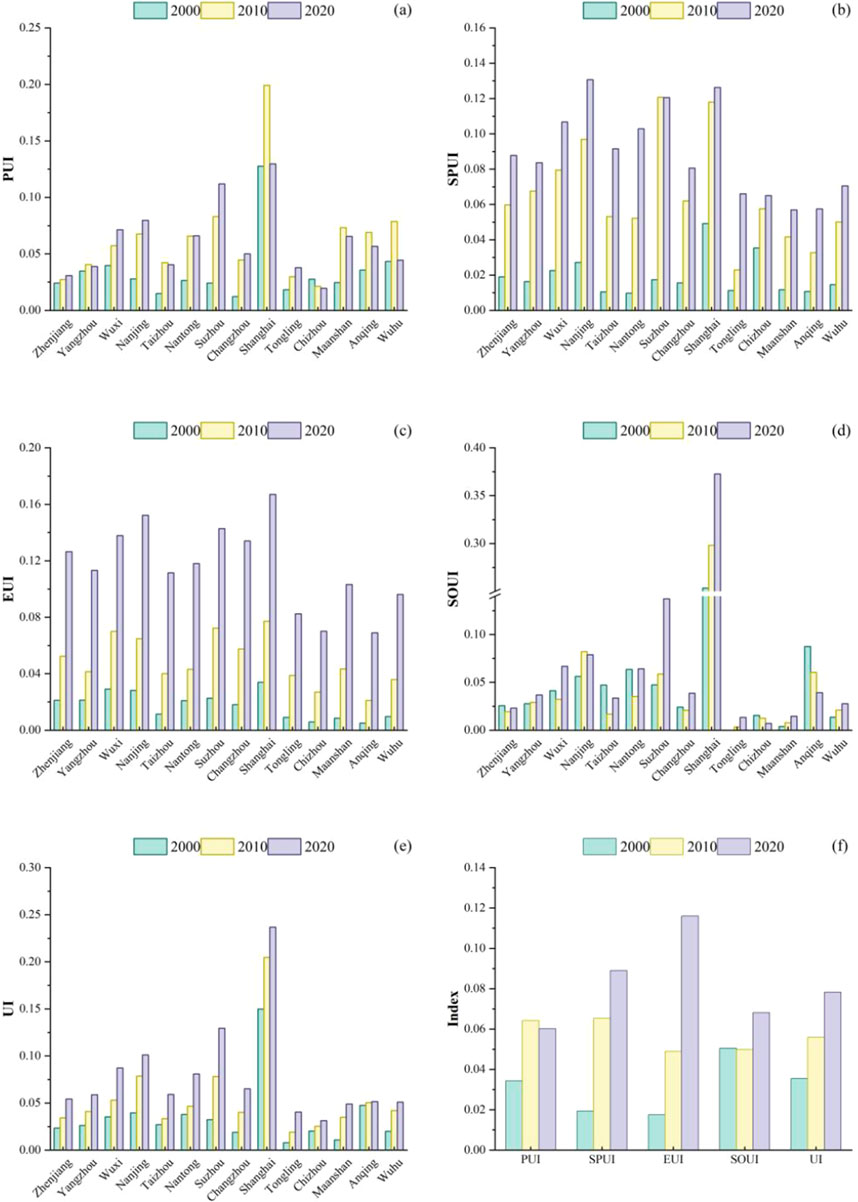
Figure 10. Urbanization level of various cities in CLRYR region from 2000 to 2020. (a) PUI; (b) SPUI; (c) EUI; (d) SOUI; (e) UI; (f) Index.
Utilizing the quantile method to categorize the comprehensive index of urbanization development in CLRYR and its four subsystem indexes, each of which was segmented into five levels, which in turn led to the spatial visualization results (as shown in Figure 11). Figure 11 reveals that cities situated near the mouth of the Yangtze River, particularly centered around Shanghai, exhibit higher urbanization levels, with urbanization levels gradually decreasing towards the west in 2000 compared to the east. The spatial distribution illustrates a progressive increase in urbanization from lower to higher grades across most cities, notably with a notable rise in the number of cities in the higher-grade categories. Referring to Figures 11m-o, it is evident that as of 2020, only Chizhou, Anhui Province remains classified in the lowest urbanization grade, whereas all other cities have moved into middle and upper grades.
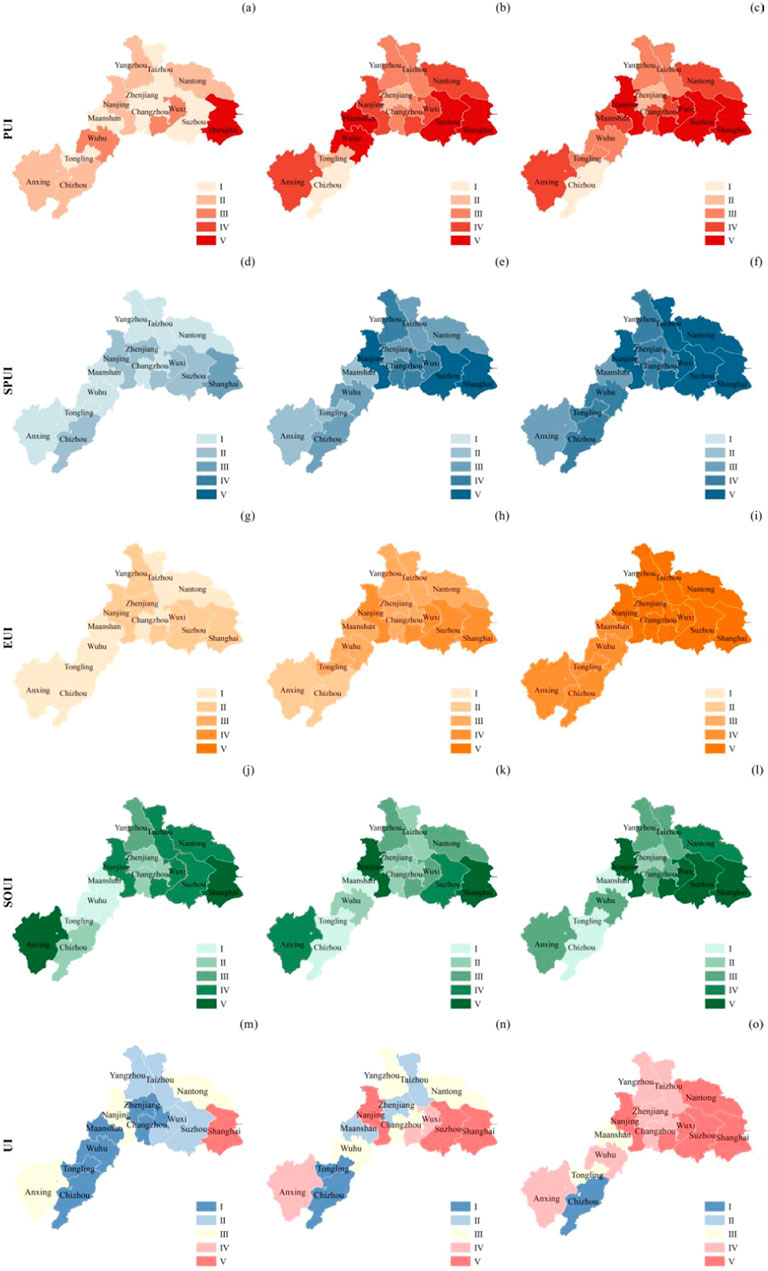
Figure 11. Spatial evolution of urbanization levels in various cities in CLRYR region from 2000 to 2020. (a) PUI in 2000; (b) PUI in 2010; (c) PUI in 2020; (d) SPUI in 2000; (e) SPUI in 2010; (f) SPUI in 2020; (g) EUI in 2000; (h) EUI in 2010; (i) EUI in 2020; (j) SOUI in 2000; (k) SOUI in 2010; (l) SOUI in 2020; (m) UI in 2000; (n) UI in 2010; (o) UI in 2020.
4.3.2 Distribution characteristics of urbanization level direction in the CLRYR region
This study depicts the evolution of CLRYR urbanization from 2000 to 2020 through the visualization of SDEs and the trajectory of the center of gravity migration. Figure 12 provides a spatial representation of this evolution, while Table 5, 6 analyze the spatial distribution and dynamic characteristics of urbanization in CLRYR using the center of gravity and SDE parameters. The center of gravity of urbanization in CLRYR shifted from 2000 to 2020 between
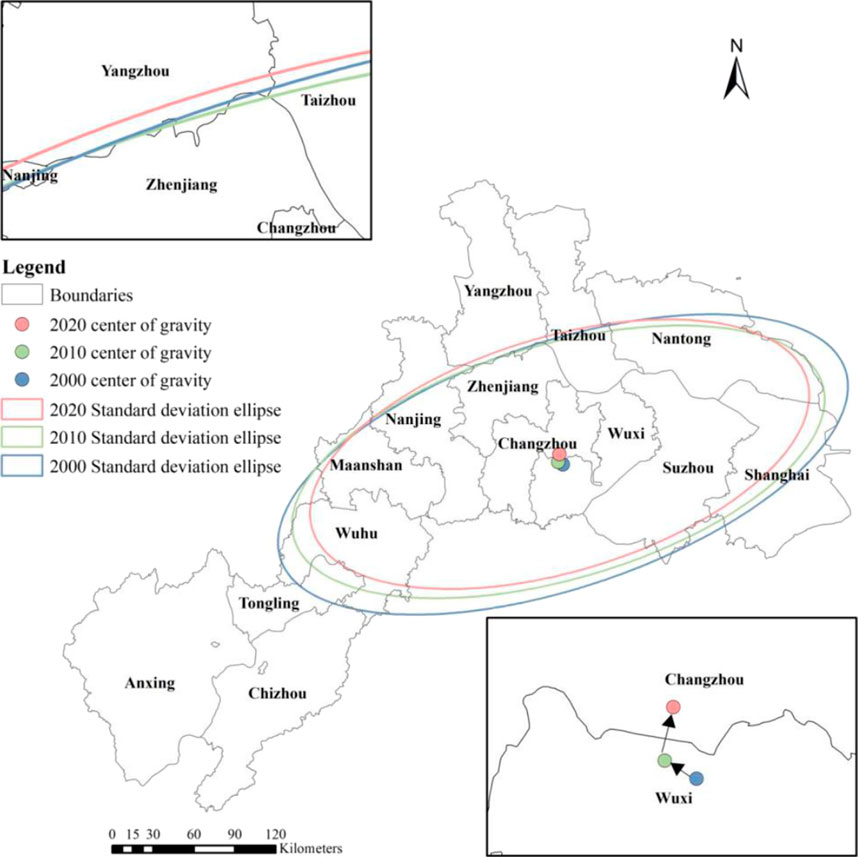
Figure 12. Directional distribution of urbanization index.
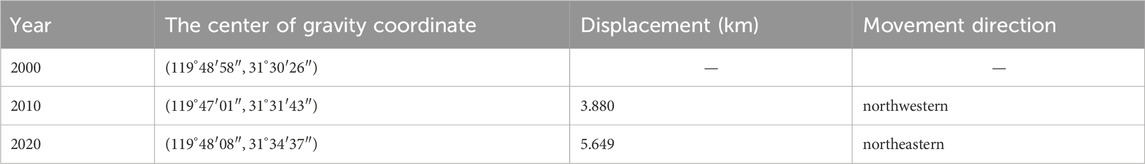
Table 5. Shift of urbanization index center of gravity in the CLRYR region during 2000–2020.

Table 6. SDE parameters of urbanization index in CLRYR region.
From a spatial distribution perspective, the SDEs of urbanization in the CLRYR region from 2000 to 2020 are primarily concentrated in the eastern part of the area. These ellipses show a clear directionality, and their total area shows a trend of shrinking from 61,916.413 km2 in 2000 to 51,242.005 km2 in 2020, which reflects the phenomenon of increasing urbanization with more aggregated regional urban space. In terms of spatial distribution direction, the dominant azimuth of the SDE of urbanization in the CLRYR region has a maximum range of
4.3.3 Evolution of the decoupling relationship between urbanization and LER in the CLRYR region
The existence of developmental diversity in urbanization levels and spatial heterogeneity in LER among cities in the CLRYR region led to different performances in the state of decoupling among cities (as shown in Table 7). Generally, the decoupling relationship between LER and urbanization development in the CLRYR region manifests predominantly in two primary patterns: weak decoupling and strong decoupling, with strong decoupling representing the optimal state. In the first stage, the rate of change of both the ecological risk index and the urbanization index is greater than 0. However, the decoupling index of the municipalities from 2000 to 2010 is less than 0.8, indicating a state of weak decoupling. This suggests that during this period, urbanization levels in these cities increased while ecological risks persisted, albeit with a lower rate of change in LER compared to urbanization development. In the second stage, a majority of cities continue to exhibit weak decoupling. Differently, while the urbanization trend in Wuxi, Suzhou, and Changzhou continues, LERI showed negative growth from 2010 to 2020, with decoupling indexes of −0.0600, −0.0615, and −0.0323, respectively, indicating a transition from weak decoupling to a strong decoupling state. Among various decoupling relationships, strong decoupling is considered an ideal state. Based on the discussion of the relationship between LER and urbanization in this study, strong decoupling means a separation trend of positive and negative growth between the urbanization process and LER, that is, the increase of urbanization is accompanied by the decrease of LER. This achievement can be attributed to the continuous strengthening of rational land use planning in these cities, which has achieved significant results through promoting agricultural land consolidation and measures centered on efficient and intensive land use, strictly controlling the scale of construction land. These cities represent a minority achieving the ideal state, highlighting that in most others, urbanization progress likely continues at the expense of ecological concerns. Consequently, concerted efforts are essential in the CLRYR region to enhance LER management and foster sustainable, harmonious development between urban areas and ecosystems.
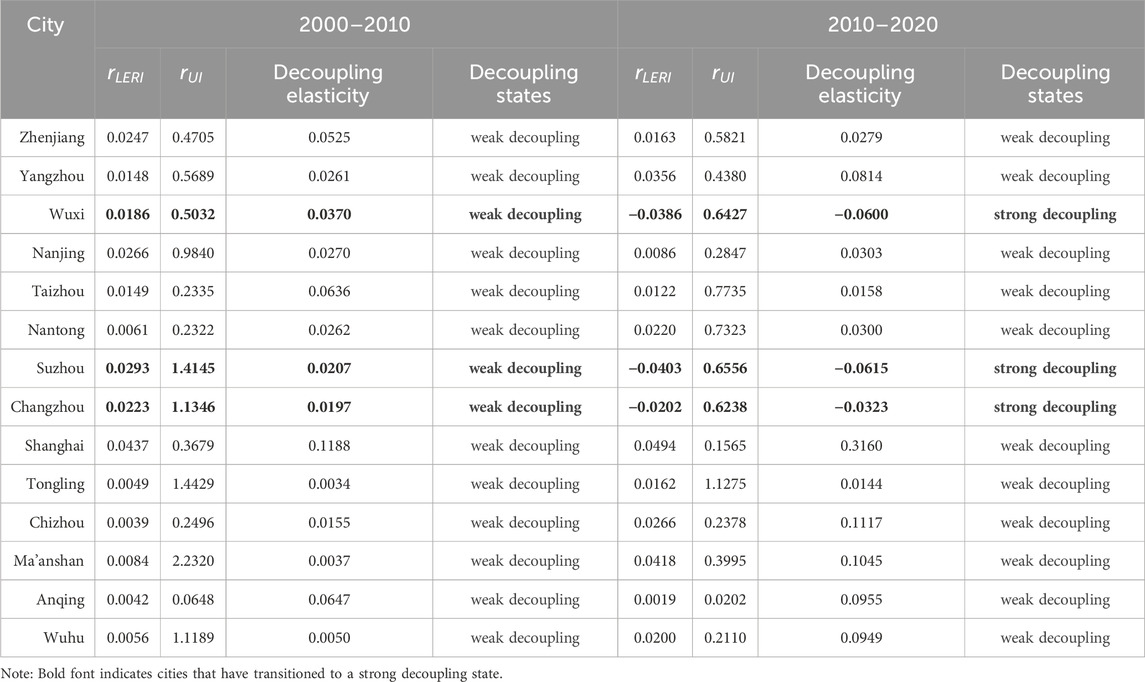
Table 7. Decoupling index of urbanization and LER in CLRYR regional from 2000 to 2020.
5 Discussion
5.1 Inspiration for urban planning
Drawing upon the established framework laid out in previous research (Hui et al., 2024; Vadén et al., 2020; Xin et al., 2023), studying the correlation between LER and urbanization from the perspective of PLES can provide a deeper understanding of the degree of disconnect between economic expansion, resource consumption, and environmental burden in the process of urbanization. The decoupling results show that only Wuxi, Suzhou, and Changzhou have shifted from weak decoupling to the ideal state of strong decoupling, highlighting the common challenges faced by most cities in ecological risk management during urbanization. Drawing upon these findings, several recommendations can be proposed.
5.1.1 Strengthening the integration of spatial planning and ecological protection
In response to the abundant wetland resources in the lower reaches of the Yangtze River, measures such as ecological red line delineation and wetland restoration should be taken to protect the key ecological functions of wetland ecosystems, such as water purification and carbon storage. In the planning, ecological protection zones and wetland protection belts can be established to prevent large-scale urban development from encroaching on and damaging wetlands. Based on the natural conditions of the lower reaches of the Yangtze River and the existing ecological network, plan an integrated green infrastructure system. For example, by restoring and connecting ecological environments such as forests, wetlands, and water bodies around cities, ecological corridors at the watershed scale can be formed to promote biodiversity conservation and enhance the adaptive capacity of urban ecosystems.
5.1.2 Promote the construction of ecological compensation mechanisms
Given that the lower reaches of the Yangtze River involve multiple administrative regions, it is possible to promote ecological compensation agreements between provinces or cities. By establishing unified compensation standards and funding allocation mechanisms, we can promote ecological cooperation between different cities and regions, and reduce the imbalance of ecological protection. Enterprises in the Yangtze River region, especially those involved in high ecological risks such as water resources and land development, can be incentivized to fulfill their ecological protection responsibilities through tax incentives, financial subsidies, and other means. It is suggested to introduce targeted incentive policies to encourage enterprises to carry out ecological restoration and green technology innovation and enhance their environmental awareness and social responsibility.
5.1.3 Strengthen environmental monitoring and assessment
In response to the ecological risks faced by cities along the lower reaches of the Yangtze River, such as water pollution and floods, it is recommended to establish an intelligent ecological risk warning system that utilizes technologies such as big data and the Internet of Things to monitor environmental changes in real-time, predict and respond to potential ecological risks in advance, and enhance the city’s emergency response capabilities. Based on environmental monitoring, regular evaluations of urban ecological carrying capacity should be conducted to clarify the maximum carrying capacity of ecosystems in various regions, and plans for land use, urban expansion, resource development, and other aspects should be adjusted based on the evaluation results. This mechanism ensures that the urbanization process does not exceed the limit of ecological carrying capacity, thereby promoting the harmonious unity of the ecological environment and urban development.
5.2 Limitations and future research directions
In this study, we first proposed a land use classification system from the perspective of PLES and analyzed the spatiotemporal evolution of the PLES employing the transfer matrix model. The results of the study reveal that industrial production space and living space have shown a continuous growth trend in the past few years, reflecting the expansion of industrialization and urbanization scale in the urbanization process. In contrast, the area of agricultural production space has markedly diminished, potentially attributable to urban encroachment or conversion to alternative uses. The fluctuating pattern observed in ecological spaces underscores their susceptibility to the combined pressures of urbanization, industrialization, and environmental conservation policies. Secondly, building upon this foundation, the LER evaluation model was developed using a 5 km × 5 km grid as the assessment unit, employing landscape pattern indexes. It is found that the overall LER of the CLRYR area is rising and the highest-risk area is expanding, which means that the ecological ability of the area to resist external disturbances is poor and the ecological environment is more fragile. Finally, through the application of the Tapio decoupling model to dynamically analyze the interplay between urbanization and LER.
There is still some room for improvement. While previous scholars have explored various aspects of PLES classification, a standardized system remains elusive. With the help of related studies, this study reclassified the CNLUCC based on performance functions classified at the secondary level. However, whether this classification optimally serves LER evaluation in the CLRYR area warrants further investigation. In addition, the LER assessment model of this study relies too much on the status of land use functions. Yet, LER assessment is inherently intricate, involving uncertainties such as precipitation, soil quality, and socio-economic factors, which were not fully addressed. In addition, the LER assessment model is susceptible to the influence of landscape scale changes when combined with landscape ecology theory, and current research has not fully addressed the issue of scale selection. Therefore, future research should focus on exploring the optimal scale setting to improve the accuracy and reliability of evaluation results. Finally, the urbanization indicator system proposed in this study (including population, space, economy, and social subsystems) can provide a macro evaluation framework for the level of urbanization. However, it fails to fully reflect the complex informal urbanization patterns in China’s urbanization process, especially in areas such as suburbanization and land speculation. These informal urbanization models have had a significant impact on the spatial layout, social structure, and economic development of cities, and are worthy of attention in future research. Overall, to achieve sustainable development and ecological security of cities in the Yangtze River Basin, it is necessary to further deepen the research on the balance mechanism between urban development and ecological protection, to more accurately guide the formulation and implementation of regional ecological compensation policies.
6 Conclusion
To explore the spatiotemporal evolution of LER in the context of urbanization, this study focuses on the economically dynamic CLRYR region. We examined the evolving relationship between LER and urbanization, as well as emphasizing decoupling dynamics. Firstly, the spatiotemporal process of land function change in CLRYR is summarized using PLES as the study perspective. Secondly, the spatial distribution characteristics and patterns of ecological risk in CLRYR from 2000 to 2020 are revealed by constructing a LER assessment model. Lastly, the decoupling status between urbanization and LER is explored based on measurements of urbanization levels. The conclusion of this study is as follows:
(1) In the CLRYR region, production space and ecological space are the predominant types of PLES, with living space following closely. From 2000 to 2020, the area of industrial production space and living space steadily increased. On the contrary, the agricultural production space shows a downward trend, while the ecological space presents a fluctuating pattern.
(2) From 2000 to 2020, the LER in the CLRYR region showed an upward trend of 0.2508, 0.2524, 0.2547, 0.2576, and 0.2573, respectively, characterized by an increasing proportion of high-risk areas with wide spatial distribution. Results of Moran’s I indicated a significant positive spatial autocorrelation of LER across the CLRYR region.
(3) Assessing the decoupling dynamics, only three cities—Wuxi, Suzhou, and Changzhou—transitioned from a period of unsustainable development between 2000 and 2010 to a mutually beneficial scenario for urbanization and the environment from 2010 to 2020. Conversely, other cities in the region have largely maintained a less favorable developmental trajectory during this period.
The study findings indicate that cities experiencing rapid social development also encounter elevated ecological risks, underscoring the critical need for monitoring and managing land use changes. These results offer a scientific foundation for regional policymakers to refine policies aimed at mitigating ecological risks and overcoming various challenges on the path to sustainable development in CLRYR. In addition, the construction of an LER assessment model based on the PLES analysis framework provides a scalable methodological tool for analyzing the ecological effects of urbanization, especially for exploring the balance between economic growth and ecological protection in ecologically sensitive urban agglomerations in developing countries.
Data availability statement
The original contributions presented in the study are included in the article/supplementary material, further inquiries can be directed to the corresponding authors.
Author contributions
YG: Writing – original draft. WW: Writing – original draft. XtZ: Writing – original draft. CL: Writing – review and editing. YW: Writing – review and editing. WC: Writing – review and editing. XW: Writing – review and editing. XnZ: Writing – original draft. YuL: Writing – original draft. XyZ: Writing – review and editing. YaL: Writing – original draft.
Funding
The author(s) declare that financial support was received for the research and/or publication of this article. This research was funded by the Open Funding of Chongqing Big Data Collaborative Innovation Center, grant number CQBDCIC202305; and Youth Innovation Team Project of Higher School in Shandong Province, China, grant number 2024KJH087.
Acknowledgments
We sincerely thank the reviewers and associated editors for their valuable and constructive comments and suggestions that helped to improve this paper.
Conflict of interest
The authors declare that the research was conducted in the absence of any commercial or financial relationships that could be construed as a potential conflict of interest.
Generative AI statement
The author(s) declare that no Generative AI was used in the creation of this manuscript.
Publisher’s note
All claims expressed in this article are solely those of the authors and do not necessarily represent those of their affiliated organizations, or those of the publisher, the editors and the reviewers. Any product that may be evaluated in this article, or claim that may be made by its manufacturer, is not guaranteed or endorsed by the publisher.
References
Ai, J., Yu, K., Zeng, Z., Yang, L., Liu, Y., and Liu, J. (2022). Assessing the dynamic landscape ecological risk and its driving forces in an island city based on optimal spatial scales: haitan Island, China. Ecol. Indic. 137:108771. doi:10.1016/j.ecolind.2022.108771
Cao, H. F., and Shen, Y. W. (1991). Brief review: ecological risk assessment research. Environ. Chem. 10 (3), 26–30. doi:10.1007/978-90-481-9757-6_13
China. (1994). China statistical yearbook: China statistical information and consultancy service center.
Deng, Y., and Yang, R. (2021). Influence mechanism of production-living-ecological space changes in the urbanization process of guangdong Province, China. Land 10 (12), 1357. doi:10.3390/land10121357
Dong, F., Li, J., Zhang, X., and Zhu, J. (2021). Decoupling relationship between haze pollution and economic growth: a new decoupling index. Ecol. Indic. 129:107859. doi:10.1016/j.ecolind.2021.107859
Du, L., Dong, C., Kang, X., Qian, X., and Gu, L. (2023). Spatiotemporal evolution of land cover changes and landscape ecological risk assessment in the Yellow River Basin, 2015–2020. J. Environ. Manag. 332:117149. doi:10.1016/j.jenvman.2022.117149
Fagiewicz, K. (2014). Spatial processes of landscape transformation in mining areas (case study of opencast lignite mines in morzysław, niesłusz, gosławice). Pol. J. Environ. Stud. 23 (4).
Gao, L., Tao, F., Liu, R., Wang, Z., Leng, H., and Zhou, T. (2022). Multi-scenario simulation and ecological risk analysis of land use based on the PLUS model: a case study of Nanjing. Sustain. Cities Soc. 85:104055. doi:10.1016/j.scs.2022.104055
Geng, Y., and Han, Z. (2020). Coordination assessment of environment and urbanization: hunan case. Environ. Monit. Assess. 192 (10), 637. doi:10.1007/s10661-020-08598-3
Huang, T., Wang, N., Luo, X., and Xu, J. (2024). Landscape ecological risks assessment of the China-Vietnam border area: the perspective of production-living-ecological spaces. Reg. Environ. Change 24 (3), 103. doi:10.1007/s10113-024-02266-9
Hui, Y., Die, B., Wang, J., Shucheng, T., Liu, S., and Wu, X. (2024). Landscape ecological risk assessment study of the Yunnan section of the Tropic of Cancer. Ecol. Indic. 158:111517. doi:10.1016/j.ecolind.2023.111517
Ju, H., Niu, C., Zhang, S., Jiang, W., Zhang, Z., Zhang, X., et al. (2021). Spatiotemporal patterns and modifiable areal unit problems of the landscape ecological risk in coastal areas: a case study of the Shandong Peninsula, China. J. Clean. Prod. 310:127522. doi:10.1016/j.jclepro.2021.127522
Kang, J., Yang, J., Qing, Y., and Lu, W. (2024). Landscape ecological risk assessment of saihanba under the change in forest landscape pattern. Forests 15 (4), 700. doi:10.3390/f15040700
Kong, Y., He, W., Yuan, L., Shen, J., An, M., Degefu, D. M., et al. (2019). Decoupling analysis of water footprint and economic growth: a case study of beijing–tianjin–hebei region from 2004 to 2017. Int. J. Environ. Res. Public Health 16 (23), 4873. doi:10.3390/ijerph16234873
Kong, Y., He, W., Yuan, L., Zhang, Z., Gao, X., Zhao, Y., et al. (2021). Decoupling economic growth from water consumption in the Yangtze River economic belt, China. Ecol. Indic. 123, 107344. doi:10.1016/j.ecolind.2021.107344
Lefever, D. W. (1926). Measuring geographic concentration by means of the standard deviational ellipse. Am. J. Sociol. 32 (1), 88–94. doi:10.1086/214027
Li, C., and Wu, J. (2022). Land use transformation and eco-environmental effects based on production-living-ecological spatial synergy: evidence from Shaanxi Province, China. Environ. Sci. Pollut. Res. 29 (27), 41492–41504. doi:10.1007/s11356-022-18777-z
Li, M., Abuduwaili, J., Wen, L., Feng, S., Saparov, G., and Ma, L. (2024). Application of geographical detector and geographically weighted regression for assessing landscape ecological risk in the Irtysh River Basin, Central Asia. Ecol. Indic. 158:111540. doi:10.1016/j.ecolind.2023.111540
Li, Q., Zhou, Y., and Yi, S. (2022). An integrated approach to constructing ecological security patterns and identifying ecological restoration and protection areas: a case study of Jingmen, China. Ecol. Indic. 137:108723. doi:10.1016/j.ecolind.2022.108723
Li, W., Wang, Y., Xie, S., Sun, R., and Cheng, X. (2020). Impacts of landscape multifunctionality change on landscape ecological risk in a megacity, China: a case study of Beijing. Ecol. Indic. 117, 106681. doi:10.1016/j.ecolind.2020.106681
Liang, T., Yang, F., Huang, D., Luo, Y., Wu, Y., and Wen, C. (2022). Land-use transformation and landscape ecological risk assessment in the three gorges reservoir region based on the “production–living–ecological space” perspective. Land 11 (8), 1234. doi:10.3390/land11081234
Li S., S., Tu, B., Zhang, Z., Wang, L., Zhang, Z., Che, X., et al. (2024). Exploring new methods for assessing landscape ecological risk in key basin. J. Clean. Prod. 461, 142633. doi:10.1016/j.jclepro.2024.142633
Liu, C., Yang, Q., Zhou, F., Ai, R., and Cheng, L. (2024). Assessing production–living–ecological spaces and its urban–rural gradients in Xiangyang City, China: insights from land-use function symbiosis. Environ. Sci. Pollut. Res. 31 (9), 13688–13705. doi:10.1007/s11356-024-31957-3
Liu, L., Yang, Y., Liu, S., Gong, X., Zhao, Y., Jin, R., et al. (2023). A comparative study of green growth efficiency in Yangtze River economic belt and yellow River Basin between 2010 and 2020. Ecol. Indic. 150:110214. doi:10.1016/j.ecolind.2023.110214
Liu, Y., Lin, Y., Liu, W., Zhou, J., and Wang, J. (2024). Remote sensing perspective in exploring the spatiotemporal variation characteristics and post-disaster recovery of ecological environment quality, a case study of the 2010 Ms7.1 Yushu earthquake. Geomatics, Nat. Hazards Risk 15 (1), 2314578. doi:10.1080/19475705.2024.2314578
Liu, Y., Lin, Y., Wang, F., Xu, N., and Zhou, J. (2023a). Post-earthquake recovery and its driving forces of ecological environment quality using remote sensing and GIScience, a case study of 2015 Ms8.1 Nepal earthquake. Geomatics, Nat. Hazards Risk 14 (1), 2279496. doi:10.1080/19475705.2023.2279496
Liu, Y., Liu, W., Zhang, X., Lin, Y., Zheng, G., Zhao, Z., et al. (2023b). Nighttime light perspective in urban resilience assessment and spatiotemporal impact of COVID-19 from January to June 2022 in mainland China. Urban Clim. 50, 101591. doi:10.1016/j.uclim.2023.101591
Peng, J., Wang, A., Liu, Y. X., Ma, J., and Wu, J. S. (2015). Research progress and prospect on measuring urban ecological land demand. Acta Geogr. Sin. 70 (02), 333–346. doi:10.11821/dlxb201502013
Qian, Y., Dong, Z., Yan, Y., and Tang, L. (2022). Ecological risk assessment models for simulating impacts of land use and landscape pattern on ecosystem services. Sci. Total Environ. 833, 155218. doi:10.1016/j.scitotenv.2022.155218
Ran, P., Hu, S., Frazier, A. E., Qu, S., Yu, D., and Tong, L. (2022). Exploring changes in landscape ecological risk in the Yangtze River Economic Belt from a spatiotemporal perspective. Ecol. Indic. 137, 108744. doi:10.1016/j.ecolind.2022.108744
Tan, S., Hu, B., Kuang, B., and Zhou, M. (2021). Regional differences and dynamic evolution of urban land green use efficiency within the Yangtze River Delta, China. Land Use Policy 106, 105449. doi:10.1016/j.landusepol.2021.105449
Tapio, P. (2005). Towards a theory of decoupling: degrees of decoupling in the EU and the case of road traffic in Finland between 1970 and 2001. Transp. policy 12 (2), 137–151. doi:10.1016/j.tranpol.2005.01.001
Vadén, T., Lähde, V., Majava, A., Järvensivu, P., Toivanen, T., Hakala, E., et al. (2020). Decoupling for ecological sustainability: a categorisation and review of research literature. Environ. Sci. & Policy 112, 236–244. doi:10.1016/j.envsci.2020.06.016
Wang, A., Liao, X., Tong, Z., Du, W., Zhang, J., Liu, X., et al. (2022). Spatial-temporal dynamic evaluation of the ecosystem service value from the perspective of “production-living-ecological” spaces: a case study in Dongliao River Basin, China. J. Clean. Prod. 333, 130218. doi:10.1016/j.jclepro.2021.130218
Wang, H., Liu, X., Zhao, C., Chang, Y., Liu, Y., and Zang, F. (2021a). Spatial-temporal pattern analysis of landscape ecological risk assessment based on land use/land cover change in Baishuijiang National nature reserve in Gansu Province, China. Ecol. Indic. 124, 107454. doi:10.1016/j.ecolind.2021.107454
Wang, J., Qi, S., and Zou, L. (2023). Spatial-temporal evolution and driving mechanism of rural production-living-ecological space in Pingtan islands, China. Habitat Int. 137, 102833. doi:10.1016/j.habitatint.2023.102833
Wang, W., Wang, H., and Zhou, X. (2023). Ecological risk assessment of watershed economic zones on the landscape scale: a case study of the Yangtze River Economic Belt in China. Reg. Environ. Change 23 (3), 105. doi:10.1007/s10113-023-02108-0
Wang, X., Sun, Y., Liu, Q., and Zhang, L. (2023). Construction and optimization of ecological network based on landscape ecological risk assessment: a case study in jinan. Land 12 (4), 743. doi:10.3390/land12040743
Wang, Y., Fang, X., Yin, S., and Chen, W. (2021b). Low-carbon development quality of cities in China: evaluation and obstacle analysis. Sustain. Cities Soc. 64:102553. doi:10.1016/j.scs.2020.102553
Wu, J., Zhang, D., Wang, H., and Li, X. (2021). What is the future for production-living-ecological spaces in the Greater Bay Area? A multi-scenario perspective based on DEE. Ecol. Indic. 131:108171. doi:10.1016/j.ecolind.2021.108171
Xin, M., Guo, H., Li, S., and Chen, L. (2023). Can China achieve ecological sustainability? An LMDI analysis of ecological footprint and economic development decoupling. Ecol. Indic. 151:110313. doi:10.1016/j.ecolind.2023.110313
Xu, C., and Yang, L. (2024). Evaluation of land resources carrying capacity based on entropy weight and cloud similarity. Sci. Rep. 14 (1), 9050. doi:10.1038/s41598-024-59692-2
Xu, W., Wang, J., Zhang, M., and Li, S. (2021). Construction of landscape ecological network based on landscape ecological risk assessment in a large-scale opencast coal mine area. J. Clean. Prod. 286:125523. doi:10.1016/j.jclepro.2020.125523
Yang, H., Zhong, X., Deng, S., and Nie, S. (2022). Impact of LUCC on landscape pattern in the Yangtze River Basin during 2001–2019. Ecol. Inf. 69:101631. doi:10.1016/j.ecoinf.2022.101631
Yang, Y., and Li, H. (2023). Spatiotemporal dynamic decoupling states of eco-environmental quality and land-use carbon emissions: a case study of Qingdao City, China. Ecol. Inf. 75:101992. doi:10.1016/j.ecoinf.2023.101992
Yi, P., Li, W., and Zhang, D. (2021). Sustainability assessment and key factors identification of first-tier cities in China. J. Clean. Prod. 281:125369. doi:10.1016/j.jclepro.2020.125369
Yi, P., Zuo, X., Li, W., and Wang, L. (2024). Urban sustainability assessment based on sentiment analysis and entropy weight method: case study in Liaoning, China. Environ. Dev. Sustain. 26 (3), 7973–7997. doi:10.1007/s10668-023-03045-y
Yu, B. (2021). Ecological effects of new-type urbanization in China. Renew. Sustain. Energy Rev. 135:110239. doi:10.1016/j.rser.2020.110239
Zeng, C., He, J., He, Q., Mao, Y., and Yu, B. (2022). Assessment of land use pattern and landscape ecological risk in the chengdu-chongqing economic circle, Southwestern China. Land 11 (5), 659. doi:10.3390/land11050659
Zhang, R., Li, S., Wei, B., and Zhou, X. (2022). Characterizing production–living–ecological space evolution and its driving factors: a case study of the chaohu lake basin in China from 2000 to 2020. ISPRS Int. J. Geo-Information 11 (8), 447. doi:10.3390/ijgi11080447
Zhang, S., Zhao, K., Ji, S., Guo, Y., Wu, F., Liu, J., et al. (2022). Evolution characteristics, eco-environmental response and influencing factors of production-living-ecological space in the qinghai–tibet plateau. Land 11 (7), 1020. doi:10.3390/land11071020
Zhang, Y., Jiang, P., Cui, L., Yang, Y., Ma, Z., Wang, Y., et al. (2022). Study on the spatial variation of China’s territorial ecological space based on the standard deviation ellipse. Front. Environ. Sci. 10, 982734. doi:10.3389/fenvs.2022.982734
Zhang, Y., Zheng, M., and Qin, B. (2023). Optimization of spatial layout based on ESV-FLUS model from the perspective of “Production-Living-Ecological”: a case study of Wuhan City. Ecol. Model. 481, 110356. doi:10.1016/j.ecolmodel.2023.110356
Zhang, Z., Gong, J., Plaza, A., Yang, J., Li, J., Tao, X., et al. (2024). Long-term assessment of ecological risk dynamics in Wuhan, China: multi-perspective spatiotemporal variation analysis. Environ. Impact Assess. Rev. 105, 107372. doi:10.1016/j.eiar.2023.107372
Zhang, Z., and Li, J. (2022). Spatial suitability and multi-scenarios for land use: simulation and policy insights from the production-living-ecological perspective. Land Use Policy 119, 106219. doi:10.1016/j.landusepol.2022.106219
Zhao, Y., Wang, S., Ge, Y., Liu, Q., and Liu, X. (2017). The spatial differentiation of the coupling relationship between urbanization and the eco-environment in countries globally: a comprehensive assessment. Ecol. Model. 360:313–327. doi:10.1016/j.ecolmodel.2017.07.009
Keywords: landscape ecological risk, urbanization, Tapio decoupling model, spatial autocorrelation analysis, standard deviation ellipse
Citation: Guo Y, Wang W, Zhang X, Liu C, Wang Y, Chen W, Wan X, Zhang X, Lin Y, Zhang X and Liu Y (2025) Revealing the impact of urbanization on landscape ecological risk: a case study of the lower reaches of the Yangtze River, China. Front. Environ. Sci. 13:1589832. doi: 10.3389/fenvs.2025.1589832
Received: 08 March 2025; Accepted: 14 April 2025;
Published: 30 April 2025.
Edited by:
Shikuan Zhao, Chongqing University, ChinaReviewed by:
Hasan Bilgehan Makineci, Konya Technical University, TürkiyeJie Zhao, Linyi University, China
Junyi Chen, Kunming University of Science and Technology, China
Shaohua Zhang, Yunnan Normal University, China
Copyright © 2025 Guo, Wang, Zhang, Liu, Wang, Chen, Wan, Zhang, Lin, Zhang and Liu. This is an open-access article distributed under the terms of the Creative Commons Attribution License (CC BY). The use, distribution or reproduction in other forums is permitted, provided the original author(s) and the copyright owner(s) are credited and that the original publication in this journal is cited, in accordance with accepted academic practice. No use, distribution or reproduction is permitted which does not comply with these terms.
*Correspondence: Yu Lin, MjAyMjE2NTEwN0BzdHUuc2RqenUuZWR1LmNu; Xuya Zhang, emhhbmd4eUBjYWVwLm9yZy5jbg==