 Siddhesh Mane1
 Gurjeet Singh2
 Narendra N. Das1,2*
 Anant Kanungo3Nishit Nagpal1
 Michael Cosh4
 Younsuk Dong1
- 1Biosystems and Agricultural Engineering, Michigan State University, East Lansing, MI, United States
- 2Civil and Environmental Engineering, Michigan State University, East Lansing, MI, United States
- 3Intern, Jet Propulsion Laboratory, California Institute of Technology, Pasadena, CA, United States
- 4USDA ARS, Hydrology and Remote Sensing Laboratory, Beltsville, MD, United States
In recent years, the emergence of sensor technologies has highlighted the key role of in situ soil moisture measurement in various hydrological, agricultural, and ecological applications. However, the widespread adoption of technology is hindered by the costs and accessibility of existing sensor devices. This study aims to bridge a significant research gap by designing an economical and user-friendly handheld device, a Low-Cost Soil Moisture (LCSM) sensor ensuring reliable in situ measurements. This study has two main objectives: developing the LCSM sensor and establishing robust calibrations to ensure accuracy. Calibration experiments were conducted to develop generalized and soil-specific calibrations for the LCSM sensor across various field sites, encompassing diverse soil types (mineral-rich and forest organic soil) and land cover conditions. A total of 408 soil samples were collected from 83 locations (70 mineral soil sites- 301 samples; 13 organic soil sites- 107 samples) for the LCSM sensor calibration. All samples were collected from the same general fields during sampling period with similar experimental conditions. At each location, three LCSM readings were taken in a triangular configuration, and a gravimetric sample was extracted from the center using a coring method. The arithmetic average of the three sensor readings was used as the representative value for calibration against the corresponding gravimetric measurement, ensuring consistency and reliability. For generalized calibration in mineral soils, we observed an overall Root Mean Square Error (RMSE) of 0.035 m3m−3 and a bias of <0.001 m3m−3 along with a strong correlation (R = 0.90). Conversely, soil-specific calibration for mineral soils yielded a lower RMSE of 0.031 m3m−3 for loam soil and 0.034 m3m−3 for sandy loam soil. In the context of forest organic soil, the LCSM sensor exhibited a higher RMSE of 0.078 m3m−3 with a moderate correlation (R = 0.80). Furthermore, the comparison of calibrated LCSM sensor soil moisture readings with commercially available handheld soil moisture sensors (HydraProbe and ThetaProbe) demonstrated a strong agreement, with a high correlation (R > 0.90) and minimal difference in soil moisture measurements. These statistical findings highlight that the LCSM sensor measures soil moisture as accurately as commercially available sensors, strengthening its credibility and reliability for diverse conditions.
1 Introduction
Accurate soil moisture measurements are crucial for hydrological, agricultural, and ecological uses. In agriculture, it guides irrigation and crop water estimates (Datta and Taghvaeian, 2023; Dong, 2023; Singh and Das 2022), while studies also link soil moisture to crop growth and yield (Deryng et al., 2011; Mane and Kadam, 2021). From a hydrological perspective, soil moisture aids in understanding rainfall-runoff dynamics (Rowlandson et al., 2013), while ecological context, it plays a vital role in shaping the diversity and structure of dryland ecosystems. Despite constituting a small proportion of soil moisture with the hydrological cycle (0.05%), it significantly influences precipitation distribution, energy balance, and microbial activity, impacting processes like nitrification and CO2 production. Given its extensive implications, continuous monitoring of soil moisture is essential. This importance becomes even more pronounced in the context of climate change and extreme weather events, which emphasize the need for ongoing observation to understand soil moisture’s effects on hydrology, agriculture, and ecology (Seo et al., 2025; Yao et al., 2025). Hence, the measurement of soil moisture is becoming increasingly necessary.
Nevertheless, for accurate soil moisture measurement, the gravimetric soil moisture method remains the most reliable approach in various hydrological, agricultural, and ecological applications (Gardner, 2018). However, it is important to note that the gravimetric soil moisture measurement includes tedious steps and requires substantial physical effort, being both labour and time-intensive (Singh et al., 2021; Dong et al., 2020; Mwale et al., 2005). In fact, the gravimetric method is not able to provide real-time soil moisture measurements. Thus, in situ soil moisture measurements become practically infeasible for large field and regional/watershed-scale studies (Singh et al., 2019), prove destructive when employed in a controlled environment, and impossible for continuous soil moisture monitoring in agriculture (Mwale et al., 2005; Singh et al., 2021).
Introducing soil moisture sensors has revolutionized the method of indirectly measuring volumetric water content (VWC), effectively overcoming the limitations associated with directly measuring soil moisture (Abdulraheem et al., 2024; Mane et al., 2024). Soil moisture sensors use various principles to estimate soil moisture, such as neutron, electromagnetic, electromagnetic induction (Badewa et al., 2018; Basterrechea et al., 2021), tensiometric, hygrometric, and remote sensing processes (Nagahage et al., 2019). Among them, electromagnetic-based dielectric soil moisture sensors are highly favoured due to their ease of use and safety. The popular dielectric soil moisture sensors like HydraProbe, ThetaProbe, and TDR 100 are commonly employed for measuring VWC. In the past several research studies (Kim et al., 2020; Rowlandson et al., 2013; Singh et al., 2021; Tehrani et al., 2023; Vaz et al., 2013) have demonstrated the reliability of these sensors, reported a Root Mean Square Error (RMSE) of less than ± 0.04 m3m−3, indicating a good level of accuracy in soil VWC measurements. Nevertheless, achieving even higher accuracy is recommended through site-specific or soil-specific calibrations (Datta and Taghvaeian, 2023; Mane et al., 2024).
As a result, in recent years, there has been a rising demand for soil moisture sensors, primarily driven by the need to monitor the spatial and temporal distribution of soil moisture at a small scale as well as in larger areas or regions, including watersheds and agricultural fields (Ochsner et al., 2013; Tehrani et al., 2023). This surge in demand has led to the emergence of innovative approaches, some of which involve citizen participation in data collection and reporting to effectively monitor soil moisture over wide areas (Paul and Buytaert, 2018). Citizen science programs such as NASA’s Global Learning and Observations to Benefit the Environment (GLOBE) and the Community Collaborative Rain, Hail and Snow Network (CoCoRaHS) are increasingly incorporating low-cost sensor observations into their environmental monitoring efforts. GLOBE, one of the longest-running international citizen science platform, engages students, educators, and community volunteers to participate in gathering in situ measurements of environmental parameters (i.e., soil moisture) at quality levels acceptable for scientific research (Butler and MacGregor, 2003). CoCoRaHS similarly mobilizes volunteers to monitor precipitation across the United States, while in Australia, the Terrestrial Ecosystem Research Network (TERN) links local communities with national-level ecosystem research. By participating in these initiatives, citizen scientists not only enhance our understanding of hydrological processes and agricultural sustainability but also gain a deeper sense of belonging, responsibility, and collective action toward climate resilience. Such engagement fosters environmental awareness, strengthens communities to address hydrological and agricultural challenges.
However, when addressing agriculture and hydrology, monitoring soil moisture remains less advanced compared to other disciplines (Buytaert et al., 2014). This is due to the difficulties in comprehending soil moisture data easily, the necessity for frequent measurements, and the costs and complexity associated with utilizing advanced and expensive tools (Kukal et al., 2020; Maraveas et al., 2022). Nonetheless, recent technological advancements have significantly improved the in situ measurement of soil moisture over the past decade. Despite these advancements, the availability of affordable devices that can be easily adopted by citizen scientists and farmers remains a challenge. In the agriculture industry, cost constraints are a significant concern. In the era of precision agriculture, current efforts are focused on integrating low-cost sensors with smartphones, which are extensively connected to the internet and feature user-friendly applications (Mane et al., 2019; Ullo and Sinha, 2020). These low-cost soil moisture sensors will play a crucial role in precision agriculture by allowing farmers to monitor their fields efficiently without incurring substantial expense. Additionally, low-cost sensors will play a pivotal role in facilitating the participation of citizen scientists and farmers in soil moisture monitoring.
The integration of citizen research with the Low-Cost Soil Moisture Measurement (LCSM) sensor shows promising potential for advancing soil moisture measurement (Paul and Buytaert, 2018; Robinson et al., 2008). However, assuring the accuracy and performance of these LCSM sensors is crucial. A robust calibration of the LCSM sensor is a critical step in achieving accurate soil moisture measurements. This is especially important due to the significant variability of soil properties within the same area, including type and texture (Parvin and Degré, 2016; Rowlandson et al., 2013; Spelman et al., 2013). This variability in soil properties necessitates the development of soil-specific calibration of LCSM sensor to account for the unique characteristics of the soil being measured. Nevertheless, conducting soil-specific calibration for larger areas can be challenging and time-consuming (Singh et al., 2021). Consequently, in many cases, a general calibration is employed, aiming to provide acceptable accuracy levels for various soil types worldwide. While general calibration may not capture the specific characteristics of each soil type, it offers a practical solution for achieving reasonable accuracy across a wide range of soil conditions (Singh et al., 2021).
The merging of citizen science with the advancements in sensor technologies provides a prospect to examine how they might be integrated into the monitoring of soil moisture. While previous studies have predominantly concentrated on the automation of irrigation and sensor-based approaches in agricultural water management (Datta and Taghvaeian, 2023; Hamami and Nassereddine, 2020), there is a notable lack of field evaluation and field calibration of low-cost sensors, particularly handheld soil moisture measurement sensors, in especially organic soil (Nagare et al., 2011; Vaz et al., 2013). Several research studies on the performance evaluation and calibration of low-cost sensors in mineral soil have been conducted in laboratory settings using low-cost capacitive soil moisture sensors (Adla et al., 2020; Bogena et al., 2017; Schwamback et al., 2023). Very few studies have used Frequency Domain Reflectometry (FDR) or Transmission Line Oscillometer (TLO)-based (Briciu-Burghina et al., 2022; Li et al., 2022) or any other type of low-cost sensors (Adla et al., 2024) and those that have still lack testing across multiple locations and the full spectrum of soil moisture variability (Pramanik et al., 2022; Songara and Patel, 2022). These studies recommend standardizing low-cost sensors at the field scale to achieve robust estimates of soil moisture.
Despite the potential advantages of low-cost sensors, there has been a notable lack of research comparing these low-cost sensors with commercially available sensors in diverse field conditions. Furthermore, there is a lack of field calibration and performance evaluation, particularly for forest organic and mineral soils. Calibrating sensors in organic soils is especially challenging due to their high porosity, high organic matter content, which significantly influences dielectric permittivity, and their large specific surface area. Much of the existing research and calibration efforts for low-cost sensors have focused primarily on mineral soils, often overlooking or inadequately addressing organic soils. Although some studies, such as those by Bircher et al. (2016) and Kassaye et al. (2019), have conducted calibrations for sensors like the Decagon 5TM and the ThetaProbe in organic soils, further research is still necessary to fully understand low-cost sensor performance and improve calibration methods. This research gap creates uncertainty regarding the reliability of these sensors under diverse field conditions. Consequently, both farmers and researchers often express scepticism about using low-cost soil moisture sensors. Hence, it is imperative to understand how accurate the low-cost sensors are in real-world field conditions, indicating a significant gap in the current knowledge and application of these technologies. Addressing these significant gaps in current knowledge and application, this study aims to following objectives:
• Development of an affordable, durable, and user-friendly handheld LCSM sensor, complemented by a simple mobile application to enable widespread use by farmers and citizen scientists globally.
• Establishing generalized and soil-specific calibrations for the LCSM sensor to ensure reliable accuracy in the VWC measurements across diverse soil types.
• Comprehensive performance evaluation of the LCSM sensor accuracy and reliability with commercially available and widely used handheld soil moisture sensors.
The overarching goal of this study is to develop and provide an affordable, reliable low-cost sensor that enables accurate in situ VWC measurements across diverse soil types. By advancing our understanding of soil moisture dynamics, this low-cost sensor aims to support the implementation of sustainable land management practices.
2 Study area
To achieve a robust calibration for the LCSM sensor, a series of field experiments were carried out across a range of sites, encompassing a variety of soil types and land cover conditions. These sites included the agricultural research farms of Michigan State University (MSU), USA, characterized by mineral-rich soils, as well as the SMAP Validation Experiment in 2022 (SMAPVEX 22) field campaign, which primarily focused on forest organic soil of Millbrook and Massachusetts areas of USA. The selection of field sites was guided by web-based soil survey maps of USDA (Web Soil Survey, 2022), focusing on fields with relatively uniform soil texture and organic matter content. Additionally, we have selected different fields with varying soil types to have a spatial variability in soil properties for developing robust generalized calibration. The geographical locations of these experimental sites are illustrated in Figure 1, while a summary is presented in Table 1 along with corresponding soil types and texture information. Detailed descriptions of the experimental sites are provided in the subsequent subsections.
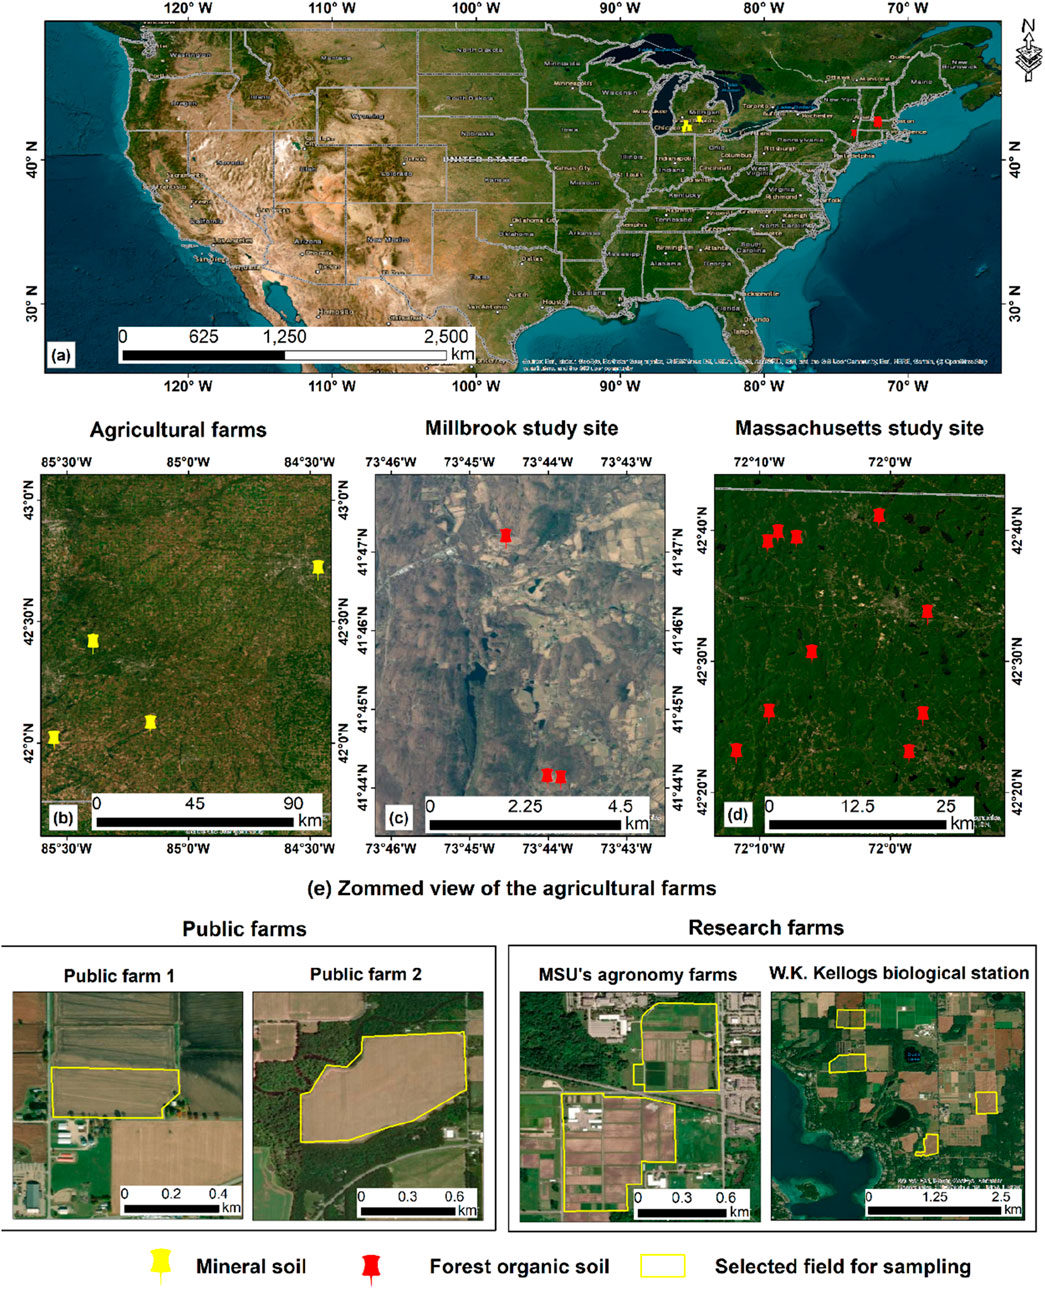
Figure 1. Geographical locations of the experimental sites. (a) Overview of the sites across the USA where LCSM sensor calibration experiments were executed. This includes (b) the agricultural farms characterized by mineral-rich soils of Michigan State University (MSU), as well as SMAPVEX 22 forest sites with organic soil (c) Millbrooks and (d) Massachusetts study site (e) A zoomed view of public and research agricultural farms of MSU highlighting the selected fields for sampling.
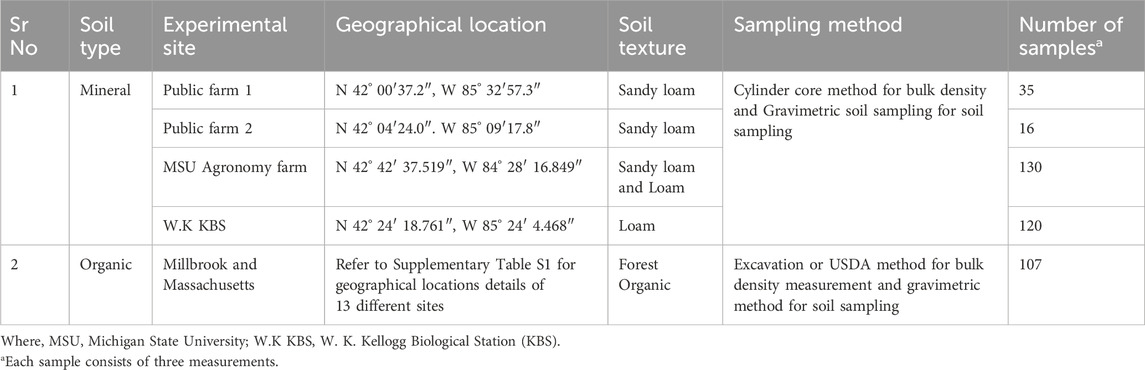
Table 1. Summary of experimental sites, including geographical locations, soil types, sampling method, and number of samples collected during field experiment.
2.1 Agricultural field sites
Extensive soil moisture sampling was conducted across various agricultural farms associated with MSU in the USA as shown in Figure 1. The study encompassed two public farms with crops of soybean and corn along with two research farms 1) the MSU agronomy farm, and 2) the W. K. Kellogg Biological Station (KBS) agricultural research farm as illustrated in Figure 1b. The public agricultural farms are situated in distinct locations of N 42° 00′37.2″, W 85° 32′57.3″, and N 42° 04′24.0″. W 85° 09′17.8″. The MSU Agronomy Farm is located to the south of the main university campus, East Lansing (N 42° 42′ 37.519″, W 84° 28′ 16.849″), while the KBS research farm is located between Kalamazoo and Battle Creek, Michigan (N 42° 24′ 18.761″, W 85° 24′ 4.468″) and about 65 miles west of MSU campus. These agricultural farms were selected to conduct extensive soil moisture sampling within specific fields to facilitate the calibration of the LCSM sensor device. A view of selected fields for sampling in each agricultural farm is shown in Figure 1e. A total of two and four large agricultural fields were chosen for intensive sampling in the public farms and MSU’s KBS research farms, respectively (see Figure 1e). Conversely, a total of sixteen smaller agricultural fields were selected for sampling at the MSU agronomy farm (see Figure 1e).
The selected agricultural fields consist of varying soil textures, with sandy loam dominant in public farms, loam in the MSU KBS farm, and a combination of loam and sandy loam in the MSU agronomy farm. The predominant crops in these agricultural fields are primarily corn and soybean. The field study takes place from June to October (2022–2023), with a mean temperature ranging from 11°C to 22°C and relative humidity between 63% and 80%. To capture the diverse range of soil wetness conditions, ranging from dry to wet and back to dry, sampling was conducted at different periods throughout the years 2022 and 2023, considering both cropping and fallow land conditions.
2.2 Forest field sites
NASA’s SMAPVEX 2019-2022 was conducted at two distinct forest sites located in New York and Massachusetts, USA. The core objective of this experiment was to collect both remote sensing and in situ soil moisture data to facilitate the retrieval and validation of soil moisture using microwave measurements within temperate and boreal forests. Exploiting the opportunities presented by the SMAPVEX 22 field campaigns held in April-May and July- August of 2022, measurements were collected concurrently using the developed LCSM sensor, commercially available HydraProbe sensor, and gravimetric sampling. For this purpose, a total of three sites within the Millbrook (MB) study site and ten sites within the Massachusetts (MA) study site were chosen for sampling, as depicted in Figures 1c,d. These sites were selected specifically within forested areas characterized by organic soil composition. The mean relative humidity of the study area ranged from 80% to 90% and the mean monthly temperature ranged from 20°C to 22°C. The measurements collected during the SMAPVEX 22 campaign played a pivotal role in calibrating the LCSM sensor for organic soil, as well as in evaluating its performance against commercially available soil moisture sensors.
3 Material and methods
3.1 Development of LCSM sensor
3.1.1 Working principle
A large number of commercial soil moisture sensors are available, offering accurate measurements of soil moisture levels. Out of these, resistance-based soil moisture sensors stand out as cost-effective, responsive to changes in water content, and easy to incorporate into do-it-yourself projects. However, resistance-based sensors lack reliability in producing soil VWC measurements for scientific purposes (Sunil Kumar et al., 2021). The most popular and scientifically tested method for measuring soil moisture, found in numerous studies, is dielectric permittivity-based soil moisture sensing. This includes techniques such as Time Domain Reflectometry (TDR), capacitance sensor, TLO, and FDR. The advantages and disadvantages of each of these sensor technologies are reviewed by Mane et al. (2024) and Kukal et al. (2020). They also reported the cost of sensors and sensor dataloggers, along with their accuracy in soil VWC measurements. While all the soil moisture sensors have their own advantages and disadvantages, they all operate within an acceptable accuracy of ± 0.040 m3m−3 with proper calibration. For this study, the objective is to develop an LCSM sensor to measure soil moisture with acceptable accuracy. For developing the LCSM sensor, a low-cost soil moisture probe we found, based on the dielectric permittivity principle, utilizes the TLO technique.
The TLO technique-based soil moisture probe has the potential to measure soil moisture content accurately and reliably (Caldwell et al., 2018). The TLO sensor consists of a specialized probe designed for insertion into the soil, as shown in Figure 2. Within this sensor, an electromagnetic (EM) wave with a frequency typically below 60 MHz is generated and transmitted into the surrounding soil. As the EM wave propagates through the soil, it encounters variations in the real component of soil dielectric permittivity or dielectric constant, denoted as ε. Dielectric permittivity is an electrical property of the soil that is highly influenced by the soil moisture content. Notably, ε for water is significantly higher ∼80 than for air (ε is ∼1) or for soil minerals or dry soil (ε ranging from 2 to 5). In a soil-water mixture, where the main components that change are water and air, any change in soil moisture directly impacts the ε of the soil-water mixture. After interacting with the surrounding soil, the EM wave influenced by the soil-water mixture reflects toward the sensor unit. This reflected wave carries information about the ε and is typically translated into a voltage signal. Simultaneously, a data logger records the associated voltage changes, which directly correspond to variations in the soil moisture content (Skierucha and Wilczek, 2010). This technology is highly effective in quantifying soil moisture levels due to its sensitivity to changes in soil dielectric permittivity, which, in turn, are indicative of variations in soil moisture content.
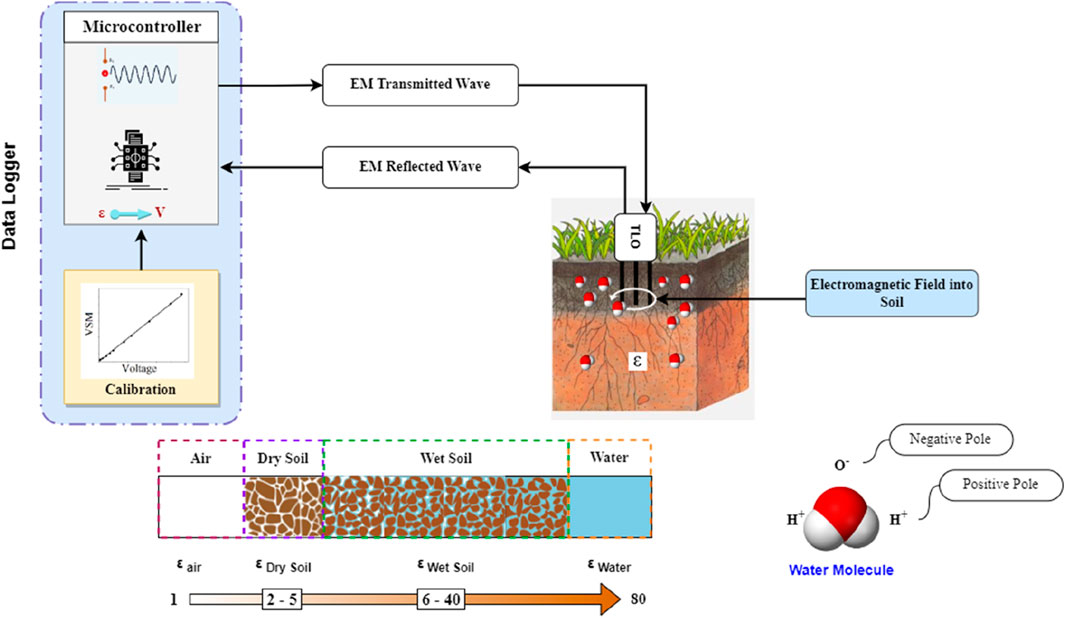
Figure 2. Working principle of Low-Cost Soil Moisture (LCSM) sensor.
3.1.2 LCSM sensor design
The LCSM sensor was carefully designed to prioritize simplicity, affordability, and ease of use for farmers and citizen scientists. The LCSM sensor consists of several key components including the TLO probe (Beijing Guoxinhaiyuan Tec. Co. Ltd. CH), data acquisition unit, user interface, and power supply as illustrated in Figure 3. Each of these components plays a specific role in the process of measuring soil VWC. The device’s compact size, lightweight build, and straightforward user-friendly interface make it highly accessible for a wide range of applications in agricultural and hydrological research. In our pursuit of cost-effectiveness without sacrificing measurement accuracy, we placed significant importance on selecting affordable and reliable components for the entire sensor design. Notably, we chose to utilize a TLO probe sourced from Beijing Guoxinhaiyuan Tec. Co. Ltd. The TLO probe operates optimally within a temperature range of −40°C to +80°C and is suitable for soils with a salinity level of less than 10 dS/m and pH below four and has operating frequency of 50 MHz. Because of this lower frequency, the probe may exhibit heightened sensitivity to salinity and temperature variations compared to higher-frequency devices, potentially affecting measurement accuracy under certain field conditions. However, this study tested the TLO probe within the manufacturer’s recommended parameters. Thus, more extensive research across a wider range of conditions is necessary to fully assess its performance. The probe has an overall length of 126 mm, including three metallic rods each 60 mm long. It requires a power supply of 5–24 V DC, with a power consumption of approximately 0.4 W during sample collection. The response time of the probe is less than 1 s. This TLO probe is remarkably cost-effective, priced at only 12 USD per unit. The TLO technology-based probe leverages the transmission line oscillator principle, employing three metallic rods for robust calibration in measuring soil VWC. Further details regarding the other key components of the LCSM sensor are outlined in the following subsections.
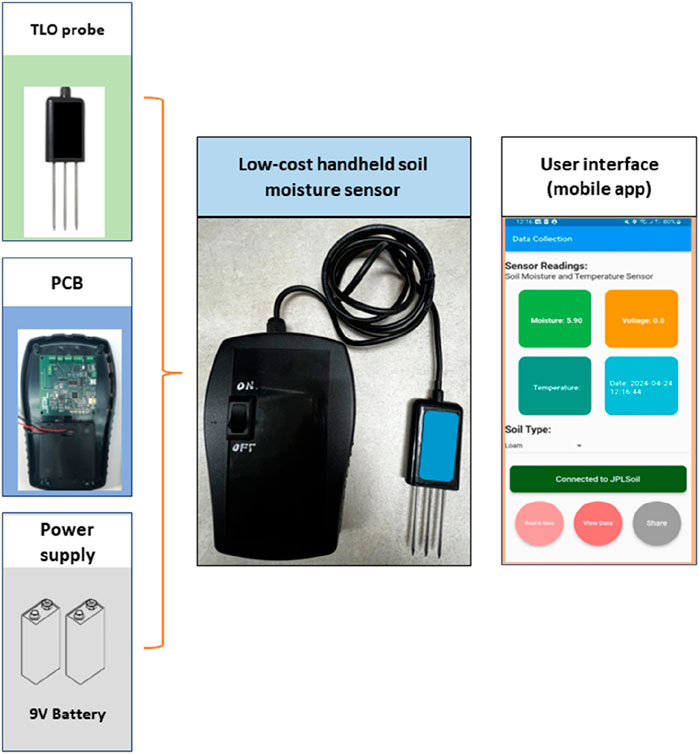
Figure 3. The design of the handheld Low-Cost Soil Moisture (LCSM) sensor consists of several key components including the TLO probe, data acquisition unit, user interface, and power supply.
3.1.2.1 Data acquisition unit and sensor hardware
The TLO sensor is controlled by a data acquisition unit developed at the NASA Jet Propulsion Laboratory (JPL), California Institute of Technology, USA. This unit consists of both hardware, specifically a Programmable Circuit Board (PCB), and software that operates through a mobile application. The PCB is powered by a 9 V battery and is designed to simplify the sensor’s architecture, eliminating the need for internal wiring within the device container. The microcontroller used in the PCB is the ATmega328p, and it is powered by 9 V batteries. The data from the PCB is converted using FT321Xs, which acts as a USB to serial converter. The NRF8001 facilitates the connection between Arduino and the Android or Apple OS device via Bluetooth. Figure 4 also provides details on the ports used for connecting the TLO sensors. The receiver captures both the magnitude and phase of the reflected EM wave, influenced by the soil-water mixture, which carries information about the soil dielectric permittivity (ε). These measurements subsequently need to undergo a sophisticated calibration process to accurately derive soil moisture content (Seyfried et al., 2005). Recognizing the critical role of calibration procedures in ensuring the reliability and accuracy of soil moisture measurements, this study conducts a detailed analysis to develop a robust calibration process. To provide user-friendly access to these soil VWC measurements, the device is typically paired with a straightforward mobile application (mobile app). The mobile/smartphone app reads observations from the PCB and converts them into soil VWC values using the calibrations provided within the app. The mobile/smartphone app assists users in conveniently viewing real-time soil VWC data displayed on their screens and storing the measured dataset (see Figure 3). This user interface enhances the device usability and accessibility, enabling individuals to make informed decisions related to soil moisture management.
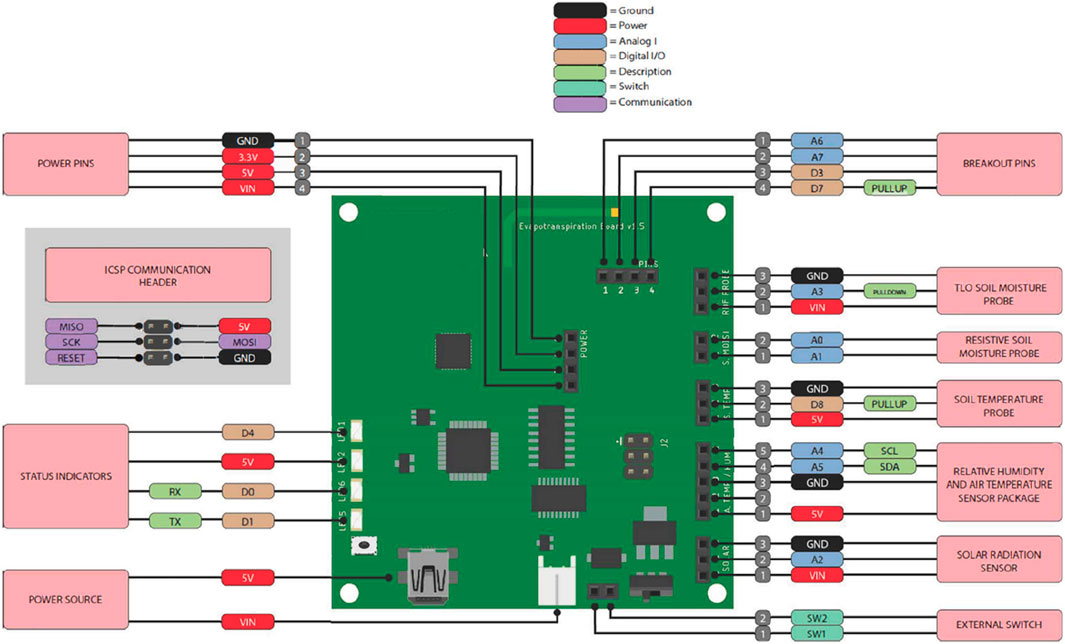
Figure 4. Programmable Circuit Board (PCB) illustrating the electrical circuitry, connectivity for various sensors and data acquisition.
In addition to soil moisture measurement, the device has the potential to connect various sensors, such as a humidity sensor, air and soil temperature sensor, and solar radiation sensor, to measure basic meteorological parameters. These parameters can be valuable in estimating evapotranspiration. Figure 4 also provides details on the various ports used for connecting these sensors. The cost of producing the PCB was ∼50 USD for a limited number of units, and it is expected that the cost may decrease with higher production quantities.
3.1.2.2 User interface
A simple interface has been developed to provide user-friendly access to measurements obtained through the LCSM sensor device as shown in Figure 5. The device is typically paired with a mobile app developed at NASA JPL, USA and it is available on Google Play Store (LcSM mobile app: https://shorturl.at/bgO02). The mobile application utilizes Bluetooth connectivity to establish a seamless connection with the PCB, which serves as the data acquisition unit. This enables users to wirelessly record the voltage changes (associated with dielectric permittivity that is directly influenced by soil moisture) on their smartphones or tablets. This mobile app is available exclusively for both Android and iOS devices. The mobile app enhances the usability and functionality of the device by providing a user-friendly and intuitive interface, along with additional features to facilitate data management and analysis (see Figure 5). These features include the selection of appropriate calibration (i.e., generalized or soil-specific), various data storage options, real-time visualization, and more.
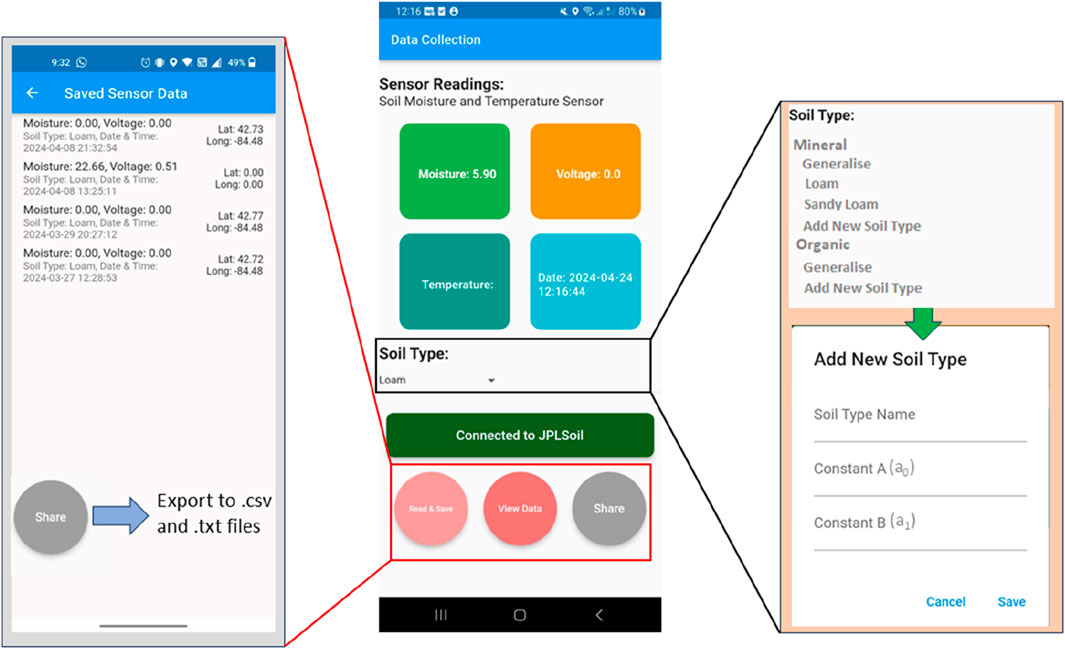
Figure 5. A view of the mobile/smartphone application interface showcasing real-time measurements, selection of suitable soil types, custom calibration options, and storage functionality.
One of the key features of the mobile app is its ability to store data along with corresponding latitude and longitude information and export it to.txt and.csv files. This feature allows users to geotag their soil moisture measurements, providing valuable spatial context for future analysis and decision-making. Additionally, the application offers the capability to save and display both the voltage output and the corresponding soil moisture content. This flexibility allows users to choose their preferred unit of measurement and visualize the data in a way that suits their needs. The mobile application provides a convenient interface for users to select the appropriate soil type as shown in Figure 5. Additionally, we have incorporated functionality for location-specific calibrations and the ability to add custom calibration coefficients in addition to generalized calibration, to enhance soil moisture measurement accuracy.
This feature empowers users to tailor the device’s measurements to their specific requirements and ensures accurate soil moisture assessments across a wide range of soil compositions.
The specifications and costs of each component used for this device are detailed in Table 2. The current cost to build a LCSM sensor stands at $80, which is well below the $100 threshold and the cost of various commercial sensors. The cost details of commercially available soil moisture sensors are outlined in Mane et al. (2024), Maraveas et al. (2022) and Kukal et al. (2020). It is important to note that the LCSM sensor is developed specifically for citizen scientists and farmers for non-commercial purposes. Thus, the given cost does not include manufacturing labor costs, profit margin, or additional expenses such as promotion and servicing. The repair and servicing of the developed LCSM sensor can be carried out by the users with minimal hassle due to its simple design. Both the PCB and TLO probe are easily made available components that can be assembled with just three simple connections, ensuring that users can address any potential issues swiftly. The device also includes a detailed manual that comprehensively covers all repair and maintenance procedures. The simple design and affordable cost make the developed LCSM sensor a viable option for citizen scientists and farmers worldwide.
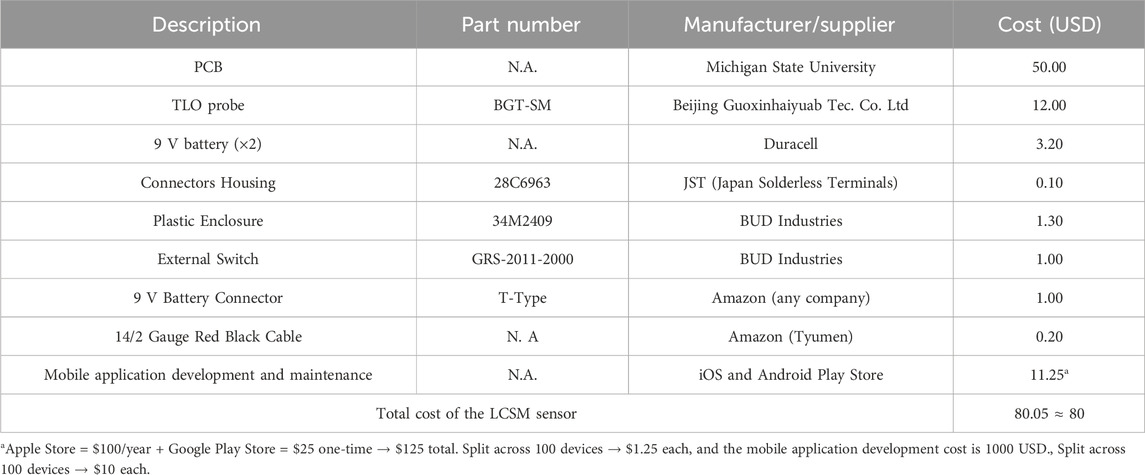
Table 2. List of components and cost for the Low-Cost Soil Moisture (LCSM) sensor.
3.2 Calibration of LCSM sensor for accurate soil VWC measurement
The LCSM sensor requires a robust calibration to accurately convert recorded voltage, based on the soil-water mixture’s dielectric permittivity into soil VWC. Calibration is a critical step in obtaining accurate soil VWC readings. To achieve this, extensive field experiments were conducted across diverse soil types and land cover conditions as discussed in Section 2. These experiments covered two distinct sites, each with specific soil categories such as mineral soil and organic soil. Each soil category possesses unique characteristics and necessitates specific considerations and sampling methods for effective calibration. To establish a robust calibration that ensures reliability and accuracy, sampling activities were carried out across a range of sites, encompassing various soil textural classes and soil wetness conditions. As detailed in Sections 2.1 and 2.2, the experimental sites included agricultural farms with mineral-rich soils and forested areas with organic soil. The sampling strategies employed in these sites are described in the following sub-sections.
3.2.1 Sampling design in agricultural farms
Intensive soil sampling was conducted in twenty-two agricultural fields, comprising two public farms and twenty research farms affiliated with MSU, as detailed in Section 2.1. This sampling effort encompassed 70 distinct locations, capturing a wide range of soil textures and land cover conditions, with the primary objective of establishing a robust calibration dataset. The field experiments were carried out from June 2022 to June 2023 at regular intervals. Throughout the field experiment, utmost care was taken to achieve comprehensive coverage of soil wetness conditions, encompassing the entire spectrum from dry to saturated and back to dry as suggested by Singh et al. (2019).
Within each selected field, multiple sampling locations were strategically chosen to capture spatial variability. Additionally, soil moisture samples were systematically collected from each sampling location. The selection of the sampling locations was based on careful consideration of the field’s area and topography. During the field experiment the number of samples collected per site varied, ranging from a minimum of two to a maximum of ten, depending on the size of the field to cover the spatial variability in soil properties. Following Singh et al. (2021), three measurements of the LCSM sensor (in voltage) were acquired at each selected location, forming a triangular configuration. Simultaneously, a gravimetric sample was collected at the center of the triangle using a coring method, as illustrated in a representative sampling design presented in Figure 6. Collecting three samples from each location allowed us to account for local spatial variability while ensuring a representative sampling of the overall soil conditions.
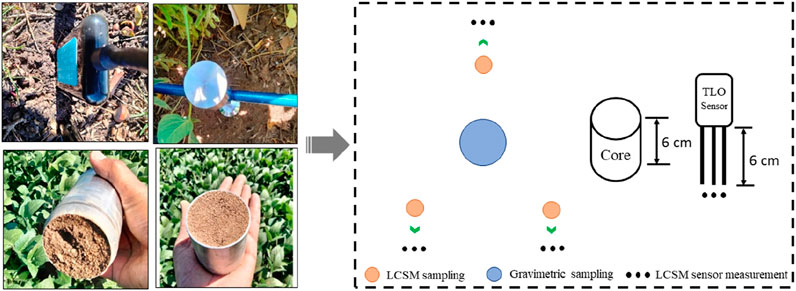
Figure 6. Sampling design for collecting LCSM sensor measurements and corresponding gravimetric samples for soil VWC measurement in agricultural farms.
As suggested by Singh et al. (2021), the arithmetic average of the three measurements was considered a representative value corresponding to the gravimetric sample. A similar protocol is followed for measuring soil moisture content using widely used commercially available handheld sensors such as HydraProbe (Stevens Water Monitoring Systems, Inc. USA) and ThetaProbe (Delta-T Devices, Ltd. UK). The corresponding soil VWC measurements were recorded at various locations alongside the LCSM to facilitate a comparison with commercially available and widely used soil moisture sensors. A soil coring tool with a fixed volume of 154.103 cm3 and a depth of 6 cm matching the sensing depth of the TLO sensor, was employed to obtain gravimetric samples (see Figure 6). The gravimetric soil moisture content on a mass basis was determined using an oven-drying technique at a temperature of 105°C for a duration of 48 h. Further, the gravimetric soil moisture content on a mass basis was converted into VWC using dry bulk density estimated using the known volume of the soil sample. Throughout the experiment, careful attention was devoted to accounting for variations in both topography and land use to ensure the accuracy and comprehensiveness of the results.
3.2.2 Sampling design in forest fields
The scarcity of literature regarding the influence of organic matter on EM-based dielectric soil moisture sensor response was observed by both Vaz et al. (2013) and Nagare et al. (2011). This observation emphasizes the critical need to investigate the relationship between dielectric soil moisture sensor response, especially considering the prevalence of organic soils in natural ecosystems and agricultural practices. Various research studies have calibrated commercially available sensors such as ECH2O 5TE and the Delta-T ThetaProbe specifically for organic soil (Bircher et al., 2016; Nagare et al., 2011; Vaz et al., 2013). These sensors are renowned for their reliability and accuracy but also known to be expensive. Interestingly, despite the availability of these costly sensors, the utilization of other low-cost soil moisture sensors for organic soil has not been extensively explored. Therefore, in this study, we also calibrate the LCSM sensor for the organic soil and evaluate its performance against gravimetric-based VWC, as well as measurements based on commercially available sensors.
To develop the calibration of the LCSM sensor for organic soils, experiments were conducted in forest fields enriched with organic matter soils. Taking advantage of the opportunities presented by the SMAPVEX 22 field campaigns, sampling was carried out in 13 fields at Millbrook and Massachusetts forests study sites during April and November 2022. In each field, measurements of the LCSM sensor were taken at 14 locations in two transects, where each transect containing seven sampling locations, as shown in Figure 7. Notably, at each sampling location, three measurements of the LCSM sensor were taken coinciding with the widely used commercially available HydraProbe soil moisture sensor. The HydraProbe is an FDR similar to the TLO sensor operating at 50 MHz, with a reported sensor accuracy of ±0.03 m3m−3 (Stevens Water Monitoring Inc, 2018). For this study, we utilized the relative soil dielectric permittivity measured using the HydraProbe and factory-supplied soil-specific calibration for reliable soil VWC measurements in forest organic soil. The HydraProbe measurements were taken to inter-compare measurements with the LCSM device. Gravimetric samples for developing the LCSM sensor’s calibration were taken at four locations in each field through a scooping method, as illustrated in Figure 7. A total of 107 gravimetric samples along with measurements from the HydraProbe were collected over a range of soil wetness conditions, synchronising with the LCSM sensor measurements.
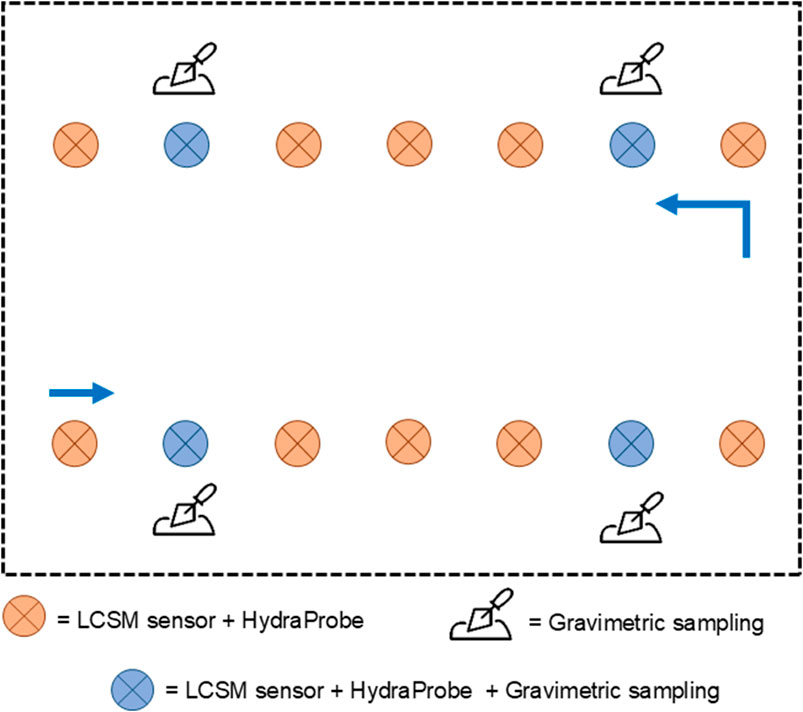
Figure 7. Sampling design followed during NASA’s SAMPVEX - 22 field campaign in forest fields predominantly with organic soil. The blue arrow shows the direction of the sampling.
The SMAPVEX-22 field experiments also included estimating the dry bulk density of each sampled field to calculate collected gravimetric soil moisture on a volume basis. Notably, an excavation method, also known as the USDA method, was used to estimate the dry bulk density of forest organic soil as recommended by Al-shammary et al. (2018). This is because the coring method for determining bulk density is widely utilized only in agricultural soil or mineral soils (Brahim et al., 2012). The excavation method consists of a plexiglass ring that is securely fixed in the soil, as shown in Figure 8. A thin plastic bag (50-micron polythene bag) is then used to determine the volume of the space between the soil surface and the bottom of the hook hanging from the “hook gauge.” By filling the bag with measured volumes of water until the water level reaches the bottom of the hook, the total amount of water used represents the volume of the space. Once the plastic bag is removed, the desired layer of soil for characterization is excavated from inside the plexiglass ring. The excavated soil is then carefully transferred to a container, such as a zip lock, to measure its mass. To determine the volume of the excavated soil, another thin plastic bag and the hook gauge are employed. By placing the bag in the excavated soil and measuring the volume it occupies, the difference between this volume and the initial water-filled volume provides the total volume of the excavated soil. Each soil sample is transported to the laboratory to estimate the mass of dry soils using an oven-drying technique at a temperature of 105°C for a duration of 48 h. Further, the mass of dry soils was used to estimate dry bulk density using the known volume of the excavated soil sample. Finally, the gravimetric soil moisture content was calculated on a volume basis using estimated dry bulk density.
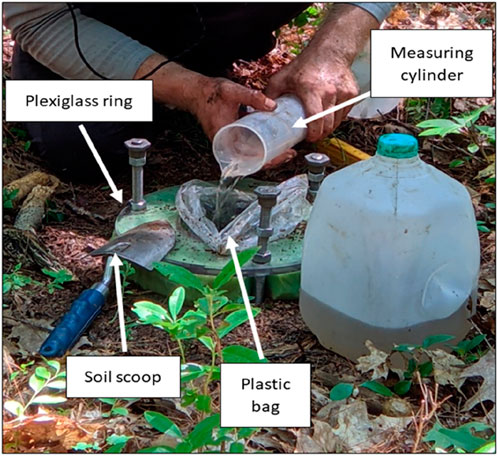
Figure 8. USDA method for calculation of soil dry bulk density.
3.2.3 LCSM sensor calibration procedure
As discussed in Section 3.1.1, the LCSM sensor operates on the TLO principle, providing voltage-based output readings by analysing the reflected frequencies based on soil dielectric permittivity. To accurately interpret and relate these voltage measurements to actual soil VWC, it is imperative to calibrate the sensor in terms of soil VWC (Seyfried et al., 2005). Calibration ensures that the voltage readings obtained from the sensor in the soil are aligned with the corresponding soil VWC. In this study, we established a robust calibration for the LCSM sensor device, by correlating the voltage measurements with the gravimetric method-based soil VWC (GVWC). In the past, several studies on soil moisture sensor calibration have used linear regression and reported a RMSE of less than ± 0.005 m3m−3. Since linear relationships are straightforward, easily interpretable, and possess high transferability, our primary focus was on developing linear calibrations for the LCSM sensor. The general form of the sensor calibration using a linear relationship is expressed as follows:
where θ represents soil VWC, V denotes the sensor output in volts, and a0 and a1 represent coefficients often referred to as calibration coefficients, which are determined empirically.
In this study, our primary focus was on the development of two types of calibrations: (i) generalized calibration and (ii) soil-specific calibration. The generalized calibration was specifically designed for broader applications, where calibration was performed on all sampled data within each specific soil group as a whole. For the LCSM sensor we developed a separate generalized calibration for mineral soil and organic soil. It is essential to highlight that all the datasets collected from agricultural fields were utilized to derive the general calibration coefficients for mineral soil. Conversely, all the datasets gathered from forested areas were employed in the development of generalized calibrations for organic soil. The soil-specific calibrations were developed based on the textural classification of the locations from where samples were collected during various field experiments. This approach allowed us to consider the distinct properties and characteristics of each soil type and improve the accuracy of the calibration development process.
We established a linear regression (Equation 1) to relate GVWC to the corresponding LCSM sensor readings (in volts) for each type of calibration. Notably, to ensure the accuracy of the calibration all the sampled datasets comprising GVWC and coincident LCSM sensor measurements were first analysed to detect the outliers within the dataset before proceeding with the calibration development process as suggested by Singh et al. (2021) and Rowlandson et al. (2013). Outliers within the sampled dataset may arise from various sources, including errors introduced during sample collection, transportation, and laboratory procedures such as weighing and oven drying (Singh et al., 2021). This rigorous data cleaning process was undertaken to ensure the integrity and reliability of the data for developing robust calibration for the LCSM sensor. Further, the calibrations of the LCSM sensor were evaluated based on the established practices as adopted in previous studies (Cosh et al., 2005; Rowlandson et al., 2013; Singh et al., 2021).
3.3 Comparative performance evaluation of LCSM sensor with commercially available devices
In this study, we also conducted a comprehensive comparative performance evaluation of the soil VWC measurements obtained through the LCSM sensor in comparison to other commercially available and widely used handheld soil moisture devices, namely, the HydraProbe and ThetaProbe. To assess the reliability and accuracy of the LCSM sensor, we performed various statistical analyses, as described in subsequent Section 3.4. These tests were utilized to ascertain whether significant differences existed between the mean soil moisture readings obtained from the LCSM sensor and those obtained from the commercially available HydraProbe and ThetaProbe sensors. Additionally, we determine both the strength and direction of the relationship between the soil moisture readings derived from the LCSM sensor and those obtained from the commercial sensors. Furthermore, we presented the analysis to represent the degree of agreement between the measurements obtained by the LCSM sensor and commercially available sensors. By doing so, we aimed to gain insights into any systematic biases or discrepancies between the different sensors. Through the combination of these statistical analysis, the research aimed to provide a comprehensive and robust assessment of the LCSM sensor’s performance and accuracy in estimating soil VWC in comparison to the HydraProbe and ThetaProbe sensors.
3.4 Statistical analysis
In this study, various statistical methods were employed to ensure a robust performance evaluation of the developed LCSM sensor to offer valuable insights into its suitability and reliability for wider applications. Before developing calibrations for the LCSM sensor, outliers were identified and removed using the statistical criterion that sampled datasets falling outside of two times the standard deviation (SD) of the residuals were classified as outliers (Singh et al., 2021). This threshold is commonly employed in sensor calibration studies to remove extreme deviations caused by sensor or procedural anomalies while preserving the core variability inherent to diverse soil types. Applying the same ±2 SD criterion consistently across organic and mineral soils ensures fairness, prevents soil-type bias, and facilitates standardized quality control. Moreover, because the SD is inherently linked to each dataset’s variability, highly heterogeneous soils still maintain broader acceptable range. To assess the accuracy of the LCSM sensor’s calibrations, we utilized standard goodness-of-fit indices (GFI), including RMSE and bias (Cosh et al., 2005; Rowlandson et al., 2013; Singh et al., 2021). For a comparative performance analysis of LCSM sensors with commercially available devices, we used independent sample t-tests to determine significant differences between the mean soil moisture readings from different sensors. Additionally, the correlation coefficient (R-value) was calculated to evaluate the strength and direction of the relationship between soil moisture readings of different sensors. To evaluate the adequacy of the sample size, a power analysis was conducted for the calibration slope test. Statistical power was defined as the probability of correctly rejecting the null hypothesis (β = 1) for a range of effect size (δ) at a significance level of α = 0.05, using a two-tailed t-test. The δ was defined as the absolute deviation of the slope from ideal slope, i.e., 1 (δ = |β − 1|). A sample size was considered adequate if the estimated power (1 − β) exceeded 0.80. Additionally, Bland-Altman plots were used in the comparative performance analysis to visually assess the degree of agreement between different sensor measurements and to highlight any systematic differences.
4 Results and discussion
4.1 Calibration for mineral soils
4.1.1 Generalized calibration
The scatter plots, as illustrated in Figure 9, highlight a linear relationship between the output of a newly developed LCSM sensor in voltage [V] and the GVWC. This linear relationship is aligned with a study conducted by Seyfried et al. (2005), where linear regression was employed to calibrate a soil moisture sensor using the TLO technique across various soil textures, strengthens the robustness of our findings. Additionally, Rowlandson et al. (2013) also compared the effectiveness of linear regression with a third-order polynomial relationship for calibrating the soil moisture sensor utilizing the TLO technique. Notably, their findings indicated that there was no statistically significant difference in the values of R2 (coefficient of determination) and RMSE between these two calibration methods. These results imply that the linear regression approach may be just as effective as the more complex polynomial model for mineral soil. Furthermore, a study conducted by Singh et al. (2021) supported the superiority of a linearly developed general calibration equation over manufacturer calibrations. This suggests that a simplified linear model can yield comparable results to a more complex equation for calibration purposes. Therefore, in this study, a linear regression analysis using 301 data points was employed for developing calibration coefficients of the LCSM sensor using GVWC and the output of the LCSM sensor in V. While the GVWC measurement might have some errors, which might arise from various sources as suggested by Singh et al. (2021), there is a possibility of outliers occurring in the calibration dataset (as shown in Figure 9a). During the soil moisture sensor calibration study, prior to calibration, the data collected from field campaigns underwent pre-processing to detect and identify outliers. By adopting the outlier removal methodology described in Section 3.3, a total of 32 outliers were removed from the calibration dataset and the linear relationship is presented in Figure 9b. Thereafter, using 269 data points, a linear regression–based generalized calibration of the LCSM sensor was developed for mineral soils as given in Equation 2. The removal of outliers is often considered as a separate calibration technique to emphasize the influence that erroneous samples can have on the error estimation of a calibration technique (Rowlandson et al., 2013).
A linear regression-based generalized calibration (Equation 2) for mineral soil was determined with calibration coefficients of 0.550 (a0) and −0.059 (a1). The application of these generalized calibration coefficients resulted in a RMSE value of 0.035 m3m−3 and high correlation (R = 0.90) as shown in Table 3. Although the overall average bias is less than 0.0001 m3m−3, it is also important to note that some samples exhibited a higher absolute bias of 0.06 m3m−3. Similar high R-values and a large bias were also seen in the studies conducted by Cosh et al. (2005) and Singh et al. (2021). To evaluate the adequacy of the sample size used for developing the calibration, a power analysis was conducted as explained in Section 3.4. Based on the datasets used for sensor calibration in mineral soil, we calculated the statistical power for various effect sizes (δ = 0.2, 0.3, 0.4, and 0.5). The actual effect size (δ = 0.2) for the calibration analysis was defined using the absolute deviation of the calibration regression coefficient (R2) from the ideal slope of 1.0 (see Figure 9; R = 0.90 or R2 = 0.80). This deviation (δ = 0.2) was considered to represent a moderate but practically meaningful calibration offset. Despite this deviation, the performance remained consistent across different soil textures, with a δ value of 0.2 (see Table 3). Using δ = 0.2 yielded a statistical power of 1.0, indicating that the sample size used is adequate for developing a robust generalized calibration of mineral soil.
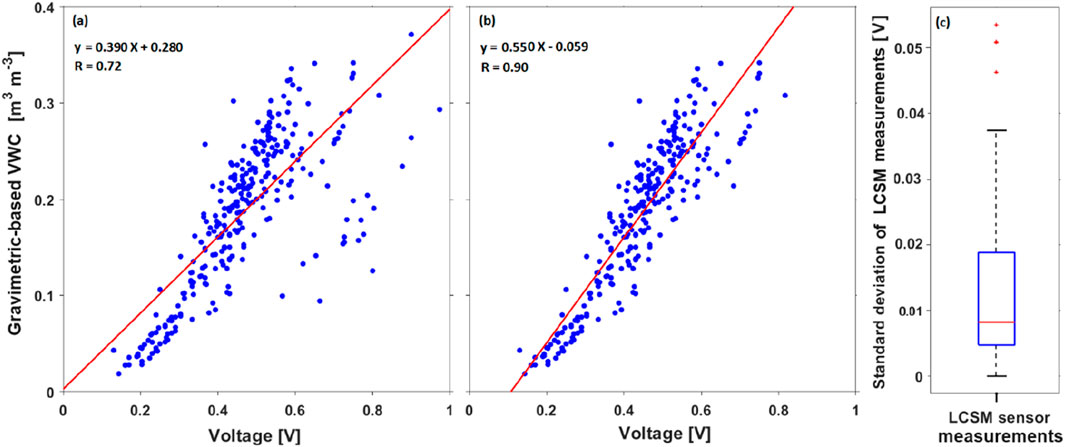
Figure 9. Linear regression between the voltage output of LCSM sensor and gravimetric-based VWC for mineral soil (a) with all datasets (b) with outlier removed datasets (c) a box plot of the standard deviation of collocated LCSM sensor voltage measurements (i.e., three samples at each location) collected during the field experiments.

Table 3. Calibration performance and power analysis for generalized and soil-specific models.
We have also evaluated the measurement uncertainties of the LCSM sensor by repeating measurements at the same location. Using the database of collocated LCSM sensor voltage measurements (i.e., three samples at each location) collected during the field experiments, we computed the standard deviation statistics of repeated LCSM sensor voltage measurements at each location. The range of standard deviation statistics for all collocated LCSM sensor voltage measurements in volt [V] is shown through a box plot, presented in Figure 9c. The narrow range of standard deviations in LCSM sensor measurements, with a median value of less than 0.01 V, confirms lower measurement uncertainties in LCSM sensor sampling.
It is interesting to note that in Table 3 the RMSE of the newly developed soil moisture measurement device is less than 0.04 m3m−3 and the overall bias is less than 0.001 m3m−3. Overall, these findings emphasize the sensor’s effectiveness and reliability for the intended purpose of validating soil moisture data derived from remote sensing techniques (Entekhabi et al., 2010). Kukal et al. (2020) and Dong et al. (2020) evaluated commercially available soil moisture sensors used for agricultural applications. Their findings revealed a wide range of RMSE values, varying from 0.06 m3m−3 to 0.005 m3m−3 of commercially available soil moisture sensors. This comparison highlights the potential suitability of the newly developed LCSM measurement device for agricultural use, given its comparable performance to the commercially available sensors based on past studies.
4.1.2 Soil-specific calibration
The soil textural information for developing soil-specific calibration was acquired from the Web Soil Survey, which is managed by the USDA Natural Resources Conservation Service, USA. The soil samples were categorized based on their textural classification for developing soil-specific calibrations. Through linear regression analysis, calibration coefficients were obtained for the loam soil (Equation 3), while Equation 4 was derived for the sandy loam soil. The calibration coefficients obtained for the loam soil were 0.560 (a0) and −0.058 (a1), while for the sandy loam soil, the coefficients were 0.501 (a0) and −0.062 (a1).
From Table 3, it is observed that there was an improvement in the R and RMSE values when compared to the generalized calibration (Equation 2). Furthermore, the power analysis revealed that both Equation 3 and Equation 4 were highly sensitive to detecting calibration deviations, achieving statistical powers of 0.99 and 1.0 for Sandy Loam and Loam, respectively, at δ = 0.2. These results confirm the reliability and adequacy of the sample sizes for developing specific calibrations for both soil textural class. This suggests that the calibration equations, specific for loam and sandy loam soil, provided a better fit for the data than the generalized equation. The relationship between the LCSM sensor calibrated VWC and GVWC is presented as a scatter plot for loam and sandy loam soil is shown in Figure 10. Similar improvements in the soil-specific calibration were observed in studies conducted by Cosh et al. (2005), Rowlandson et al. (2013), and Singh et al. (2021), which aligns with the findings mentioned in this study. In the RMSE, comparable improvements were also observed for loam (0.031 m3m−3) and sandy loam soil (0.034 m3m−3). However, it is interesting to note that despite the improvements in R and RMSE, bias remained relatively unchanged when comparing the soil-specific calibration coefficients for loam and sandy loam soil to the generalized calibration (Equation 2). These results are consistent with the findings of Cosh et al. (2005) and Vaz et al. (2013). Also, in the study conducted by Singh et al. (2021), it was found that there was no significant statistical difference in the calibration coefficients of soil-specific to the general equation, except for fine-textured soils. This suggests that while soil-specific calibration coefficients may improve the correlation, they may not have a substantial impact on reducing the RMSE and bias, particularly for loam and sandy loam soil.
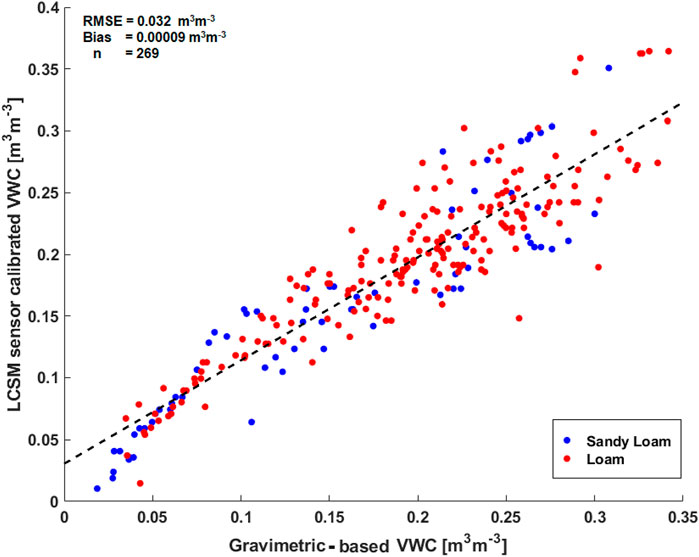
Figure 10. Scatter plot between gravimetric-based VWC and the LCSM sensor calibrated VWC for sandy loam and loam soil.
4.2 Calibration for organic soils
The LCSM sensor was calibrated for organic soil using collected GVWC data and corresponding LCSM sensor reading in volts at 13 distinct forest fields enriched with organic matter soils during the SMAVEX-22. Linear regression analysis was conducted on outlier-removed datasets, comprising 107 data samples, to obtain calibration coefficients for the LCSM sensor in organic soil (Figure 11). These calibration coefficients for organic soil are as a0 = 0.860 and a1 = −0.076. The analysis demonstrated promising results, with an R-value of 0.80 and a RMSE of 0.078 m3m−3 for organic soil, as presented in Table 3. A reasonably high correlation coefficient indicates a good fit of the regression model to the data. Furthermore, the statistical power for detecting this effect was 0.92, confirming that the sample size was adequate to perform robust calibration in organic soils. However, in the case of organic soil, a higher RMSE and bias were observed compared to mineral soil (see Table 3). This indicates that predictions within the organic soil exhibited scattered around the actual values of soil moisture as seen in Figure 11. This disparity between organic and mineral soils can be attributed to the complex nature of forest organic soil, characterized by very high porosities which increase the bound water, and large specific surface areas which decrease the portion of free water (Bircher et al., 2016; Kassaye et al., 2019; Park et al., 2019). When a probe is inserted in organic soils, a common challenge is the formation of air gaps between the probe and the surrounding soil. Air gaps often form around probes in organic soils due to their loose, porous structure. These gaps disrupt contact between the probe and soil, leading to either under or over estimation (Mane et al., 2024; Susha et al., 2014). These characteristics influence the distribution of differences between LCSM sensor VWC and GVWC values in the organic soil. As shown in Figure 11 the wide spread of values is likely influenced presence of soil organic matter, which plays a significant role in affecting the measurements (Li et al., 2022). The presence of soil organic matter introduces a nonlinear dielectric response in soils, especially when EM waves interact with soil surface ions. This interaction can cause changes in how the soil responds to the sensor, especially at certain frequencies (1–500 MHz). Because of this, the relationship between the sensor, the frequency used, and the soil’s properties becomes unpredictable (Bakian-Dogaheh et al., 2025; Park et al., 2019) and does not always follow a clear pattern. This can be easily observed from Figures 9, 11. Studies have shown that organic soils exhibit lower and more variable responses compared to mineral soils at the same moisture content, due to the unique water retention and binding characteristics of organic matter (Szypłowska et al., 2021; Zhang et al., 2023). As a result, the response in organic-rich soil often deviates from the general trends observed in inorganic soils (Kargas et al., 2011). This behavior is also consistent with observations from TDR readings conducted in various studies (Kellner and Lundin, 2001; Park et al., 2019).
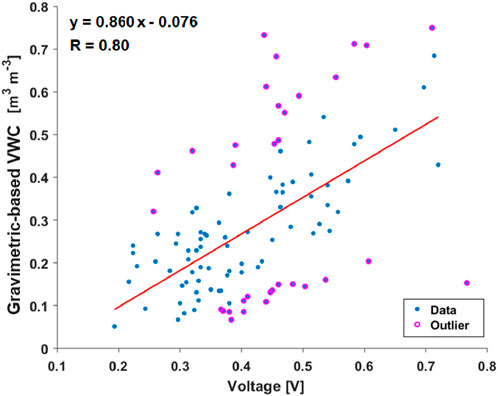
Figure 11. Linear regression between the outlier removed voltage output of LCSM sensor and gravimetric-based VWC in forest organic soil.
Furthermore, in a comparative laboratory study of various impedance soil moisture sensors conducted by Vaz et al. (2013) and Kassaye et al. (2019), a high RMSD (Root Mean Square Deviation) value of 0.060 m3m−3 and 0.090 m3m−3 was observed respectively. In a field study conducted by Park et al. (2019) and Kassaye et al. (2019) involving soil with high organic matter content, a significantly high RMSE value of 0.12 m3m−3 and 0.153 m3m−3 was observed, respectively, for the dielectric soil moisture sensor. This result is consistent with the challenges associated with and observed during our field study of the performance of the dielectric sensor in soil moisture measurements. It is also emphasized by Kargas et al. (2011) in their laboratory-based study that further research is required to improve the accuracy of soil moisture measurements of dielectric soil moisture sensors, especially in organic soil with their unique complexities such as high porosity and high surface area. Thus, a comparative analysis of the performance of different soil moisture sensors is presented in a further section.
4.3 Comparison of LCSM sensors with commercially available soil moisture sensors
In this study, we also assessed the performance of the developed LCSM sensor for measuring soil moisture content against commercially available and widely used sensors such as HydraProbe and ThetaProbe. Figure 12 shows a comparison between calibrated LCSM sensor-based VWC and GVWC measurements for mineral soils, along with a comparison against HydraProbe and ThetaProbe VWC measurements. Similarly, Figure 13 illustrates the comparison of LCSM sensor-based VWC measurements against GVWC and HydraProbe-based VWC measurements for organic soil. An independent sample t-test was also performed to find if the difference in soil moisture measurements of different soil moisture sensor pairs with GVWC is statistically significant at the 5% level of significance. Results of the t-tests statistics are summarized in Table 4 for both mineral and organic soils. Additionally, the comparison of p-values from the t-test for different soil moisture sensor pairs and GVWC in both mineral and organic soils is presented in Figure 14.

Figure 12. Scatter plots showing the comparison of gravimetric-based VWC (GVWC) and calibrated LCSM sensor-based VWC pairs with commercially available soil moisture sensors (HydraProbe and ThetaProbe) VWC for mineral soils.
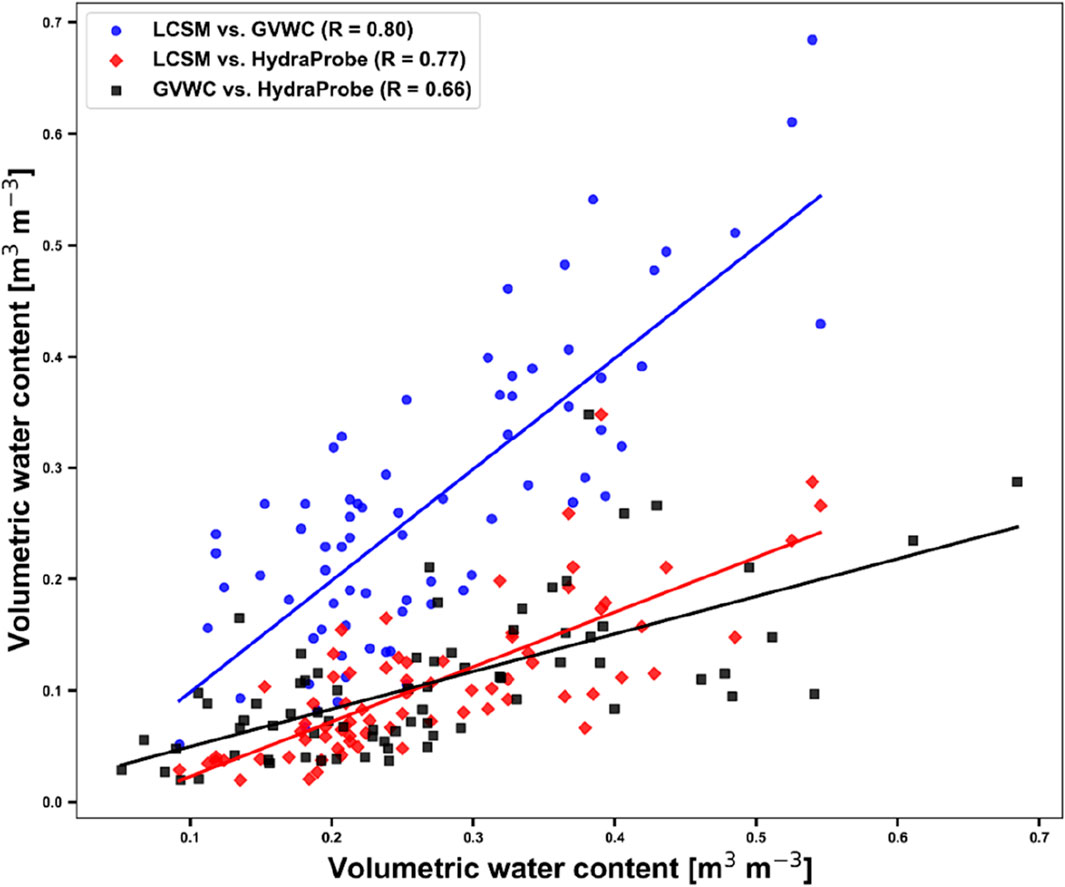
Figure 13. Comparison between LCSM sensor-based VWC and Gravimetric-based VWC (GVWC), as well as HydraProbe, in organic soil.
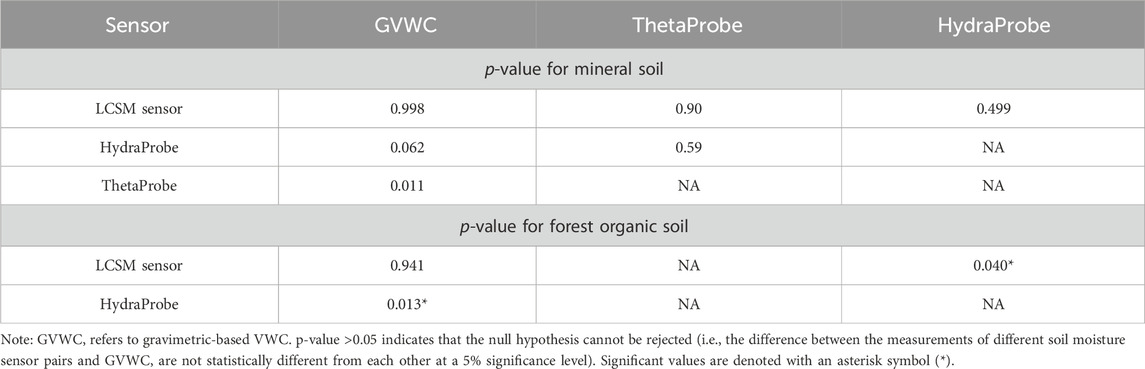
Table 4. Statistical comparison of soil VWC measurements conducted using LCSM sensor and commercial sensors with GVWC in mineral and organic soils based on t-test statistics, with p-values at a 5% significance level.
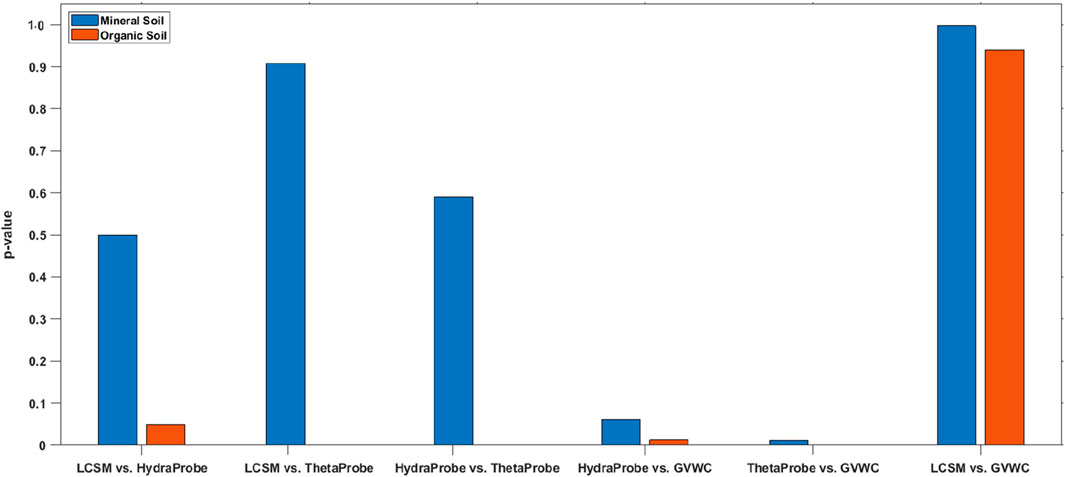
Figure 14. Comparison of p-values from t-test for various soil moisture sensor pairs-based VWC and gravimetric-based VWC (GVWC) in both mineral and organic soils.
As shown in Table 3, except for three cases (i.e., ThetaProbe versus GVWC for mineral soil, HydraProbe versus GVWC, and LCSM sensor versus HydraProbe for organic soil, where the p-value is found to be 0.011, 0.013, and 0.040, respectively), no significant difference was observed among different pairs of soil moisture sensors with GVWC. In these three specific cases p-value associated with the t-test is less than 0.05 (5% significance level), leading to the rejection of the null hypothesis and conclude that there is a significant difference between the pairs of soil moisture measurements. Considering the overall statistics, it is found that there is less than a 5% chance that the observed difference may have occurred by randomness alone for making a difference between the means of soil moisture among different pairs of measurements.
Despite these statistics, the correlation between ThetaProbe and GVWC for mineral soil remains high with an R-value of 0.92 (see Figure 12), along with a reasonable correlation (R = 0.66) between GVWC and HydraProbe for organic soil (see Figure 13). These t-tests statistics suggest that the developed LCSM sensor, ThetaProbe, and HydraProbe provide comparable estimates of soil moisture. The correlation analysis presented in Figures 12, 13 supports the robustness of the developed calibrations for the LCSM sensor for mineral and organic soil, respectively. In fact, the high correlation (R > 0.93) between the LCSM sensor and GVWC measurements, shows a high agreement of developed LCSM sensor readings with the GVWC measurements in mineral soil. On the other hand, VWC measurements in mineral soil using HydraProbe and ThetaProbe were also found to have a strong linear relationship with the developed LCSM sensor, with a very high correlation of 0.99 and 0.98, respectively.
In addition, the results of the Bland-Altman analysis, with a specific focus on the LCSM sensor, reveal promising findings for mineral soil, as shown in Figure 15. The LCSM sensor demonstrates a narrow range of agreement with the GVWC measurements (black dotted lines), indicating relatively consistent differences and high accuracy. Its mean difference line closely aligns with the zero line, suggesting minimal systematic bias and a high level of agreement with the true values of VWC measurements. The fact that all three sensors (HydraProbe, LCSM sensor, and ThetaProbe) exhibit mean difference lines between 0 and 0.05 m3m−3 signifies a general consistency and accuracy in their measurements for mineral soil. Similarly, the 95% confidence intervals (CI) for the limits of agreement (LoA) were relatively narrow across all sensors. Among them, the LCSM sensor represented by the black error band, showed the narrowest CI, suggesting slightly greater consistency and a more precise estimation of its LoA compared to the HydraProbe and ThetaProbe sensors. Moreover, the consistent pattern of points for all three sensors implies a stable level of agreement across the measurement range. In conclusion, the LCSM sensor demonstrates excellent agreement with the gravimetric method, making it a promising sensor for reliable soil moisture measurements in mineral soil. However, careful consideration and understanding of the characteristics of all soil moisture sensors are necessary before making a final selection for future measurements.
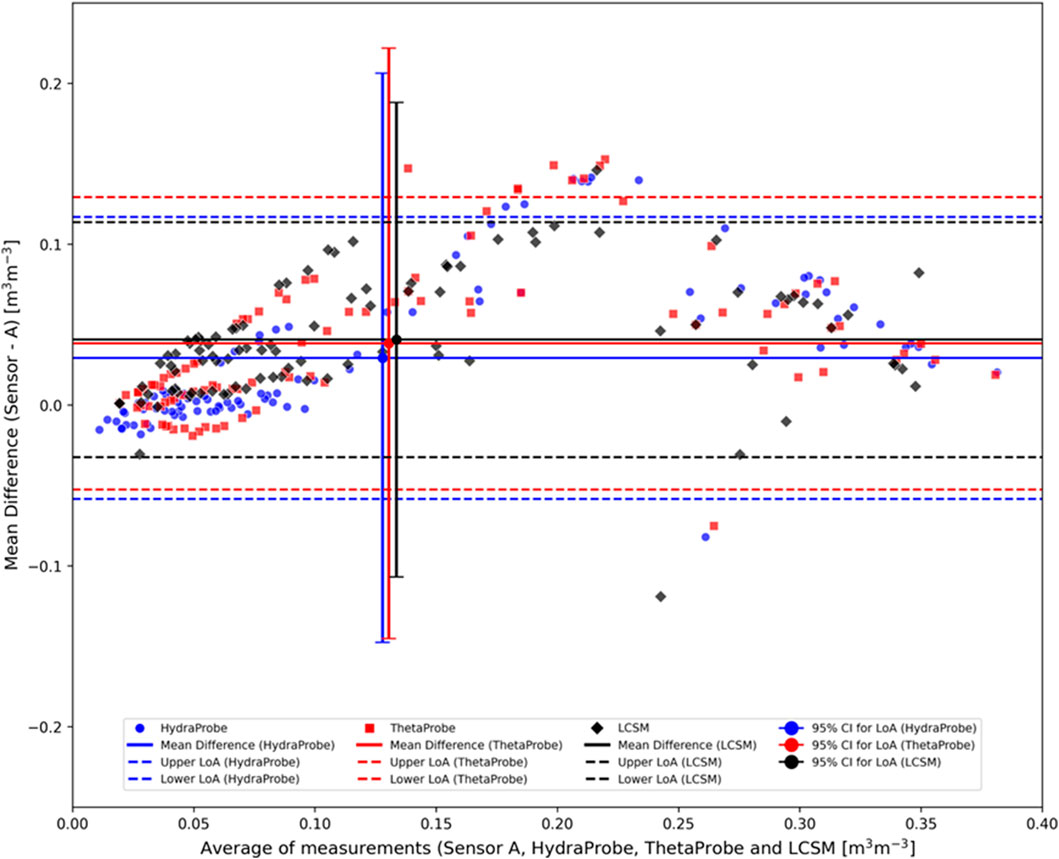
Figure 15. Bland-Altman plot showing a comparison of VWC soil moisture measurements between HydraProbe, LCSM sensor, and ThetaProbe in mineral soil (where A is gravimetric-based volumetric water content). The vertical bars represent the 95% confidence interval (CI) of limits of agreement (LoA).
Throughout this study, generalized calibration coefficients were utilized for measurements taken through the HydraProbe, ThetaProbe, and the newly developed LCSM sensor. The lack of significant differences among the sensors suggests that, under the specific conditions of loam and sandy loam soil, along with the environmental settings examined, all three sensors perform similarly in estimating soil moisture content. The observed similarities in the performance of these sensors are promising, as it implies that researchers and practitioners can confidently choose LCSM sensor based on other factors such as cost, ease of installation, and compatibility with data logging systems, without compromising the accuracy of soil moisture measurements. However, it is essential to acknowledge the limitations of this study. The conclusions drawn from our findings are specific to the dataset and experimental conditions utilized. Further investigations across various soil types, geographic regions, and environmental settings may yield different results. Additionally, factors such as sensor calibration and maintenance should be carefully considered when deploying these sensors in practical applications.
For the forest organic soil, the outcomes of the t-test provide crucial insights into the comparability of soil moisture readings with the HydraProbe sensor pairs. The significant differences observed in the mean soil moisture readings between the LCSM sensor and HydraProbe sensor (p-value = 0.040) and between HydraProbe and GVWC (p-value = 0.013) indicate that these sensors may not provide consistent estimations of soil moisture content in forest organic soil. The presence of statistically significant differences between these sensor pairs implies that caution should be exercised when directly comparing or interchanging the readings of this sensor in forest organic soil applications. However, the lack of significant difference between LCSM sensor and GVWC sensors (p-value = 0.94) suggests that they may exhibit relatively similar performance characteristics in the forest organic soil. Nonetheless, it is important to approach this finding with caution, as the p-value is relatively high, indicating the possibility of random variations influencing the results. Consequently, while the LCSM sensor and GVWC may not show significant differences in mean soil moisture readings, further investigation is warranted to determine the extent of their agreement and the potential sources of variability.
Further, the correlation coefficients provide valuable insights into the strength and direction of the linear relationships between sensor pairs. The moderate correlation coefficient between LCSM sensor and HydraProbe sensors (R = 0.77) indicates a positive but not perfect linear relationship between their measurements. Similarly, the moderate correlation coefficient between LCSM sensor and GVWC sensors (R = 0.80) suggests a positive association between their readings. The lower but still moderate correlation coefficient between HydraProbe and GVWC sensors (R = 0.66) indicates a relatively weaker linear relationship. Furthermore, the moderate correlation suggests that there is a degree of agreement between the sensor pairs, but some variability exists in their measurements. This variability may be influenced by factors such as differences in sensor technology, calibration, or sensitivity to organic soil characteristics (Bircher et al., 2016; Kassaye et al., 2019). As a result, while the correlations are positive, the scattered nature of the data points in the Bland-Altman plot (Figure 16) raises questions about the consistency of the LCSM sensor performance in providing accurate and reliable soil moisture measurements. The Bland-Altman analysis reveals that both the LCSM sensor and HydraProbe exhibit differences from the gravimetric measurements in organic soil. The HydraProbe demonstrates better agreement overall, with a mean difference close to zero and more consistent points around the mean line. In contrast, the LCSM sensor shows a systematic bias, as indicated by its mean difference line being away from zero. Additionally, the larger limits of agreement for both sensors suggest that their measurements may have higher variability and less precision in forest organic soil. However, the 95% CI for the LoA were found to be relatively wide for both sensors. This indicates acceptable precision, but the wide spread of individual data points suggests potential variability in sensor accuracy under organic soil conditions. Further investigation and consideration of the specific characteristics and limitations of each sensor are crucial for the accurate interpretation and selection of the most suitable sensor for soil moisture measurements in organic soil conditions.
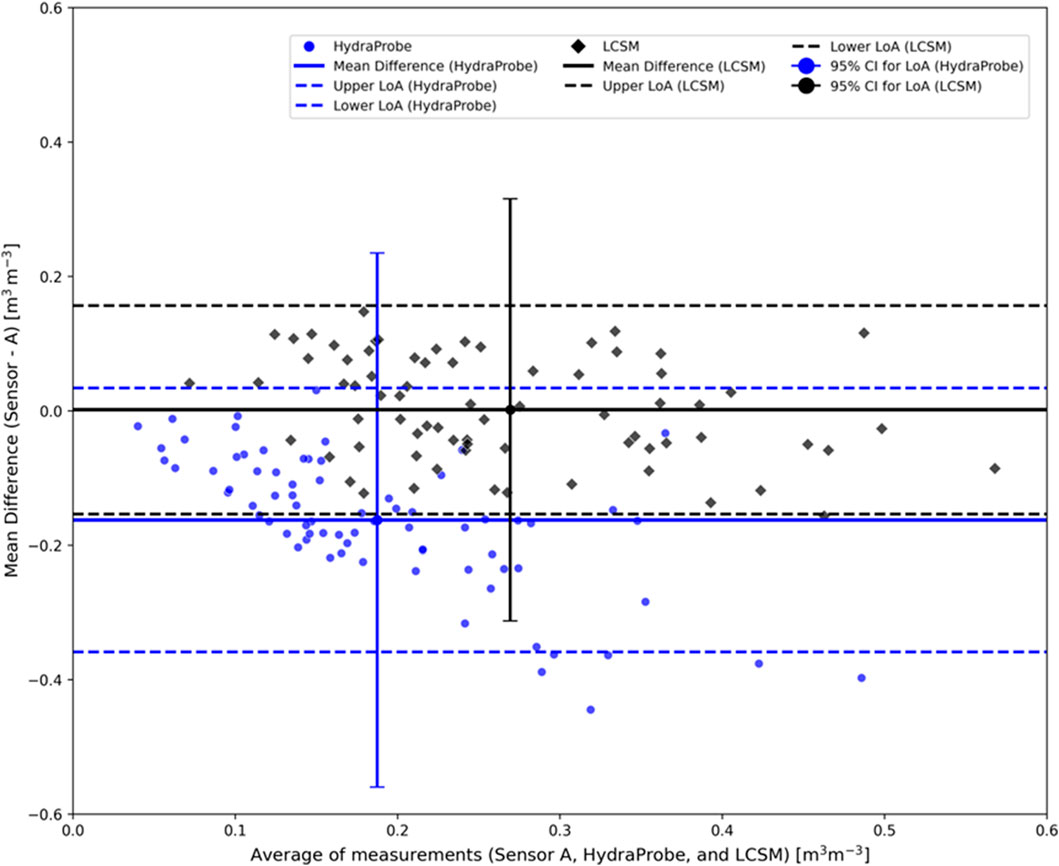
Figure 16. Bland-Altman plot showing the comparison of VWC obtained through LCSM sensor and HydraProbe in organic soil (where A is gravimetric-based VWC). The vertical bars represent the 95% confidence interval (CI) of limits of agreement (LoA).
Moreover, the significant differences observed between sensors, the moderate correlation coefficients, and the scattered data in the Bland-Altman plot for organic soil shown in Figure 16, collectively highlight the need for further research to investigate the factors influencing the performance of soil moisture sensors in forest organic soil. Researchers should explore potential sensor-specific calibration adjustments or consider soil characteristics in the calibration to enhance the accuracy and reliability of soil moisture measurements in the organic soil type.
While the temperature, salinity, and pH levels of soil samples may not directly affect the functioning of the TLO soil moisture probe, they can indirectly impact its performance by influencing the dielectric constant, electrical conductivity, sensor calibration, moisture distribution, and physical properties of the soil. Therefore, it is crucial to consider soil temperature, salinity, and pH levels in the calibration process when using TLO sensors for soil moisture monitoring applications in diverse soil and agricultural field conditions. Thus, to enhance the generalized capability of the developed calibrations for the LCSM sensor, future research should be carried out on a wider range of mineral and organic soils and geographic locations with varying environmental settings, along with the inclusion of soil temperature, salinity, and pH levels. Additionally, increasing the sample size and conducting long-term monitoring studies can provide more comprehensive insights into the sensors’ performance over varying soil moisture conditions.
4.4 Future scope and limitation
Given the demonstrated accuracy and reliability of the developed LCSM sensor, this study highlights its strong potential for applications in agriculture, hydrology, and the validation of remote sensing-based soil moisture products. The sensor operates effectively within a specified temperature and pH range and has been calibrated for use in different soil types. However, several practical and environmental factors require further investigation to support long-term uses and broader adoption. Although the sensor is tested to operate in a specific range of soil types and environmental conditions, its response to varying salinity and pH levels has not yet been systematically tested. For instance, due to the use of low-frequency EM waves (∼50 MHz), the sensor may exhibit increased sensitivity to changes in higher soil salinity and temperature ranges. These factors can influence the sensor’s dielectric response and overall accuracy. Future studies should therefore investigate the sensor’s performance across different salinity gradients and pH levels to fully understand its adaptability and potential calibration needs in diverse soil environments. Furthermore, LCSM sensor’s performance could be impacted by prolonged exposure to environmental fluctuations, including ambient temperature and humidity, which also need to be investigated.
The current sensor design utilizes only four readily available components (PCB, soil moisture sensor, 9V battery and enclosure), making it suitable for mass manufacturing and potentially reducing the cost per unit. To enhance its usability, future versions may incorporate a 3V solar panel paired with a two 3.3V rechargeable battery and a display screen for monitoring battery status. These enhancements would increase the sensor’s autonomy and make it more user-friendly for continuous soil moisture monitoring in both professional and community-based applications. Although the LCSM sensor was used during the NASA’s SMPVEX field campaigns in 2022, where it demonstrated satisfactory durability, consistent battery performance, and feasibility for large-scale use, a comprehensive testing is required to assess sensor’s usability and reliability in practical applications. In this context, future work will be focused on pilot testing of this LCSM sensor with farmers and citizen scientists. These participatory evaluations will provide valuable feedback on ease of handling, data interpretation, and maintenance requirements, helping identify any operational challenges and improve the design for real-world use and wider adoption in various community.
5 Conclusion
In conclusion, this study successfully achieved its aim of developing an affordable, durable, and user-friendly LCSM sensor for global use by citizen scientists and farmers. Emphasizing both cost-effectiveness and robust calibration, the device demonstrated excellent performance in mineral soil, with an overall RMSE of less than 0.04 m3m−3 and strong correlations above 0.90 for both generalized and soil-specific calibration approaches. Comparisons of the developed LCSM sensor with commercially available sensors, HydraProbe and ThetaProbe, showed high correlations, and the t-tests indicated no statistically significant differences in soil moisture measurements between the LCSM sensor and these established commercially available devices in mineral soil. This validates the LCSM sensor as a reliable and cost-effective alternative for soil moisture measurements. For forest organic soil, the RMSE of LCSM sensor measurements was low at 0.0786 m3m−3, indicating promising performance with a good correlation (R = 0.80). Despite the low RMSE of LCSM sensor measurements, the accuracy aligned with previous research on organic soil calibration (Kassaye et al., 2019; Park et al., 2019; Vaz et al., 2013). In fact, the high organic content in the soil resulted in a large surface area and greater porosity, which might be contributing to the high RMSE in LCSM sensor measurements in organic soil. Nonetheless, there is still room for improving the accuracy of LCSM sensor in forest organic soil, as very few research studies focus on field calibration of soil moisture sensors in organic or forest soils. Future studies could focus on exploring advanced calibration techniques, such as Artificial Neural Networks (ANNs) and machine learning, to further enhance accuracy in forest organic soil. While this study encompassed wider field conditions, including forests and agricultural environments with various temperature and soil moisture levels, further specific investigations are needed to comprehensively evaluate the sensor’s performance across a broad range of soil texture, temperature, salinity, and pH levels. Overall, the affordability and reliability of the handheld LCSM sensor, with a total cost under 100 USD, emerges as an attractive option for citizen scientists, researchers, and farmers, providing comparable estimates of soil moisture content alongside widely used commercial handheld sensors. This affordability and reliability position the LCSM sensor as a valuable tool for soil moisture monitoring under specified conditions.
Data availability statement
The original contributions presented in the study are included in the article/Supplementary Material, further inquiries can be directed to the corresponding author.
Author contributions
SM: Methodology, Resources, Data curation, Formal Analysis, Investigation, Software, Validation, Visualization, Writing – original draft, Writing – review and editing. GS: Methodology, Data curation, Formal Analysis, Investigation, Supervision, Validation, Visualization, Writing – original draft, Writing – review and editing. ND: Conceptualization, Methodology, Resources, Funding acquisition, Project administration, Supervision, Writing – review and editing. AK: Formal Analysis, Methodology, Software, Writing – review and editing. NN: Software, Writing – review and editing. MC: Data curation, Formal Analysis, Writing – review and editing. YD: Data curation, Writing – review and editing.
Funding
The author(s) declare that financial support was received for the research and/or publication of this article. This research was supported by the National Aeronautics and Space Administration (NASA) Citizen Science Project grant number: NASA-80NSSC21K1424. This research was supported in part by the U.S. Department of Agriculture (USDA), Agricultural Research Service. USDA is an equal opportunity provider and employer.
Acknowledgments
The authors also thank lab members (Abhijeet Abhishek, Preet Lal, Arunav Nanda, Ehsan Jalivand, Mahya Hashemi) of Remote Sensing in Hydrology and Agriculture Laboratory at Michigan State University involved in the NASA SMAPVEX22 field campaign for collecting the extensive datasets. The authors also acknowledge the Kellogg Biological Station LTER program and Michigan State Universities’ Agronomy farm.
Conflict of interest
The authors declare that the research was conducted in the absence of any commercial or financial relationships that could be construed as a potential conflict of interest.
Generative AI statement
The author(s) declare that no Generative AI was used in the creation of this manuscript.
Publisher’s note
All claims expressed in this article are solely those of the authors and do not necessarily represent those of their affiliated organizations, or those of the publisher, the editors and the reviewers. Any product that may be evaluated in this article, or claim that may be made by its manufacturer, is not guaranteed or endorsed by the publisher.
Supplementary material
The Supplementary Material for this article can be found online at: https://www.frontiersin.org/articles/10.3389/fenvs.2025.1590662/full#supplementary-material
References
Abdulraheem, M. I., Chen, H., Li, L., Moshood, A. Y., Zhang, W., Xiong, Y., et al. (2024). Recent advances in dielectric properties-based soil water content measurements. Remote Sens. 16, 1328. doi:10.3390/rs16081328
Adla, S., Bruckmaier, F., Arias-Rodriguez, L. F., Tripathi, S., Pande, S., and Disse, M. (2024). Impact of calibrating a low-cost capacitance-based soil moisture sensor on AquaCrop model performance. J. Environ. Manage. 353, 120248. doi:10.1016/j.jenvman.2024.120248
Adla, S., Rai, N. K., Karumanchi, S. H., Tripathi, S., Disse, M., and Pande, S. (2020). Laboratory calibration and performance evaluation of low-cost capacitive and very low-cost resistive soil moisture sensors. Sensors 20, 363. doi:10.3390/s20020363
Al-shammary, A. A. G., Kouzani, A. Z., Kaynak, A., Khoo, S. Y., Norton, M., and Gates, W. (2018). Soil bulk density estimation methods: a review. Pedosphere 28, 581–596. doi:10.1016/S1002-0160(18)60034-7
Badewa, E., Unc, A., Cheema, M., Kavanagh, V., and Galagedara, L. (2018). Soil moisture mapping using multi-frequency and multi-coil electromagnetic induction sensors on managed podzols. Agronomy 8, 224. doi:10.3390/agronomy8100224
Bakian-Dogaheh, K., Zhao, Y., Kimball, J. S., and Moghaddam, M. (2025). Coupled hydrologic-electromagnetic framework to model permafrost active layer organic soil dielectric properties. Remote Sens. Environ. 318, 114560. doi:10.1016/j.rse.2024.114560
Basterrechea, D. A., Rocher, J., Parra, M., Parra, L., Marin, J. F., Mauri, P. V., et al. (2021). Design and calibration of moisture sensor based on electromagnetic field measurement for irrigation monitoring. Chemosensors 9, 251. doi:10.3390/chemosensors9090251
Bircher, S., Andreasen, M., Vuollet, J., Vehviläinen, J., Rautiainen, K., Jonard, F., et al. (2016). Soil moisture sensor calibration for organic soil surface layers. Geosci. Instrum. Methods Data Syst. 5, 109–125. doi:10.5194/gi-5-109-2016
Bogena, H. R., Huisman, J. A., Schilling, B., Weuthen, A., and Vereecken, H. (2017). Effective calibration of low-cost soil water content sensors. Sensors 17, 208. doi:10.3390/s17010208
Brahim, N., Bernoux, M., and Gallali, T. (2012). Pedotransfer functions to estimate soil bulk density for Northern Africa: Tunisia case. J. Arid. Environ. 81, 77–83. doi:10.1016/j.jaridenv.2012.01.012
Briciu-Burghina, C., Zhou, J., Ali, M. I., and Regan, F. (2022). Demonstrating the potential of a low-cost soil moisture sensor network. Sensors 22, 987. doi:10.3390/s22030987
Butler, D. M., and MacGregor, I. D. (2003). Globe: science and education. J. Geosci. Educ. 51, 9–20. doi:10.5408/1089-9995-51.1.9
Buytaert, W., Zulkafli, Z., Grainger, S., Acosta, L., Alemie, T. C., Bastiaensen, J., et al. (2014). Citizen science in hydrology and water resources: opportunities for knowledge generation, ecosystem service management, and sustainable development. Front. Earth Sci. 2. doi:10.3389/feart.2014.00026
Caldwell, T. G., Bongiovanni, T., Cosh, M. H., Halley, C., and Young, M. H. (2018). Field and laboratory evaluation of the CS655 soil water content sensor. Vadose Zone J. 17, 1–16. doi:10.2136/vzj2017.12.0214
Cobos, D. D., and Chambers, C. (2010). Calibrating ECH2O soil moisture sensors application note, USA. 5.
Cosh, M. H., Jackson, T. J., Bindlish, R., Famiglietti, J. S., and Ryu, D. (2005). Calibration of an impedance probe for estimation of surface soil water content over large regions. J. Hydrol. 311, 49–58. doi:10.1016/j.jhydrol.2005.01.003
Datta, S., and Taghvaeian, S. (2023). Soil water sensors for irrigation scheduling in the United States: a systematic review of literature. Agric. Water Manag. 278, 108148. doi:10.1016/j.agwat.2023.108148
Deryng, D., Sacks, W. J., Barford, C. C., and Ramankutty, N. (2011). Simulating the effects of climate and agricultural management practices on global crop yield. Glob. Biogeochem. Cycles 25. 1–18. doi:10.1029/2009GB003765
Dong, Y. (2023). “Irrigation scheduling methods: overview and recent advances,” in Irrigation and drainage - recent advances. Editors M. Sultan,, and F. Ahmad (Erscheinungsort nicht ermittelbar: IntechOpen). doi:10.5772/intechopen.107386
Dong, Y., Miller, S., and Kelley, L. (2020). Performance evaluation of soil moisture sensors in coarse- and fine-textured Michigan agricultural soils. Agriculture 10, 598. doi:10.3390/agriculture10120598
Entekhabi, D., Njoku, E. G., O’Neill, P. E., Kellogg, K. H., Crow, W. T., Edelstein, W. N., et al. (2010). The soil moisture active passive (SMAP) mission. Proc. IEEE 98, 704–716. doi:10.1109/JPROC.2010.2043918
Gardner, W. H. (2018). “Water content,” in SSSA book series. Editor A. Klute (Madison, WI: Soil Science Society of America, American Society of Agronomy), 493–544. doi:10.2136/sssabookser5.1.2ed.c21
Hamami, L., and Nassereddine, B. (2020). Application of wireless sensor networks in the field of irrigation: a review. Comput. Electron. Agric. 179, 105782. doi:10.1016/j.compag.2020.105782
Kargas, G., Kerkides, P., Seyfried, M., and Sgoumbopoulou, A. (2011). WET sensor performance in organic and inorganic media with heterogeneous moisture distribution. Soil Sci. Soc. Am. J. 75, 1244–1252. doi:10.2136/sssaj2010.0238
Kassaye, K. T., Boulange, J., Saito, H., and Watanabe, H. (2019). Calibration of capacitance sensor for Andosol under field and laboratory conditions in the temperate monsoon climate. Soil Tillage Res. 189, 52–63. doi:10.1016/j.still.2018.12.020
Kellner, E., and Lundin, L.-C. (2001). Calibration of time domain reflectometry for water content in peat soil. Hydrol. Res. 32, 315–332. doi:10.2166/nh.2001.0018
Kim, H., Cosh, M. H., Bindlish, R., and Lakshmi, V. (2020). Field evaluation of portable soil water content sensors in a sandy loam. Vadose Zone J. 19, e20033. doi:10.1002/vzj2.20033
Kukal, M. S., Irmak, S., and Sharma, K. (2020). Development and application of a performance and operational feasibility guide to facilitate adoption of soil moisture sensors. Sustainability 12, 321. doi:10.3390/su12010321
Li, B., Wang, C., Gu, X., Zhou, X., Ma, M., Li, L., et al. (2022). Accuracy calibration and evaluation of capacitance-based soil moisture sensors for a variety of soil properties. Agric. Water Manag. 273, 107913. doi:10.1016/j.agwat.2022.107913
Mane, S., Das, N., Singh, G., Cosh, M., and Dong, Y. (2024). Advancements in dielectric soil moisture sensor calibration: a comprehensive review of methods and techniques. Comput. Electron. Agric. 218, 108686. doi:10.1016/j.compag.2024.108686
Mane, S., Mane, M., Kadam, U., and Patil, S. (2019). Design and development of cost effective real time soil moisture based automatic irrigation system with GSM 2395–0056.
Mane, S. S., and Kadam, U. S. (2021). Performance evaluation of automatic irrigation system under three different depths of placement of sensor. Int. J. Curr. Microbiol. Appl. Sci. 10, 170–181. doi:10.20546/ijcmas.2021.1007.020
Maraveas, C., Piromalis, D., Arvanitis, K. G., Bartzanas, T., and Loukatos, D. (2022). Applications of IoT for optimized greenhouse environment and resources management. Comput. Electron. Agric. 198, 106993. doi:10.1016/j.compag.2022.106993
Mwale, S. S., Azam-Ali, S. N., and Sparkes, D. L. (2005). Can the PR1 capacitance probe replace the neutron probe for routine soil-water measurement? Soil Use Manag. 21, 340–347. doi:10.1111/j.1475-2743.2005.tb00408.x
Nagahage, E. A. A. D., Nagahage, I. S. P., and Fujino, T. (2019). Calibration and validation of a low-cost capacitive moisture sensor to integrate the automated soil moisture monitoring system. Agriculture 9, 141. doi:10.3390/agriculture9070141
Nagare, R. M., Schincariol, R. A., Quinton, W. L., and Hayashi, M. (2011). Laboratory calibration of time domain reflectometry to determine moisture content in undisturbed peat samples. Eur. J. Soil Sci. 62, 505–515. doi:10.1111/j.1365-2389.2011.01351.x
Ochsner, T. E., Cosh, M. H., Cuenca, R. H., Dorigo, W. A., Draper, C. S., Hagimoto, Y., et al. (2013). State of the art in large-scale soil moisture monitoring. Soil Sci. Soc. Am. J. 77, 1888–1919. doi:10.2136/sssaj2013.03.0093
Park, C.-H., Montzka, C., Jagdhuber, T., Jonard, F., De Lannoy, G., Hong, J., et al. (2019). A dielectric mixing model accounting for soil organic matter. Vadose Zone J. 18, 190036. doi:10.2136/vzj2019.04.0036
Parvin, N., and Degré, A. (2016). Soil-specific calibration of capacitance sensors considering clay content and bulk density. Soil Res. 54, 111. doi:10.1071/SR15036
Paul, J. D., and Buytaert, W. (2018). “Chapter one - citizen science and low-cost sensors for integrated water resources management,” in Advances in chemical pollution, environmental management and protection, advanced tools for integrated water Resources management. Editors J. Friesen,, and L. Rodríguez-Sinobas (Lausanne, Switzerland: Elsevier), 1–33. doi:10.1016/bs.apmp.2018.07.001
Pramanik, M., Khanna, M., Singh, M., Singh, D. K., Sudhishri, S., Bhatia, A., et al. (2022). Automation of soil moisture sensor-based basin irrigation system. Smart Agric. Technol. 2, 100032. doi:10.1016/j.atech.2021.100032
Robinson, D. A., Campbell, C. S., Hopmans, J. W., Hornbuckle, B. K., Jones, S. B., Knight, R., et al. (2008). Soil moisture measurement for ecological and hydrological watershed-scale observatories: a review. Vadose Zone J. 7, 358–389. doi:10.2136/vzj2007.0143
Rowlandson, T. L., Berg, A. A., Bullock, P. R., Ojo, E. R., McNairn, H., Wiseman, G., et al. (2013). Evaluation of several calibration procedures for a portable soil moisture sensor. J. Hydrol. 498, 335–344. doi:10.1016/j.jhydrol.2013.05.021
Schwamback, D., Persson, M., Berndtsson, R., Bertotto, L. E., Kobayashi, A. N. A., and Wendland, E. C. (2023). Automated low-cost soil moisture sensors: trade-off between cost and accuracy. Sensors 23, 2451. doi:10.3390/s23052451
Seo, K.-W., Ryu, D., Jeon, T., Youm, K., Kim, J.-S., Oh, E. H., et al. (2025). Abrupt sea level rise and Earth’s gradual pole shift reveal permanent hydrological regime changes in the 21st century. Science 387, 1408–1413. doi:10.1126/science.adq6529
Seyfried, M. S., Grant, L. E., Du, E., and Humes, K. (2005). Dielectric loss and calibration of the Hydra probe soil water sensor. Vadose Zone J. 4, 1070–1079. doi:10.2136/vzj2004.0148
Singh, G., and Das, N. N. (2022). A data-driven approach using the remotely sensed soil moisture product to identify water-demand in agricultural regions. Sci. Total Environ. 837, 155893. doi:10.1016/j.scitotenv.2022.155893
Singh, G., Panda, R. K., and Bisht, D. S. (2021). Improved generalized calibration of an impedance probe for soil moisture measurement at regional scale using bayesian neural network and soil physical properties. J. Hydrol. Eng. 26, 04020068. doi:10.1061/(ASCE)HE.1943-5584.0002037
Singh, G., Panda, R. K., and Mohanty, B. P. (2019). Spatiotemporal analysis of soil moisture and optimal sampling design for regional-scale soil moisture estimation in a tropical watershed of India. Water Resour. Res. 55, 2057–2078. doi:10.1029/2018WR024044
Skierucha, W., and Wilczek, A. (2010). A FDR sensor for measuring complex soil dielectric permittivity in the 10–500 MHz frequency range. Sensors 10, 3314–3329. doi:10.3390/s100403314
Songara, J. C., and Patel, J. N. (2022). Calibration and comparison of various sensors for soil moisture measurement. Measurement 197, 111301. doi:10.1016/j.measurement.2022.111301
Spelman, D., Kinzli, K., and Kunberger, T. (2013). Calibration of the 10HS soil moisture sensor for southwest Florida agricultural soils. J. Irrig. Drain. Eng. 139, 965–971. doi:10.1061/(ASCE)IR.1943-4774.0000647
Sunil Kumar, S., Aithal, G., and Venkatramana Bhat, P. (2021). “Design, calibration, and experimental study of low-cost resistivity-based soil moisture sensor for detecting moisture at different depths of a soil,” in Advances in artificial intelligence and data engineering. Editors N. N. Chiplunkar,, and T. Fukao (Singapore: Springer Nature), 1383–1397. doi:10.1007/978-981-15-3514-7_104
Susha, L., Shojaei Baghini, M., Singh, D. N., and Shojaei Baghini, M. (2014). A critical review of soil moisture measurement. Measurement 54, 92–105. doi:10.1016/j.measurement.2014.04.007
Szypłowska, A., Lewandowski, A., Yagihara, S., Saito, H., Furuhata, K., Szerement, J., et al. (2021). Dielectric models for moisture determination of soils with variable organic matter content. Geoderma 401, 115288. doi:10.1016/j.geoderma.2021.115288
Tehrani, A., Ziaei, A. N., and Naghedifar, S. M. (2023). Irrigation scheduling of walnut seedlings using HYDRUS-1D and taguchi optimization approach. J. Irrig. Drain. Eng. 149, 04022045. doi:10.1061/(ASCE)IR.1943-4774.0001735
Ullo, S. L., and Sinha, G. R. (2020). Advances in smart environment monitoring systems using IoT and sensors. Sensors 20, 3113. doi:10.3390/s20113113
Vaz, C. M. P., Jones, S., Meding, M., and Tuller, M. (2013). Evaluation of standard calibration functions for eight electromagnetic soil moisture sensors. Vadose Zone J. 12, 1–16. doi:10.2136/vzj2012.0160
Web Soil Survey (2022). U.S. Department of Agriculture, Natural Resources Conservation Service Washington, DC. Available online at https://websoilsurvey.sc.egov.usda.gov/App/HomePage.htm. Accessed June 2022.
Yao, L., Leng, G., Yu, L., Li, H., Tang, Q., Python, A., et al. (2025). Emergent constraints on global soil moisture projections under climate change. Commun. Earth Environ. 6, 39–48. doi:10.1038/s43247-025-02024-7
Keywords: citizen science, handheld device, low-cost sensor, soil moisture, sensor calibration
Citation: Mane S, Singh G, Das NN, Kanungo A, Nagpal N, Cosh M and Dong Y (2025) Development of low-cost handheld soil moisture sensor for farmers and citizen scientists. Front. Environ. Sci. 13:1590662. doi: 10.3389/fenvs.2025.1590662
Received: 10 March 2025; Accepted: 08 May 2025;
Published: 23 May 2025.
Edited by:
Shaomin Liu, Beijing Normal University, ChinaReviewed by:
Ji Zhou, University of Electronic Science and Technology of China, ChinaMinghu Zhang, Lanzhou University of Technology, China
Copyright © 2025 Mane, Singh, Das, Kanungo, Nagpal, Cosh and Dong. This is an open-access article distributed under the terms of the Creative Commons Attribution License (CC BY). The use, distribution or reproduction in other forums is permitted, provided the original author(s) and the copyright owner(s) are credited and that the original publication in this journal is cited, in accordance with accepted academic practice. No use, distribution or reproduction is permitted which does not comply with these terms.
*Correspondence: Narendra N. Das, ZGFzbmFyZW5AbXN1LmVkdQ==