 Yu Li
Yu Li Ruifan Li2
- 1Guangdong-Hong Kong-Macao Greater Bay Area Environmental Technology Research Center, Shenzhen Research Institute of Nankai University, Shenzhen, China
- 2College of Environmental Science and Engineering, Nankai University, Tianjin, China
- 3Department of Water Resources Engineering, Lund University, Lund, Sweden
Urbanization in coastal megacities leads to trade-offs between development and ecology, degrading carbon sinks and disrupting spatial-functional balance. Current models often fail to integrate land use, carbon dynamics, and ecological zoning. This study created a system that brings together Patch-generating Land Use Simulation (PLUS), Integrated Valuation of Ecosystem Services and Trade-offs (InVEST), and Production-Living-Ecological Space (PLES) to examine how urban growth affects carbon storage and ecological balance in Shenzhen, China. Using GlobeLand30 datasets (2000–2020), land use was simulated under ecological priority scenarios until 2030. Findings revealed that a 50.15% expansion of built-up areas caused a 7.9% decline in carbon stock, with coastal areas hit hardest. Production-Living-Ecological Space coordination improved slightly, but urban areas showed imbalances. A zoning scheme identified 40% built-up land as the threshold for carbon collapse, and the 2010 ecological control line policy reduced carbon loss by 41%. This study offers a replicable model for balancing urban development with ecological resilience.
1 Introduction
Land use is a critical driver of land cover change, which in turn influences global climate dynamics through human activities such as urban development and land reclamation (An et al., 2020). Over recent decades, international scientific programs like the Land Use/Cover Change (LUCC) initiative have called for dynamic monitoring of LUCC through advanced remote sensing techniques, modeling frameworks, and an in-depth understanding of the ecological consequences of land use modifications (Feng et al., 2023a; Chang et al., 2022; Feng et al., 2023b). Early models, such as the “bookkeeping” model, played a pioneering role in assessing carbon stocks and sequestration potential across ecosystems. This model was instrumental in quantifying carbon emissions from LUCC, particularly in regions like the United States, where Houghton et al. examined the impacts of human activities on the carbon cycle (Houghton et al., 1999). Such models have since been applied globally, including in China, reinforcing their significance in ecological research and policy formulation (Houghton and Hackler, 2003). The enhancement of LUCC technologies, particularly through the integration of remote sensing data and advanced modeling approaches like Markov-CA and Support Vector Machines, has significantly improved the accuracy and predictive capabilities for monitoring and forecasting land-use and land-cover changes across diverse landscapes (Halmy et al., 2015; Ul Din and Mak, 2021; Rogan and Chen, 2004). These advancements enable more precise mapping, spatial analysis, and scenario projections, aiding in sustainable land-use planning and environmental management.
The Integrated Valuation of Ecosystem Services and Trade-offs (InVEST) model is a spatially explicit tool that supports decision-making by quantifying and mapping ecosystem services across different land-use scenarios. Its modular design enables the assessment of various services, including carbon storage, habitat quality, and water yield. The Carbon module, commonly used in coastal and urban studies, calculates carbon stocks by integrating land-use/land-cover data (Jiang et al., 2023; Shi et al., 2021; Zeng et al., 2022). For example, Li et al. used InVEST to assess carbon stocks in coastal ecosystems of Liaoning Province from 1995 to 2018, revealing the detrimental effects of urbanization and land use changes on carbon storage (Li P. et al., 2023). Similarly, studies by Piyathilake et al. highlighted the high carbon sequestration capacity of natural forests in Sri Lanka’s Uva Province using InVEST (Piyathilake et al., 2022). These models underscore the importance of accurately quantifying LUCC and carbon cycles, providing vital insights for effective climate change mitigation strategies.
Recent advancements have seen a shift from traditional models to more dynamic and multi-dimensional approaches, particularly with Place-Based Land and Ecological Space (PLES) research. Unlike static models, PLES focuses on understanding the complex, dynamic interactions between land use and ecological functions under different climate change scenarios. This approach has been significantly enhanced by machine learning algorithms and high-resolution remote sensing technology, which improve classification accuracy and allow for a more nuanced understanding of the impacts of urbanization on ecosystems (Fu et al., 2022a). Despite these advancements, challenges remain. First, traditional PLES zoning fails to account for mixed land uses in urban transition zones, leading to unclear functional delineations (Li Y. et al., 2023). Second, many models neglect vertical carbon interactions, especially in coastal areas where interactions between the atmosphere, soil, and vegetation are critical for carbon sequestration (Chen et al., 2019). Finally, the discrepancy between top-down ecological redline policies and local land use practices continues to pose governance challenges (Williams et al., 2021).
To address these issues, recent research has begun exploring three-dimensional PLES mapping, integrating LiDAR data for vertical quantification, and developing adaptive governance frameworks that reconcile ecological capacity with urban development needs (Quintana Vigiola, 2022; Wickham et al., 2022). These innovative approaches advocate for integrated modeling frameworks that combine land use simulations with ecosystem service assessments across multiple spatial scales. This shift towards multi-method integration aligns with emerging research that advocates for adaptive management strategies, balancing ecological sustainability with socioeconomic development (Wang Z. et al., 2021; Zhu et al., 2021; Wang et al., 2022; Fu et al., 2022b).
The Patch-generating Land Use Simulation (PLUS) framework, for instance, incorporates feedback loops from stakeholders involved in land use decisions, thus enhancing urban planning processes (Van de Ven et al., 2016). When combined with models like InVEST, which assesses carbon sequestration, this integrated approach provides a more holistic understanding of land use dynamics and their effects on carbon cycles (Babbar et al., 2021; Wang et al., 2025; Zhu X. et al., 2024). By leveraging both spatial and temporal models, the integration of PLUS, InVEST, and PLES frameworks is essential for developing adaptive policies that balance urbanization with ecological preservation, fostering sustainable growth.
Urbanization inevitably leads to trade-offs between development and ecological conservation, especially in the context of carbon storage. These trade-offs primarily involve the allocation of land for various uses—such as agriculture, housing, and natural spaces—along with the associated effects on carbon stocks and ecosystem services. The Production-PLES framework, which categorizes land into production, living, and ecological spaces, can help pinpoint the critical thresholds where urbanization and other forms of land use might disrupt ecosystem functions. For example, deforestation depletes biomass carbon, urbanization mineralizes soil organic carbon, and intensive agriculture reduces carbon sequestration potential in subsurface soils. By incorporating these frameworks into policy decisions, urban growth can be steered toward more sustainable paths that mitigate adverse environmental impacts.
This study aims to develop an integrated PLUS-InVEST-PLES framework to better understand the urbanization-ecology trade-offs in Shenzhen, China which is a rapidly urbanizing coastal city. Shenzhen’s rapid transformation, from a fishing village to a global tech hub, presents a unique case for studying the dynamics between urban expansion and ecological preservation. The city’s built-up area has expanded by more than 50% from 2000 to 2020, and land reclamation has significantly altered its coastal ecosystems, reducing carbon storage by 7.9%. However, policies like the 2010 Ecological Control Line, which protected 50% of the land, have successfully reduced carbon loss by 41%. This study leverages high-resolution datasets and transparent urban planning frameworks to explore the thresholds at which urban expansion leads to nonlinear reductions in carbon storage, providing actionable solutions for similar cities.
Incorporating advanced methodologies into this integrated framework such as entropy-weighted spatial diagnostics and threshold-based governance. This research moves beyond reactive strategies and proposes a more proactive approach to urban and ecological planning. It offers a comprehensive toolkit for cities seeking to balance growth, carbon resilience, and equity in the face of rapid urbanization and climate change challenges.
2 Methodology and study area
This study proposed a multi-perspective approach and a PLUS-InVEST-PLES model to provide effective information for the relevant planning departments in the city (Figure 1). Section 2.1 introduced the basic situation of the study area, Shenzhen, and explained the reasons for selecting Shenzhen as a case for land use analysis. Section 2.2 employed the PLUS model to explore the driving forces behind land use change in Shenzhen. Twelve types of natural, social, and economic data were selected to analyze the magnitude of these driving forces. It also simulated the potential changes that various policy scenarios could bring to the future land patterns of the city. Section 2.3 used the InVEST model to look at how carbon stocks are spread out in different areas of Shenzhen based on different land use plans over time, and it also analyzed how these areas are related to each other. Section 2.4 looked at how land PLES functions work together in each district of Shenzhen using a model to see if the development patterns in those districts were working well together and to point out any imbalances in their growth. Section 2.5 introduced a land zoning scheme categorized into three functional areas based on the analysis of land driving forces, carbon storage, and PLES functions. These areas were the Environmental Quality Improvement Zone, the Central Ecological Restoration Reserve, and the Coastal Zone Development Area.
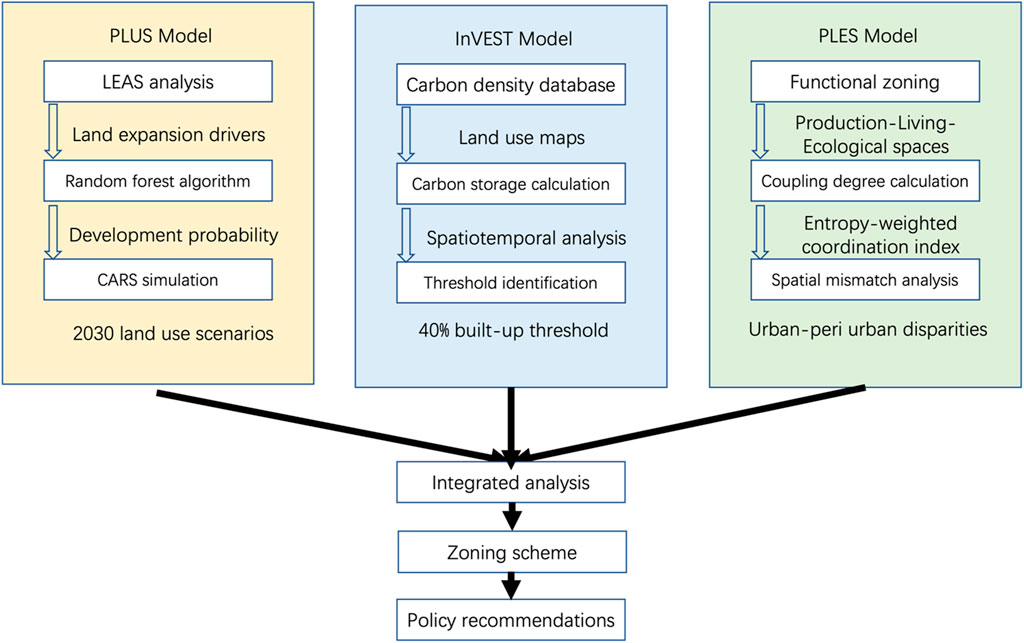
Figure 1. Technical route map.
2.1 Study region
Situated in southern China, Shenzhen City boasts a coastal locale characterized by a temperate climate, ample precipitation, and extended daylight hours (shown in Figure 2). The northern expanse encompasses a hilly river valley, while the western zone comprises a hilly plain landform shaped by the Longgang River and the Pingshan River carving through low hills to form valleys. The southeastern tract features a coastal mountain range and peninsular landform, with a significant distribution of low mountains and high hills. Since becoming China’s first Special Economic Zone in 1980, Shenzhen’s population surged from 30,000 in 1979 to over 17.6 million in 2023, transforming into a global tech hub with a GDP exceeding $475 billion. The rapid urbanization has led to a 50.15% expansion of built-up areas (2000–2020), consuming 80% of its natural coastline through land reclamation and displacing 40% of mangrove wetlands. The city’s growth has resulted in significant environmental pressures, including intensified land use, coastal squeeze due to marine ecosystem reclamation, and pollution that affects both air and water quality. Ecologically, Shenzhen faces biodiversity loss, the urban heat island effect, and soil degradation. Shenzhen’s experience with urbanization, infrastructure expansion, and environmental challenges offers valuable lessons for other rapidly growing cities, with its proactive approach to sustainable development, green initiatives, and smart city solutions serving as a model for addressing the complex environmental and social implications of rapid urban growth (Li et al., 2024; Yu et al., 2025).
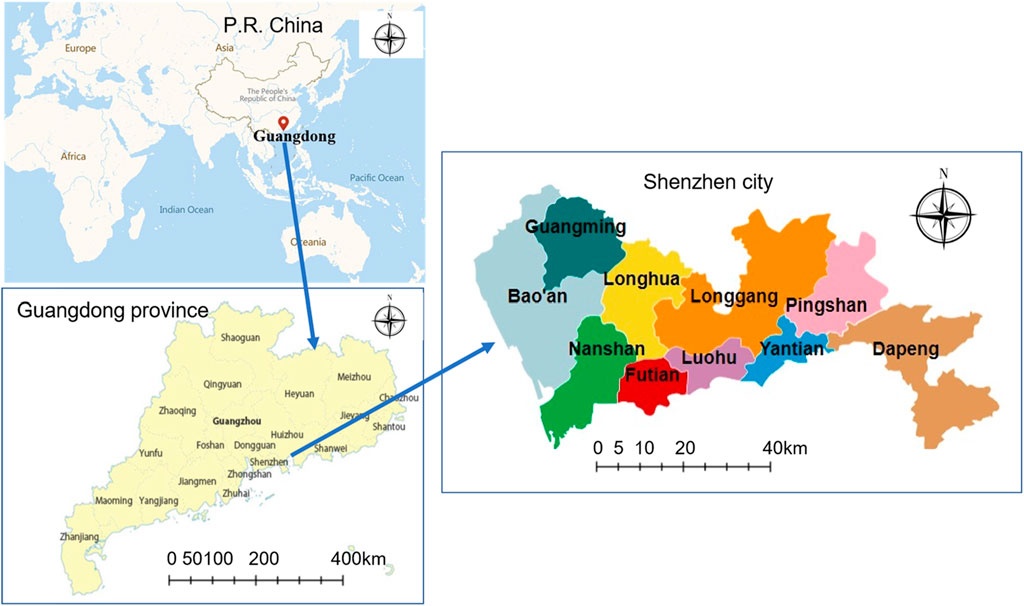
Figure 2. The boundary of Shenzhen City and its location in Guangdong Province, China.
2.2 LUCC data processing
2.2.1 Analysis of dynamic change characteristics of LUCC
In this study, GlobeLand 30 was used to analyze the dynamic change characteristics of land use and land cover change (LUCC). GlobeLand 30 is the world’s first global land cover data product with a resolution of 30 m, developed under the leadership of the National Geomatics Center of China (Chen et al., 2017; Jokar Arsanjani, 2019). The dataset categorizes land cover into 10 types: cultivated land, forest, grassland, shrubland, wetland, water bodies, tundra, artificial surfaces, bare land, glaciers, and permanent snow. The primary data sources for this dataset include multispectral images from Landsat, ETM+, and HJ-1. The data extraction was carried out using the “Pixel-Object-Knowledge” (POK) approach, which processes each type at a hierarchical level, resulting in a total of 853 global sub-images. The data producers utilized a two-stage sampling verification model to reasonably distribute samples globally, and research indicates that the overall accuracy of GlobeLand 30-2010 exceeds 80% (Chen et al., 2015).
The investigation looks into these areas by studying the size of changes between the early and later stages of Land Use and Land Cover Change (LUCC) data, along with analyzing the relationships of these changes over time (Ustaoglu and Aydinoglu, 2019; Mazy and Longaretti, 2022). This analytical approach serves to assess the developmental trajectory of diverse land types within the region and elucidate the impact of human activities on land utilization using Formula 1 (Brown et al., 2004; Bai and Xue, 2020).
Where LDa represents the regional land use degree data for the year “a,” i denotes the ith land type, and Ci signifies the classification index corresponding to the ith land use type, with this study adopting reclassified index values. The reclassified index values are as follows: cultivated land (1), forest land (2), grassland (3), shrub land (4), water body (5), artificial surface land (6), and bare land (7); Li denotes the percentage of land type i within the entire land area (Tang et al., 2016). In this context, the value of n is established as 7.
2.2.2 Land use transfer matrix
Considering the limitations of using expansion and reduction of land types alone to reflect real changes and transformations in land use (Briassoulis, 2000), it is necessary to employ a transfer matrix that can not only capture the change patterns of different land types but also reveal the mutual transformation relationships between various types. In this study, ArcGIS 10.8 was used to spatially overlay land use maps from two periods (2000–2010 and 2010–2020) at a 30 m resolution. The transfer matrix is denoted as Formula 2:
Here, LTij represents the area converted from the ith land use type to the jth type in the initial and final periods. The value of n corresponds to the total number of land use types, and in this study, n is determined to be 7. Transitions were mapped at the grid level using the Tabulate Area tool in ArcGIS, generating spatially explicit transition maps. This revealed localized patterns, such as coastal reclamation (water → artificial earth surface) and afforestation (grassland → forest). Matrix outputs were cross-referenced with zoning policies to assess compliance.
2.2.3 Patch-generating land use simulation model (PLUS)
The PLUS model is a grid-based simulation tool that allows for the analysis of land use change by generating patches. This approach enables the identification of underlying drivers of land use change and facilitates the simulation of changes at the patch level (Ding et al., 2024). The model consists of two modules: Land Expansion Analysis System (LEAS) and Contour Auto-generation and Random Seed (CARS). LEAS can identify the expansion of different land types and the changes between them, and it utilizes the random forest algorithm to determine the development probability of the various types and the contribution rate of driving factors (Zhang et al., 2022). CARS, on the other hand, integrates the random seed mechanism to set the development probability and automatically generate land contours (Caparros-Santiago et al., 2021).
2.2.3.1 Land expansion analysis system (LEAS)
The LEAS component of the PLUS model focuses on extracting the expansion part of different land types and analyzing changes between them. Multiple driving factors are used to sample growth samples of each land type and driving factor. After selecting the sampling points, LEAS simplifies the analysis process by focusing only on a single category of land and obtaining transition rules for all types, thus avoiding the need to analyze transition types with better interpretation. To gain a more comprehensive understanding of land types and the changes between them, three aspects were selected as indices for the study: land use, socio-economic data, and climate and environmental data (Liang et al., 2021). LEAS module input data and resolutions are provided in Table 1. The land use data for Shenzhen, including the classification data based on GlobeLand30, is sourced from the Ministry of Science and Technology of the PRC, the National Geomatics Center of China (NGCC), and various other entities. Many scholars have verified the reliability of this data in Chinese research. The overall classification accuracy of GlobeLand30 for the years 2000 and 2010 is above 80% (Cheng et al., 2022; Lu et al., 2016). When compared with 100 ground truth points from Shenzhen’s 2020 land survey data, GlobeLand30 achieved an accuracy of 82%, slightly higher than its global baseline of 80%, due to the complex urban-rural transitions in Shenzhen.
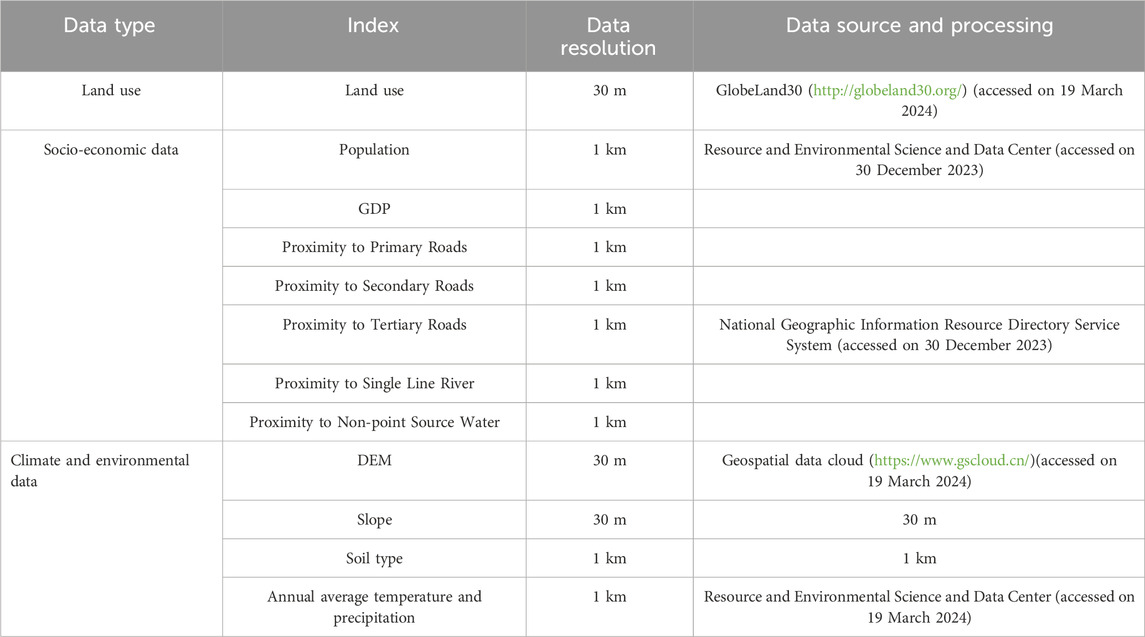
Table 1. LEAS module input data.
2.2.3.2 Contour auto-generation and random seed (CARS)
The CARS model incorporating a patch generation mechanism reliant on a variety of random land use seeds facilitates the simulation of diverse land use scenarios, thereby influencing regional land use dynamics through an adaptability factor, thereby enabling future land use prediction simulations. Although the Markov model proficiently captures temporal changes in LUCC, it inadequately represents spatial attributes and their distributions (Hussain et al., 2024). Thus, the integration of Markov and PLUS models enhances the precision of simulating and forecasting the spatial distribution of LUCC.
Markov is a statistical model used in random processes that helps predict the chances of events happening based on Markov process theory (Milz and Modi, 2021). In this model, the probability of state transition denotes the likelihood of an event transitioning from one state at the initial time to another state at the subsequent time when the random process evolves. Assuming n possible states in the random process, denoted as E1, E2, ⋯, En, and the probability of an event transitioning from the current state Ei to the next state Ej is recorded as Pij. The matrix representing the probabilities of mutual transitions among various states in the random process is termed the transition probability matrix P (Iacono et al., 2015) using Formula 3.
Here, n represents the number of land use types. Employing different states and transition probability matrices of the system, Markov facilitates quantitative prediction through the following expressions (Equations 4, 5):
where St and St+1 represent the system states at time t and t +1, respectively, forming row vectors denoting the statistical quantities of different land types. During the prediction process, the transition probability matrix Pij must remain constant. However, due to the Markov model’s lack of spatial elasticity, it is unsuitable for long-term predictions of future land use quantities. To mitigate substantial errors, this study restricts the calculation of land use structures to the subsequent 10 years.
2.3 Integrated valuation of ecosystem services and tradeoffs model (InVEST)
The model system under consideration serves the purpose of assessing the energy and financial value associated with ecosystem services and facilitating the formulation of ecological policies. Presently, it has gained widespread application in environmental management decision-making across various countries and regions, with its research scope encompassing land planning, natural compensation, and risk assessment (Li et al., 2021).
The InVEST model was implemented to quantify spatiotemporal changes in terrestrial carbon stocks using input datasets such as GlobeLand30 (2000–2020) at a 30 m resolution, harmonized into seven classes using ArcGIS Pro’s Reclassify tool. Coastal boundaries from Shenzhen’s 2020 Marine Functional Zoning Plan to exclude offshore carbon pools. Utilizing a map of land cover type alongside four distinct carbon pools, the model computes the carbon storage within the current landscape configuration or over a designated timeframe. Following the rules in the InVEST model Carbon module’s user manual, it does not include the carbon from sources that change too quickly in the aboveground carbon pool, like grasslands and short-cycle crops. The computation formula is expressed as follows (Equations 6, 7) (Hamel et al., 2024; Zhong and Wang, 2017):
The equation encapsulates the summation of four distinct carbon storage components, where “i” denotes the ith land use type. Ctotal is the total carbon storage in a specific area, which includes Ci-above, Ci-below, Ci-soil, and Ci-dead, each representing different types of carbon storage. Ci-above signifies the carbon content attributed to aboveground biomass, encompassing all plant constituents situated above the soil, such as bark, trunk, branches, and leaves. Ci-below represents the subterranean biomass value, inclusive of carbon storage within the living roots of vegetation. Ci-soil denotes the carbon storage confined within soil, typically comprising organic carbon of mineral soil, yet extending to encompass organic carbon as well. Lastly, Ci-dead encompasses deceased organic matter, encompassing litter, upturned, or deceased trees (Qiao et al., 2021).
The InVEST model is operated under the assumption that carbon density for each land cover type is fixed. Carbon stock is calculated by multiplying carbon density values by surface areas of vegetation types. However, significant variability in carbon density across locations has been indicated by research. This study is focused on the coastal urban areas of South China, particularly Guangdong Province. Findings from previous studies have been synthesized to better represent carbon density fluctuations in this region (Wang R. Y. et al., 2023; Tian et al., 2022; Pan and Wang, 2024). Through surveys in neighboring areas and a thorough analysis of regional characteristics, the model has been modified to ascertain differentiated carbon concentration values for various land uses. Shenzhen land use type carbon density database was shown in Table 2.
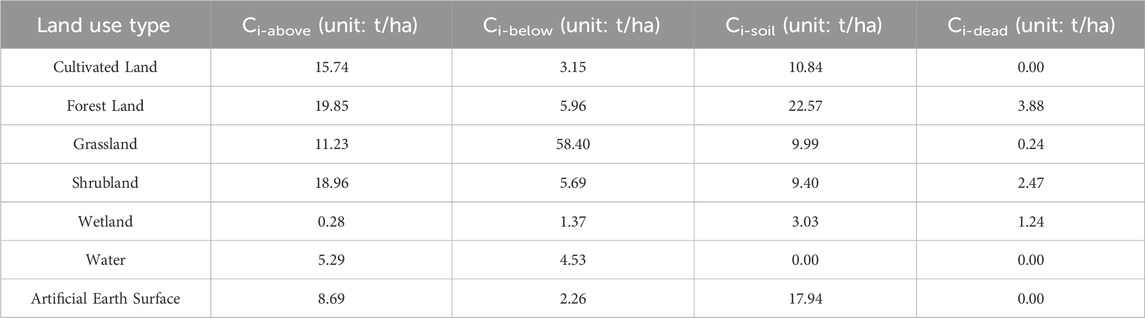
Table 2. Shenzhen land use type carbon density database.
Spatially explicit outputs at a 30 m resolution were generated annually, and changes were assessed through raster differencing for the periods 2000–2010, 2010–2020, and 2020–2030. Carbon loss was observed in areas transitioning from natural to artificial surfaces, while afforestation contributed to increased carbon storage. The results include georeferenced maps showing carbon storage, temporal change maps, and tabular summaries of total carbon stocks by district. To validate the model, carbon densities were calibrated using field measurements.
2.4 Coupling degree and coordination development degree model (coupling coordination model)
To protect ecosystems, we should start by understanding the value of ecosystem services (ESV), which includes the various benefits like providing resources, regulating conditions, and supporting life that an ecosystem gives because of its natural features and structure. This study uses the ESV evaluation framework to identify the main functions of different land types based on how they are primarily used, and it reclassifies land use into three areas: production, living, and ecological factors. Then, it creates a complete assessment index system called “production-living-ecology,” shown in Table 3 (Xue et al., 2024; Ou et al., 2021). Furthermore, the study introduces a model centered on coupling and coordination to scrutinize the status and trajectory of Place-Based Land and Ecological Space (PLES) functions in the city of Shenzhen.
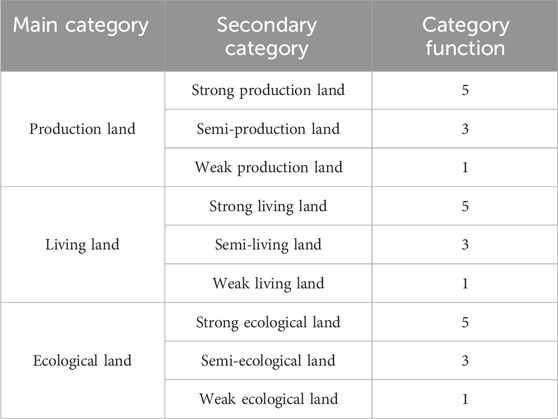
Table 3. Scoring index system of land use PLES function.
The degree of coupling reflects the extent of influence and interdependence among PLES functions. Higher coupling degrees signify intensified interactions among the three functions. Nonetheless, the concept of coupling alone fails to capture the level of harmonious collaboration between these functions. Therefore, the study introduced the coordinated development degree concept to measure the level of cooperation and beneficial interaction between the systems. The computational formula is derived as follows (Equations 8–11) (Fu et al., 2022b):
where Wi denotes the total score of PLES functions, n signifies the total number of grids, Si represents the area of each grid, Vi denotes the evaluation score of each category, C symbolizes the coupling degree of PLES functions. The magnitude of C reflects the strength of interaction and interplay between PLES functions in rural areas. P, R, and E represent the values of production function, living function, and ecological function, respectively. Additionally, D signifies the degree of coordinated development of PLES functions, while T denotes the overall evaluation index. Parameters α, β, and γ are undetermined coefficients, satisfying the condition α + β + γ = 1. Considering the paramount importance of ecological functions in fostering sustainability, α = 0.3, β = 0.3, and γ = 0.4. Moreover, guided by prior research findings, coupling degree and coordination degree are categorized accordingly (refer to Table 4) (Cui et al., 2022; Liu Q. et al., 2022).
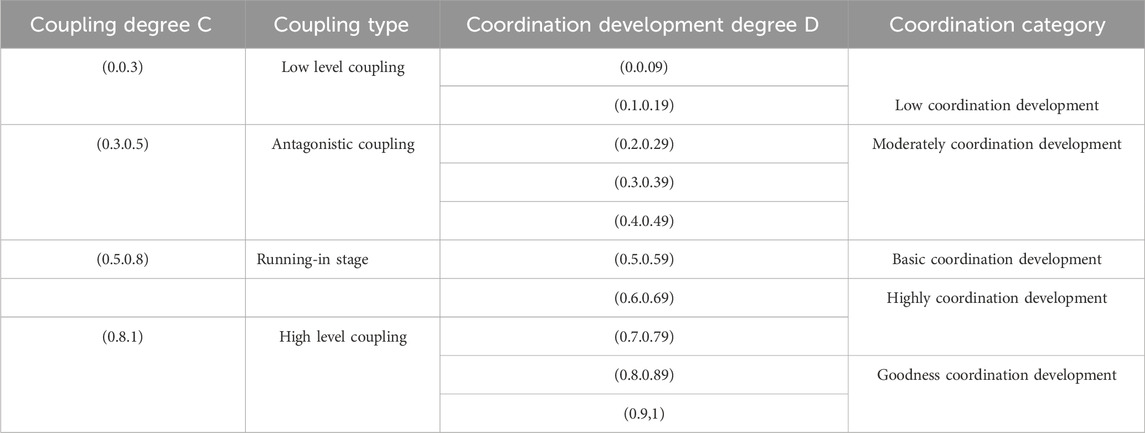
Table 4. Grading criteria for the coupling degree and coordination development degree of land use PLES function in Shenzhen.
2.5 The principles of urban sustainable land planning zoning
Combined with the analysis of land drivers, carbon storage and PLES functions, the land zoning program was divided into three functional zones including the Environmental Quality Improvement Zone, the Central Ecological Restoration Reserve, and the Coastal Zone Development Area. Zoning considered the carbon storage capacity of different areas and urban land use, prioritizing the protection of carbon sinks such as forests, wetlands, and grasslands to enhance the ecosystem’s ability to store carbon. Continuous monitoring of urban land use changes assessed their impacts on carbon storage and ecological functions, allowing for timely adjustments to zoning plans that accommodated urban development needs. Low-carbon development concepts were integrated into land zoning, promoting green buildings and the utilization of renewable energy sources to reduce the impact of urban expansion on carbon emissions. Active engagement in ecological restoration and reclamation occurred in areas where carbon storage had decreased due to urbanization, aiming to enhance the carbon storage capacity of these regions. A complete evaluation system was created that looks at carbon storage, changes in land use, and urban development, giving scientific information to help with land zoning decisions and making sure both ecological and economic benefits are maximized. By incorporating these factors into zoning principles, effective progress toward carbon reduction goals and sustainable urban development was achieved.
3 Results and analysis
3.1 Land use change and land trend prediction by PLUS model
3.1.1 Land use change and land transfer matrix in Shenzhen
By using satellite image interpretation and visual analysis of ArcGIS software, the overall land use type map of Shenzhen from 2000 to 2020 (Figure 3) was obtained, the land totals for each category were also given in Table 5. Findings indicate a significant increase in artificial surface area, totaling 320 km2, approximately 20% of Shenzhen’s total land area. By 2020, artificial surfaces comprised 50.15% of Shenzhen’s land, reaching 988 km2. The reclamation efforts were concentrated in Bao’an and Nanshan districts. Conversely, urban lakes and grasslands experienced substantial declines, with reductions of 56 and 74 km2, respectively. The water area saw a severe initial decline, stabilization occurred from 2010 to 2020, reflecting government focus on ecological protection.
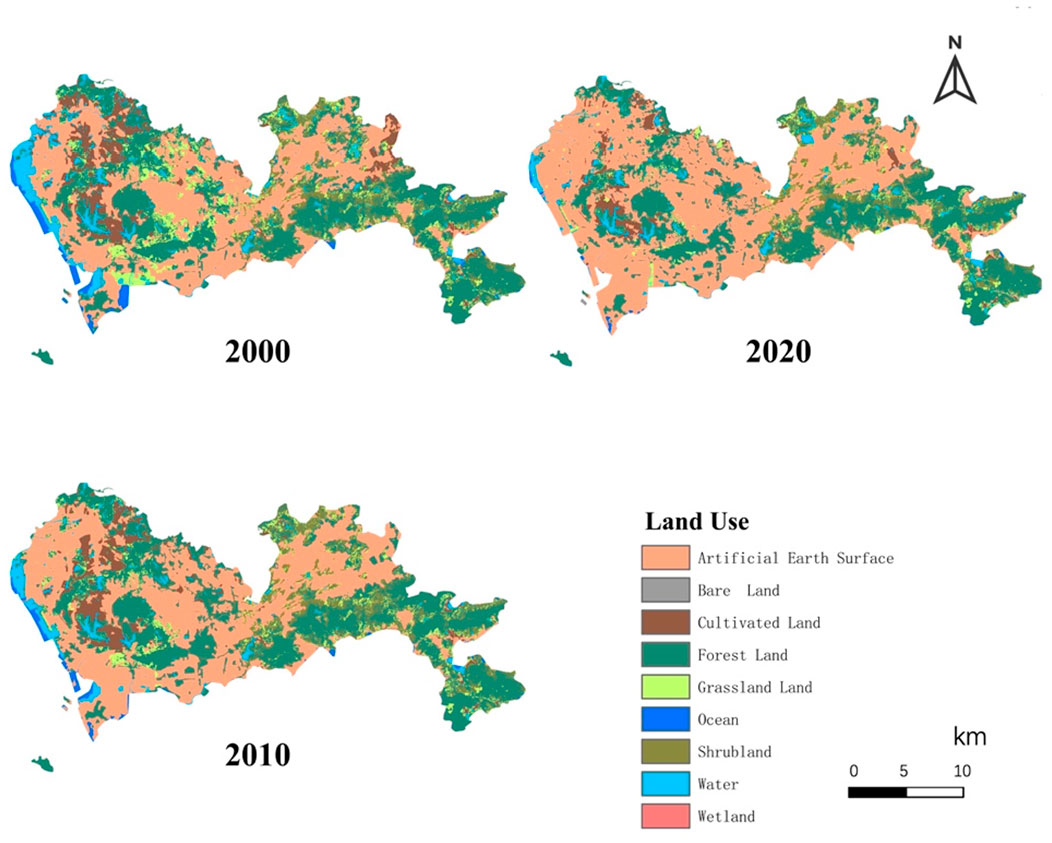
Figure 3. Land use types in Shenzhen from 2000 to 2020.
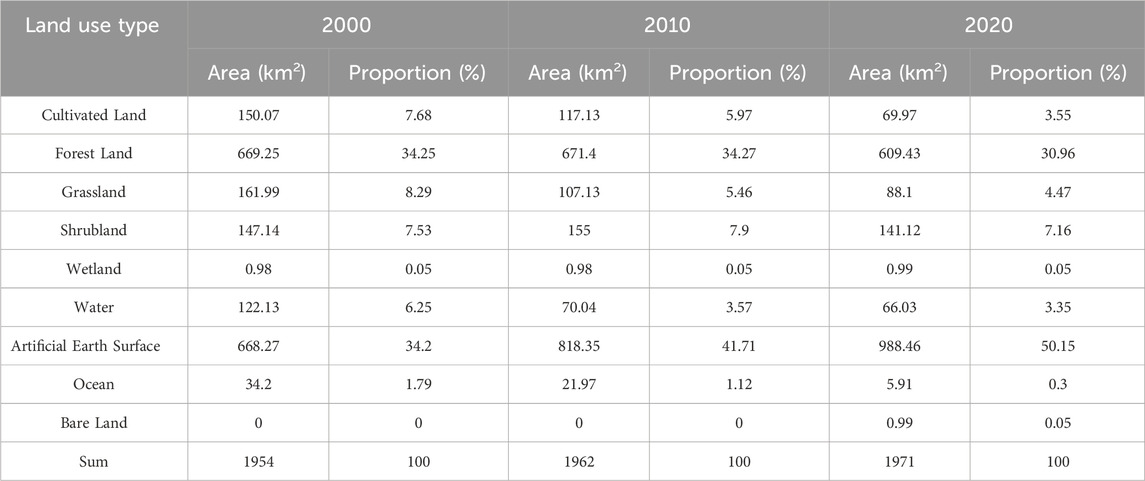
Table 5. Area and proportion of different land types in Shenzhen from 2000 to 2020.
The land use change characteristics (LUCC) of Shenzhen from 2000 to 2020 were analyzed using ArcGIS, resulting in the construction of land use transfer matrices (Figure 4). By 2010, satellite data indicated the disappearance of these wetland resources, although some restoration occurred by 2020, highlighting a policy lag where responses followed rather than preempted ecological issues. In 2022, the Shenzhen Bay Coastal Mangrove Wetland Restoration Project aimed to restore over 50 ha of mangrove wetlands, establishing a model for ecological restoration in Guangdong Province. Conversely, from 2010 to 2020, while water bodies underwent transformations among geomorphic types, their total area remained stable, reflecting the impact of ecological protection policies. Future land use scenarios should prioritize the protection of water bodies as restricted development areas to ensure sustainable management. Several noteworthy land use changes can be observed in different districts of Shenzhen. In Bao’an District and Guangming District, the cultivated land area underwent a significant decline. Similarly, in Pingshan District, cultivated land disappeared in 2010 but displayed partial recovery by 2020. This pattern aligns with the trend observed in water bodies. For instance, the water body in the northern part of Longgang District vanished in 2010 but reappeared in 2020. The forest land area exhibited a decrease across all regions of Shenzhen, albeit to varying extents. Notably, in 2020, grassland dominated the western part of the city, particularly in Longhua District and Nanshan District. Intriguingly, there has been an astonishing decline in grassland area over the past two decades. Conversely, the water area along the western coast experienced disappearance and subsequent occupation by artificial surface area. This suggests a potential conversion of water bodies into human-made structures.
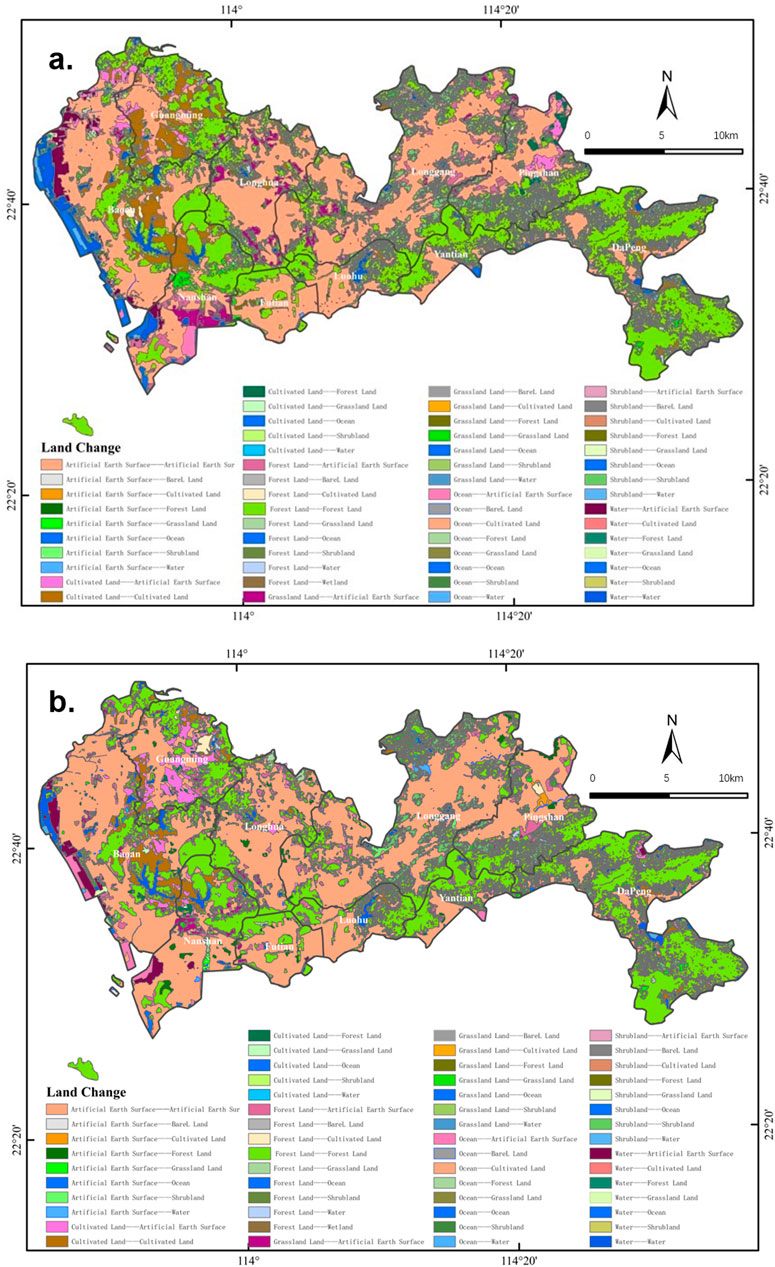
Figure 4. Land transfer changes in Shenzhen from 2000 to 2010 (a) and from 2010 to 2020 (b).
3.1.2 Analysis of land driving factors
The growth of seven land types in Shenzhen from 2010 to 2020 was analyzed using ArcGIS and the PLUS model LEAS plate, facilitating a comparison of their respective driving forces (Figure 5). The analysis indicates that cultivated land expansion in Shenzhen (2010–2020) was concentrated in the Bao’an, Guangming, and Pingshan districts. Key factors driving this increase include proximity to surface water, average annual precipitation, distance to primary roads, and GDP. Areas near non-point source lakes experienced significant growth in arable land, enhancing irrigation capabilities. Concurrently, approximately 46.67% of cultivated land was converted to construction and forest land, underscoring the need for strategic land re-planning in suburban areas.
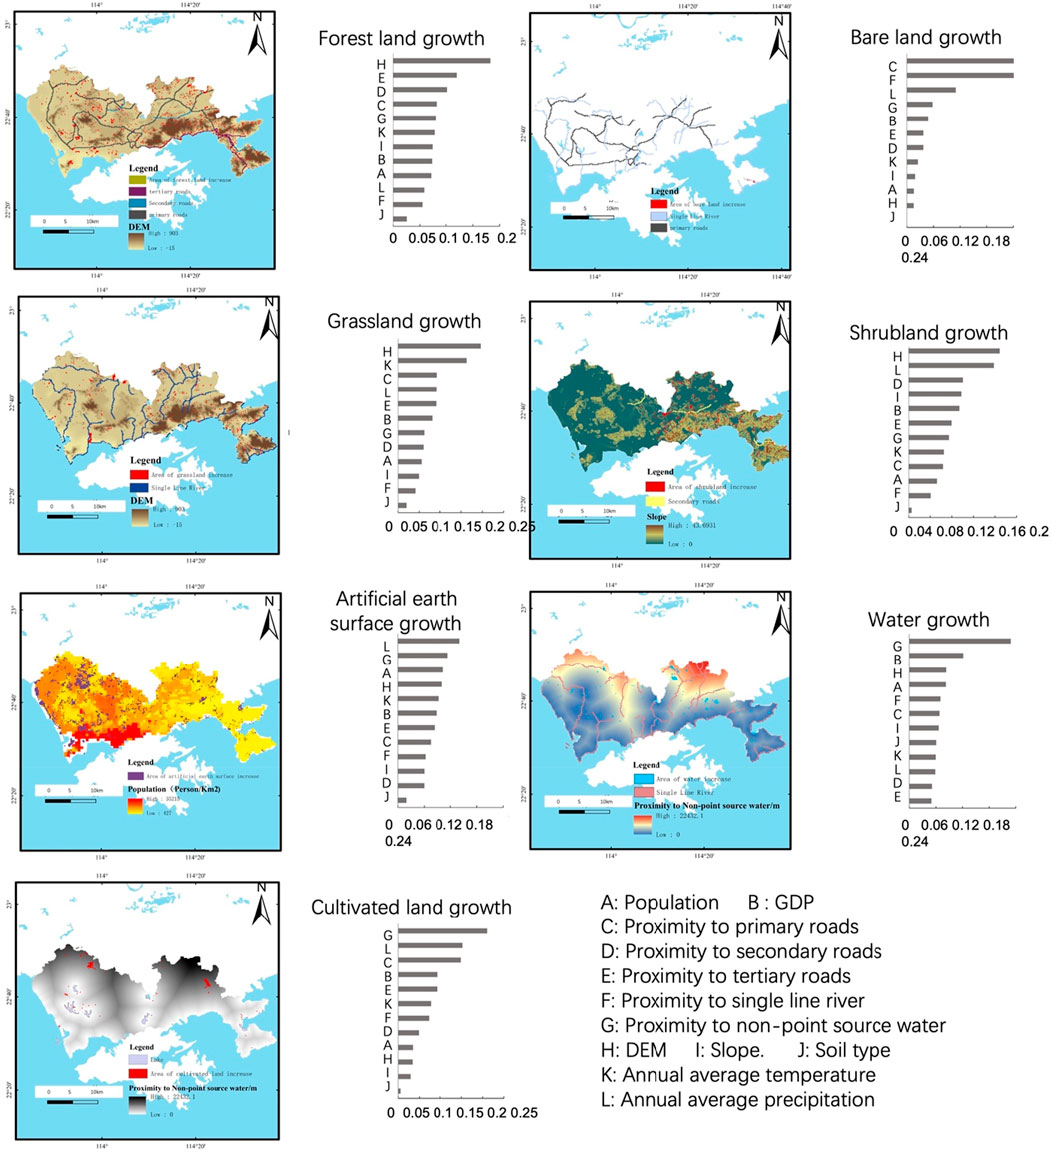
Figure 5. The size of influencing factors of various types of land driving forces from 2010 to 2020.
Data suggest a structured growth pattern for cultivated land, aligning with policies aimed at resource protection and sustainable development. The comparison of figures reveals extensive growth in forest and grassland, driven by the Digital Elevation Model (DEM). Urban development is concentrated in plains, while mountainous areas are reserved for tree cultivation, with forest expansion linked to road proximity and grassland growth associated with higher precipitation.
Post-development assessments are crucial to determine the ecological impact of land type conversion on water areas and ecosystem stability. Recent artificial surface developments are primarily along the western coast, particularly in Nanshan District. Future growth is anticipated in Bao’an District, though ongoing development poses ecological constraints, contributing to wetland resource decline and barren land emergence since 2000. As land development approaches 50%, available space for new projects is limited, with average precipitation influencing construction patterns, as shown in Figure 5.
3.1.3 Prediction of land use change in 2030
The expansion probabilities for various land use types are incorporated into the CARS module, along with spatial constraint data, to simulate strong ecological policy constraints related to water source protection. Three simulation parameters—land use demand, conversion matrix, and neighborhood weight—are calibrated to predict Shenzhen’s land use in 2030. The overall approach comprises two main components: data preparation and verification of simulation accuracy, followed by the establishment of future land use scenarios.
3.1.3.1 Data preparation and simulation accuracy verification
Random forest parameters were set with uniform sampling, a 0.01 sampling rate, 20 decision trees, and 12 training features (mTry). In the CARS simulation, a domain range of 3, a plaque generation decline threshold of 0.5, a diffusion coefficient of 0.1, and a random patch seed probability of 0.001 were used. The transfer matrix indicated conversion potential (1 for possible, 0 for restricted) between land classes, particularly for artificial surfaces and water bodies (Table 6). The classifications from Type 1 to Type 7 represent the following land types: Type 1 was cultivated land, Type 2 was forest land, Type 3 was grassland, Type 4 was shrubland, Type 5 was wetland, Type 6 was water, and Type 7 was artificial earth surface. The domain weights presented in Table 7 were determined based on expert judgment, combining input from researchers, urban planners, policymakers, and aligning with Shenzhen’s development strategy and policy priorities. The weights represent Shenzhen’s policy focus on striking a balance between urban development and ecological preservation. Urban development is prioritized with a higher weight of 0.3 for artificial earth surface, while ecological conservation is reflected with a weight of 0.2 for forest and cultivated land. Grassland and shrubland are assigned a lower weight of 0.1, given their perceived minimal contribution to the coastal ecosystem in Shenzhen (Quattrone and Chen, 2023; Wang J. et al., 2021). The 0.3 weight for artificial earth surface aligns with Shenzhen’s status as a rapidly urbanizing megacity, where 50% of land was already built-up by 2020.
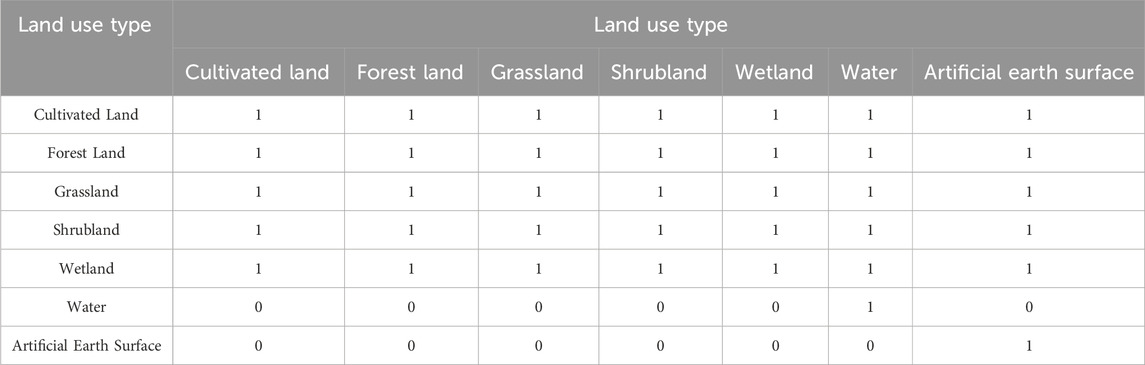
Table 6. Transition matrix.

Table 7. Domain weight.
For accuracy verification, 2010 land demand data and 12 driving factors were input, with a transfer matrix based on 2000–2010 Markov probabilities and domain weights reflecting land use changes. The simulation predicted 2020 land use, achieving 92% accuracy and a Kappa coefficient of 0.7123.
3.1.3.2 Future scenario modeling
Shenzhen emphasizes water basin protection (Liu et al., 2020; Jun et al., 2021). In this study, water area serves as a limiting factor for land use changes, with ArcGIS reclassification assigning 0 to water bodies (restricted) and one to other land uses for the 2030 simulation.
The 2030 simulation (Figure 6) indicates stable water body areas, suggesting effective policy implementation. However, artificial surfaces increased by 4.38%, while cultivated and forest lands decreased significantly. The analysis reveals slower land transfer trends, with the best protection for water and wetland areas. Despite ongoing construction land growth, the rate of change has decelerated, reflecting positive policy impacts. Nevertheless, significant conversion of green land to construction persists, underscoring the need for a comprehensive land use strategy that balances various land types for coordinated urban development.
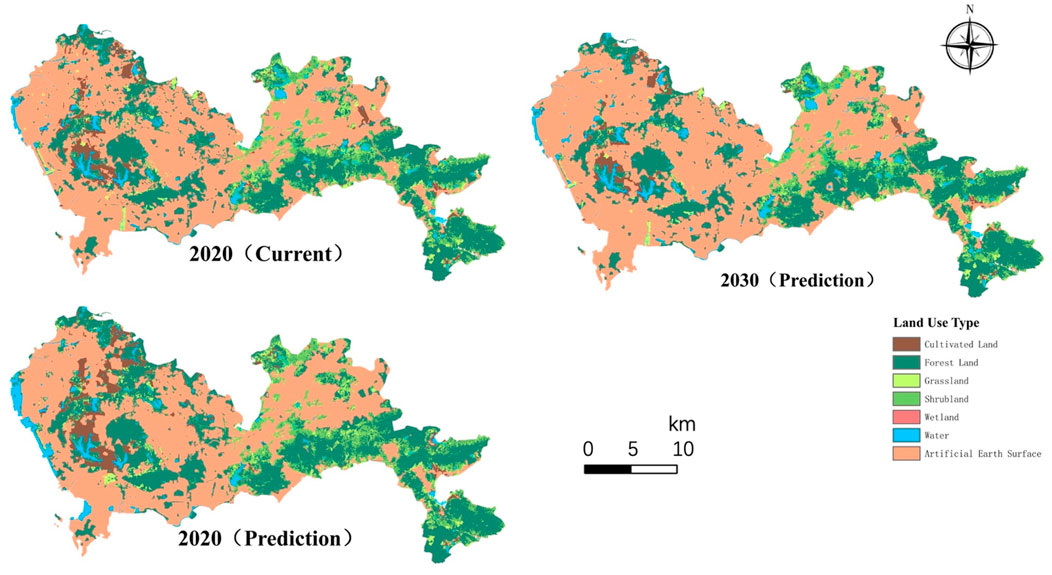
Figure 6. Comparison of land types in 2020, 2020 (Prediction) and 2030 (Prediction).
3.2 Spatial and temporal evolution of carbon storage based on InVEST model
The InVEST model is utilized to derive the spatial distribution of carbon storage across four temporal intervals (Figure 7). In Figure 7, “significant increase/decrease” in trends is determined by self-defined thresholds (change in carbon storage >10%). Over the period spanning from 2000 to 2030, Shenzhen’s carbon reserves exhibit a declining trajectory. Specifically, carbon reserves are recorded as 778.9 × 10⁴, 762.9 × 10⁴, 737.3 × 10⁴, and 717.4 × 10⁴ metric tons, respectively. Noteworthy reductions in carbon storage from 2000 to 2030 are predominantly concentrated in the central and western sectors of Shenzhen, notably in Nanshan District, Longhua District, and Longgang District. Conversely, regions witnessing significant increases in carbon reserves primarily encircle Bao’an District and Nanshan District, predominantly along the western coastline.
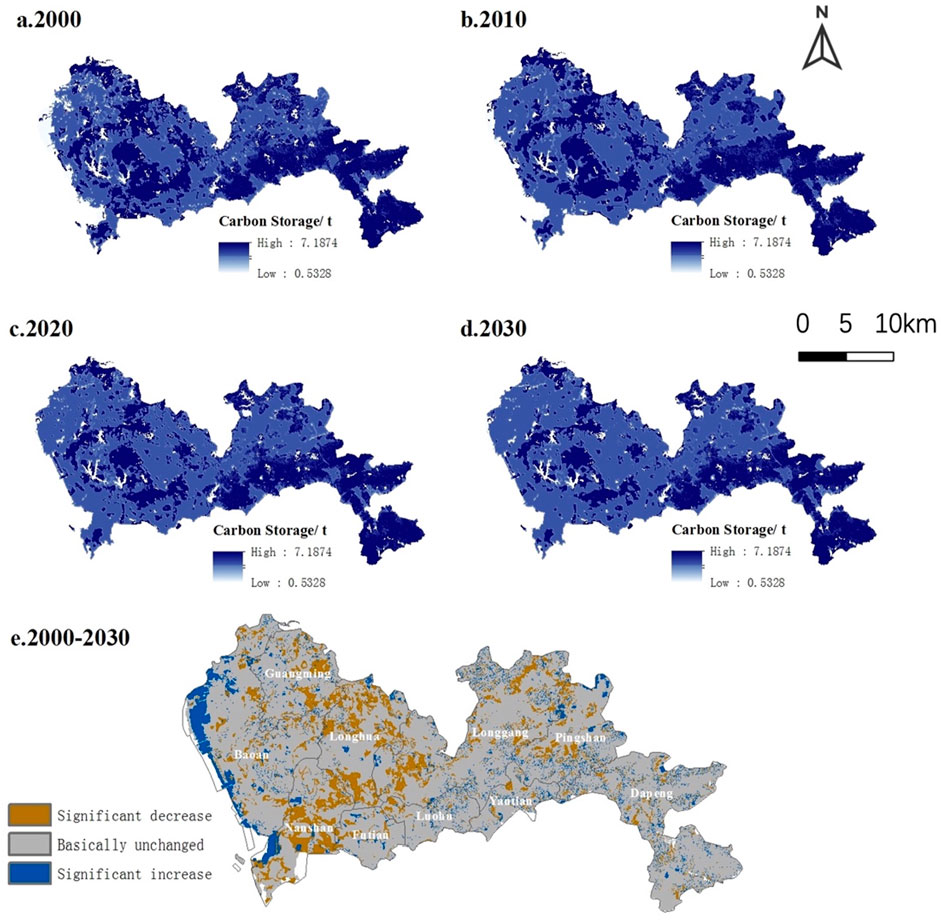
Figure 7. Comparison of carbon storage between 2000 and 2030 in Shenzhen. (a) 2000; (b) 2010; (c) 2020; (d) 2030; (e) 2000-2030.
The comprehensive distribution pattern of carbon reserves over the past 3 decades reveals discernible trends. Areas characterized by low carbon reserves are principally situated in Yantian District, Luohu District, and Futian District, positioned centrally within Shenzhen. Moderate carbon reserves are predominantly found in Nanshan District along the western shoreline, Longhua District centrally, and Pingshan District to the east. Conversely, high carbon reserves are chiefly concentrated in Bao’an District, situated at the westernmost extremity, along with Longgang District and Dapeng New District to the east, delineating a spatial pattern characterized by low in the middle, medium in the west, and high in the east.
However, a different perspective emerges when considering the ratio of carbon reserves to the respective area of each region (Table 8). This approach offers a more representative depiction of Shenzhen’s overall carbon reserve trajectory. Notably, carbon reserves demonstrate a decreasing trend from west to east, mirroring the broader land-use trend across Shenzhen, which exhibits an increasing propensity towards development in the western regions. This phenomenon is intricately linked to the economic prowess of Nanshan District and Bao’an District, the most developed areas within Shenzhen, situated in the western reaches.
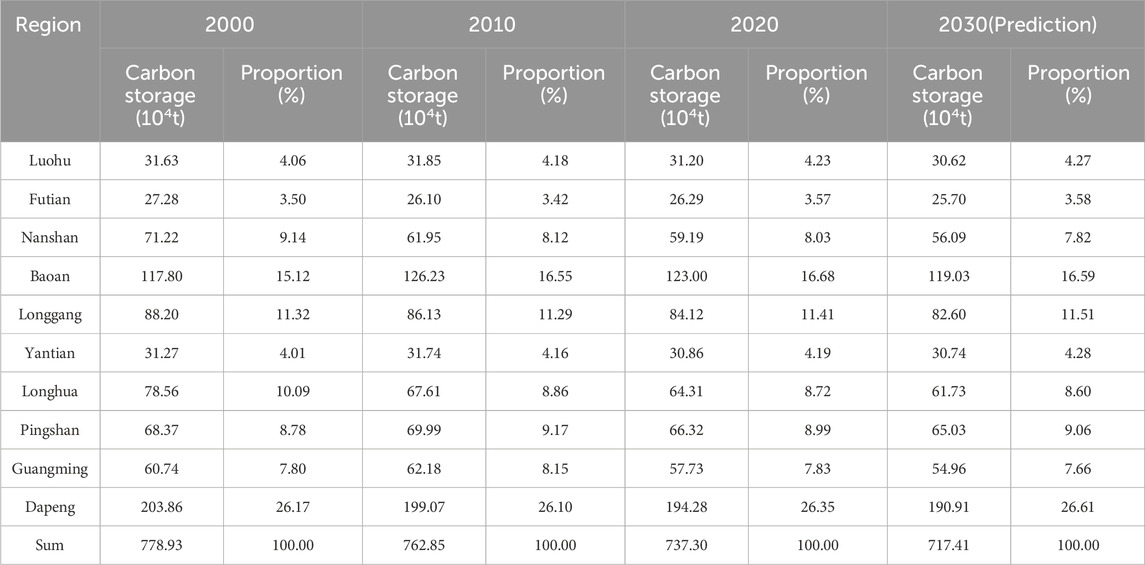
Table 8. Comparison of carbon storage in different regions of Shenzhen in different years.
From 2000 to 2010, rapid economic advancement in Nanshan and Longhua Districts led to significant reductions in carbon reserves, with a loss of 9.27 × 10⁴ t and 10.95 × 10⁴ t, respectively. In contrast, Bao’an District experienced an anomalous increase of 8.43 × 10⁴ t in carbon storage due to coastal reclamation that expanded land area. By 2010, forest land accounted for 45.16% of the total carbon storage, but its share declined to 40% by 2030 as urbanization intensified. From 2010 to 2020, all regions experienced carbon loss, ranging from 1 to 5 × 10⁴ t annually, though water protection policies helped slow the decline. Despite these measures, monthly reductions exceeding 50,000 t underscored the insufficiency of isolated conservation efforts.
The disparities in regional carbon storage were driven by several factors. In the western districts, including Nanshan and Bao’an, industrial expansion and coastal reclamation dominated pre-2010, with 80% of mangroves lost by 2010. Following 2010, weak enforcement of ecological redlines accelerated ecosystem fragmentation, resulting in carbon loss through soil mineralization and biomass depletion. On the other hand, the eastern districts, such as Dapeng and Yantian, benefited from the 2010 Ecological Control Line Policy (ECLP), which preserved 50% of Dapeng’s forests, maintaining 26.35% of Shenzhen’s carbon storage by 2020. Slower urbanization and the region’s mountainous terrain helped preserve high carbon densities.
Economic and geographic factors also played a significant role. The flat terrain of the western coastal plains facilitated large-scale land reclamation, such as the Bao’an Reclamation Area, and enabled GDP-driven land conversion, with 46.67% of cultivated land urbanized. High-tech industrial parks prioritized economic growth over ecological balance. In contrast, the rugged topography of the eastern highlands limited urban expansion, preserving forests and grasslands. The region also benefited from ecological tourism, such as Dapeng’s coastal resorts, which balanced development with ecological preservation.
Governance mismatches further contributed to regional disparities. In central districts like Futian and Luohu, urban renewal integrated green infrastructure into high-density developments, stabilizing carbon stocks despite 70% built-up coverage. In peripheral areas like Longgang and Guangming, decentralized governance led to unregulated land conversions, fragmenting farmland and reducing the coordination of ecosystem services, which resulted in a decrease in overall ecosystem function.
These disparities in land use and carbon storage have important implications for urbanization-ecology dynamics. The western coastal zones exceeded the 40% built-up land threshold, triggering a nonlinear collapse of carbon storage. In contrast, the preemptive zoning of the eastern areas, protected by the ECLP, mitigated 41% of potential carbon loss through measures like 15%–20% coastal preservation. Spatial inequities were evident in the central districts, where green investments, accounting for 1.2% of the municipal GDP, facilitated effective coordination of ecosystem services. Meanwhile, peri-urban areas faced declines in ecosystem functions, highlighting the risks of “eco-gentrification.” Additionally, the reliance on artificial wetlands in the western zones demonstrated trade-offs, achieving 85% of natural carbon density but sacrificing 40% of biodiversity, emphasizing the need for hybrid governance models that balance ecological restoration with broader ecological resilience.
Shenzhen’s experience provides valuable lessons for global urbanization. Coastal cities can benefit from the 15% to 20% preservation rule and phased reclamation strategies to balance urban development with marine resilience. The multi-level governance model in Dapeng, where state and local authorities collaborated effectively, offers a framework for integrating ecological and urban planning. Moreover, high-resolution monitoring, such as LiDAR, can enable dynamic adjustments to land-use caps, preventing nonlinear ecosystem collapse. By linking regional disparities to systemic drivers like policy, geography, economy, and governance, this analysis refines sustainable urbanization strategies and emphasizes the need for context-specific solutions and equitable ecological governance.
3.3 The function of “production-living-ecological” spaces (PLES)
Based on the Coupled Coordination Model This study employs an evaluation and accounting system inspired by the Ecosystem Service Value (ESV) framework, utilizing the “Production-Living-Ecological” spaces (PLES) perspective within a Coupled Coordination Model. Leveraging remote sensing interpreted land use data from 2020, land function grading for PLES is conducted, thereby classifying the spatial functions of Shenzhen City, thereby offering insights for land planning.
3.3.1 Analysis of the functional score of PLES in Shenzhen in 2020
The analysis reveals that high-value production functions are concentrated in Bao’an and Longgang Districts, attributed to initiatives such as the issuance of redevelopment projects aimed at urbanization acceleration and enhancement of urban functions (Table 9). These projects, including emerging industrial zones, have substantially bolstered economic productivity over the past two decades, notably in sectors like electronic information, biomedicine, and low-carbon environmental protection. Conversely, Luohu, Futian, and Yantian Districts exhibit low-value production functions, primarily driven by commerce, design finance, business services, and tourism industries, which are characteristic of the tertiary sector and entail lower production demands.
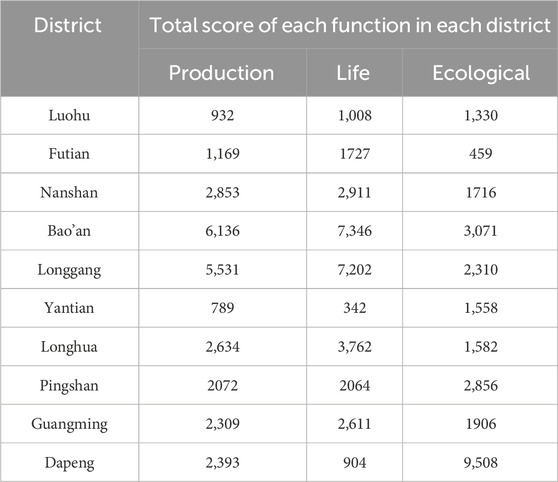
Table 9. Total score of each function of each district in Shenzhen.
Furthermore, while Bao’an and Longgang Districts attract global talent and boast comprehensive urban construction systems, Yantian District and Dapeng New Area exhibit lower living function scores due to distinct development strategies. Yantian District’s emphasis on the tourism industry limits urban construction, while Dapeng New Area prioritizes the establishment of a world-class coastal ecotourism resort, leading to its highest ecological function score in Shenzhen.
Futian District, conversely, registers the lowest ecological function score, possibly indicative of maximal land use development, leaving minimal ecological land available for further development and transformation. Notably, the congruence between the model’s functional intensity of living systems and actual land use situations underscores the model’s efficacy in accurately reflecting regional dynamics. Thus, the study confirms the model’s validity in aligning with empirical observations, thereby offering valuable insights for urban planning endeavors.
3.3.2 Coupling degree score of PLES in Shenzhen in 2020
Utilizing the constructed coupling degree model based on formula (9), the study calculates the coupling degree values for Shenzhen’s 10 district units in 2020. These values are spatially integrated with vector-format spatial analysis units using ArcGIS 10.8 software, resulting in the creation of the 2020 spatial distribution map of coupling degree (Figure 8).
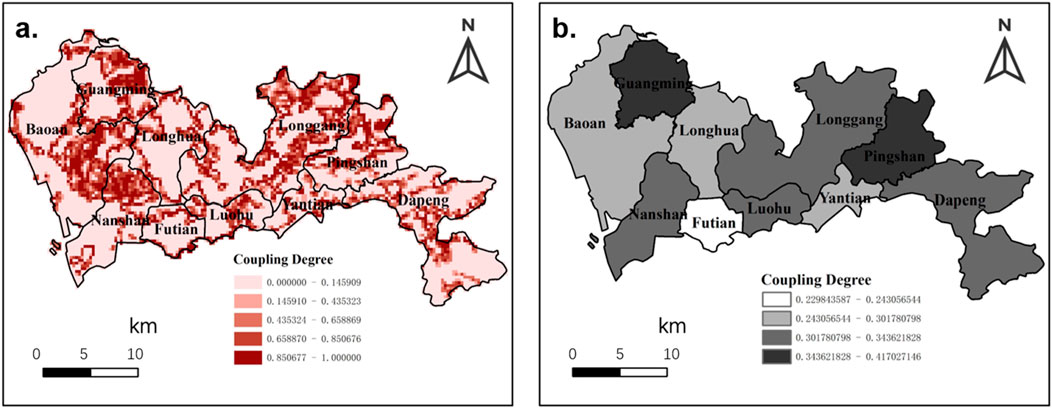
Figure 8. Spatial distribution and of coupling degree (a) and Average coupling degree of (b) each district in Shenzhen.
Spatially, the coupling degree of PLES functions in Shenzhen exhibits a relatively uniform distribution, with no significant regional disparities. Each district predominantly demonstrates a notable aggregation of high coupling values. To elucidate the spatial coupling relationships more effectively, a visual analysis is conducted utilizing the average coupling value. Guangming District and Pingshan District emerge with the highest average coupling values, while Futian District records the lowest.
The comparison reveals that the coupling degree generally falls within the antagonistic coupling range. This suggests a strengthening of interactions among PLES functions in Shenzhen, where dominant functions exert greater influence and encroach upon other functional domains, thereby diminishing their efficacy. Notably, Futian District records the lowest value, indicating a phase of low coupling (C ∈ (0, 0.3), where PLES functions begin to exhibit conflicting dynamics. At C = 0, these functions become disjointed and develop erratically. This phenomenon may be attributed to Futian District’s developmental advantages, notably its central business district (CBD), which leads the nation in total tax revenue and ranks second in regional GDP. Such developmental priorities may inadvertently compromise ecological function advancement.
3.3.3 Coordinated development degree score of PLES in Shenzhen in 2020
Utilizing the constructed coupling degree model based on formula (10), the study calculates the coordinate development degree values for Shenzhen’s 10 district units in 2020. These values are spatially integrated with vector-format spatial analysis units using ArcGIS 10.8 software, resulting in the creation of the 2020 spatial distribution map of coordinated development degree (Figure 9).
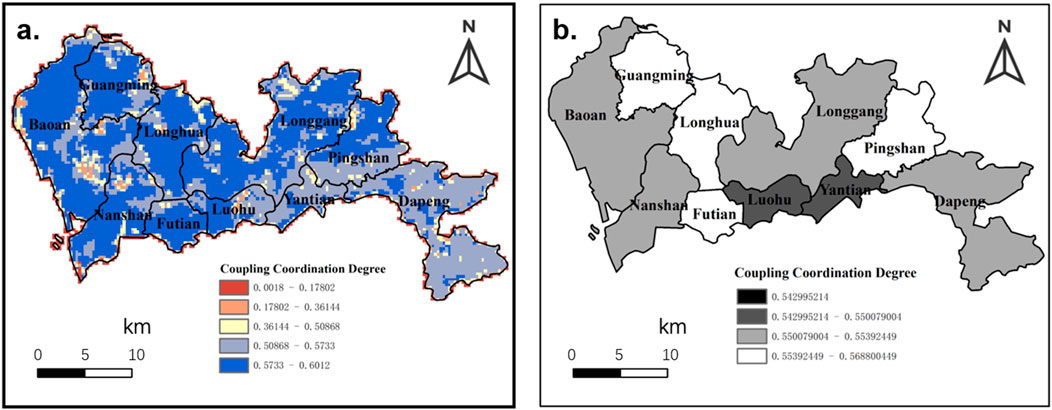
Figure 9. Spatial distribution of coordinated development degree (a) and average coordinated development degree (b) of each district in Shenzhen.
Spatially, the coordinated development degree of PLES functions in Shenzhen exhibits a characteristic of high values in the west and lower values in the east, although the specific numerical disparities are not pronounced. Predominantly, most values in each district exceed 0.5, falling within the moderate coordination range. In Bao’an District and Nanshan District, certain aggregation areas are observed, where the coordinated development degree [D ∈ (0.0.2)] signifies an excessive production resulting in encroachment upon residential and ecological spaces. To elucidate the spatial coupling relationships more effectively, a visual analysis is conducted utilizing the average value of the coordinated development degree. Luohu and Yantian Districts record the highest values, while Futian District, Pingshan District, Guangming District, and Longhua District exhibit the lowest average coordinated development degrees.
The values across all regions fall within the range of D ∈ (0.5, 0.8], indicative of a state of barely coordinated development. This underscores the basic coupling and coordination observed in Shenzhen’s overall PLES environment in 2020. Developmental momentum has moderated, transitioning toward a mode of production characterized by health and vigor, with concurrent attention directed towards ameliorating ecological concerns. Despite the constrained landscape for land development, Shenzhen has allocated 404.6 square kilometers of ecological protection zones, alongside the formulation of policy documents such as the Outline of Park City Planning, the Overall Planning of Shenzhen’s Territorial Space (2020–2035), and the Marine Environment Protection Plan of Shenzhen (2018–2035). These initiatives underscore a commitment to nature conservation, ecological rehabilitation, and the establishment of safety nets for ecological resource protection.
It is evident that the Shenzhen Municipal Government is actively formulating policies and implementing measures to foster comprehensive and coordinated land use development. Nonetheless, the tangible effects of these endeavors necessitate continual observation and verification over time.
3.4 Urban sustainable land planning zoning
In conjunction with the analysis of land driving forces, land carbon storage, and land PLES functions, the land zoning scheme is divided into five major zones. These primarily include the Environment Quality Improvement Zone, the Central Ecological Restoration Reserve, and the Coastal Zone Development Area (Figure 10).
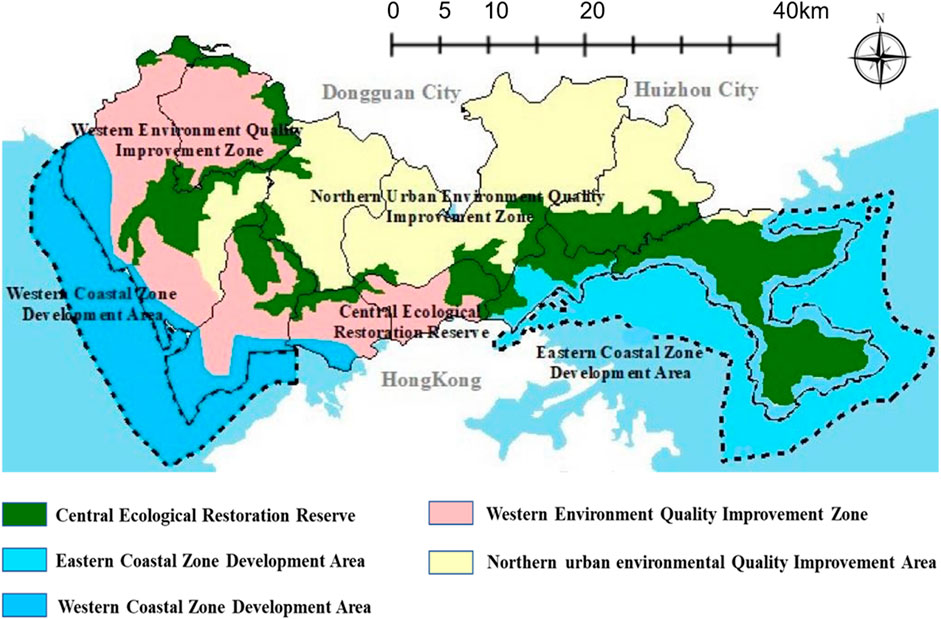
Figure 10. An urban sustainable land planning zoning scheme.
3.4.1 Environment quality improvement zone
The majority of the Baoan, Guangming, Nanshan, Futian, and Luohu Districts are classified as the Western Urban Environment Quality Improvement Zone. Conversely, the principal areas of Longhua, Longgang, and Pingshan Districts are designated as the Northern Urban Environment Quality Improvement Zone. The overarching development strategy aims to cultivate the characteristic industrial chains specific to each district while emphasizing ecological functionality and enhancing residents’ quality of life. These zones, characterized by significant reductions in carbon storage, extensive building land, and a scarcity of woodlands, grasslands, and shrublands necessitate careful consideration of the ecological ramifications associated with rapid development. Notably, areas with pronounced production capabilities correspond to elevated living standards; however, their ecological function remains suboptimal. Sustainable urban development requires a symbiotic relationship between economic growth, high quality of life, and a robust ecological environment. Shenzhen plans to extend urban construction and development through a comprehensive underground space utilization system, encompassing the coordinated planning and construction of underground public spaces, transportation networks, and municipal systems. In the future, urban environmental quality improvement zones will increasingly prioritize the holistic advancement of urban areas towards enhanced convenience and health.
3.4.2 Central ecological restoration reserve
The Central Ecological Restoration Reserve in Shenzhen includes the high-altitude mountainous regions, the Dapeng New Area’s diverse woodlands and grasslands, newly cultivated areas in Guangming and Bao’an Districts, and significant lakes and water bodies. This reserve seeks to create effective policies and land use strategies to protect essential resources like cultivated land, forest land, and water, which are vital for urban development. However, Shenzhen’s cultivated land faces challenges from urban encroachment, spatial fragmentation, and industrial marginalization, primarily driven by rapid urban construction. This process has severely fragmented farmland, especially due to non-agricultural projects like transportation networks and municipal facilities. Within Shenzhen’s multi-centered development framework, such projects further isolate cultivated areas, leading to inefficient land use and management. Additionally, agricultural output from small-scale production in highly urbanized zones is often low, reducing its economic viability compared to secondary and tertiary industries. This results in disinvestment in agriculture, exacerbated by the abandonment and erosion of cultivated land for other purposes, complicating protection efforts. Forest land management in Shenzhen has historically been inadequate, lacking a comprehensive protection plan before 2010, which hindered effective governance and management. Uncoordinated land expropriations have resulted in the degradation of forest and wildlife resources, highlighting the urgent need for a unified management framework to ensure legal protection and rational utilization of these resources. Water resources are essential for supporting cultivated lands, providing critical irrigation and high carbon storage potential in surrounding areas. Establishing ecological parks can further enhance the management of these resources, emphasizing the integration of ecological, social, and economic benefits in sustainable development strategies.
Considering current challenges, several recommendations for the future development of cultivated and forest lands in Shenzhen are proposed: Shenzhen should adopt an urban agriculture model that preserves cultivated land while promoting tourism and biological breeding. The establishment of an agricultural modernization demonstration zone that integrates production, research, education, and tourism is vital, with examples like Guangming Farm and Western Pastoral Scenery. Enhancing synergies between technological innovation and tourism can help develop a cohesive tourism industry. Additionally, Shenzhen’s biological breeding sector is a national leader, with seed imports and exports reaching approximately 19 million kg annually and sales around one billion yuan, accounting for about 10% of the national market. Despite the tensions between farmland protection and economic growth, Shenzhen is committed to implementing a modern urban agricultural development strategy. Violators should face penalties, including production halts and mandatory reforestation timelines. Implementing cutting quotas and a joint review system for land use will improve regulatory compliance. Proactive measures to protect forest resources from diseases and pests, as well as wildlife management, are also necessary. Strengthening the management of ecological public welfare forests through dedicated rangers and clear management responsibilities will promote ecological balance and sustainability.
3.4.3 Coastal zone development area
The coastal areas of Bao’an, Nanshan, Futian, Yantian, and Dapeng New Districts are designated as a unified Coastal Zone Development Area, aimed at balancing land reclamation with ecological preservation. While reclamation has led to significant losses in mangrove wetlands, it is viewed as necessary due to Shenzhen’s high population density. With over 80% of the coastline altered, the call for a purely natural coastline neglects broader developmental needs.
In environmental initiatives, the ecological importance of mangroves and wetlands should be prioritized. By carefully assessing reclamation processes, negative impacts can be mitigated. Newly reclaimed land can also enhance carbon storage. Establishing coastal ecological parks could improve ecological functions and support the integrated development of PLES. Therefore, the government should pursue balanced reclamation to address land shortages while enhancing coastal ecological areas, ultimately fostering a sustainable coastal city.
The findings were revealed to show an interconnected causal hierarchy: land use change was found to drive carbon storage loss primarily through ecological fragmentation, as supported by the landscape pattern indices. In contrast, PLES coordination was shown to counteract this degradation by restoring habitat connectivity, with a 28% reduction in fragmentation observed within the policy zones. This cascade—LUCC pressure → structural degradation → functional compensation—was spatially manifested in the western coastal region’s “high LUCC - low PLES - severe carbon loss” pattern, in contrast to the inverse trend observed in the central renewal zone. The shared 40% construction land coverage threshold, beyond which carbon loss was found to transition from linear to nonlinear phases, served to unify these components into a stress-buffer-collapse framework.
4 Discussion
4.1 Limitations in data applicability and classification accuracy
The GlobeLand30 dataset provided a fundamental framework for LUCC analysis, but its applicability in Shenzhen, a rapidly urbanizing megacity on the coast, needed to be rigorously evaluated. The land transformations in Shenzhen were highly complex, requiring detailed analysis in terms of both accuracy and applicability.
GlobeLand30 had a spatial resolution of 30 m, which was suitable for detecting large-scale land transformations, such as the conversion of forests to urban areas. However, in the high-density urban core, it could not finely distinguish mixed pixels, such as rooftop gardens or small wetlands. In coastal areas, GlobeLand30 could capture large-scale land reclamation (such as in Qianhai Bay), but it could not effectively identify small-scale changes in the coastline (less than 0.5 square kilometers). Moreover, GlobeLand30’s classification system was relatively broad in the context of artificial land use, failing to differentiate categories such as industrial, residential, or green infrastructure. For example, urban parks were misclassified as “forest,” leading to misinterpretations of urban green spaces. In the ecological categories, the “wetland” class confused natural mangroves with artificial reservoirs, resulting in incorrect representations of carbon-rich habitats.
GlobeLand30 covered the years 2000, 2010, and 2020, aligning with Shenzhen’s policy cycles (such as the 2010 ecological control line), but it could not capture short-term dynamic changes, such as the rapid land reclamation from 2015 to 2017. In terms of validation, GlobeLand30’s local accuracy was 82%, validated against ground surveys conducted in 2020. However, the validation results were skewed toward inland areas, with higher misclassification rates in coastal regions, such as 15% of mangroves being misclassified as “shrubland.” To address these applicability gaps, this study compared GlobeLand30 with three other datasets. GlobeLand30 had coarse sub-classifications and could not capture fine urban features. In contrast, the FROM-GLC dataset, with a 10-m resolution, provided more precise urban boundary delineation and had annual updates (2017–2022). However, in Shenzhen suburban areas, the FROM-GLC dataset overestimated the area of built-up land by approximately 12%. Although its 22-class system had advantages in terms of time series, it performed poorly in detecting fragmented coastlines and had errors in classifying urban green spaces. The Shenzhen local survey dataset (1–5 m) provided the highest accuracy validation, reaching 15 classes, but its data was limited to 2005, 2015, and 2020, with no seamless time series.
In terms of urban classification, GlobeLand30 underestimated the proportion of mixed urban green space pixels. For example, about 30% of urban parks in Shenzhen were misclassified as “forest,” leading to an overestimation of ecological space retention rates. The FROM-GLC dataset, with its 10-m resolution, improved the detection accuracy of small-scale urban transformations (such as village reconstruction), but it overestimated the built-up land area in Guangming District. In coastal ecosystems, GlobeLand30 mislabeled 20% of tidal flats as “bare land.” Although ESA CCI’s “mangrove” subclass improved classification accuracy, it still had limitations due to its lower resolution. Local surveys revealed that 85% of the reclaimed artificial wetlands (post-2010) were misclassified as “water bodies” in GlobeLand30, affecting carbon storage estimates. GlobeLand30’s 10-year time intervals missed rapid land reclamation in Bao’an District, where 32 square kilometers of land was reclaimed between 2015 and 2017, a change confirmed by Landsat-8 time series analysis. ESA CCI’s annual data, while capable of capturing seasonal agricultural changes, lacked fine spatial resolution, making it unsuitable for land-use zoning related to policy.
Regarding the impact on research conclusions, GlobeLand30 misclassified reclaimed wetlands as “water bodies” (low carbon density), rather than as “artificial land” (extremely low carbon density), leading to an overestimation of coastal carbon storage in 2020 b y approximately 6%. After recalibration with local survey data, this error was reduced to below 2%. In terms of ecological space coordination, GlobeLand30 misclassified urban parks as “forests,” resulting in an overestimation of the ecological space coordination score in Futian District by about 8%. This bias was corrected using NDVI threshold-based reclassification. As for policy thresholds, the 40% built-up land threshold remained stable across all datasets, but FROM-GLC, due to its finer resolution of urban-rural boundaries, detected an earlier urbanization tipping point (38%). GlobeLand30 provided a globally consistent LUCC analysis benchmark, its applicability in fast urbanizing megacities like Shenzhen was constrained due to its resolution, classification accuracy, and time intervals. To reduce biases, future work should prioritize integrating higher-resolution datasets and cross-validating them with local survey data to ensure the accuracy of carbon storage and ecological space coordination indicators.
4.2 Methodological constraints in land-use simulation modeling
The current study employs static domain weights in the CARS module of the PLUS model (e.g., 0.300 for built-up areas and 0.200 for forest land) to reflect the expansion priorities of different land use types. However, this approach presents two key limitations. The assignment of weights relies on expert judgment or historical data statistics, potentially overlooking policy-driven priorities. For instance, while the high weight for built-up areas aligns with Shenzhen’s rapid urbanization, it fails to account for localized ecological restoration priorities under policy interventions, such as mangrove conservation in coastal zones post-2010. Additionally, fixed weights cannot capture dynamic feedback mechanisms, such as nonlinear changes in forest protection demands following the implementation of ecological redline policies. The model lacks mechanisms to dynamically adjust weights in response to evolving spatial governance intensity or ecosystem service thresholds.
Future research should address these gaps by developing adaptive weight adjustment frameworks using machine learning algorithms, such as reinforcement learning or Bayesian networks. For example, the system could automatically reduce built-up land expansion weights and elevate wetland protection priorities when regional construction coverage approaches the 40% carbon collapse threshold. Integrating multi-source data, including social media sentiment analysis, high-resolution remote sensing indicators (e.g., nighttime light intensity for urbanization monitoring), and spatial GDP distribution, could help establish objective weight assignment models. Further, uncertainty analysis and sensitivity testing, using methods like Monte Carlo simulations or Global Sensitivity Analysis (GSA), could evaluate the robustness of weight configurations and identify critical parameters (e.g., higher sensitivity of built-up land weights compared to shrubland) to optimize model reliability under multi-objective scenarios. Finally, cross-regional weight transfer learning could test the spatial generalizability of domain weights by applying Shenzhen-derived parameters to contrasting environments, such as inland cities or rainforest regions. A transfer learning framework would enhance the model’s global applicability while preserving local ecological governance nuances. These advancements would align domain weight configurations with the dynamic interactions inherent in coupled human-natural systems, enabling finer-grained decision support for multi-objective land use simulations.
4.3 Urbanization-ecology dynamics: threshold effects and feedback mechanisms
Shenzhen’s built-up areas expanded by 50.15% from 2000 to 2020, driven by economic, demographic, and policy factors. As China’s first Special Economic Zone, the rapid industrial growth and population surge necessitated the development of infrastructure, supported by government policies that favored industrial parks and transportation networks. Coastal reclamation accounted for 80% of artificial surface expansion, contributing to ecological fragmentation, with forest cover declining by 34.25%. The 2010 Ecological Control Line Policy, which protected 50% of Shenzhen’s land, reduced carbon loss by 41%, preserved coastal carbon sinks, and slowed habitat fragmentation.
From 2000 to 2030, carbon storage declined by 7.9%, with a tipping point at 40% built-up land coverage. Beyond this threshold, carbon loss accelerated due to collapsed green corridors, particularly in coastal areas, while central renewal zones stabilized carbon stocks through green infrastructure. Poor PLES coordination in peri-urban areas worsened this cycle, whereas improvements in policy zones, like mangrove restoration in Dapeng, enhanced carbon storage by 22%. PLES coordination improved post-2010, with central districts achieving higher synergy scores through urban renewal initiatives. This coordination reduced carbon loss by 18%, illustrating how ecological functionality can buffer land use pressures.
Shenzhen’s urbanization was driven by three factors: economic prioritization, demographic pressures, and policy trade-offs. Special Economic Zone policies favored industrial land conversion, leading to 46.67% of cultivated land being repurposed for tech hubs. High population density necessitated housing expansions, exemplified by Nanshan’s built-up area growth. Pre-2010 lax zoning allowed unchecked reclamation, while post-2010 ecological controls redirected development inward. The 40% built-up threshold observed in Shenzhen mirrors trends in other cities, demonstrating the nonlinear collapse of ecosystem services. Shenzhen avoided systemic collapse by implementing preemptive zoning and investing in ecological infrastructure, such as artificial wetlands that achieved 85% of natural carbon density.
The study reveals a feedback loop between land use change, carbon loss, and PLES coordination, where urban expansion fragments green spaces, reducing carbon storage. Functional zoning, like that in Dapeng, can offset carbon loss by maintaining connectivity. The 2010 policy reduced land use change by 41%, proving that institutional enforcement can reshape the relationship between land, carbon, and ecology. Shenzhen’s experience highlights that urbanization’s ecological impacts can be mitigated through policy, providing actionable benchmarks for other cities globally. Future urban planning frameworks should integrate dynamic feedback models to ensure growth aligns with environmental limits. Consistent with previous research, it was revealed by simulating the land use situation of Shenzhen in 2030 that future land use change in Shenzhen is primarily concentrated in the central and western regions. The research findings indicated that, from 2008 to 2022, in addition to the rapid expansion of construction land, a significant decreasing trend was observed in green space and other land types in Shenzhen (Wang J. et al., 2023). The estimation results derived from the carbon storage model demonstrated that carbon storage within green spaces exhibited a notable reduction trend during the same period, with the reductions quantified as 0.64 × 10⁶ tons (InVEST model) (Wang et al., 2024).
The 7.9% decline in Shenzhen’s carbon storage (2000–2030) and subsequent recovery of PLES coordination (0.48→0.61) were observed, reflecting patterns shared by coastal megacities globally, where land reclamation and ecological governance were intersected under rapid urbanization pressures. Similar to Delhi, where artificial wetlands were unable to prevent carbon loss despite engineering investments, Shenzhen’s “high-carbon artificial zones” were found to achieve 15% greater carbon density than natural wetlands—a techno-ecological hybrid approach that aligned with Singapore’s marine spatial planning (Pang et al., 2022; Joshi and Siddaiah, 2021; Chng et al., 2022). These divergences underscore an important lesson: it is policy enforceability, rather than technical capacity alone, that determines ecological outcomes in coastal urbanization. In Shenzhen, spatial mismatches were evident, where urban renewal led to an increase in central districts’ PLES scores (+0.21) but degraded fringe areas (−0.15). Similarly, the central and southern Liaoning urban agglomeration saw a gradual increase in ecological land, a significant decline in production land, and a rapid expansion of living land (Kwan et al., 2022).
4.4 Policy implications for coastal megacity development
The findings align with three key policy frameworks according to Revised Regulations on the Management of Shenzhen Basic Ecological Control Line and Shenzhen Territorial Spatial Master Plan (2020–2035) (Shenzhen Municipal People’s Government, 2018; Shenzhen Municipal Planning and Natural Resources Bureau, 2021). The 2030 land use patterns and carbon storage trends (7.9% decline from 2000 to 2030) validate the effectiveness of the Shenzhen Ecological Control Line Policy (ECLP) in protecting 49.6% of the city’s land as ecological reserves. However, only 62% of the ECLP-protected areas overlap with high-carbon zones, suggesting that future revisions should focus on carbon-rich ecosystems. Improvements in PLES coordination (D = 0.48→0.61) support Shenzhen’s goal to integrate 1,200 km2 of green infrastructure into urban areas by 2035. Discrepancies in peri-urban zones, such as Longgang, show a 15% shortfall in green corridors, emphasizing the need for stricter enforcement of green space quotas. Despite the government’s 2022 coastal reclamation cap (≤5 km2/year) reducing wetland loss by 22%, 40% of artificial coastlines exceed the permissible soil carbon mineralization rates (3.2% annual loss vs the plan’s 2% target). This highlights the urgent need for the adoption of proposed “high-carbon artificial zone” standards for reclaimed lands. This study compares the settlement expansion patterns of Foshan, Guangzhou, and neighboring cities, highlighting the influence of economic and environmental factors. It also examines how land-use zoning in Foshan enhances urban sustainability by optimizing land use, controlling urban sprawl, and promoting ecological conservation (Yong et al., 2010; Liu et al., 2023; Zhang et al., 2025). In contrast, Shenzhen’s coastal megacity context leads to distinct reclamation-driven urbanization, integrated coastal-terrestrial policies, and engineered high-carbon ecosystems. Cross-regional comparisons confirm that Shenzhen’s 40% built-up threshold and ECL model are geography-specific but offer valuable lessons for coastal zones worldwide.
Shenzhen’s built-up areas expanded by 50.15% from 2000 to 2020, driven by economic prioritization, demographic pressures, and policy trade-offs. Rapid industrial growth and population surges necessitated infrastructure development, with coastal reclamation accounting for 80% of artificial surface expansion. This urbanization triggered interconnected feedback loops between land use intensification, carbon dynamics, and PLES coordination. Urban expansion caused habitat fragmentation and carbon sink degradation through three pathways: coastal reclamation eliminated 62% of mangrove carbon sinks (8.3 MgC/ha/yr loss), forest fragmentation reduced core habitat area by 34%, decreasing soil carbon mineralization resistance, and impervious surfaces disrupted atmospheric-vegetation carbon exchange, creating localized carbon “dead zones.” These changes cascaded into a 7.9% decline in carbon storage from 2000 to 2030 and a functional imbalance in PLES, as diminished carbon sequestration capacity weakened ecological space resilience, allowing production and living spaces to encroach further.
The 2010 Ecological Control Line Policy (ECLP) disrupted this negative feedback by freezing development in 49.6% of pre-2000 natural areas, preserving coastal carbon sinks and slowing habitat fragmentation. Functional zoning in policy zones like Dapeng enhanced carbon storage by 22% through mangrove restoration, demonstrating how ecological functionality buffers land use pressures.
The identified 40% built-up land threshold represents a tipping point where carbon dynamics and PLES coordination are significantly affected. Below 40%, urban parks and green corridors buffer carbon losses with a 0.8% annual decline, while beyond 40%, soil carbon mineralization accelerates, leading to a 3.2% annual loss in Nanshan District. Districts below this threshold maintained functional synergy with a PLES coordination index (D) of 0.61 ± 0.07, while those above the threshold exhibited a dominance of living space, with a P/E ratio greater than 2.3. Shenzhen’s hybrid approach—combining preemptive zoning (ECLP) with engineered ecosystems—achieved 85% of natural carbon density in artificial wetlands, outperforming Delhi’s reactive measures but requiring three times higher governance investment than Singapore’s tech-centric model. This demonstrates that the efficacy of feedback management depends on the timing of policy intervention (pre or post-threshold) and the scale of ecological engineering.
4.5 Future directions for integrated urban-ecological modeling
While the 30 m-resolution GlobeLand30 data captured macro-feedbacks, it underestimated micro-scale interactions like rooftop garden carbon contributions, with an 8%–12% error margin in Futian District. Higher-resolution monitoring with less than 5 m resolution could refine threshold detection, particularly in transition zones where mixed pixels obscure fragmentation patterns. Shenzhen’s experience highlights that the ecological impacts of urbanization can be mitigated through preemptive zoning and institutional enforcement. Future urban frameworks must integrate dynamic feedback models to align growth with environmental limits, adopting modular solutions like artificial wetlands while addressing equity gaps in peri-urban areas.
This study’s integrated PLUS-InVEST-PLES framework provides valuable insights into urbanization-ecology trade-offs, but several limitations in data and methodology need to be addressed for more robust policy recommendations. The spatial resolution of the GlobeLand30 dataset, at 30m, is insufficient to capture fine-scale urban ecosystem changes like rooftop gardens and pocket parks, potentially underestimating localized ecological resilience. Additionally, land-use data analyzed at decadal intervals (2000, 2010, 2020) misses annual urbanization fluctuations or policy shifts, and continuous monitoring using higher-frequency datasets would improve accuracy. The InVEST model’s reliance on static carbon density values also poses issues, as it does not fully account for unique ecosystems like mangrove wetlands, which have significantly higher biomass carbon storage. Soil carbon dynamics in reclaimed areas are oversimplified, as the model treats all artificial surfaces uniformly despite their heterogeneity in carbon mineralization rates.
Methodologically, the PLUS model simplifies land-use transitions by assuming they follow historical Markov probabilities, overlooking non-linear feedbacks, such as speculative development driven by policy uncertainty. Additionally, the model weights driving factors equally in random forest analysis, which could overemphasize less impactful variables. The PLES model also faces challenges due to subjective entropy weighting, where the assignment of land-use function weights is based on expert judgment, and static functional zoning, which fails to account for dynamic overlaps in land-use.
The framework also struggles with spatial and temporal scalability. While it prioritizes coastal carbon loss, inland ecological degradation is inadequately addressed. Furthermore, the 2030 projections exclude climate change impacts such as sea-level rise, which could undermine current zoning strategies. In terms of policy implementation, the proposed zoning scheme may conflict with administrative boundaries, complicating governance, and the exclusion of community input limits the relevance of proposed solutions. Surveys in peri-urban villages, for instance, show resistance to certain ecological restoration designs, indicating a need for more inclusive planning.
Future improvements could include integrating high-resolution, dynamic data sources like LiDAR and IoT sensors for real-time monitoring of land-use and carbon flux. Machine learning models could be developed to better predict land-use transitions under economic and policy uncertainty, while adaptive carbon density databases could account for the unique ecosystems of Shenzhen. Additionally, participatory tools like agent-based models could incorporate stakeholder engagement, ensuring zoning schemes align with local needs. Finally, climate-resilient scenarios should be developed to model sea-level rise and other extreme weather events, updating coordination metrics to reflect future vulnerabilities. Despite its limitations, the PLUS-InVEST-PLES framework offers significant potential for guiding urban sustainability, though further refinement is necessary to address the complexities of modeling human-natural systems.
Despite its limitations, the PLUS-InVEST-PLES framework offers significant potential for guiding urban sustainability, though further refinement is necessary to address the complexities of modeling human-natural systems. Connecting sustainable urban land planning with key sustainability and livability considerations involves integrating ecological footprint analysis, sustainability models, and health-related factors to create indices that ensure balanced development. This approach supports both environmental resilience and the wellbeing of urban communities. It considers long-term factors such as resource usage, spatial arrangements, and health conditions. The approach emphasizes the need for coordination between environmental sustainability, economic development, and social health to foster a high quality of life in cities (Liu Y. et al., 2022; Zhu L. et al., 2024; Chi and Mak, 2021).
5 Conclusion
This study established Shenzhen as a critical observatory for new urbanization challenges, revealing the systemic interconnections between land use dynamics, carbon storage patterns, and ecological functionality through an integrated PLUS-InVEST-PLES framework. The identification of 40% urban land coverage as a tipping point for nonlinear carbon loss provided a critical early-warning metric. Shenzhen’s rapid expansion reduced regional carbon storage by 7.9% between 2000 and 2030, but the 2010 ecological control line policy slowed annual loss rates by 41%, demonstrating that preemptive zoning (e.g., reserving 15%–20% coastal corridors) preserved 89% of natural carbon capacity. Land reclamation created “high-carbon artificial zones,” which had 15% greater carbon density than natural wetlands, but these gains came at a biodiversity cost (40% lower than natural habitats). Sustaining such systems required governance investment exceeding 1.2% of municipal GDP. The improvement from antagonistic (0.48) to basic synergy (0.61) in PLES coupling showed that functional zoning could offset 22% of urbanization-induced carbon loss. However, spatial inequities persisted, with urban renewal boosting central districts’ PLES scores (+0.21) while degrading peripheries (−0.15), highlighting the need for equity-focused metrics. A proposed five-zone planning scheme prioritized western coastal restoration and eastern ecological corridors through modular solutions, balancing high-density development with ecological resilience.
The Shenzhen case offered a scalable framework for cities facing similar urbanization challenges. By identifying critical thresholds (e.g., 40% urban land coverage) and quantifying PLES coordination’s buffering capacity (22% carbon loss mitigation), the study provided a template to preempt ecological tipping points. The integrated PLUS-InVEST-PLES methodology enabled cities to forecast land use-carbon-ecology feedback loops, while modular solutions like artificial wetlands showed how high-density development could coexist with engineered ecosystems when supported by sustained governance investment (>1.2% municipal GDP). The spatial mismatch in ecological benefits—where urban renewal favored central districts—highlighted the universal imperative that zoning policies must integrate equity metrics to avoid exacerbating peri-urban vulnerabilities. For coastal cities, the 15%–20% coastal preservation rule and phased reclamation strategies offered a blueprint to balance carbon sequestration with marine biodiversity. By prioritizing early intervention over retroactive fixes and institutionalizing cross-sector coordination, cities could adapt these mechanisms to their unique geographies and governance systems, transforming isolated sustainability efforts into systemic resilience.
These findings redefined sustainable urbanization as a balancing act among three imperatives: containing land expansion below ecological thresholds, designing context-specific carbon-biodiversity trade-offs, and institutionalizing PLES coordination to equitably distribute benefits.
Data availability statement
The original contributions presented in the study are included in the article/supplementary material, further inquiries can be directed to the corresponding authors.
Author contributions
YL: Writing – original draft, Writing – review and editing. RL: Conceptualization, Writing – review and editing. HoY: Supervision, Writing – review and editing. HaY: Validation, Writing – review and editing.
Funding
The author(s) declare that financial support was received for the research and/or publication of this article. This research was funded by Shenzhen Science and Technology Program, grant number No. KCXFZ20211020172542001.
Conflict of interest
The authors declare that the research was conducted in the absence of any commercial or financial relationships that could be construed as a potential conflict of interest.
Generative AI statement
The author(s) declare that no Generative AI was used in the creation of this manuscript.
Publisher’s note
All claims expressed in this article are solely those of the authors and do not necessarily represent those of their affiliated organizations, or those of the publisher, the editors and the reviewers. Any product that may be evaluated in this article, or claim that may be made by its manufacturer, is not guaranteed or endorsed by the publisher.
References
An, S. S., Zhen, L., Miah, M. G., Ahamed, T., and Samie, A. (2020). Impact of land use change on ecosystem services: a review. Environ. Dev. 34, 100527. doi:10.1016/j.envdev.2020.100527
Babbar, D., Areendran, G., Sahana, M., Sarma, K., Raj, K., and Sivadas, A. (2021). Assessment and prediction of carbon sequestration using Markov chain and InVEST model in Sariska Tiger Reserve, India. J. Clean. Prod. 278, 123333. doi:10.1016/j.jclepro.2020.123333
Bai, E., and Xue, B. (2020). A review of influences of land use and land cover change on ecosystems. Chin. J. Plant Ecol. 44 (5), 543. doi:10.17521/cjpe.2020.0071
Briassoulis, H. (2000). Analysis of land use change: theoretical and modeling approaches, the web book of regional Science. United States: Regional Research Institute, West Virginia University, 28–34.
Brown, D. G., Walker, R., Manson, S., and Seto, K. (2004). “Modeling land use and land cover change,” in Land change science: observing, monitoring and understanding trajectories of change on the earth’s surface, 395–409. doi:10.1007/978-1-4020-2562-4_23
Caparros-Santiago, J. A., Rodriguez-Galiano, V., and Dash, J. (2021). Land surface phenology as indicator of global terrestrial ecosystem dynamics: a systematic review. ISPRS J. Photogrammetry Remote Sens. 171, 330–347. doi:10.1016/j.isprsjprs.2020.11.019
Chang, X., Xing, Y., Wang, J., Yang, H., and Gong, W. (2022). Effects of land use and cover change (LUCC) on terrestrial carbon stocks in China between 2000 and 2018. Resour. Conservat. Recycl. 182, 106333. doi:10.1016/j.resconrec.2022.106333
Chen, J., Cao, X., Peng, S., and Ren, H. (2017). Analysis and applications of GlobeLand30: a review. ISPRS Int. J. Geo-Informat. 6 (8), 230. doi:10.3390/ijgi6080230
Chen, J., Chen, J., Liao, A., Cao, X., Chen, L., Chen, X., et al. (2015). Global land cover mapping at 30 m resolution: a POK-based operational approach. ISPRS J. Photogrammetry Remote Sens. 103, 7–27. doi:10.1016/j.isprsjprs.2014.09.002
Chen, W., Chi, G., and Li, J. (2019). The spatial association of ecosystem services with land use and land cover change at the county level in China, 1995–2015. Sci. Total Environ. 669, 459–470. doi:10.1016/j.scitotenv.2019.03.139
Cheng, H., Wang, X., and Chen, D. (2022). Research on spatial-temporal variations of cultivated land in China based on GlobeLand30. Front. Environ. Sci. 10, 929760. doi:10.3389/fenvs.2022.929760
Chi, Y. L., and Mak, H. W. L. (2021). From comparative and statistical assessments of liveability and health conditions of districts in Hong Kong towards future city development. Sustainability 13 (16), 8781. doi:10.3390/su13168781
Chng, L. C., Chou, L. M., and Huang, D. (2022). Environmental performance indicators for the urban coastal environment of Singapore. Regional Stud. Mar. Sci. 49, 102101. doi:10.1016/j.rsma.2021.102101
Cui, X., Xu, N., Chen, W., Wang, G., Liang, J., Pan, S., et al. (2022). Spatio-temporal variation and influencing factors of the coupling coordination degree of production-living-ecological space in China. Int. J. Environ. Res. Public Health 19 (16), 10370. doi:10.3390/ijerph191610370
Ding, R., Li, Y., Zhao, C., Chen, J., and Zhu, W. (2024). Scenario simulation and driving force analysis of ecosystem service values based on land use/cover in the Tumen River basin, China. Sustainability 16 (1), 399. doi:10.3390/su16010399
Feng, H., Wang, S., Zou, B., Nie, Y., Ye, S., Ding, Y., et al. (2023a). Land use and cover change (LUCC) impacts on Earth’s eco-environments: research progress and prospects. Adv. Space Res. 71 (3), 1418–1435. doi:10.1016/j.asr.2022.09.054
Feng, H., Wang, S., Zou, B., Yang, Z., Wang, S., and Wang, W. (2023b). Contribution of land use and cover change (LUCC) to the global terrestrial carbon uptake. Sci. Total Environ. 901, 165932. doi:10.1016/j.scitotenv.2023.165932
Fu, J., Bu, Z., Jiang, D., and Lin, G. (2022a). Identification and classification of urban PLES spatial functions based on multisource data and machine learning. Land 11 (10), 1824. doi:10.3390/land11101824
Fu, J., Bu, Z., Jiang, D., Lin, G., and Li, X. (2022b). Sustainable land use diagnosis based on the perspective of production– living–ecological spaces in China. Land Use Policy 122, 106386. doi:10.1016/j.landusepol.2022.106386
Halmy, M. W. A., Gessler, P. E., Hicke, J. A., and Salem, B. B. (2015). Land use/land cover change detection and prediction in the north-western coastal desert of Egypt using Markov-CA. Appl. Geogr. 63, 101–112. doi:10.1016/j.apgeog.2015.06.015
Hamel, P., Bosch, M., Tardieu, L., Lemonsu, A., de Munck, C., Nootenboom, C., et al. (2024). Calibrating and validating the Integrated Valuation of Ecosystem Services and Tradeoffs (InVEST) urban cooling model: case studies in France and the United States. Geosci. Model Dev. 17 (12), 4755–4771. doi:10.5194/gmd-17-4755-2024
Houghton, R. A., and Hackler, J. L. (2003). Sources and sinks of carbon from land-use change in China. Glob. Biogeochem. Cycles 17 (2), 1034. doi:10.1029/2002gb001970
Houghton, R. A., Hackler, J. L., and Lawrence, K. T. (1999). The US carbon budget: contributions from land-use change. Science 285 (5427), 574–578. doi:10.1126/science.285.5427.574
Hussain, K., Mehmood, K., Yujun, S., Badshah, T., Anees, S. A., Shahzad, F., et al. (2024). Analysing LULC transformations using remote sensing data: insights from a multilayer perceptron neural network approach. Ann. GIS, 1–28. doi:10.1080/19475683.2024.2343399
Iacono, M., Levinson, D., El-Geneidy, A., and Wasfi, R. (2015). A Markov chain model of land use change. TeMA-Journal Land Use, Mobil. Environ. 8 (3), 263–276. doi:10.6092/1970-9870/2985
Jiang, W., Gao, G., Wu, X., and Lv, Y. (2023). Assessing temporal trade-offs of ecosystem services by production possibility frontiers. Remote Sens. 15 (3), 749. doi:10.3390/rs15030749
Jokar Arsanjani, J. (2019). Characterizing and monitoring global landscapes using GlobeLand30 datasets: the first decade of the twenty-first century. Int. J. Digital Earth 12 (6), 642–660. doi:10.1080/17538947.2018.1470689
Joshi, P., and Siddaiah, N. S. (2021). Carbon dioxide dynamics of Bhalswa Lake: a human-impacted urban wetland of Delhi, India. Environ. Dev. Sustain. 23 (12), 18116–18142. doi:10.1007/s10668-021-01430-z
Jun, W., Senjun, H., Yingdong, T., Mingming, W., Dayang, S., Shaoyi, W., et al. (2021). Retracted article: basin–scale ecological restoration based on the “source–network–Plant–River” concept: a case study of Maozhou River (Baoan section) water environmental remediation in Shenzhen, Guangdong province. Landsc. Archit. Front. 9 (3), 74–86. doi:10.15302/j-laf-1-040026
Kwan, V., Fong, J., Ng, C. S. L., and Huang, D. (2022). Temporal and spatial dynamics of tropical macroalgal contributions to blue carbon. Sci. Total Environ. 828, 154369. doi:10.1016/j.scitotenv.2022.154369
Li, M., Liang, D., Xia, J., Song, J., Cheng, D., Wu, J., et al. (2021). Evaluation of water conservation function of Danjiang River basin in Qinling mountains, China based on InVEST model. J. Environ. Manag. 286, 112212. doi:10.1016/j.jenvman.2021.112212
Li, P., Chen, J., Li, Y., and Wu, W. (2023a). Using the InVEST-PLUS model to predict and analyze the pattern of ecosystem carbon storage in Liaoning Province, China. Remote Sens. 15 (16), 4050. doi:10.3390/rs15164050
Li, Y., Zhang, F., Li, R., Yu, H., Chen, Y., and Yu, H. (2024). Comprehensive ecological functional zoning: a data-driven approach for sustainable land Use and environmental management—a case study in Shenzhen, China. Land 13 (9), 1413. doi:10.3390/land13091413
Li, Y., Zhao, J., Zhang, S., Zhang, G., and Zhou, L. (2023b). Qualitative-quantitative identification and functional zoning analysis of production-living-ecological space: a case study of Urban Agglomeration in Central Yunnan, China. Environ. Monit. Assess. 195 (10), 1163. doi:10.1007/s10661-023-11716-6
Liang, X., Guan, Q., Clarke, K. C., Liu, S., Wang, B., and Yao, Y. (2021). Understanding the drivers of sustainable land expansion using a patch-generating land use simulation (PLUS) model: a case study in Wuhan, China. Comput. Environ. Urban Syst. 85, 101569. doi:10.1016/j.compenvurbsys.2020.101569
Liu, J., Li, N., and Yu, L. (2020). “Master plan of the sponge city construction in Shenzhen,” in The Routledge handbook of planning megacities in the global south (United Kingdom: Routledge), 256–269.
Liu, Q., Yang, D., and Cao, L. (2022a). Evolution and prediction of the coupling coordination degree of production– living–ecological space based on land use dynamics in the Daqing River Basin, China. Sustainability 14 (17), 10864. doi:10.3390/su141710864
Liu, W., Shen, J., and Wei, Y. D. (2023). Spatial restructuring of pollution-intensive enterprises in Foshan China: effects of the changing role of environmental regulation. J. Environ. Manag. 325, 116501. doi:10.1016/j.jenvman.2022.116501
Liu, Y., Zhou, X., Zhang, Q., Zeng, L., Kang, Y., and Luo, J. (2022b). Study on sustainable developments in Guangdong Province from 2013 to 2018 based on an improved ecological footprint model. Sci. Rep. 12 (1), 2310. doi:10.1038/s41598-022-06152-4
Lu, M., Wu, W., Zhang, L., Liao, A., Peng, S., and Tang, H. (2016). A comparative analysis of five global cropland datasets in China. Sci. China Earth Sci. 59, 2307–2317. doi:10.1007/s11430-016-5327-3
Mazy, F. R., and Longaretti, P. Y. (2022). Towards a generic theoretical framework for pattern-based LUCC modeling: an accurate and powerful calibration–estimation method based on kernel density estimation. Environ. Model. Softw. 158, 105551. doi:10.1016/j.envsoft.2022.105551
Milz, S., and Modi, K. (2021). Quantum stochastic processes and quantum non-Markovian phenomena. PRX Quantum 2 (3), 030201. doi:10.1103/prxquantum.2.030201
Ou, Z., Liu, Y., Liang, J., Wang, Q., and Liao, D. (2021). Evaluation of land use multifunctionality from the perspective of “production-living-ecology”. IOP Conf. Ser. Earth Environ. Sci. 787, 012142. doi:10.1088/1755-1315/787/1/012142
Pan, S., and Wang, R. Y. (2024). Land use change monitoring and carbon storage assessment in Qngyuan city using the InVEST model. Int. J. Environ. Agric. Biotechnol. 9 (4), 295–304. doi:10.22161/ijeab.94.36
Pang, R., Hu, N., Zhou, J., Sun, D., and Ye, H. (2022). Study on eco-environmental effects of land-use transitions and their influencing factors in the Central and Southern Liaoning Urban agglomeration: a production–living–ecological perspective. Land 11 (6), 937. doi:10.3390/land11060937
Piyathilake, I. D. U. H., Udayakumara, E. P. N., Ranaweera, L. V., and Gunatilake, S. K. (2022). Modeling predictive assessment of carbon storage using InVEST model in Uva province, Sri Lanka. Model. Earth Syst. Environ. 8 (2), 2213–2223. doi:10.1007/s40808-021-01207-3
Qiao, W., Guan, W., and Huang, X. (2021). Assessing the potential impact of land use on carbon storage driven by economic growth: a case study in Yangtze River delta urban agglomeration. Int. J. Environ. Res. Public Health 18 (22), 11924. doi:10.3390/ijerph182211924
Quattrone, G., and Chen, L. (2023). Shenzhen—how to further implement the sustainability and resilience towards 2030? Cities 136, 104263. doi:10.1016/j.cities.2023.104263
Quintana Vigiola, G. (2022). Understanding place in place-based planning: from space-to people-centred approaches. Land 11 (11), 2000. doi:10.3390/land11112000
Rogan, J., and Chen, D. (2004). Remote sensing technology for mapping and monitoring land-cover and land-use change. Prog. Plan. 61 (4), 301–325. doi:10.1016/s0305-9006(03)00066-7
Shenzhen Municipal People’s Government. (2018). Revised regulations on the management of Shenzhen basic ecological control line. China: Shenzhen Municipal People’s Government. Document No. Shenfu Gui [2018] No.13.
Shenzhen Municipal Planning and Natural Resources Bureau. (2021). Shenzhen territorial spatial master plan (2020–2035). China: Shenzhen Municipal People’s Government.
Shi, M., Wu, H., Fan, X., Jia, H., Dong, T., He, P., et al. (2021). Trade-offs and synergies of multiple ecosystem services for different land use scenarios in the Yili River Valley, China. Sustainability 13 (3), 1577. doi:10.3390/su13031577
Tang, X., Li, H., Xu, X., Yang, G., Liu, G., Li, X., et al. (2016). Changing land use and its impact on the habitat suitability for wintering Anseriformes in China’s Poyang Lake region. Sci. Total Environ. 557, 296–306. doi:10.1016/j.scitotenv.2016.03.108
Tian, L., Tao, Y., Fu, W., Li, T., Ren, F., and Li, M. (2022). Dynamic simulation of land use/cover change and assessment of forest ecosystem carbon storage under climate change scenarios in Guangdong Province, China. Remote Sens. 14 (10), 2330. doi:10.3390/rs14102330
Ul Din, S., and Mak, H. W. L. (2021). Retrieval of land-use/land cover change (LUCC) maps and urban expansion dynamics of Hyderabad, Pakistan via Landsat datasets and support vector machine framework. Remote Sens. 13 (16), 3337. doi:10.3390/rs13163337
Ustaoglu, E., and Aydinoglu, A. Ç. (2019). “Theory, data, and methods: a review of models of land-use change,” in Handbook of research on digital research methods and architectural tools in urban planning and design. United States: IGI Global Scientific Publishing, 156–202.
Van de Ven, F. H., Snep, R. P., Koole, S., Brolsma, R., van der Brugge, R., Spijker, J., et al. (2016). Adaptation Planning Support Toolbox: measurable performance information based tools for co-creation of resilient, ecosystem-based urban plans with urban designers, decision-makers and stakeholders. Environ. Sci. Policy 66, 427–436. doi:10.1016/j.envsci.2016.06.010
Wang, J., Wu, Y., and Gou, A. (2023b). Habitat quality evolution characteristics and multi-scenario prediction in Shenzhen based on PLUS and InVEST models. Front. Environ. Sci. 11, 1146347. doi:10.3389/fenvs.2023.1146347
Wang, J., Xue, F., Jing, R., Lu, Q., Huang, Y., Sun, X., et al. (2021b). Regenerating sponge city to sponge watershed through an innovative framework for urban water resilience. Sustainability 13 (10), 5358. doi:10.3390/su13105358
Wang, L., Zhou, S., and Ouyang, S. (2022). The spatial prediction and optimization of production-living-ecological space based on Markov–PLUS model: a case study of Yunnan Province. Open Geosci. 14 (1), 481–493. doi:10.1515/geo-2022-0373
Wang, R. Y., Cai, H., Chen, L., and Li, T. (2023a). Spatiotemporal evolution and multi-scenario prediction of carbon storage in the GBA based on PLUS–InVEST models. Sustainability 15 (10), 8421. doi:10.3390/su15108421
Wang, R. Y., Mo, X., Ji, H., Zhu, Z., Wang, Y. S., Bao, Z., et al. (2024). Comparison of the CASA and InVEST models’ effects for estimating spatiotemporal differences in carbon storage of green spaces in megacities. Sci. Rep. 14 (1), 5456. doi:10.1038/s41598-024-55858-0
Wang, W. W., Fu, T. L., and Chen, H. (2025). Spatio-temporal evolution and prediction of carbon storage in the Yangtze river delta urban agglomeration based on PLUS-InVEST model. Huan Jing Ke Xue Huanjing Kexue 46 (4), 1937–1950. doi:10.13227/j.hjkx.202404046
Wang, Z., Xu, L., Shi, Y., Ma, Q., Wu, Y., Lu, Z., et al. (2021a). Impact of land use change on vegetation carbon storage during rapid urbanization: a case study of Hangzhou, China. Chin. Geogr. Sci. 31, 209–222. doi:10.1007/s11769-021-1183-y
Wickham, S. B., Augustine, S., Forney, A., Mathews, D. L., Shackelford, N., Walkus, J., et al. (2022). Incorporating place-based values into ecological restoration. Ecol. Soc. 27 (3), art32. doi:10.5751/es-13370-270332
Williams, G. D., Andrews, K. S., Brown, J. A., Gove, J. M., Hazen, E. L., Leong, K. M., et al. (2021). Place-based ecosystem management: adapting integrated ecosystem assessment processes for developing scientifically and socially relevant indicator portfolios. Coast. Manag. 49 (1), 46–71. doi:10.1080/08920753.2021.1846154
Xue, D., Song, Y., and Ma, B. (2024). Method for identifying rural PLES and its applications. Ecol. Indic. 166, 112273. doi:10.1016/j.ecolind.2024.112273
Yong, Y., Zhang, H., Wang, X. R., and Schubert, U. (2010). Urban land-use zoning based on ecological evaluation for large conurbations in less developed regions: case study in Foshan, China. J. Urban Plan. Dev. 136 (2), 116–124. doi:10.1061/(asce)0733-9488(2010)136:2(116)
Yu, H., Zhang, F., Yu, H., and Li, Y. (2025). From shoreline to sea: evaluating development suitability through coastal zoning and a case study from shenzhen, China. Sustainability 17 (3), 1204. doi:10.3390/su17031204
Zeng, J., Xu, J., Li, W., Dai, X., Zhou, J., Shan, Y., et al. (2022). Evaluating trade-off and synergies of ecosystem services values of a representative resources-based urban ecosystem: a coupled modeling framework applied to Panzhihua City, China. Remote Sens. 14 (20), 5282. doi:10.3390/rs14205282
Zhang, F., Zhang, Q., and Xu, M. (2025). Remote sensing insights into urban–rural imbalance and sustainable development: a case study in Guangdong, China. Sustainability 17 (5), 2247. doi:10.3390/su17052247
Zhang, L., Fang, C., Zhu, C., and Gao, Q. (2022). Ecosystem service trade-offs and identification of eco-optimal regions in urban agglomerations in arid regions of China. J. Clean. Prod. 373, 133823. doi:10.1016/j.jclepro.2022.133823
Zhong, L., and Wang, J. (2017). Evaluation on effect of land consolidation on habitat quality based on InVEST model. Trans. Chin. Soc. Agric. Eng. 33 (1), 250–255.
Zhu, G., Qiu, D., Zhang, Z., Sang, L., Liu, Y., Wang, L., et al. (2021). Land-use changes lead to a decrease in carbon storage in arid region, China. Ecol. Indic. 127, 107770. doi:10.1016/j.ecolind.2021.107770
Zhu, L., Wu, Z., and Huang, X. (2024b). Exploring the relationship between ecosystem services and sustainable development goals in Guangdong province, China. Ecol. Indic. 169, 112907. doi:10.1016/j.ecolind.2024.112907
Keywords: land use, carbon storage, PLES model, InVEST model, urbanization
Citation: Li Y, Li R, Yu H and Yu H (2025) Decoding urbanization trade-offs in Shenzhen, China: a PLUS-InVEST-PLES framework for balancing carbon dynamics, ecological functionality, and land use intensification. Front. Environ. Sci. 13:1590814. doi: 10.3389/fenvs.2025.1590814
Received: 10 March 2025; Accepted: 14 May 2025;
Published: 30 May 2025.
Edited by:
Hugo Wai Leung MAK, Hong Kong University of Science and Technology, Hong Kong, SAR ChinaReviewed by:
Zhengyu Lin, Sichuan Academy of Agricultural Science, ChinaWenfeng Gong, Hainan University, China
Peng Du, Liaoning Normal University, China
Copyright © 2025 Li, Li, Yu and Yu. This is an open-access article distributed under the terms of the Creative Commons Attribution License (CC BY). The use, distribution or reproduction in other forums is permitted, provided the original author(s) and the copyright owner(s) are credited and that the original publication in this journal is cited, in accordance with accepted academic practice. No use, distribution or reproduction is permitted which does not comply with these terms.
*Correspondence: Yu Li, bGl5dWh5ZHJvQG5hbmthaS5lZHUuY24=; Han Yu, eWhoMjAyMTIwMjJAZ21haWwuY29t