 Chang Qian
 Chang Xiang
 Yuan Qiuyue
 Zhao Yiping
 He Xianglin
 Tao Xinyuan
 Li Yijin
- College of Management, Sichuan Agricultural University, Chengdu, China
Accurately measuring the eco-efficiency of grain production and exploring pathways for its improvements are essential for pormoting green agricultural transformation and achieving China’s “dual carbon” goals. This study assesses the eco-efficiency of grain production in China by incorporating carbon emissions and agricultural non-point source pollution as non-desired outputs, utilizing the SBM-Undesirable model and micro-level survey data from 1,208 farm households in major grain-producing regions. The results suggest that the average eco-efficiency score across these regions is 0.627, marginally above the acceptable threshold and 0.219 points higher than traditional production efficiency, providing empirical support for the Porter hypothesis. Mechanism analysis identifies that eco-efficiency is positively associated with household head’s age, family income, grain-sown area, land quality, and membership in agricultural organizations. In contrast, it is negatively associated with family size, land fragmentation, cropping index, agricultural subsidies, agricultural production outsourcing, and investment in fixed productive assets. Regional heterogeneity analysis confirms the robustness of these findings, showing only minor variations across provinces. Overall, the study offers critical insights into the determinants of eco-efficiency in grain production and proposes actionable strategies to enhance sustainability across China’s agricultural sector.
Highlights
• This study measured the eco-efficiency of major grain-producing areas in China.
• The study analyzed the determinants of eco-efficiency.
• Agricultural non-point source pollution and carbon emissions are considered non-desired outputs.
• This study focuses on the micro-foundations of enhancing eco-efficiency.
• Determinants of eco-efficiency are largely stable and slightly different in different provinces.
• Strong support is provided to ensure food security.
1 Introduction
Food security has long been a strategic priority for China, a country with a large population and relatively underdeveloped agricultural conditions. As the Chinese proverb warns, “Without agriculture, there will be instability; without food, there will be chaos”. The issue extends beyond national boundaries, with profound implications for global security and social stability (Zhang Q. et al., 2021). However, China’s extensive agricultural production model—characterized by high input, high output, and high waste—has led to serious ecological consequences, including land degradation and environmental pollution (Li et al., 2022). Consequently, grain production in China now faces dual constraints of environmental sustainability and resource scarcity, making the challenge of ensuring food security increasingly acute (Mumtaz et al., 2021). Against this backdrop, traditional economic theory attributes economic growth primarily to two drivers: increased inputs—such as labor, land and capital—and improvements in production efficiency that enable higher output to be produced from the same level of inputs. However, such framework often neglects the environmental and resource constraints that inherently accompany economic growth (Xie and Teo, 2022). As economic and societal development continues to advance, the conflict between economic growth and environmental sustainability has become more pronounced (Adejumo, 2020; Jie et al., 2023). In response, scholars have called for the integration of ecological considerations into agricultural development frameworks (Adisa et al., 2024). In particular, the concept of eco-efficiency in grain production—defined as the coordination among resource conservation, environmental protection, and economic performance—has emerged as a focal point in recent research (Czyewski et al., 2021; Wang et al., 2022).
Agricultural eco-efficiency is a key measure of sustainable agricultural development. It guides the balance between ecological conservation and economic growth and underpins modern ecological agriculture (Wu et al., 2023). Developed countries, including the United States, the United Kingdom, and Japan, have already integrated eco-efficiency into their agricultural practices (Fuhrmann-Aoyagi et al., 2024; Grassauer et al., 2021; Puertas et al., 2022; Suh, 2018). By contrast, its implementation in China remains relatively limited and uneven across regions. Studies indicate that China’s agricultural green total factor productivity (AGTFP) is constrained by economic-policy suppression and human capital-economic suppression (Lu et al., 2025), as well as environmental and resource-related factors such as extreme weather events (Song et al., 2022), greenhouse gas emissions including methane and nitrous oxide (Wang et al., 2025), and the natural endowment of arable land (Liu et al., 2020). These factors further exacerbate regional disparities in agricultural eco-efficiency.
In terms of spatial distribution, Wang et al. (2025) find that higher nitrous oxide (N2O) emissions in southeastern China lead to a clear spatial pattern of agricultural eco-efficiency, with higher efficiency in the northwest and lower efficiency in the southeast. This shows significant regional differences. Specifically, in major grain-producing areas, major grain-purchasing areas, and balanced grain production and consumption areas, agricultural eco-efficiency is underestimated by 7.83%, 8.23%, and 16.75%, respectively, revealing spatial biases in assessment. Liao et al. (2021) identify energy input, water resource input, and carbon emissions as the core drivers of these spatial differences. Additionally, water resource input, pesticide input, and labor input are key factors affecting eco-efficiency across eastern, central, and western regions. Recognizing this gap, recent studies have focused on measuring agricultural eco-efficiency and examing its evolution and driving forces. These assessments typically consider three components: inputs, desirable outputs, and undesirable outputs. While inputs and desired outputs are relatively well-defined, incorporating undesirable outputs—such as agricultural non-point source pollution (e.g., nitrogen and phosphorus runoff, pesticide use, COD) and carbon emissions—presents methodological challenges (Zhuang et al., 2021).
With mounting pressure on land and environmental resources, China’s grain supply-demand balance has become increasingly fragile (Zhan, 2022). Relying on material inputs to boost yield is no longer a sustainable strategy (Zhou et al., 2020). Furthermore, global uncertainties—such as long-term structural shifts and the COVID-19 pandemic—have underscored the risks associated with reliance on international food markets (FAO, 2020). In response to worsening environmental degradation, China has implemented stringent land protection measures, commonly known as “long teeth” regulations (Liao et al., 2021). While these policies aim to preserve ecological integrity, they have also led to higher production costs and reduced agricultural competitiveness (Zhong, 2016). In the short term, a tension appears to exist between achieving food security and promoting the growth of a green agricultural economy (Li et al., 2011). However, in the long run, enhancing eco-efficiency is increasing recognized as a strategic pathway toward sustainable agriculture (Malan et al., 2022).
Given this context, accurately assessing agricultural eco-efficiency has become essential for informing policy decisions and balancing productivity with sustainability goals. In recent years, the Data Envelopment Analysis (DEA) model has been widely employed, particularly the Slacks-Based Measure (SBM) model introduced by Tone (2004), which effectively accounts for input and output slacks. The SBM-Undesirable model, as a cutting-edge improvement framework for data envelopment analysis (DEA), effectively addresses the limitations of traditional models through three core theoretical assumptions. First, the non-radial treatment assumption breaks through the constraints of traditional DEA radial optimization, allowing input and output variables to be adjusted in a non-proportional manner, which is more in line with the gradual and differentiated reality of factor adjustments in agricultural production; Secondly, the assumption of endogenous slack variables directly incorporates slack issues such as excess inputs and insufficient outputs into the objective function, accurately identifying the specific sources of inefficient resource allocation (Zhan et al., 2023); Finally, the assumption of weak disposability of non-expected outputs combines environmental negative outputs such as soil compaction and carbon emissions with expected outputs in a joint model. The construction of an environmental technology set embodies the fundamental ecological-economic trade-off, where pollution reduction necessitates partial sacrifice of economic output (Huang and Yao, 2022). In the context of research on green transformation in agriculture, the advantages of applying this model are reflected in its triple compatibility: It can analyze the non-linear relationship between factors such as land and labor and output, quantify ecological compensation standards through environmental shadow prices, and calculate specific optimization paths based on slack variables. This integrated analytical framework of “diagnosis-pricing-optimization” not only distinguishes between technological inefficiency and managerial inefficiency but also provides a differentiated policy basis for technological innovation and institutional adjustment, thereby systematically promoting the coordinated development of agricultural productivity improvement and environmental sustainability (Ma and Mu, 2024). As a result, the SBM-Undesirable model has become the mainstream method for assessing agricultural ecological efficiency (Akbar et al., 2021; Wang and Liu, 2024). Empirical evidence suggests that excluding environmental costs can led to substantial overestimation of production efficiency (Pang et al., 2016). Although China’s agricultural eco-efficiency has shown a gradual upward trend, considerable regional disparities persist (Wu et al., 2023; Wang and Liu, 2024). Specifically, major grain-producing areas tend to exhibit higher eco-efficiency compared to other regions, though intra-regional variation remains notable (Wang S. et al., 2020). Moreover, the literature is divided on the direction of these trends—while some studies report improvements, others identify stagnation or decline (Xu et al., 2021; Aslam et al., 2021).
Regarding the determinants of eco-efficiency, existing research has examined macro-level factors including R&D investment, technological progress, and resource allocation efficiency (Li et al., 2024; Wang et al., 2020); meso-level influences including industrial structure, urbanization, policy environment, and agricultural mechanization (Lu et al., 2020; Chen et al., 2022); and micro-level factors including human capital, agricultural production behavior, and social capital (Nurul, 2019; Minviel et al., 2022; Wang H. et al., 2024). Nevertheless, two critical gaps remain. First, few studies integrate both carbon emissions and non-point pollution within a unified analytical framework. Second, most existing work often overlooks the micro-foundations of eco-efficiency, particularly the role of farmers’ perceptions.
To address these gaps, this study draws on survey data from 1,208 farm households in China’s major grain-producing areas to quantify both types of environmental pollutants. These undesirable outputs are incorporated into the SBM-Undesirable model to evaluate eco-efficiency and examine its key determinants. The findings aim to offer policy-relevant insights for promoting the sustainable development of China’s grain sector.
2 Materials and methods
2.1 Overview of the research area
During the reform of China’s grain distribution system, the government designated three major functional zones—major grain-producing areas, major grain-purchasing areas, and balanced grain production and consumption areas—based on provincial differences in grain production and consumption patterns, historical grain cultivation traditions, and regional variations in resource endowments across 31 provinces.
Since the founding of the People’s Republic of China, the spatial distribution of grain production has undergone significant changes. Initially, 12 of the 14 southern provinces were net grain exporters, with annual transfers exceeding 20 million tons. Even by the time of the reform and opening up, 7 southern provinces continued to export surplus grain. However, since then, the southern region has accelerated its industrialization and urbanization. Traditional grain-producing provinces, including Guangdong, Fujian, Zhejiang, and Jiangsu, began to prioritize economic development over agriculture. As a result, leading to a shift in grain cultivation patterns characterized by a “decline in the south and stability in the north”.
Grain production is a sector that relies heavily on land scale. Although southern China enjoys high land productivity, its per capita arable land is limited. Against this backdrop, many southern farmers transitioned into non-agricultural sectors or began cultivating high-value economic crops, leading to a continuous decline in grain-planting areas. At the same time, with improvements of agricultural technologies and mechanization, the comprehensive agricultural production capacity in northern China increased significantly. Consequently, the center of gravity for national grain growth has gradually shifted from south to north.
In the 21st century, China implemented a reform of its grain circulation system. Based on the overall characteristics of grain production and consumption across provinces, as well as differences in resource endowments and historical grain production traditions, the central government officially categorized the 31 provinces (including autonomous regions and municipalities) into the three aforementioned functional zones. This classification aimed to better coordinate national grain supply by aligning production, distribution, and consumption patterns with regional characteristics.
Among these regions, the major grain-producing areas are characterized by favorable natural conditions—including geography, soil quality and climate—that are well-suited for grain cultivation. These areas have high grain yields and a large proportion of land devoted to grain crops. In addition to achieving self-sufficiency, they are also capable of supplying substantial amount of commercial grain to other regions. Provinces in this category include Heilongjiang, Jilin, Liaoning, Inner Mongolia, Hebei, Henan, Shandong, Jiangsu, Anhui, Jiangxi, Hubei, Hunan and Sichuan. The major grain-purchasing areas, by contrast, are economically more developed but face land constraints and high population density, resulting in a significant gap between grain supply and demand. These areas include Beijing, Tianjin, Shanghai, Zhejiang, Fujian, Guangdong and Hainan. Balanced grain production and consumption areas contribute relatively less to national grain output but are generally able to achieve self-sufficiency. This group includes Shanxi, Ningxia, Qinghai, Gansu, Tibet, Yunnan, Guizhou, Chongqing, Guangxi, Shaanxi and Xinjiang. The government has designated the major grain-producing areas as a cornerstone of national food security. These areas not only reflect China’s overall grain production capacity but also serve as representative zones for assessing agricultural eco-efficiency and exploring its key determinants.
The major grain-producing areas constitute a vital foundation for ensuring China’s food security. The eco-efficiency of grain production in these areas plays a pivotal role in shaping both national food security and the prospects for green agricultural development. The data for this study were collected from a micro-level farm household survey conducted in October 2021 across three major grain-producing provinces of Heilongjiang, Henan, and Hunan. A multi-stage sampling method was employed, with the procedure outlined as follows:
In the first stage, three provinces were selected from among the 13 designated major grain-producing provinces in China1. The selection was based on a typical sampling method2, considering characteristics of geographic location, level of economic development, crop type, and maturity system. As a result, Heilongjiang, Henan and Hunan were chosen to represent three distinct geographic zones: the middle reaches of the Yellow River Basin and the middle reaches of the Yangtze River. These provinces also encompass China’s three major crop types—maize, wheat and rice—as well as three cropping systems: single-season, double-season and triple-season cultivation.
In the second stage, based on the clustering characteristics of six indicators, namely, resident population, GDP per capita, cultivated land area, the share of cultivated land area in municipal land area, the share of agricultural resident population in municipal resident population, and the share of agricultural output value in municipal GDP, and in combination with the sown area and yield level of major crops, three sample municipalities were taken in each sample province respectively using typical sampling method3.
In the third stage, based on geographic location and production of major grain crops, a typical sampling method4 was used to select two national-level grain-producing counties (districts) that are not geographically adjacent to each sample city.
In the fourth stage, two sample townships (townships) were selected in each sample county (district) using a typical sampling method5 according to the economic development status.
In the fifth stage, a random sampling method was used to select two sample villages in each sample township (town).
In the sixth stage, using the random sampling method6, 16 to 18 sample farm households were selected in each sample village respectively.
The study employed a structured survey approach comprising two types of questionnaires. The village questionnaire systematically collected data on the village’s basic socio-economic characteristics, topography and geomorphology, crop cultivation structure, the extent of agricultural production outsourcing, the main providers of outsourcing services, pricing across different production stages, and the proportion of outsourcing purchases. The farm household questionnaire comprises five core modules: (1) Individual and household characteristics, including age, education level, health status, and farming or off-farm employment experience. (2) Land resource endowment and land transfer status, such as farmland management practices, land transfers, soil quality, and cultivation types. (3) Grain production inputs and outsourcing behavior, covering production methods, input costs, outsourcing activities, and yields across different production stages. (4) Awareness and decision-making related to green technology, including farmers’ knowledge of, willingness to adopt, and actual use of green inputs and production technologies, as well as their awareness of, willingness to purchase, and types of agricultural production outsourcing services and (5) Asset allocation and risk management, including livestock and poultry breeding,7 participation in agricultural organizations, ownership of household machinery, household income and expenditure, agricultural insurance coverage and claims, risk preferences, and social capital. Data were collected through standardized face-to-face interviews, resulting in 1,242 completed questionnaires. After excluding inconsistent responses and samples with missing key variables, 1,208 valid responses were retained, yielding an effective sample rate of 97.26%. Of the valid samples, 416 were from Heilongjiang, 393 were from Henan, and 399 were from Hunan. Figure 1 shows the sample distribution.
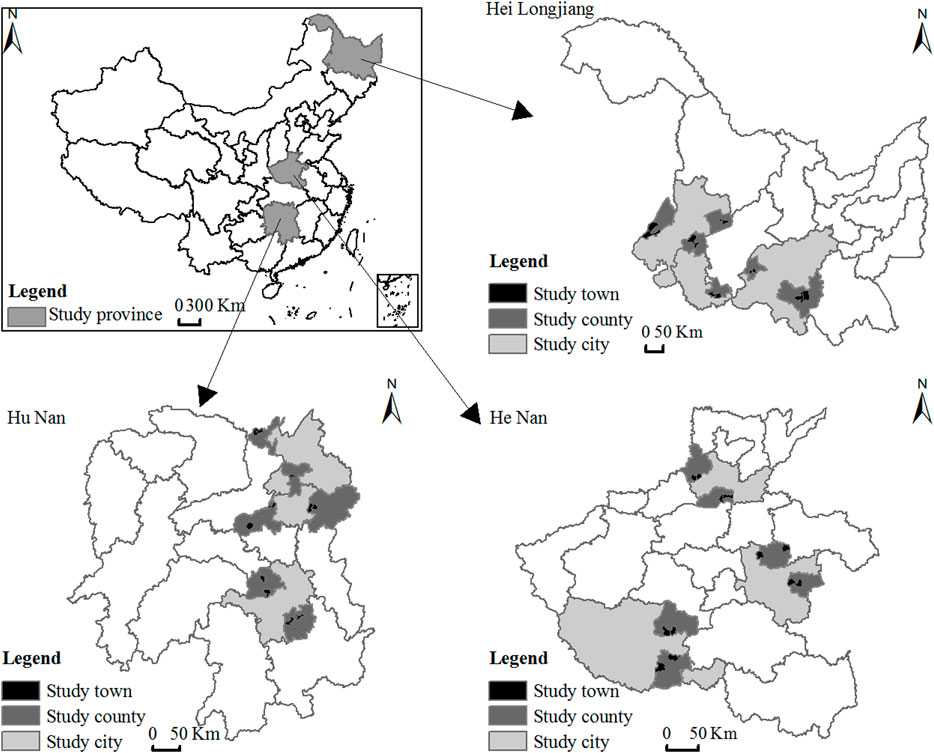
Figure 1. Sample distribution map.
The sample areas encompass three distinct geographical regions: the northeast, the middle reaches of the Yangtze River, and the middle reaches of the Yellow River basin. These areas include three major crop types: maize, wheat, and rice, and feature three crop maturity systems: single-season, double-season, and triple-season. This diversity provides strong regional representation. The survey collected data on farm households, agricultural production, regional meteorological conditions, disasters, and the cognitive attitudes of farmers in 2020. The data include gender, age, education level, household labor endowment, cultivation types, plot characteristics, agricultural labor, capital inputs, agricultural outputs, meteorological disaster types, frequency and intensity of disasters, and agricultural knowledge reserves. These data provide a rich empirical foundation for analyzing the eco-efficiency of China’s major grain-producing regions.
The basic characteristics of the sample farm households are presented in Table 1. More than 70% of household heads were aged 50 or older, nearly 80% had an education level of junior high school or below, and over 70% had 3 to 6 members. The household types were divided according to the ratio of farm income to the total income8. Among the farm households, pure farm households and part-time non-farm households were more prevalent, each accounting for over 30% of the total sample. This is followed by part-time farm households and non-farm households, accounting for 23.59% and 6.87%, respectively. The definition of farm size used in this study follows that of the Food and Agriculture Organization (FAO), which classifies farms of less than 2 ha as small-scale. Consequently, small-scale farms dominated the sample, accounting for 66.31%. Only 23.01% of the sample farmers were members of agricultural organizations, and nearly 90% of farm households owned fewer than six productive fixed assets. At present, the basic characteristics of the sample farm households align with the general conditions of China’s major grain-producing areas in China, which makes the sample highly representative.
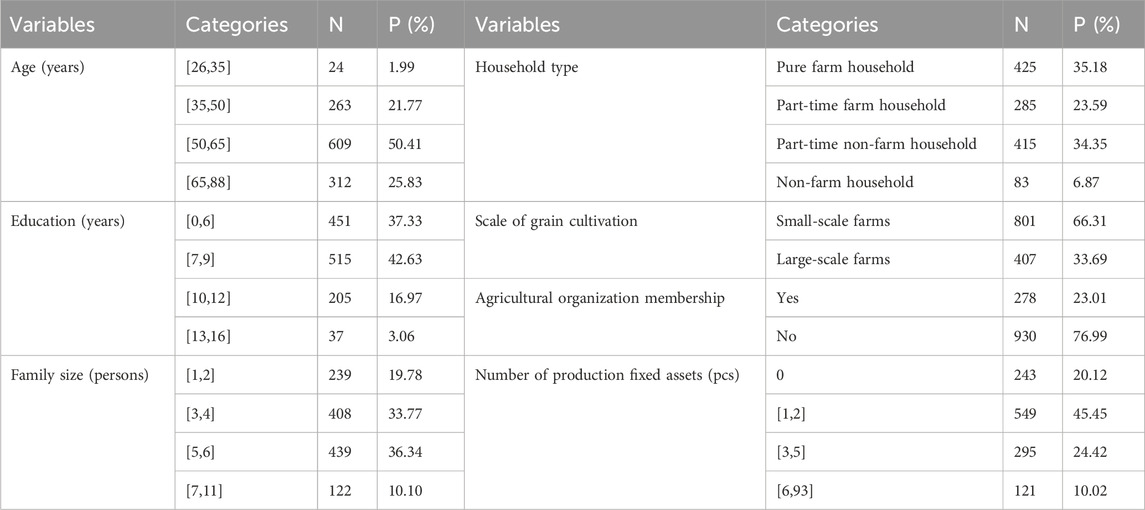
Table 1. Basic characteristics of the sample farmers.
2.2 Methods
2.2.1 Measurement model of eco-efficiency
Referring to Tone (2001), Chen et al. (2022), and Wu et al. (2023), a non-radial, non-angle SBM-Undesirable eco-efficiency evaluation model was constructed as follows:
Supposing that there are
The finite set of production possibilities
where
2.2.2 Analytical model of the determinants of eco-efficiency
Eco-efficiency is a variable with non-negative truncation characteristics of 0–1. For the estimation of such constrained dependent variables, the OLS method tends to yield biased estimation outcomes. The Tobit model is used for estimation as follows.
2.3 Variable selection
2.3.1 Measurement variables of eco-efficiency
2.3.1.1 Input variables
Following Lin et al. (2018) and Huan and Hou (2021), input variables in this study comprise three categories: labor input, capital inpt and land input. Among them, labor input is measured as total workdays (unit: workday) devoted to grain production by farm households in 2020. This aggregates all labor time across grain production stages. Capital input refers to the total monetary investment (unit: 10,000 yuan) farm households allocated to grain production in 2020, primarily comprising the sum of expenses on chemical fertilizers, pesticides, agricultural film, seeds, diesel fuel, electricity, hired labor, purchased machinery services, and depreciation of self-owned agricultural machinery9 etc. Land input is represented by the total sown area (unit: hectare) of grain crops cultivated by farm households in 2020, disregarding subsequent increases or decreases in harvested area due to natural or anthropogenic factors.
2.3.1.2 Desirable output variable
To address aggregation biases arising from heterogeneous crop types and varieties, following Zeng, L et al. (2020), desirable output is represented by the gross grain production value (unit: 10,000 yuan) of farm households in 2020.
2.3.1.3 Undesirable output variables
Undesirable outputs, as defined by Di Maria and Sisani (2019) and Zhuang et al. (2021), primarily denote various environmental pollution emissions from agricultural production, manifested in two primary forms: total agricultural non-point source pollution unit: 10,000 m3, dominated by losses of total phosphorus (TP), total nitrogen (TN), and chemical oxygen demand (COD) in water bodies; and total agricultural carbon emissions (unit: tonne), characterized by greenhouse gas (GHG) emissions from agricultural production. Primary pollutants and sources in grain production systems are illustrated in Figure 2. The specific calculation process and results of undesirable outputs are presented in Part IV.
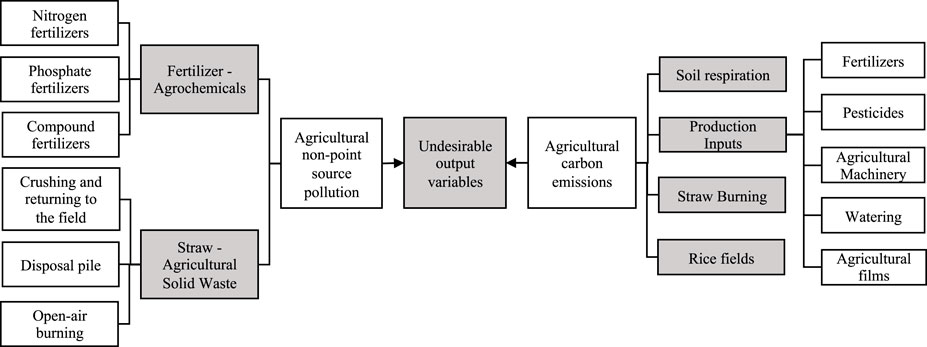
Figure 2. Primary pollutants and sources in grain production systems.
2.3.2 Determining variables of eco-efficiency
Based on relevant studies (Weerasekara et al., 2022; Ma and Li, 2021; Liu et al., 2018; Czyżewski, B et al., 2021; Tenaye, 2020), it is evident that eco-efficiency is co-determined by many factors, including regional natural environmental endowments, economic development level, farming practices, policy interventions, and farm household characteristics. Therefore, this study systematically examines determinants of eco-efficiency in China’s major grain-producing areas from four perspectives: household head attributes, family characteristics, agricultural production features, and regional traits. To identify enhancement pathways and diagnose inefficiency sources at the micro-level, key variables include household head’s age, household head’s education, household head’s health, family income, family size, non-farm employment, social capital, land quality, land fragmentation, grain-sown area, cropping index, agricultural subsidies, agricultural production outsourcing level, productive fixed assets, membership in agricultural organizations, agricultural technical training, meteorological disasters, residence-county distance, and provincial characteristics. Variable definitions and descriptive statistics are presented in Table 2.
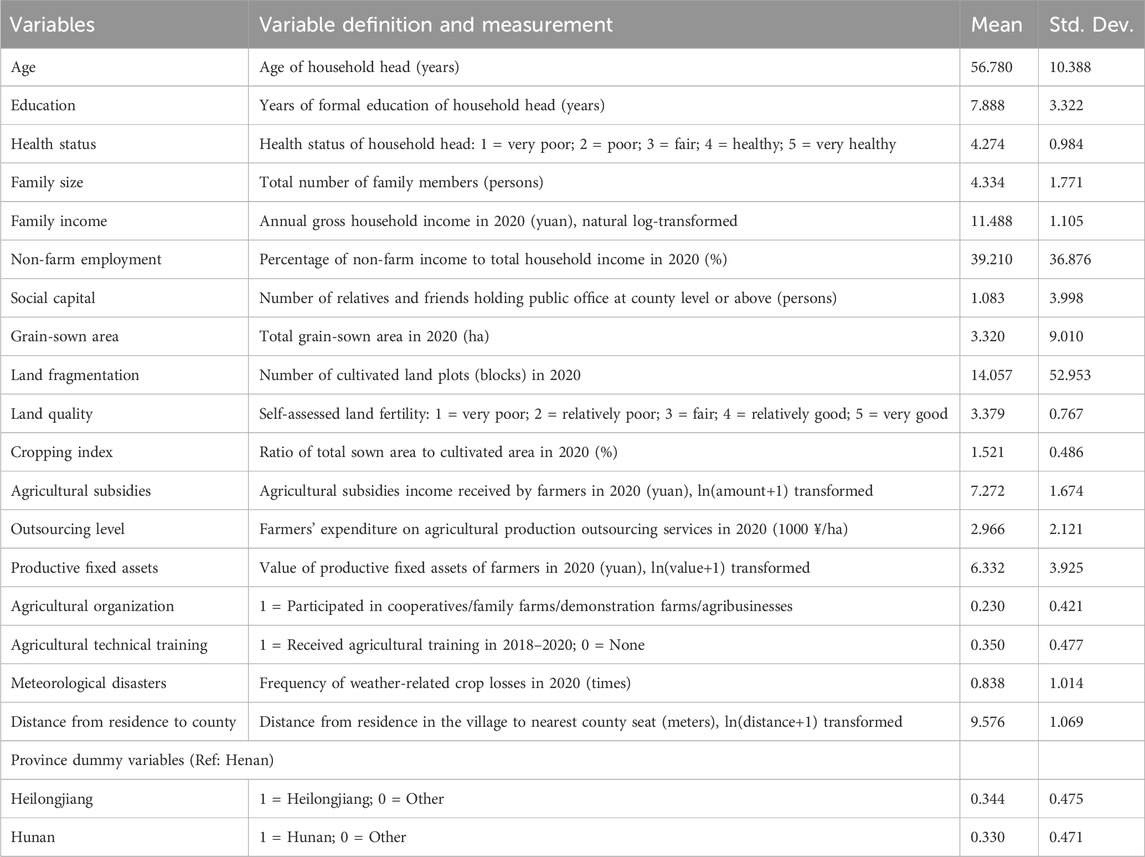
Table 2. Variable definitions and descriptive statistics.
3 Eco-efficiency measurement
3.1 Calculation of agricultural non-point source pollution emissions
Agricultural non-point source pollution emissions are calculated using the unit survey evaluation method (Lai et al., 2004). This method decomposes various pollution sources into pollution-producing elementary units (EUs) and quantifies emissions by establishing a relationship between the units, pollution generation, and pollution emissions. The calculation formula for each pollution unit is as follows:
In this model, EEE represents agricultural non-point source pollution emissions, and III denotes the indicator statistics of the unit UUU. α\alphaα is the pollution production intensity coefficient in the unit. β\betaβ is the utilization efficiency coefficient in the unit. The products of α\alphaα and β\betaβ represent the generation of agricultural pollution, which indicates the maximum potential pollution caused by agricultural production in the absence of integrated resource utilization or management factors. γ\gammaγ is the emission coefficient in the unit, which is measured by unit and spatial characteristics. This reflects the combined effects of hydrology, rainfall, regional environment, and management measures on agricultural pollution.
The pollution-producing units in grain production mainly include agrochemicals and farmland solid waste (Table 2). Given that fertilizer loss is the primary cause of non-point source pollution (Xiang et al., 2020; Liu et al., 2021), and straw is another significant contributor (Zou et al., 2020), this study highlights non-point source pollution resulting from fertilizer loss and straw. It calculates the emissions of chemical oxygen demand (COD), total phosphorus (TP), and total nitrogen (TN) under different fertilizer loss and straw management practices. Table 3 shows the list of agricultural non-point source pollution-producing units.
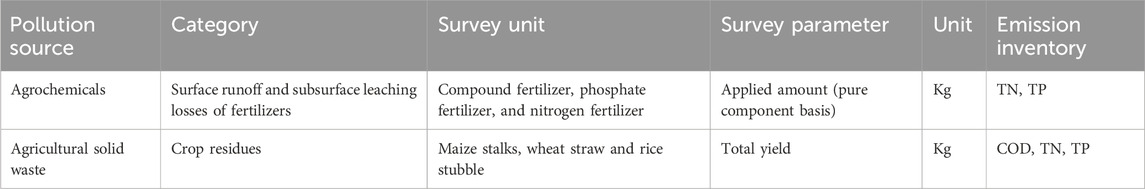
Table 3. Inventory of agricultural non-point source pollution generating units.
The parameters of pollution production intensity, utilization efficiency, and pollution emission coefficients for each pollutant were obtained through an extensive literature review and comparative analysis. The parameters provided in the Manual of Agricultural Source Coefficients in Pollution Source Census were highlighted referring to the work of Liang (2009), Lai et al. (2004), Chen et al. (2006), and Shi and Shang (2021). This approach allowed for considering regional variations in pollution intensity and establishing a comprehensive database of parameters related to pollution intensity coefficients, utilization coefficients, and loss coefficients for agricultural pollution in different pollution-producing units within the sample area.
Subsequently, total agricultural non-point source pollution was quantified as equivalent pollution emissions (in 104 m3) through convertion of TP, TN, and COD concentrations based on Class III water quality standards (GB3838-2002) (Qian, 2001; Chen et al., 2010). Specifically, the equivalent emissions are calculated by dividing measured pollutant concentrations by their respective standard limits: 0.2 mg/L for TP, 1.0 mg/L for TN, and 20 mg/L for COD.
3.2 Calculation of agricultural carbon emissions
Referring to existing studies (Gu et al., 2013; Tian et al., 2012; Shang et al., 2015; Cheng, 2018; Jane, 2007), six agricultural carbon sources were identified from four dimensions10: soil respiration, production inputs, straw burning, and rice fields, with detailed types, corresponding emission coefficients and reference basis presented in Table 4. The carbon emission levels were estimated using these coefficients (Table 4), which incorporated environmental characteristics, rainfall patterns, and resource endowments of the study areas. Subsequently, total agricultural carbon emissions were calculated by converting greenhouse gases into carbon equivalents (Ge et al., 2018), expressed in tons.
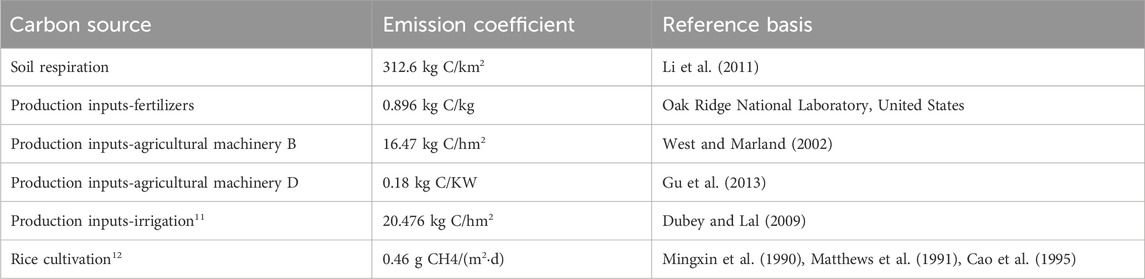
Table 4. Carbon emission inventory: sources, coefficients and reference basis.
The carbon emissions from soil respiration, production inputs, and rice fields are quantified using the following equation:
where
Following the methodologies outlined by Cao et al. (2007), Cao et al. (2005), Peng et al. (2016), Wang (2017), and relevant FAO guidelines, the carbon emissions from straw burning are quantified using the following formula:
where
To determine Maize, wheat, and rice straw-to-grain ratios, the parameters published by the National Development and Reform Commission were mainly used (see Table 5).
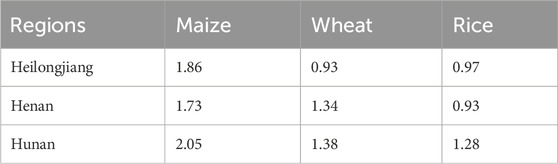
Table 5. The straw-grain ratios of different crops in sampled regions.
For the measurement of straw-burning efficiency, the straw-burning emission coefficient was determined by considering the differences in the emission coefficients for different crops based on the studies of Cao et al. (2005), Zhang (2009), Peng et al. (2016) and Wang (2017). The emission coefficients for straw-burning are shown in Table 6.
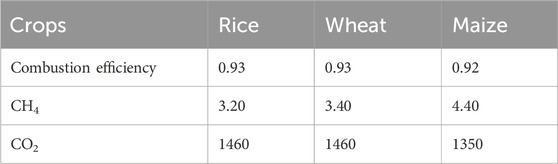
Table 6. Emission coefficients for straw burning.
In summary, the description and statistics of eco-efficiency input-output variables are shown in Table 7.
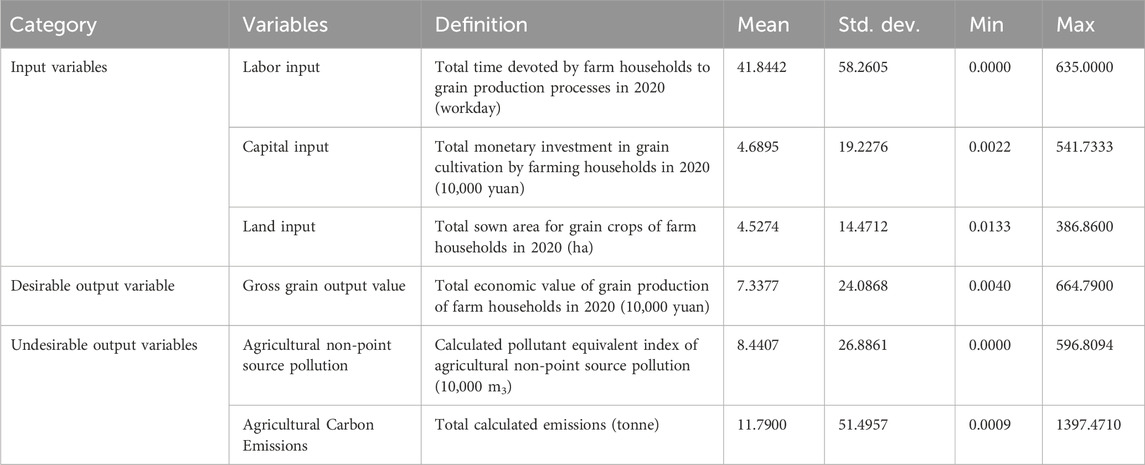
Table 7. Input-output variables: definitions and summary statistics.
3.3 Eco-efficiency measurement results
Since different constraints and orientation choices can lead to different measurement results, MaxDEA Ultra was used as the calculation platform to measure the eco-efficiency of each decision unit by using three constraints of variable returns to scale (VRS), general returns to scale (GRS), and constant returns to scale (CRS), as well as three forms13 of input orientation (IO), output orientation (OO), and non-orientation (NO). We set both the total desirable output weight and the total undesirable output weight to 1. The eco-efficiency values were calculated using data from 1,208 field surveys of farm households in China’s major grain-producing areas Table 8 presents the mean eco-efficiency values under different constraints and orientation choices. In terms of trends, the mean eco-efficiency values increased from CRS to GRS to VRS under the same orientation across both the total and provincial samples. Conversely, the mean eco-efficiency decreased from output-oriented to input-oriented to non-oriented under the same constraints.
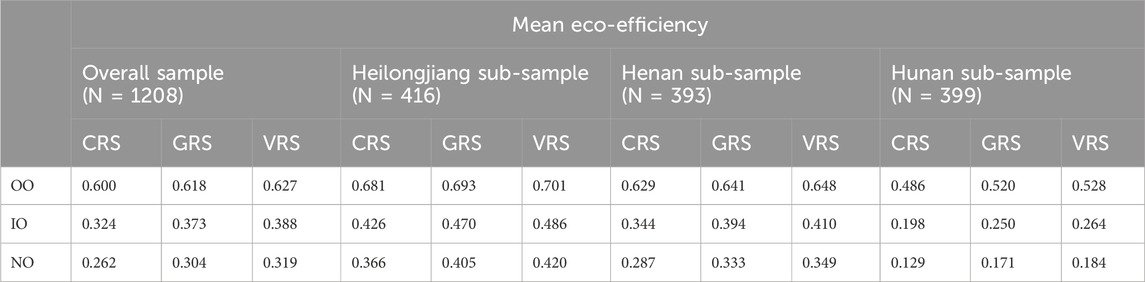
Table 8. Mean eco-efficiency under differential constraints and orientation options.
Generally, production technology exhibits three stages of returns to scale: decreasing returns to scale (DRS), constant returns to scale (CRS), and increasing returns to scale (IRS). If it is difficult to determine which stage the study sample is in, or if the sample spans all stages, the VRS model is recommended for evaluating technical efficiency (Cooper et al., 2006; Färe and Grosskopf, 1983; Grosskopf, 1986). The selection of model orientation relies primarily on the purpose of the analysis. If the goal is simply to obtain the efficiency value for each unit, all three orientations (input, output, and non-oriented) can be considered (Cheng and Qian, 2012). Given that Chinese farmers, particularly those involved in grain production, exhibit strong empirical and fixed behavioral patterns in their agricultural practices (Gao and Shi, 2019), output-oriented measurement is deemed more appropriate. Consequently, eco-efficiency values under the VRS and output-oriented (OO) settings were selected for the subsequent analysis.
The average eco-efficiency in grain-producing areas was 0.627, which is only slightly above the “passing threshold”. The mean eco-efficiency values for Heilongjiang, Henan, and Hunan were 0.701, 0.648, and 0.528 (Figure 3), respectively. It can be seen that the agricultural ecological efficiency value of the major grain-producing areas in China is not high, the ecological efficiency of the three major grain-producing provinces is significantly different, and the agricultural ecological efficiency of Hunan Province is the lowest. The possible reason is that compared with Heilongjiang and Henan Province, which are mainly plains, Hunan Province is dominated by hilly and mountainous terrain. This geographical feature leads to higher regulatory costs in the implementation of chemical fertilizer and pesticide reduction and efficiency policies. At the same time, the fragmentation of cultivated land in hilly areas has led to a generally low willingness of small-scale farmers to adopt environmental protection technologies, resulting in certain obstacles in the implementation of the policy. On the other hand, limits the popularization and application of mechanization. Although the region is rich in rainwater resources, it is easy to cause the waste of water resources and the spread of agricultural non-point source pollution due to the lag of farmland irrigation and drainage system construction. This finding aligns with the results of Aslam et al. (2021). This indicates, to some extent, that these areas are still in the rough-running agricultural development model, relying more on the input of resources and damage to the environment. Moreover, resources, environment, and agricultural development are in a relative imbalance. However, compared with the efficiency level before 201514 (Meng et al., 2019), the eco-efficiency of grain production has slightly improved.
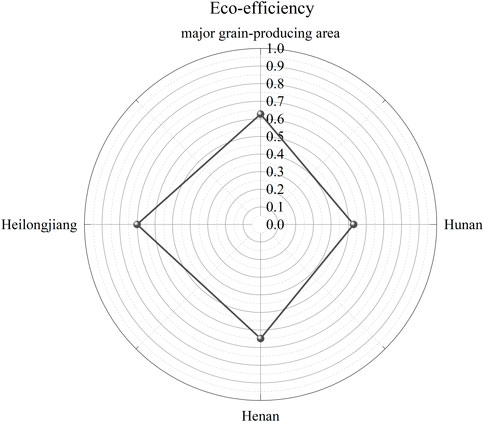
Figure 3. Radar chart of eco-efficiency performance.
To further assess eco-efficiency, the values of eco-efficiency were compared with those of traditional production efficiency. The results indicate that the average traditional production efficiency is 0.408, lower than the mean eco-efficiency, with a difference of 0.219. This finding aligns with the conclusions of Lv and Zhu (2019). The possible reason is that over the years, in the process of promoting agricultural development, China has gradually realized the importance of environmental pollution control, and has taken a series of measures to promote the coordinated development of agriculture and the environment, such as “Notice on Printing and Issuing the Construction Plan of the National Agricultural Sustainable Development Experimental Demonstration Zone”, “Notice on the Pilot Work of Carbon Emission Trading’ and other policies”, which have actively mobilized farmers’ enthusiasm for environmental protection production and effectively promoted the transformation of the grain industry to a green and low-carbon direction (Du et al., 2023; Yu et al., 2022). The preliminary research results of this study verify the applicability of the Porter Hypothesis in China’s agricultural development, that is, strict environmental regulation can promote farmers’ investment in green technology and sustainable production through technological innovation (Jing et al., 2024), so as to achieve a win-win situation between economic and environmental benefits.
4 Results and discussion
4.1 Baseline regression results for the determinants of eco-efficiency
To improve the accuracy of estimates, different determinants were progressively incorporated into the Tobit model, with the model estimation results labeled as Regression 1–Regression 4, all presented in Table 9. Regression 1 includes only the personal characteristics of household head, Regression 2 adds farm household characteristics, Regression 3 incorporates agricultural production and operational characteristics, and Regression 4 includes all variables. The chi-square test statistics gradually increase, its goodness-of-fit improves, and the estimated results remain consistent in terms of direction and significance levels. The analysis is based on the results from Regression 4.
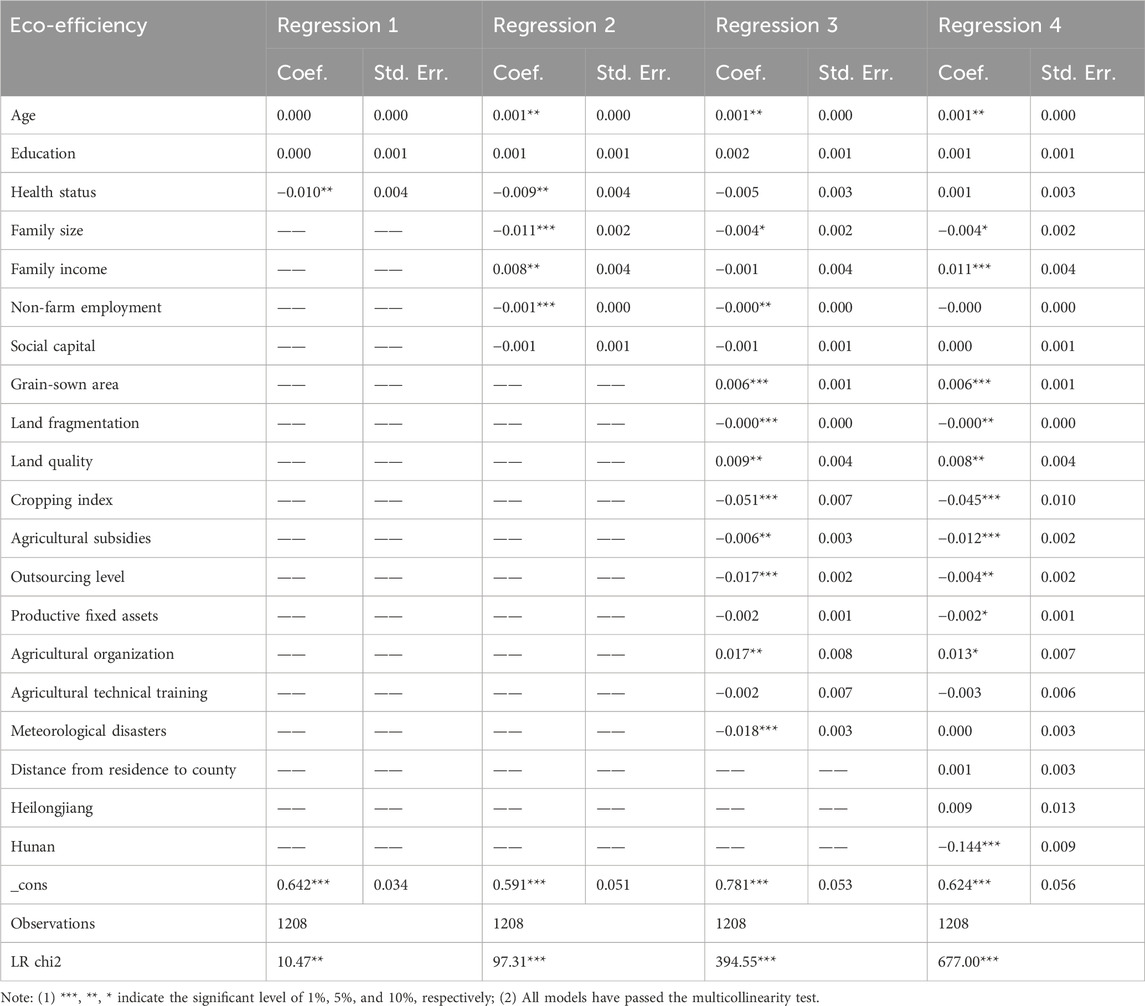
Table 9. Tobit regression results: determinants of eco-efficiency.
Regarding the personal characteristics of household heads, age has a positive impact on eco-efficiency at the 5% significance level, challenging the common perception that aging hinders agricultural development. This study suggests that aging does not pose an immediate threat to food security; rather, the older agricultural labor force may even make a positive contribution. This can be explained by two factors: first, older laborers tend to have higher technical efficiency (Shen et al., 2023; Seok et al., 2018); second, older laborers have fewer non-farm employment opportunities to dedicate more time and energy to agricultural production (Shen et al., 2024). This conclusion is somewhat supported by Li and Sicular (2013), who found that rural aging nationwide did not lead to a decline in grain production, but rather to an increase in the sown area and total grain production.
Concerning farm household characteristics, family size has a negative impact on eco-efficiency at the 10% significance level (Xu et al., 2021). Larger families are more likely to invest labor in agricultural production rather than in machinery, which may hinder the efficiency gains that machinery can provide. In addition, family income positively affects eco-efficiency at the 1% significance level. As family income increases, farmers may become less dependent on agricultural production (Sattar et al., 2024), which reduces their reliance on agrochemicals and enhances eco-efficiency. Additionally, higher income alleviates budget constraints, which may encourage the purchase of eco-friendly production materials and the adoption of new technologies. This is consistent with Li et al. (2024) at the regional level and (Zong et al., 2023) at the national level. Both of them demonstrate a positive association between eco-efficiency and income levels.
Regarding agricultural production characteristics, the grain-sown area positively affects eco-efficiency at the 1% significance level, which suggests that economies of scale are still present in China’s major grain-producing areas. Farmers can improve eco-efficiency by reallocating land, which is consistent with national studies (Lu et al., 2024; Zong et al., 2023). In contrast, land fragmentation negatively affects eco-efficiency at the 5% significance level, which aligns with the studies of Blaikie and Sadeque (2000); Hou et al. (2021). Land fragmentation leads to inefficient use of land, improper allocation of agricultural inputs, and increased loss of technical efficiency, which raises economic costs (Tenaye, 2020). Moreover, it discourages the adoption of new agricultural technologies and the development of farmland infrastructure (Lu et al., 2022).
Land quality positively affects eco-efficiency at the 5% significance level, which indicates that better land quality leads to higher crop yields and reduced demand for production inputs such as fertilizers and irrigation, thereby enhancing eco-efficiency. The cropping index also negatively affects eco-efficiency at the 1% significance level (Hou et al., 2021). Jiang et al. (2024) confirmed that increased cropping index necessitates greater inputs and continuous cropping tends to induce environmental hazards such as soil compaction, salinization, and soil-water erosion, consequently reducing eco-efficiency. Agricultural subsidies negatively affect eco-efficiency at the 1% significance level, which supports the research of (Guo et al., 2021). Subsidies alleviate the budget constraints of farmers, which can lead to the overuse of fertilizers and pesticides (Pan et al., 2022). Additionally, agricultural subsidies may limit output effects due to rising production costs and diminishing returns (Pan, 2016).
The negative influence of agricultural production outsourcing on eco-efficiency at the 5% significance level contrasts with Zhang et al. (2023) and Wang L. et al. (2024), but aligns with Zhang et al. (2015). It is suggested that information asymmetry between farmers and outsourcing providers may explain the reduced eco-efficiency, particularly due to the reduced quality of service from providers and excessive supervision from farmers. The presence of more productive fixed assets negatively affects eco-efficiency at the 10% significance level. Farmers with more productive assets may be inclined to use more agrochemicals to stabilize grain production, which leads to greater environmental pollution and lower eco-efficiency.
Finally, agricultural organization memberships positively influence eco-efficiency at the 10% significance level, likely due to their role in improving farmers’ knowledge, attitudes, and practices of green production. These organizations also help reduce transaction costs and negotiate better terms for farmers, which enhances eco-efficiency.
In terms of regional characteristics, Hunan negatively affects eco-efficiency at the 1% significance level, while no significant difference exists between Heilongjiang and Henan. This variation may be related to regional climatic conditions. Located in the mid-reach of the Yellow River Basin, Henan features flat terrain and abundant solar radiation, yet experiences significant diurnal temperature variations and spatially uneven precipitation. The region practices a double-cropping system, with wheat-maize rotation or wheat-rice rotation dominating grain production. Heilongjiang, situated in Northeast China, occupies a high-latitude continental plain characterized by synergistic hydrothermal regimes and phaeozem soils of exceptional fertility. The constrained growing season permits only single annual cropping, rendering it a quintessential low-input high-output agricultural system with minimal environmental externalities. In contrast, Hunan, located in the mid-Yangtze Basin, features hyperthermal conditions and copious precipitation sustained by dense arterial waterways. Dominated by paddy landscapes, it supports double/triple annual cropping rotations. However, its methanogenic rice cultivation constitutes a critical carbon footprint hotspot, epitomizing a high-input high-output paradigm with elevated pollution loading.
4.2 Heterogeneity analysis
The measured results of eco-efficiency in the sample areas reveal significant differences among Heilongjiang, Henan, and Hunan, with mean values of 0.701, 0.648, and 0.528, respectively.
This raises the question of whether the determinants of eco-efficiency also vary for farmers in different geographical regions. To this end, a regional sub-estimation was conducted. Table 10 shows the estimation results.
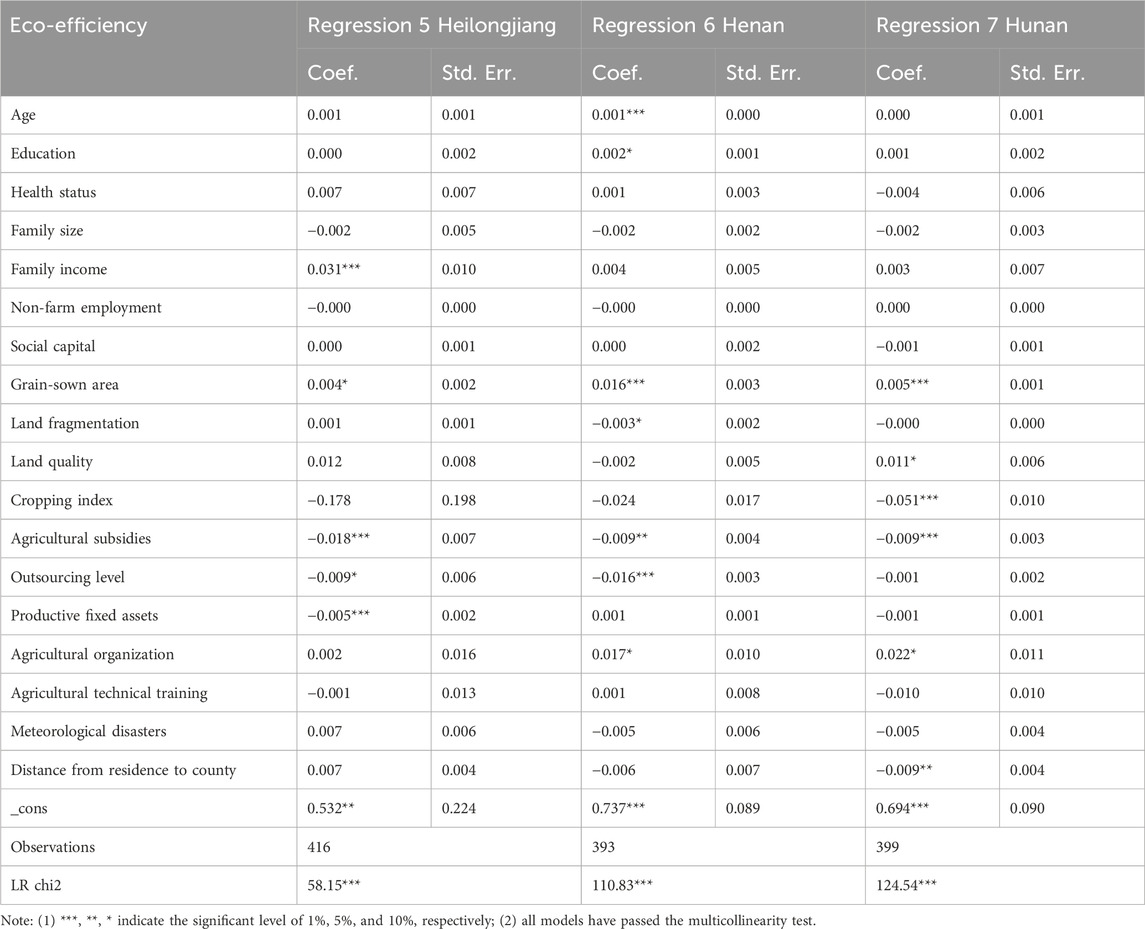
Table 10. Provincial-level regression analysis: determinants of eco-Efficiency.
Regressions 5 to 7 display the results for the determinants of eco-efficiency in Heilongjiang, Henan, and Hunan, respectively. Regional differences are evident, though the direction of effect and significance level of each factor closely mirror those in the total sample regression. Specifically, grain-sown area and agricultural subsidies consistently show significant effects across all regions. The grain-sown area positively influences eco-efficiency and agricultural subsidies have a negative impact.
In Henan, the household head’s age and education are positively associated with eco-efficiency, while land fragmentation has a negative effect. In Heilongjiang, family income has a positive effect, while productive fixed assets exert a negative influence. In Hunan, land quality positively affects eco-efficiency, while the cropping index and distance from residence to county town have negative effects.
Additionally, the negative effect of agricultural production outsourcing is insignificant in Hunan, while the positive effect of agricultural organization memberships is insignificant in Heilongjiang.
4.3 Robustness tests
The previous analysis examined the determinants of eco-efficiency based on eco-efficiency measurements under output orientation. To enhance the robustness of the results, the determinants of eco-efficiency were further analyzed under input orientation and non-orientation. This additional analysis helps mitigate potential biases in the results that may arise from the choice of orientation (Cooper et al., 2007; Tone, 2001). Table 11 shows the regression results. Regression 8 reports the results from the determinants of eco-efficiency under input orientation, while regression 9 presents the results under non-orientation. The direction of influence and significance levels of each variable remain consistent with those in the output orientation regression, which confirms the robustness and reliability of the findings.
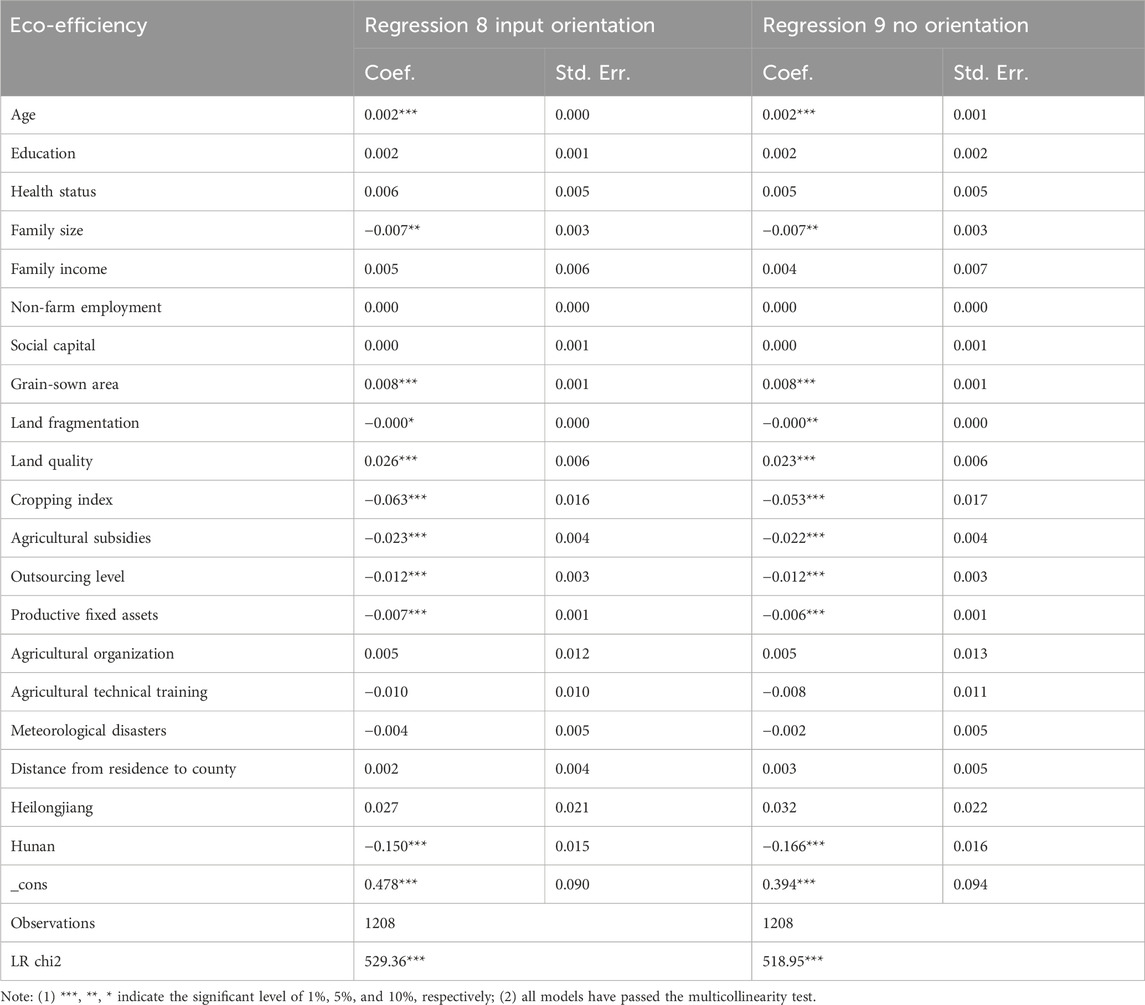
Table 11. Determinants of eco-efficiency under input-oriented and non-oriented models.
5 Conclusion and recommendations
This study adopts a micro-level perspective to evaluate the eco-efficiency of China’s major grain-producing areas, incorporating both agricultural carbon emissions and non-point source pollution. Using field survey data from 1,208 farm households and employing the SBM-Undesirable model, the study analyzes the determinants of eco-efficiency. The main findings are as follows:
(1) The average eco-efficiency score across China’s major grain-producing areas is 0.627—slightly above the old typically regarded as “passing”. At the provincial level, eco-efficiency values are 0.701 in Heilongjiang, 0.648 in Henan, and 0.528 in Hunan, revealing pronounced regional disparities.
(2) The mean eco-efficiency score (0.627) is 0.219 higher than the traditional production efficiency metric, suggesting that China has begun to decouple agricultural growth from environmental degradation. This finding provides preliminary empirical support for the Porter Hypothesis, which states that well-designed environmental regulation can enhance, rather than hinder, economic efficiency.
(3) Multiple factors significantly influence eco-efficiency in these regions. Positive contributors include household head’s age, family income, grain-sown area, land quality, and membership in agricultural organizations. In contrast, factors such as family size, land fragmentation, cropping index, agricultural subsidies, agricultural production outsourcing, and investment in fixed prodcutive assets tend to suppress eco-efficiency.
(4) The determinants of eco-efficiency exhibit regional heterogeneity. In Henan, promoting vocational education to enhance environmental awareness, encouraging land consolidation to mitigate fragmentation, and strengthening the extension functions of farmer cooperatives are key policy priorities. Furthermore, to harness the potential of the aging rural labor force, models such as Japan’s “senior farmers’ gardens” could be adapted to establish silver-haired agricultural service teams. However, the proliferation of pesticide overuse in outsourced production underscores the need for tighter regulation. In Heilongjiang, excessive investment in fixed agricultural assets reflects management inefficiencies within large-scale farming operations, echoing the energy inefficiency concerns associated with over-mechanization in the American Midwest. This calls for improved asset utilization and precision management in mechanized farming systems. For Hunan, the focus should be on enhancing soil quality—potentially through targeted subsidies for eco-efficiency soil improvement practices, as seen in South Korea—and optimizing crop rotation systems, drawing lessons from Thailand’s rice—green manure rotation model. Additionally, empowering farmers in remote and ecologically fragile areas through digital agriculture initiatives—modeled after the European Union’s smart farming programs—could help alleviate productivity constraints associated with geographic disadvantages.
Compared with the ecological degradation resulting from large-scale monoculture expansion in Brazil, the three provincial cases in China demonstrate the potential for achieving agricultural intensification and ecological sustainability in a synergistic manner. However, compared to France’s cluster-based agricultural development, land fragmentation and insufficient regulation of agricultural production outsourcing services remain fundamental challenges in China. Future policies need to build a comprehensive “three-in-one” framework: At the technical level, efforts should focus on promoting precision agriculture to minimize redundant investments, exemplified by initiatives such as the Heilongjiang Agricultural Machinery Sharing Platform. At the institutional level, environmental standards for outsourcing services need to be strengthened, including the formation of a cross-regional regulatory alliance between Henan and Heilongjiang provinces. At the organizational level, the development of age-friendly cooperatives—drawing on Henan’s experience—and the provision of digital support for remote suburban areas, as piloted in Hunan, are essential. Collectively, these measures aim to effectively address the “intensification trap” and “marginalization dilemma”, providing a uniquely Chinese approach to advancing green transformation in major global grain-producing regions.
Currently, China’s major grain-producing regions remain entrenched in an extensive model of agricultural development, characterized by heavy reliance on resource inputs and environmental degradation to sustain production. This has resulted in a persistent imbalance among resource use, environmental sustainability, and agricultural development. Greater attention from government agencies, farmers, and other relevant stakeholders is urgently needed to enhance agricultural eco-efficiency. From a policy perspective, it is critical to integrate environmental concerns into agricultural development strategies. Policymakers should prioritize the promotion of low-carbon technologies and practices that reduce non-point source pollution, while formulating region-specific strategies tailored to local ecological conditions. Such differentiated approaches can improve the effectiveness of policy interventions and optimize eco-efficiency outcomes across China’s diverse grain-producing regions. In addition, intergovernmental cooperation can facilitate the design of unified yet adaptable frameworks for agricultural environmental sustainability. From the farmers’erspective, policy incentives should encourage land consolidation through farmland transfer to expand operational scale and mitigate land fragmentation. In addition, farmers should be encouraged to diversify their operations and reduce their dependence on traditional resource-intensive methods. Expanding access to financial support and targeted credit for sustainable agricultural technologies will further facilitate the transition toward a more eco-efficient model. From the standpoint of other stakeholders in the agricultural sector—including agribusinesses, non-governmental organizations, and research institutions—efforts should focus on advancing technological innovation and accelerating the adoption of sustainable agricultural practices. In addition, stakeholders should also help build a stronger and more integrated system by promoting dialogue and technical assistance to narrow the gap between farmers and policymakers, thereby improving the agricultural eco-efficiency of the entire region.
In summary, this study makes several important contributions. First, a more comprehensive measure of eco-efficiency is provided by incorporating agricultural carbon emissions and non-point source pollution. Second, the adoption of a non-radial, non-angle SBM model allows for more accurate eco-efficiency measurement, which overcomes the limitations of traditional radial models. Third, a clearer evaluation of agricultural development in China’s major grain-producing areas is performed by comparing eco-efficiency with traditional production efficiency. Fourth, the determinants of eco-efficiency are identified and discussed from four dimensions (household head characteristics, farm household characteristics, agricultural production and operation characteristics, and regional characteristics), which propose feasible paths for improvement. These findings provide valuable insights for policymakers and farmers to face agricultural and environmental challenges. Fifth, regional differences are further analyzed to increase the applicability of the findings.
6 Research limitations and perspectives
Despite the contribution of this study, several limitations warrant further refinement in subsequent research. First, due to data constraints, the selected output and input indicators are not fully comprehensive. Important environmental factors such as agricultural pollution from pesticide use and plastic film residues were not accounted for, which could be incorporated in future datasets to enhance measurement accuracy. Second, constrained by limited space, this study does not examine the heterogeneity of eco-efficiency across different farm sizes and crop types. Future research could explore these dimensions in greater depth to provide a more nuanced understanding. Third, although the Tobit model is a suitable approach for analyzing the determinants of eco-efficiency, some explanatory variables (e.g., family income, land fragmentation, agricultural subsidies) may suffer from endogeneity, potentially biasing the estimation results. Due to current data and methodological constrains, this study does not address endogeneity using techniques such as instrumental variables. Future research may mitigate this issue as more suitable data become available. Fourth, this study relies on cross-sectional data, which limits the ability to identify the temporal effects of climate variables on farm-level eco-efficiency. Future studies could integrate high-resolution meteorological time-series data or adopt panel data methods to address this limitation and improve the robustness of temporal inferences. Fifth, this analysis is based on a one-time farm household research data, which limits the availability of longitudinal tracking information and may constrain the examination of dynamic trends or causal relationships. Additionally, the absence of administrative or remotely sensed data for validation may affect the external validity of the results, particularly in macro-level or cross-regional analyses. To address this, future research could incorporate micro-level panel data, such as constructed farm household tracking surveys or official agricultural census data, and enhance causal inference through quasi-natural experiments, panel instrumental variable approaches, or other advanced econometric techniques. Moreover, an integrated analytical framework combing remotely sensed data with official statistics could improve the external validity of the findings and facilitate regional policy comparisons. Sixth, although the subjective indicators of land quality and health status used in this study were designed with standardized scales and supported by interviewer interpretation to minimize respondent bias, these deliberately positioned as farmer perspectives or “subjective assessments”. This approach aims to capture farmers’ behavioral responses to perceived resource conditions rather than treating these variables as objective physical inputs. While this is consistent with prevailing practices in agricultural economics, self-reported variables may still introduce potential biases. In future research, the objectivity and precision of these indicators could be improved through the integration of remote sensing data, soil testing, and agronomic health records.
Data availability statement
The data analyzed in this study is subject to the following licenses/restrictions: The data for this study was obtained from personal research and is confidential, so it cannot be shared. Requests to access these datasets should be directed to Chang Qian, MTQ5MjRAc2ljYXUuZWR1LmNu.
Author contributions
CQi: Writing – original draft, Project administration, Supervision, Writing – review and editing, Funding acquisition. CXi: Writing – review and editing, Formal Analysis, Visualization. YQ: Writing – review and editing. ZY: Writing – review and editing. HX: Writing – review and editing, Methodology. TX: Methodology, Writing – review and editing. LY: Writing – review and editing, Visualization, Formal Analysis.
Funding
The author(s) declare that financial support was received for the research and/or publication of this article. This study is sponsored by National Natural Science Foundation of China (NSFC) Youth Program: Research on the Mechanism through which Agricultural Service Outsourcing Influences the Eco-Efficiency of Grain Production under China’s Carbon Peaking and Carbon Neutrality Goals (No. 72303168); Postdoctoral Fellowship Program of CPSF (No. GZC20231864) and Natural Science Foundation of Sichuan Province: Research on the Assessment and Enhancement Mechanism of the Eco-Efficiency of Grain Production in the Tianfu Granary (No. 2024NSFSC1083).
Conflict of interest
The authors declare that the research was conducted in the absence of any commercial or financial relationships that could be construed as a potential conflict of interest.
Generative AI statement
The author(s) declare that no Generative AI was used in the creation of this manuscript.
Publisher’s note
All claims expressed in this article are solely those of the authors and do not necessarily represent those of their affiliated organizations, or those of the publisher, the editors and the reviewers. Any product that may be evaluated in this article, or claim that may be made by its manufacturer, is not guaranteed or endorsed by the publisher.
Footnotes
1The division of China’s major grain-producing areas originated with the 2001 reform of the grain circulation system. On the basis of the overall characteristics of grain production and consumption in each province, and taking into account such factors as differences in resource endowments and historical traditions of grain production, the State divides China’s 31 provinces (autonomous regions and municipalities) into three functional areas: the major grain-producing area, the area of balanced production and marketing, and the main marketing area. There are 13 provinces in the major grain production area, including Heilongjiang, Jilin, Liaoning, Inner Mongolia, Hebei, Henan, Shandong, Jiangsu, Anhui, Jiangxi, Hubei, Hunan and Sichuan; 11 provinces in the production and marketing balance area, including Shanxi, Ningxia, Qinghai, Gansu, Tibet, Yunnan, Guizhou, Chongqing, Guangxi, Shaanxi and Xinjiang; and 7 provinces in the main marketing area, including Beijing, Tianjin, Shanghai, Zhejiang, Fujian, Guangdong and Hainan. There are 7 provinces in the main sales area, including Beijing, Tianjin, Shanghai, Zhejiang, Fujian, Guangdong and Hainan.
2At this stage, typical sampling was used, and the selection of sample provinces was based on the researchers’ judgment and specific objectives. This may not fully represent all internal differences among the 13 major producing provinces, and there is a risk of incomplete sampling frame coverage or subjective selection bias, which limits the strict generalisability of the results to all major producing provinces.
3The subjectivity of typical sampling at this stage may lead to bias in the representativeness of the selected cities, failing to cover all types of areas within the province.
4This stage focuses on national-level grain-producing counties, which may overlook non-national-level but important grain-producing counties or counties of different types, resulting in an overrepresentation of “typical” large counties and an underrepresentation of other types of counties.
5Typical sampling based on economic conditions may make the sample townships representative in terms of economic development, but it may overlook the diversity of other important characteristics (such as terrain and subtle differences in crop structure).
6The last two stages used random sampling to improve representativeness within villages and households, but their representativeness was strictly limited to the sample townships and sample villages selected in the previous stages. In multistage sampling, potential biases in the upper stages (especially the typical sampling stage) can be transmitted and affect the representativeness of the final sample. Terminal random sampling cannot correct for systematic biases introduced by non-probability sampling in the upper stages.
7It should be emphasized that, the multi-stage sampling framework (province→municipality→county→township) employed purposive selection of typical grain-producing regions as defined by provincial agricultural authorities. The representativeness of the final sample mainly reflects the “typical” situation in the “typical” grain-producing cities, counties, and townships in Heilongjiang, Henan, and Hunan provinces as defined by the researchers. Any inferences should be cautiously limited to this scope. There are certain limitations to strictly generalizing the results to non-typical areas within the three provinces or other major grain-producing provinces nationwide.
8The classification is defined as follows: pure farm households derive more than 95% of their total income from agriculture; part-time farm households derive greater than 50% but less than or equal to 95% from agriculture; part-time non-farm households derive greater than 5% but less than or equal to 50% from agriculture; and non-farm households derive less than or equal to 5% from agriculture.
9Calculation of depreciation costs for self-owned agricultural machinery: Depreciation of fixed assets is typically calculated using either the straight-line method or units-of-production method. For agricultural machinery, given the relatively consistent annual workload and operational patterns across years, the straight-line method is conventionally applied. In this study, the depreciation cost is calculated as the product of the original machinery value and the annual depreciation rate. Distinct annual depreciation rates apply to different machinery types, determined by the ratio of (1 minus the estimated net residual value rate) to the depreciation period. Herein, the estimated net residual value rate is typically set at 3%–5% of the original value; this study adopts 4%. Depreciation periods are referenced from the Depreciation Schedule for Agricultural Machinery in State Farms issued by Finance and Ministry of Agriculture, Animal Husbandry and Fisheries of China.
10Unfortunately, due to data constraints in the survey, this study excludes carbon emissions from pesticide and agricultural plastic film production and usage in the agricultural carbon accounting framework. Moreover, for emissions generated by agricultural machinery operation, only indirect emissions were considered, while direct emissions were excluded from the calculation. However, these exclusions do not materially compromise the integrity of our assessment, as fertilizer application and rice cultivation—the dominant contributors to plantation carbon emissions—are fully incorporated in the accounting framework.
11Since indirect carbon emissions originate exclusively from fossil fuel consumption in thermal power generation, applying the unadjusted coefficient of 25 kg/hm2 for agricultural irrigation—as reported by Li et al. (2011)—fails to account for energy mix variations. This coefficient must instead be scaled by the thermal power share (i.e., the proportion of fossil-based electricity in total generation). We therefore applied a thermal power coefficient of 0.891, derived from China Statistical Yearbooks (2004–2008), yielding a refined emission factor of 20.476 kg C/hm2 for agricultural irrigation.
12The IPCC Fourth Assessment Report (2007) established that the greenhouse effect caused by 1 ton of CH4 is equivalent to that caused by 25 tons of CO2 (about 6.82 t C). Using this standardized conversion, the methane emission coefficient for rice paddies was converted to 3.137 g C/(m2·d). Furthermore, accounting for varietal and regional heterogeneity in rice growth cycles, we defined region-specific cultivation periods based on IPCC guidelines and empirical field data from China: 145 days for Heilongjiang (japonica), 87 days for Henan, and 85 days for early-season indica rice in Hunan.
13Input orientation refers to minimizing inputs while holding outputs constant. Output orientation denotes maximizing outputs given fixed input levels. Non-oriented approach measures efficiency through simultaneous input reduction and output expansion, thus termed bidirectional input-output optimization.
14The eco-efficiency values were compared with 2015 levels, coinciding with China’s enactment of the One Control, Two Reductions, and Three Basics policy for emission reduction and carbon sequestration measures such as land fallowing.
References
Adejumo, O. O. (2020). Environmental quality vs economic growth in a developing economy: complements or conflicts. Environ. Sci. Pollut. Res. 27 (6), 6163–6179. doi:10.1007/s11356-019-07101-x
Adisa, O., Ilugbusi, B. S., Adelekan, O. A., Asuzu, O. F., and Ndubuisi, N. L. (2024). A comprehensive review of redefining agricultural economics for sustainable development: overcoming challenges and seizing opportunities in a changing world. World J. Adv. Res. Rev. 21 (1), 2329–2341. doi:10.30574/wjarr.2024.21.1.0322
Akbar, U., Li, Q., Akmal, M. A., Shakib, M., and Iqbal, W. (2021). Nexus between agro-ecological efficiency and carbon emission transfer: evidence from China. Environ. Sci. Pollut. Res. 28, 18995–19007. doi:10.1007/s11356-020-09614-2
Aslam, M. S., Xue, P. H., Bashir, S., Alfakhri, Y., Nurunnabi, M., and Nguyen, V. C. (2021). Assessment of rice and wheat production efficiency based on data envelopment analysis. Environ. Sci. Pollut. Res. 28, 38522–38534. doi:10.1007/s11356-021-12892-z
Blaikie, P. M., and Sadeque, S. Z. (2000). Policy in high places: environment and development in the Himalayan region. PublisherInternational Centre for Integrated Mountain Development ICIMOD: Nepal.
Cao, G., Zhang, X., Wang, Y., and Zheng, F. (2007). Estimation of regional emissions from open burning of agricultural straw in China. Sci. Bull. 52, 1826–1831. doi:10.3321/j.issn:0023-074x.2007.15.017
Cao, G. L., Zhang, S. H., Wang, D., and Zheng, F. C. (2005). Inventory of atmospheric pollutants discharged from biomass burning in China continent. China Environ. Sci. 25, 389–393. doi:10.3321/j.issn:1000-6923.2005.04.002
Cao, M., Dent, J. B., and Heal, O. W. (1995). Methane emissions from China's paddyland. Agric. Ecosyst. and Environ. 55, 129–137. doi:10.1016/0167-8809(95)00613-W
Chen, F., Qiao, G., Wang, N., and Zhang, D. (2022). Study on the influence of population urbanization on agricultural eco-efficiency and on agricultural eco-efficiency remeasuring in China. Sustainability 14 (20), 12996. doi:10.3390/su142012996
Chen, M. P., Chen, J. N., and Lai, S. W. (2006). Inventory analysis and spatial distribution of Chinese agricultural and rural pollution. Chin. Environ. Sci. 26, 751–755. doi:10.3321/j.issn:1000-6923.2006.06.025
Chen, Y., Feng, Y. Z., and Yang, Q. H. (2010). Validation of environmental Kuznets curves for agricultural nonpoint source pollution in Shaanxi Province. Agric. Technol. Econ., 22–29. doi:10.13246/j.cnki.jae.2010.07.010
Cheng, G., and Qian, Z. (2012). Conceptual framework and measurement methods for evaluating health system efficiency: methodological issues in applying data envelopment analysis. China Health Policy Res. 5 (3), 52–60. doi:10.3969/j.issn.1674-2982.2012.03.011
Cheng, L. (2018). Spatial and temporal divergence of agricultural carbon productivity in China: mechanism and empirical evidence. Huazhong Agric. Univ. doi:10.27158/d.cnki.ghznu.2018.000060
Cooper, W. W., Seiford, L. M., and Tone, K. (2007). Data envelopment analysis: a comprehensive text with models, applications, references and DEA-solver software. Springer. doi:10.1007/b109347
Cooper, W. W., Seiford, L. M., and Tone, K. (2006). Data envelopment analysis: a comprehensive text with models,applications,references and DEA-solver software. Springer science and business media.
Czyżewski, B., Matuszczak, A., Grzelak, A., Guth, M., and Majchrzak, A. (2021). Environmental sustainable value in agriculture revisited: how does Common Agricultural Policy contribute to eco-efficiency? Sustain. Sci. 16, 137–152. doi:10.1007/s11625-020-00834-6
Di Maria, F., and Sisani, F. (2019). A sustainability assessment for use on land or wastewater treatment of the digestate from bio-waste. Waste Manag. 87, 741–750. doi:10.1016/j.wasman.2019.03.015
Du, Y., Liu, H., Huang, H., and Li, X. (2023). The carbon emission reduction effect of agricultural policy——evidence from China. J. Clean. Prod. 406, 137005. doi:10.1016/j.jclepro.2023.137005
Dubey, A., and Lal, R. (2009). Carbon footprint and sustainability of agricultural production systems in Punjab, India, and Ohio, USA. J. Crop Improv. 23, 332–350. doi:10.1080/15427520902969906
Färe, R., and Grosskopf, S. (1983). Measuring congestion in production. Zeitschrift für nationalökonomie/journal Econ. 43, 257–271. doi:10.1007/bf01283574
Fuhrmann-Aoyagi, M. B., Miura, K., and Watanabe, K. (2024). Sustainability in Japan’s agriculture: an analysis of current approaches. Sustainability 16 (2), 596. doi:10.3390/su16020596
Gao, J. J., and Shi, Q. H. (2019). The impact of farmers' productive characteristics on pesticide application: mechanisms and evidence. China Rural. Econ., 83–99. doi:10.3390/ijerph18031112
Ge, P., Wang, S., and Huang, X. (2018). Measuring green total factor productivity in Chinese agriculture. China Population-Resources Environ. 28, 66–74. doi:10.12062/cpre.20171010
Grassauer, F., Herndl, M., Nemecek, T., Guggenberger, T., Fritz, C., Steinwidder, A., et al. (2021). Eco-efficiency of farms considering multiple functions of agriculture: concept and results from Austrian farms. J. Clean. Prod. 297, 126662. doi:10.1016/j.jclepro.2021.126662
Grosskopf, S. (1986). The role of the reference technology in measuring productive efficiency. Econ. J. 96, 499–513. doi:10.2307/2233129
Gu, J., Liangsong, Z., Lai, Z., Sun, L., and Chen, W. (2013). The construction of low-carbon wan-jiang belt:problems and solutions. J. Shijiazhuang Coll. 15, 83–89. doi:10.3969/j.issn.1673-1972.2013.06.016
Guo, L., Li, H., Cao, X., Cao, A., and Huang, M. (2021). Effect of agricultural subsidies on the use of chemical fertilizer. J. Environ. Manag. 299, 113621. doi:10.1016/j.jenvman.2021.113621
Hou, X., Liu, J., Zhang, D., Zhao, M., and Yin, Y. (2021). Effect of landscape-scale farmland fragmentation on the ecological efficiency of farmland use: a case study of the Yangtze River Economic Belt, China. Environ. Sci. Pollut. Res. 28, 26935–26947. doi:10.1007/s11356-021-12523-7
Huan, M. L., and Hou, Y. X. (2021). Agricultural machinery services, structural change of rural labor force and technical efficiency of food production in China. J. Huazhong Agric. Univ. Soc. Sci. Ed., 69–80+177. doi:10.13300/j.cnki.hnwkxb.2021.01.009
Huang, X., and Yao, Y. (2022). Measurement evaluation and driving factors of green development efficiency: a case study of the Yangtze River Economic Belt. Price Theory and Pract. (6), 7–11+42. doi:10.19851/j.cnki.cn11-1010/f.2022.06.288
Jane, M. F. J., Franzluebbers, A. J., Weyers, S. L., and Reicosky, D. C. (2007). Agricultural opportunities to mitigate greenhouse gas emissions. Environ. Pollut. 150 (1), 107–124. doi:10.1016/j.envpol.2007.06.030
Jie, H., Khan, I., Alharthi, M., Zafar, M. W., and Saeed, A. (2023). Sustainable energy policy, socio-economic development, and ecological footprint: the economic significance of natural resources, population growth, and industrial development. Util. Policy 81, 101490. doi:10.1016/j.jup.2023.101490
Jing, Z., Liu, Z., Wang, T., and Zhang, X. (2024). The impact of environmental regulation on green TFP: a quasi-natural experiment based on China's carbon emissions trading pilot policy. Energy 306, 132357. doi:10.1016/j.energy.2024.132357
Lai, S. Y., Du, P. F., and Chen, J. Y. (2004). A methodology for investigating and assessing nonpoint source pollution based on unit analysis. J. Tsinghua Univ. Technol. 2004 (09), 1184–1187. doi:10.16511/j.cnki.qhdxxb.2004.09.009
Li, B., Zhang, J. B., and Li, H. P. (2011). Spatial-temporal characteristics and influencing factors decomposition of agricultural carbon emissions in China. China Popul. Resour. Environ. 21 (08), 80–86. doi:10.3969/j.issn.1002-2104.2011.08.013
Li, M., and Sicular, T. (2013). Aging of the labor force and technical efficiency in crop production: evidence from Liaoning province, China. China Agric. 5, 342–359. doi:10.1108/CAER-01-2012-0001
Li, P., He, L., Zhang, J., Han, H., and Song, Y. (2024). Research on the impact of agricultural socialization services on the ecological efficiency of agricultural land use. Land 13 (6), 853. doi:10.3390/land13060853
Li, T., Hong, X., Liu, S., Wu, X., Fu, S., Liang, Y., et al. (2022). Cropland degradation and nutrient overload on Hainan Island: a review and synthesis. Environ. Pollut. 313, 120100. doi:10.1016/j.envpol.2022.120100
Liang, L. T. (2009). Research on spatial and temporal characteristics of rural ecological environment and its evolution law. Nanjing: Nanjing Agricultural University.
Liao, J., Yu, C., Feng, Z., Zhao, H., Wu, K., and Ma, X. (2021). Spatial differentiation characteristics and driving factors of agricultural eco-efficiency in Chinese provinces from the perspective of ecosystem services. J. Clean. Prod. 288, 125466. doi:10.1016/j.jclepro.2020.125466
Lin, W. S., Wang, Z. G., and Wang, M. Y. (2018). Agricultural land rights, factor allocation and agricultural production efficiency--an empirical analysis based on China's labor dynamics survey. Chin. Rural. Econ. (8), 64–82. doi:10.20077/j.cnki.11-1262/f.2018.08.005
Liu, L., Zheng, X., Wei, X., Kai, Z., and Xu, Y. (2021). Excessive application of chemical fertilizer and organophosphorus pesticides induced total phosphorus loss from planting causing surface water eutrophication. Sci. Rep. 11 (1), 23015. doi:10.1038/s41598-021-02521-7
Liu, Y., Zhang, Z., and Zhou, Y. (2018). Efficiency of construction land allocation in China: an econometric analysis of panel data. Land Use Policy 74, 261–272. doi:10.1016/j.landusepol.2017.03.030
Liu, Y., Zou, L., and Wang, Y. (2020). Spatial-temporal characteristics and influencing factors of agricultural eco-efficiency in China in recent 40 years. Land Use Policy 97, 104794. doi:10.1016/j.landusepol.2020.104794
Lu, D., Zhang, X., Yang, D., and Zhang, S. (2025). What affects agricultural green total factor productivity in China? A configurational perspective based on dynamic fuzzy-set qualitative comparative analysis. Agriculture 15 (2), 136. doi:10.3390/agriculture15020136
Lu, H., Chen, Y., Huan, H., and Duan, N. (2022). Analyzing cultivated land protection behavior from the perspective of land fragmentation and farmland transfer: evidence from farmers in rural China. Front. Environ. Sci. 10, 901097. doi:10.3389/fenvs.2022.901097
Lu, H., Chen, Y., and Luo, J. (2024). Development of green and low-carbon agriculture through grain production agglomeration and agricultural environmental efficiency improvement in China. J. Clean. Prod. 442, 141128. doi:10.1016/j.jclepro.2024.141128
Lu, X., Yang, X., and Chen, Z. (2020). Measurement and temporal-spatial evolution characteristics of urban land green use efficiency in China. China Population. Resour. Environ. 30 (8), 83–91. doi:10.12062/cpre.20200107
Lv, N., and Zhu, L. (2019). Research on agricultural environmental technical efficiency and green total factor productivity growth in China. J. Agric. Technol. Econ. (04), 95–103. doi:10.13246/j.cnki.jae.2019.04.017
Ma, J., and Li, Z. (2021). Does digital financial inclusion affect agricultural eco-efficiency? A case study on China. Agronomy 11 (10), 1949. doi:10.3390/agronomy11101949
Ma, X., and Mu, Y. (2024). Evaluation of environmental technical efficiency in grain production from carbon perspective: based on super-efficiency SBM-Undesirable model. Chin. J. Agric. Resour. Regional Plan. 45 (3), 26–35. doi:10.7621/cjarrp.1005-9121.20240303
Malan, H., Zeng, L., Liu, C., Li, X., and Wang, H. (2022). Research on the eco-efficiency of rice production and its improvement path: a case study from China. Int. J. Environ. Res. Public Health 19 (14), 8645. doi:10.3390/ijerph19148645
Matthews, E., Fung, I., and Lerner, J. (1991). Methane emission from rice cultivation: geographic and seasonal distribution of cultivated areas and emissions. Glob. Biogeochem. Cycles 5 (1), 3–24. doi:10.1029/90GB02311
Meng, X. H., Zhou, H. C., Du, L. Y., and Shen, G. Y. (2019). Changes in agricultural environmental technology efficiency and green total factor productivity growth in China: a Re-examination based on the perspective of seed combination. Issues Agric. Econ. (06), 9–22. doi:10.13246/j.cnki.iae.20190612.001
Mingxing, W., Aiguo, D., Renxing, S., Schitz, H., Rennenberg, H., Seiler, W., et al. (1990). CH 4 emission from a Chinese rice paddy field. J. Meteorological Res. 4 (3), 265–275.
Minviel, J. J., Fares, M., Blazy, J. M., and Thomas, A. (2022). Technical efficiency and complementarity of agroecological innovations in French West Indies banana production. Appl. Econ. Lett. 30 (18), 2652–2656. doi:10.1080/13504851.2022.2103074
Mumtaz, M., Hussain, N., Baqar, Z., Anwar, S., and Bilal, M. (2021). Deciphering the impact of novel coronavirus pandemic on agricultural sustainability, food security, and socio-economic sectors—a review. Environ. Sci. Pollut. Res. 28, 49410–49424. doi:10.1007/s11356-021-15728-y
Nurul, H., and Maruf, A. (2019). Analisis pengaruh modal sosial terhadap produktivitas usahatani padi: studi kasus desa timbulharjo, kecamatan sewon, kabupaten bantul. J. Econ. Res. Soc. Sci. 3. doi:10.18196/jerss.030212
Pan, S. (2016). The effectiveness of China's agricultural subsidy policies: theoretical analysis, empirical testing and policy optimization. Dalian: Dongbei University of Finance and Economics.
Pan, S., Di, C., Chandio, A. A., Sargani, G. R., and Zhang, H. (2022). Investigating the impact of grain subsidy policy on farmers’ green production behavior: recent evidence from China. Agriculture 12 (8), 1191. doi:10.3390/agriculture12081191
Pang, J. X., Chen, X. P., Zhang, Z. L., and Li, H. J. (2016). Measuring eco-efficiency of agriculture in China. Sustainability 8, 398–15. doi:10.3390/su8040398
Peng, L., Zhang, Q., and He, K. (2016). A pollutant emission inventory of crop straw burning based on surveys in China. Environ. Sci. Res. 29 (8), 1109–1118. doi:10.13198/j.issn.1001-6929
Puertas, R., Guaita-Martinez, J. M., Carracedo, P., and Ribeiro-Soriano, D. (2022). Analysis of European environmental policies: improving decision making through eco-efficiency. Technol. Soc. 70, 102053. doi:10.1016/j.techsoc.2022.102053
Qian, X. H. (2001). Investigation and evaluation of agricultural non-point source pollution in hangjiahu plain and countermeasures for its control. Zhejiang: Zhejiang University.
Sattar, A., Brown, C., Rounsevell, M., and Alexander, P. (2024). Typology analysis of Egyptian agricultural households reveals increasing income diversification and abandonment of agricultural activities. Agric. Syst. 218, 104000. doi:10.1016/j.agsy.2024.104000
Seok, J. H., Moon, H., Kim, G., and Reed, M. R. (2018). Is aging the important factor for sustainable agricultural development in Korea? Evidence from the relationship between aging and farm technical efficiency. Sustainability 10 (7), 2137. doi:10.3390/su10072137
Shang, J., Geng, Z., Chen, X., Zhao, J., Geng, R., and Wang, S. (2015). Effects of biochar application on soil organic carbon, nitrogen and its components in rainfed farmland. J. Agric. Environ. Sci. 34 (3), 509–517. doi:10.11654/jaes.2015.03.013
Shen, D., Liang, H., and Shi, W. (2023). Rural population aging, capital deepening, and agricultural labor productivity. Sustainability 15 (10), 8331. doi:10.3390/su15108331
Shen, D., Wang, L., and Cai, L. (2024). Aging agricultural labor force, outsourcing service of pest control and biopesticide application: a case study of 10 counties in Fujian Province. Front. Sustain. Food Syst. 8, 1333053. doi:10.3389/fsufs.2024.1333053
Shi, K. H., and Shang, J. (2021). Evolutionary trajectory, effect evaluation and optimization suggestions of agricultural surface pollution control policies. Reform 327 (05), 146–155.
Song, Y., Zhang, B., Wang, J., and Kwek, K. (2022). The impact of climate change on China’s agricultural green total factor productivity. Technol. Forecast. Soc. Change 185, 122054. doi:10.1016/j.techfore.2022.122054
Tenaye, A. (2020). Technical efficiency of smallholder agriculture in developing countries: the case of Ethiopia. Economies 8 (2), 34. doi:10.3390/economies8020034
Tian, Y., Li, B., and Zhang, J. B. (2012). Measurement of the contribution rate of rice technology progress in China. Stat. and Decis. Mak. (2), 93–95. doi:10.13546/j.cnki.tjyjc.2012.02.032
Tone, K. (2004). Dealing with undesirable outputs in DEA:A slacks-based measure(SBM)approach. Toronto: Presentation at NAPW Ⅲ, 4445.
Tone, K. (2001). A slacks-based measure of efficiency in data envelopment analysis. Eur. J. Operational Res. 130 (3), 498–509. doi:10.1016/S0377-2217(99)00407-5
Wang, G., Shi, R., Mi, L., and Hu, J. (2022). Agricultural eco-efficiency: challenges and progress. Sustainability 14 (3), 1051. doi:10.3390/su14031051
Wang, G., Zhao, M., Zhao, B., Liu, X., and Wang, Y. (2025). Reshaping agriculture eco-efficiency in China: from greenhouse gas perspective. Ecol. Indic. 172, 113268. doi:10.1016/j.ecolind.2025.113268
Wang, H., Han, J., and Yu, X. (2024a). Who performs better? The heterogeneity of grain production eco-efficiency: evidence from unsupervised machine learning. Environ. Impact Assess. Rev. 106, 107530. doi:10.1016/j.eiar.2024.107530
Wang, J. (2017). Study on the characteristics and emission scale of biomass straw burning pollutants. Hangzhou: Zhejiang University.
Wang, L., Gao, X., Yuan, R., and Luo, M. (2024b). Impact and spatial effect of socialized services on agricultural eco-efficiency in China: evidence from Jiangxi province. Sustainability 16 (1), 360. doi:10.3390/su16010360
Wang, S., Zhao, R. Q., Yang, Q. L., Xiao, L. G., Yang, W. J., Yu, J., et al. (2020a). Agricultural production efficiency and spatial pattern under carbon emission constraint: based on 65 villages of Henan province. J. Nat. Resour. 35 (9), 2092–2104. doi:10.31497/zrzyxb.20200905
Wang, X., and Liu, Y. (2024). Enhancing agricultural ecological efficiency in China: an evolution and pathways under the carbon neutrality vision. Land 13 (2), 187. doi:10.3390/land13020187
Wang, F., Wu, L., and Zhang, F. (2020). Network structure and influencing factors of agricultural science and technology innovation spatial correlation network—a study based on data from 30 provinces in China. Symmetry 12 (11), 1773. doi:10.3390/sym12111773
Weerasekara, S., Wilson, C., Lee, B., and Hoang, V. N. (2021). Impact of natural disasters on the efficiency of agricultural production: an exemplar from rice farming in Sri Lanka. Clim. Dev. 14 (2), 133–146. doi:10.1080/17565529.2021.1893635
West, T. O., and Marland, G. (2002). A synthesis of carbon sequestration,carbone missions,and net carbon flux in agriculture:comparing tillage practices in the United States. Agric. Ecosyst. Environ. 91, 217–232. doi:10.1016/S0167-8809(01)00233-X
Wu, G., Riaz, N., and Dong, R. (2023). China’s agricultural ecological efficiency and spatial spillover effect. Environ. Dev. Sustain. 25 (4), 3073–3098. doi:10.1007/s10668-022-02169-x
Xiang, H., Wang, Y. H., Huang, Q. Q., and Yang, Q. Y. (2020). How much is the eco-efficiency of agricultural production in west China? Evidence from the village level data. Int. J. Environ. Res. Public Health 17 (11), 4049. doi:10.3390/ijerph17114049
Xie, R., and Teo, T. S. (2022). Green technology innovation, environmental externality, and the cleaner upgrading of industrial structure in China—considering the moderating effect of environmental regulation. Technol. Forecast. Soc. Change 184, 122020. doi:10.1016/j.techfore.2022.122020
Xu, H., Bei, M., and Gao, Q. (2021). Assessing the environmental efficiency of grain production and their spatial effects: case study of major grain production areas in China. Front. Environ. Sci. 9. doi:10.3389/fenvs.2021.774343
Yu, Z., Mao, S., and Lin, Q. (2022). Has China’s carbon emissions trading pilot policy improved agricultural green total factor productivity? Agriculture 12 (9), 1444. doi:10.3390/agriculture12091444
Zeng, L., Li, X., and Ruiz-Menjivar, J. (2020). The effect of crop diversity on agricultural eco-efficiency in China: a blessing or a curse? J. Clean. Prod. 276, 124243. doi:10.1016/j.jclepro.2020.124243
Zhan, S. (2022). The political economy of food import and self-reliance in China: 1949-2019. Glob. Food Hist. 8 (3), 194–212. doi:10.1080/20549547.2021.2012082
Zhan, X., Lv, J., and Xue, Y. (2023). Research on the ecological efficiency of different rice cultivation modes: based on the grey water footprint model and the SBM-undesirable model. Agric. Econ. (12), 29–31. doi:10.3969/j.issn.1001-6139.2023.12.008
Zhang, H. F. (2009). Laboratory simulation of emission characteristics of gaseous and particulate pollutants from crop straw combustion in China. Shanghai: Fudan University.
Zhang, P., Lu, H., Geng, X., and Chen, Y. (2023). How do outsourcing services affect agricultural eco-efficiency? Perspectives from farmland scale and technology substitution. J. Environ. Plan. Manag. 68 (2), 338–362. doi:10.1080/09640568.2023.2246170
Zhang, Q., Zhang, F., Wu, G., and Mai, Q. (2021). Spatial spillover effects of grain production efficiency in China: measurement and scope. J. Clean. Prod. 278 (2), 121062. doi:10.1016/j.jclepro.2020.121062
Zhang, X., Davidson, E., Mauzerall, D., Searchinger, T., Dumas, P., and Shen, Y. (2015). Managing nitrogen for sustainable development. Nature (7580), 51–59. doi:10.1038/nature15743
Zhong, F. N. (2016). Correctly understanding food security and agricultural labour costs. Probl. Agric. Econ. 37 (01), 4−9+110. doi:10.13246/j.cnki.iae.2016.01.001
Zhou, Y., Li, X., and Liu, Y. (2020). Land use change and driving factors in rural China during the period 1995-2015. Land use policy 99, 105048. doi:10.1016/j.landusepol.2020.105048
Zhuang, X., Li, Z., Zheng, R., Na, S., and Zhou, Y. (2021). Research on the efficiency and improvement of rural development in China: based on two-stage network SBM model. Sustainability 13 (5), 2914. doi:10.3390/su13052914
Zong, Y., Ma, L., Shi, Z., and Gong, M. (2023). Agricultural eco-efficiency response and its influencing factors from the perspective of rural population outflowing: a case study in qinan county, China. Int. J. Environ. Res. Public Health 20 (2), 1016. doi:10.3390/ijerph20021016
Keywords: food security, farmer behavior, SBM-Undesirable model, carbon emissions, agricultural non-point source pollution
Citation: Qian C, Xiang C, Qiuyue Y, Yiping Z, Xianglin H, Xinyuan T and Yijin L (2025) Eco-efficiency and its determinants of major grain-producing areas in China. Front. Environ. Sci. 13:1597439. doi: 10.3389/fenvs.2025.1597439
Received: 24 March 2025; Accepted: 24 June 2025;
Published: 14 August 2025.
Edited by:
Niaz Ali, Hazara University, PakistanReviewed by:
Imran Ali Baig, National Institute of Technology, Hamirpur, IndiaNoor Muhammad, Hebei Agricultural University, China
Copyright © 2025 Qian, Xiang, Qiuyue, Yiping, Xianglin, Xinyuan and Yijin. This is an open-access article distributed under the terms of the Creative Commons Attribution License (CC BY). The use, distribution or reproduction in other forums is permitted, provided the original author(s) and the copyright owner(s) are credited and that the original publication in this journal is cited, in accordance with accepted academic practice. No use, distribution or reproduction is permitted which does not comply with these terms.
*Correspondence: Li Yijin, MjAyMzIwOTA4MEBzdHUuc2ljYXUuZWR1LmNu