 Meng Liu
 Han Yu
 Mousong Wu
- International Institute for Earth System Science (ESSI), Nanjing University, Nanjing, China
Introduction: The increasing frequency of compound heat events (CHEs), including compound dry-hot events (CDHEs) and compound humid-hot events (CHHEs), poses significant threats to terrestrial ecosystems. While previous studies have examined the independent and combined effects of drought and heat on vegetation productivity, the specific roles of CHHEs and the differential impacts of CDHEs and CHHEs remain poorly understood.
Methods: Using Gross Primary Productivity (GPP) estimated from satellite-based near-infrared reflectance (NIRv), monthly meteorological data and the Standardized Precipitation Evapotranspiration Index (SPEI), this study calculated the Standardized Compound Event Indicator (SCEI) to quantify the severity of CHEs, and investigated the immediate and lagged effects of CDHEs and CHHEs on global GPP from 2001 to 2018.
Results: Our results demonstrated that CDHEs occurred more frequently and with greater severity than CHHEs during the study period. The immediate effects of CDHEs reduced GPP in 68% of vegetated areas, whereas CHHEs enhanced GPP in 58% of vegetated areas. Globally, CDHEs and CHHEs caused net GPP changes of −5.26 Pg C yr−1 and 1.67 Pg C yr−1, respectively. In contrast, GPP in the polar zone, boreal shrubs, and boreal grasslands increased during CDHEs and decreased during CHHEs, with average net GPP changes of 0.17 Pg C yr−1 and −0.04 Pg C yr−1, respectively. Additionally, lag effects were most prominent in the periods of 0 to 3 months and 10 to 12 months post-event.
Discussion: These findings highlight the contrasting impacts of compound dry- and humid-hot events on ecosystem carbon fluxes and provide a better understanding of global carbon cycles under climate extremes.
1 Introduction
Terrestrial ecosystem is an important carbon sink, driving the seasonal fluctuations of global carbon dioxide concentrations and providing feedback on global warming (Houghton et al., 1998; Le Quéré et al., 2009; Ruehr et al., 2023). Gross Primary Productivity (GPP), which represents the total amount of carbon fixed by terrestrial vegetation through photosynthesis, is a crucial indicator reflecting the productivity of terrestrial ecosystems and regional carbon fluxes (Pinker et al., 2010; Wang J. et al., 2021; Xiao et al., 2019). In recent years, global temperature increases have exacerbated the frequency and severity of extreme heat events (CHEs), which have significantly impacted variations in terrestrial GPP (IPCC, 2021; Luo et al., 2024; Tang et al., 2025; Xu et al., 2019). Therefore, it is essential to investigate the effects of CHEs on vegetation productivity over different regions of the world.
Extreme heat events are typically categorized into two types based on variations in atmospheric moisture content: compound dry-hot events (CDHEs) and compound humid-hot events (CHHEs) (Buzan and Huber, 2020; Meng et al., 2022; Wang P. et al., 2021). While these two types of CHEs exhibit similar extreme nature, they differ markedly in spatiotemporal pattern and their impacts on terrestrial ecosystems (Fan et al., 2024; Gampe et al., 2021; Ting et al., 2023). Previous studies have mainly examined the individual and combined effects of heat and drought on GPP, demonstrating that extreme heat and drought impair photosynthesis at both physiological and canopy levels while limiting water availability, ultimately causing a decline in GPP (Von Buttlar et al., 2018; Zhang et al., 2016; Zhao and Running, 2010). For instance, the 2003 heat and drought in Europe resulted in a 30% reduction in GPP, which translated into a significant anomalous net source of carbon dioxide (0.5 Pg C yr−1) to the atmosphere (Ciais et al., 2005). Yuan et al. (2016) found that the severe heat and drought in southern China during the summer of 2013 led to a substantial decline in GPP, with an average crop yield loss of 90.91 kg ha−1. Furthermore, studies based on remote sensing data and probabilistic assessments have revealed that the combined effects of heat and drought on vegetation productivity exceeds the effects of an individual stressor. In arid and semi-arid regions, the probability of vegetation productivity reduction under CDHEs increases by 7% and 28% compared to individual drought or heat conditions, respectively (Hao et al., 2021; Zhu et al., 2021). Despite the extensive research on the impacts of CDHEs on vegetation productivity, studies on the combined effects of CHHEs remain scarce. Some field-controlled experiments have examined changes in vegetation productivity under wet conditions, suggesting that increased precipitation can alleviate water stress and enhance vegetation productivity, but excessive moisture coupled with high temperatures may lead to waterlogging, oxygen deprivation, and increased susceptibility to diseases, potentially offsetting the benefits of enhanced water availability (Lahlali et al., 2024; Lesk et al., 2022; Tian et al., 2021; Velásquez et al., 2018). Although these preliminary findings highlight the importance of CHEs, there is still lack of systematic and global-scale research to quantitatively assess their impacts on vegetation productivity.
The influences of CHEs on vegetation productivity manifest as immediate effects and lagged effects. The immediate effects refer to concurrent changes in vegetation during extreme events, such as reductions in stomatal conductance and photosynthetic rates (Grimmer et al., 2012; Kang et al., 2024; Teskey et al., 2015). In contrast, lagged effects represent a “memory” of past extreme climatic events, influencing current ecosystem functioning (Cranko Page et al., 2023; Zhao et al., 2020). Previous studies have demonstrated that CHEs exert direct stress on plant physiological processes while indirectly disrupting ecosystem water and heat balances, leading to delayed impacts on vegetation productivity. For example, Dong et al. (2025) reported the lagged effects of compound high-temperature and high-precipitation events on boreal forest ecosystems, with lag time of 1 month in 16.9% of the area, 2 months in 15.5%, and 3 months in 16.5%. Zhou et al. (2024) observed a shortening of the lagged response time of vegetation to CDHEs, suggesting heightened sensitivity of vegetation to these events. Moreover, vegetation responses to CHEs vary markedly across ecosystems and climatic zones (Von Buttlar et al., 2018). Forests, owing to their greater resistance, are less vulnerable to the combined stresses of high temperature and drought compared to grasslands (Flach et al., 2021; Rammig et al., 2015). In arid and semi-arid regions, water deficits triggered by CDHEs are slower to recover, exerting prolonged adverse effects on vegetation productivity (Hao et al., 2021; Schwalm et al., 2017; Wei et al., 2022). These variations underscore the adaptive capacity of vegetation to extreme climatic events and emphasize the need to investigate the impacts of CHEs on vegetation productivity across diverse lagged timeframes and spatial scales.
In this study, we utilized global monthly GPP based on satellite near-infrared reflectance (NIRv), air temperature dataset, and the Standardized Precipitation-Evapotranspiration Index (SPEI) to explore the differential impacts of CDHEs and CHHEs on global vegetation productivity during 2001–2018. To achieve our goal, we hypothesized that: 1) CDHEs and CHHEs exert differential impacts on GPP, with spatial differences across vegetation types and climate zones; 2) These impacts vary temporally, including both immediate and lagged effects that differ by hemisphere and biome. By exploring how CDHEs and CHHEs shape GPP dynamics, this study provides valuable insights for improving carbon sink estimates and enhancing ecosystem functioning assessments under extreme climates.
2 Materials and methods
2.1 Data and pre-process
We used monthly SPEI from SPEIbase v2.5 (Beguería et al., 2014; Vicente-Serrano et al., 2010) to characterize the global drought conditions with a spatial resolution of 0.5°. Monthly mean air temperature, minimum temperature (Tmn), maximum temperature (Tmx) and precipitation (PRE) data were obtained from a commonly utilized climate dataset, CRU TS v.4.03 (Harris et al., 2020). We also collected the soil moisture (SM) from the Global Land Evaporation Amsterdam Model (GLEAM) (Martens et al., 2017). Vapor pressure deficit (VPD) were derived from ERA5 (Muñoz-Sabater et al., 2021). The GPP data derived from NIRv spanning 2001 to 2018 (NIRv-GPP) (Wang et al., 2020) was used to represent the vegetation productivity. The NIRv-GPP, with a spatial resolution of 0.05°, has shown good performance on capturing the seasonal and inter-annual variations in global GPP (Zhang Y. et al., 2022). All data were resampled to 0.5° to match the spatial resolution of SPEI.
Long-term trends and seasonal variations in vegetation observations can potentially influence analysis metrics. The Seasonal and Trend decomposition using Loess (STL) method, which decomposes a time series into seasonal, trend, and residual components through locally weighted regression (Loess), is widely used for detecting anomalous fluctuations in vegetation indices (Rojo et al., 2017; Zhou et al., 2024). In this study, we applied STL to remove both trend and seasonal components from the raw GPP time series, enabling a clearer focus on short-term GPP variations. Additionally, following Zscheischler et al. (2014), the monthly air temperature was calculated as the Standardized Temperature Index (STI) to facilitate the comparison of air temperature time series across different locations and to make the air temperature indicators comparable with the SPEI.
2.2 Landcover reclassification
We used MODIS land cover data based on the International Geosphere-Biosphere Programme (IGBP) classification scheme to statistically analyze the effects of CHEs on different vegetation types. Considering that vegetation of the same type may respond distinctly to extreme events across various climate zones (Li et al., 2022; Ren et al., 2023), our study reclassified global vegetation into 13 types based on MODIS IGBP land cover and Köppen–Geiger climate zone data (Huang and Zhai, 2025). Following Huang et al. (2019), the original 17 land cover types were first grouped into 9 major vegetation types: evergreen needleleaf forest (ENF), evergreen broadleaf forest (EBF), deciduous needleleaf forest (DNF), deciduous broadleaf forest (DBF), mixed forest (MF), shrubland (SHR), savanna (SAV), grassland (GRA), and cropland (CRO). Among these, ENF, EBF, DNF, DBF, MF, and CRO were retained without further subdivision. Shrublands, savannas, and grasslands were further divided based on their respective climate zones. Vegetation in cold and polar zones were classified as boreal and arctic, whereas vegetation in other zones were categorized as temperate. Specially, shrublands were classified into temperate shrublands (SHR[t]) and boreal and arctic shrublands (SHR[b]); savannas was classified into temperate savannas (SAV[t]) and boreal and arctic savannas (SAV[b]); and grasslands was classified into temperate grasslands (GRA[t]), boreal and arctic grasslands (GAR[b]). Besides, the grasslands on the Tibetan Plateau was classified into a separate category (GRA[T]) given the unique alpine climate of this region (Huang et al., 2019; Yao et al., 2012).
2.3 Statistical analysis
2.3.1 Detection of CHEs
In this study, a bivariate identification method based on temperature (STI) and moisture (SPEI) conditions was employed to detect CDHEs and CHHEs. Extreme events were identified using the 20th and 80th percentiles as severity thresholds (Hao et al., 2019b; Zhao et al., 2025). Specifically, an extreme heat event was classified when the STI value for a given grid cell (2001–2018) exceeded the 80th percentile (Zhou et al., 2024). For moisture conditions, an extreme drought event occurred when the SPEI value fell below the 20th percentile, while extreme humid events corresponded to SPEI values exceeding the 80th percentile (Stagge et al., 2017). Finally, when both drought and heat events occurred in the same month, it was defined as a CDHE, whereas a CHHE was defined as the simultaneous occurrence of drought and humid events. Additionally, the frequency of CHEs was quantified as the total number of occurrences from 2001 to 2018.
The standardized compound event indicator (SCEI), derived from the bivariate distribution function of SPEI (X) and STI (Y), was calculated to characterize the severity of CHEs (Hao et al., 2019b). Lower SCEI values indicate more severe conditions of CHEs. For instance, in the case of CDHE, the joint probability distribution of low moisture and high temperature is expressed as Equation 1 (Hao et al., 2019a; Li et al., 2024):
the joint probability was estimated based on Gringorten plotting position (Equation 2):
where n is the total length of time series and
Similar to Equation 3,
2.3.2 Quantifying immediate effects of CHEs on GPP
To quantify and compare the immediate response of GPP to the CHEs, we calculated the difference in anomalous GPP between periods with and without these events (∆GPP). To further minimize the influence of seasonal GPP variations on ∆GPP, the difference in anomalous GPP was computed separately for each month (e.g., January, February, March, etc.) throughout the study period. The specific calculation is shown as Equations 5–7:
where i represents the i-th month of each year (1
To elucidate the ecological mechanisms underlying the contrasting immediate GPP responses to CDHEs and CHHEs, we employed an explainable machine learning approach using XGBoost (eXtreme Gradient Boosting) in combination with SHAP (SHapley Additive exPlanations) to assess feature importance and effect directionality. Four separate XGBoost models were developed, with input features including SCEI, minimum temperature, maximum temperature, soil moisture, vapor pressure deficit, and precipitation. The models were trained to predict GPP under the following conditions: (1) CDHEs with positive ∆GPP, (2) CDHEs with negative ∆GPP, (3) CHHEs with positive ∆GPP, and (4) CHHEs with negative ∆GPP. Model hyperparameters were optimized through random search, and the final models were selected based on the lowest mean absolute error (MAE) obtained via tenfold cross-validation (Bergstra and Bengio, 2012; Gaur and Drewry, 2024; Guo et al., 2025).
2.3.3 Assessing lagged effects of CHEs on GPP
Previous studies have demonstrated that CHEs not only affect vegetation immediately but can also induce significant lagged effects that persist for several months (Han et al., 2023; Rammig et al., 2015; Zhou et al., 2024). Therefore, this study investigated how the severity of CHEs influences GPP over time, accounting for potential delayed responses. Pearson’s correlation coefficient (r) was used to assess both the magnitude and temporal scale of the lagged effects (Wei et al., 2022; Zhang Z. et al., 2022). Specifically, the SCEI of each compound event was paired with the GPP from the t-th month following its occurrence (1 ≤ t ≤ 12) to form a series. The correlation coefficient was then calculated for each time lag, yielding 12 values for each pixel (Equation 8). The absolute maximum r (Rmax) value was selected to determine the magnitude of the lagged effect, and its corresponding temporal scale defined the lag month (Equation 9).
where
3 Results
3.1 Frequency and severity of CHEs
The CDHEs occurred widely across the globe, with 61.52% of vegetation area experiencing more than 10 occurrences during the study period (Figure 1a). High frequency of CDHEs over 2001–2018 occurs mainly in tropical regions, northern and southern South America, the western United States, and along the Mediterranean and Caspian Sea coasts. Similarly, 67.65% of vegetated area experienced more than five occurrences of CHHEs during the same period, with particularly frequent events in regions such as India, the Tibetan Plateau, and northern Canada (Figure 1b). The spatial distribution of CDHEs and CHHEs severity, as indicated by the SCEI, showed no obvious clustering patterns (Figures 1c,d). In regions above 70° N, the CHEs exhibited higher frequency but lower severity compared to mid- and low-latitude regions. Across 80% of regions, CDHEs occurred more frequently than CHHEs, whereas only 20% of regions, mainly in India, Australia, South Africa, eastern China, the Tibetan Plateau, and northern North America, experienced a higher frequency of CHHEs (Figure 1e). In all climate zones, CDHEs were more frequent, with an average of 12.2 events compared to 7.2 events for CHHEs, and more severe, with an average SCEICDHE of −1.60 as opposed to −1.52 for SCEICHHE (Figure 1f).
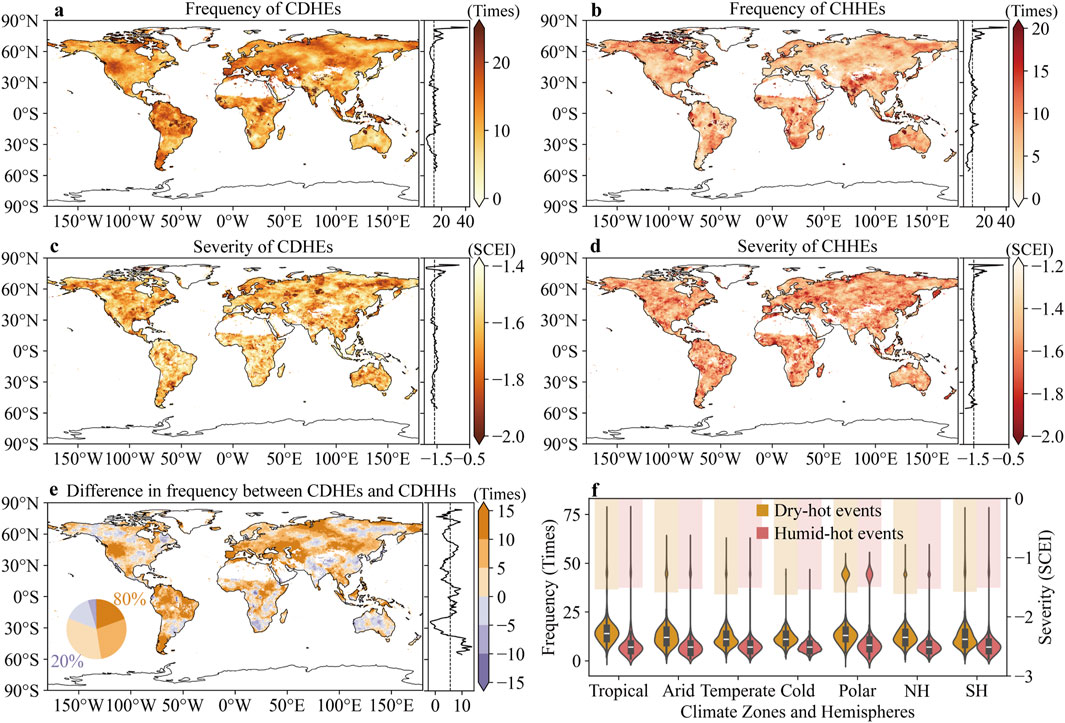
Figure 1. Frequency and average severity of compound dry-hot events (CDHEs) and compound humid-hot events (CHHEs). (a,b) Total number of CDHEs (a) and CHHEs (b) occurrences from 2001 to 2018. (c,d) Average SCEI when CDHEs (c) and CHHEs (d) occurred. (e) Comparison of the frequency of the two CHEs (CDHE frequency - CHHE frequency). (f) Frequency and severity of CHEs in different climate zones.
3.2 Immediate effects of CHEs on GPP
Comparing the immediate changes in GPP caused by the two CHEs (∆GPPCDHE and ∆GPPCHHE), we found that while the spatial distribution of GPP responses was similar, the direction of change differed. GPP decreased in 68% of regions affected by CDHEs, particularly in central and eastern North America, eastern South America, and the western and northern parts of Eurasia (Figure 2a). Conversely, 58% of vegetation areas exhibited a positive ∆GPPCHHE, while 42% showed a negative ∆GPPCHHE, mainly located in northern and polar regions, as well as eastern Australia (Figure 2b). The high-latitude regions of the Northern Hemisphere (above 60° N) and the mid-latitude regions of the Southern Hemisphere (40°–60° S) showed opposite ∆GPP compared to the low latitudes. On a global scale, the average ∆GPPCDHE was −132.65 gC m−2 d−1, while ∆GPPCHHE was 73.58 gC m−2 d−1. CDHEs and CHHEs contributed to a global net GPP change of −5.26 Pg C yr−1 and 1.67 Pg C yr−1, respectively. Additionally, the polar zone exhibited distinct ∆GPP responses compared to the other four warmer climate zones, while the ∆GPP patterns in both hemispheres were consistent (Figure 2c). In tropical, arid, temperate, and cold zones, ∆GPPCDHE was predominantly negative, with median values ranging from −34.84 gC m−2 d−1 in arid zone to −139.09 gC m−2 d−1 in temperate zones. Meanwhile, ∆GPPCHHE was generally positive across these zones, with median values ranging from 3.03 gC m−2 d−1 in arid zone to 63.96 gC m−2 d−1 in temperate zone. In contrast, in polar zone, GPP exhibited a positive immediate response to CDHEs (36.24 gC m−2 d−1) and a negative immediate response to CHHEs (−13.57 gC m−2 d−1).
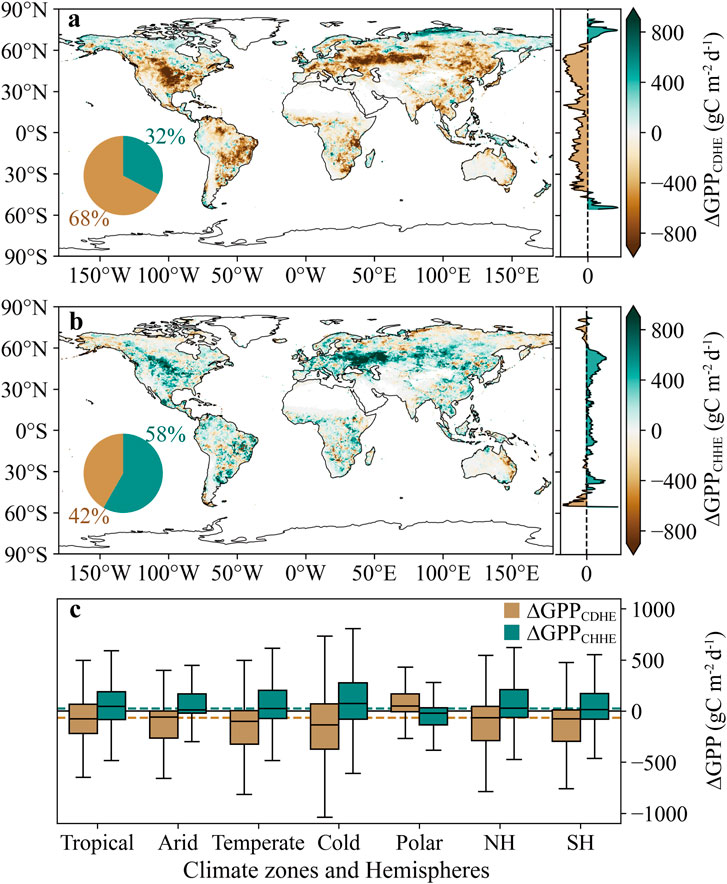
Figure 2.
We used SHAP summary plots to illustrate the magnitude and direction of the effects of environmental variables and SCEI on GPP during the month when the CHEs occurred (Figure 3). In CDHEs associated with increased GPP (∆GPPCDHE > 0), Tmn and Tmx were the most influential factors (Figure 3a). Conversely, VPD and SM dominated in CDHEs associated with GPP declines (∆GPPCDHE < 0) (Figure 3b). For CHHEs, GPP changes were primarily influenced by SM and temperature. SM exerted the greatest influence when ∆GPPCHHE was positive (Figure 3c), whereas TMN had the strongest impact when ∆GPPCHHE was negative (Figure 3d). The direction of effect of environmental factors was generally consistent across the four models. Higher values of TMN, TMX, and SM tended to promote increased GPP, whereas greater VPD was associated with reductions in GPP. SCEI and PRE were found to have the weakest impacts among all considered factors.
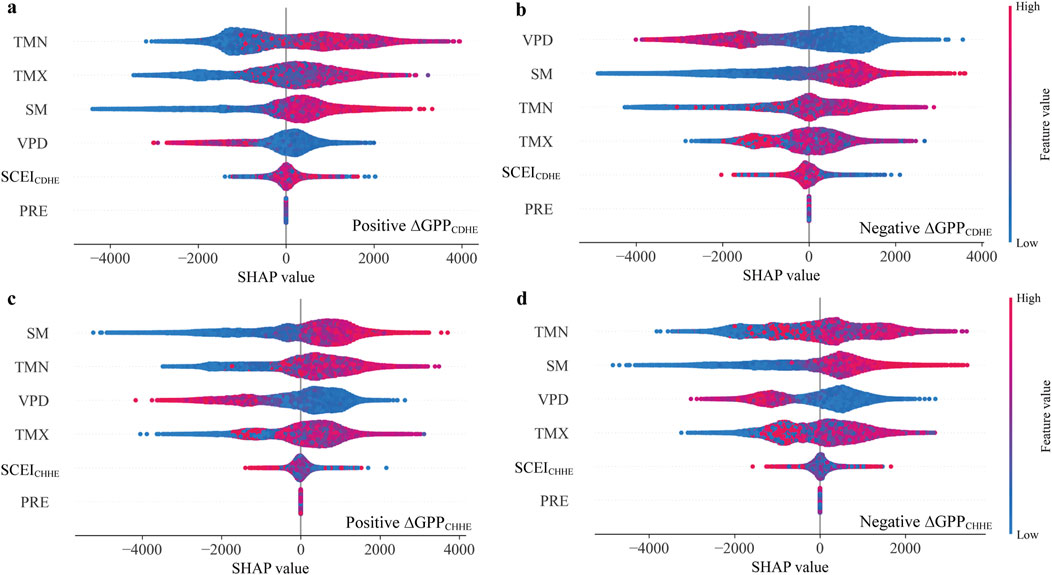
Figure 3. The SHAP values showing the contributions of environmental variables to GPP under positive and negative responses to CDHEs and CHHEs. SHAP summary plots for the GPP values during (a) CDHEs with positive ∆GPP, (b) CDHEs with negative ∆GPP, (c) CHHEs with positive ∆GPP, and (d) CHHEs with negative ∆GPP.
3.3 Lagged effects of CHEs on GPP
A total of 52% of regions exhibited a positive Rmax (SCEICDHE vs. GPP), meaning that severe CDHEs led to a lagged decrease in GPP (Figure 4a). These regions were mainly located in central North America, central and western Russia, and eastern Siberia. Conversely, regions where CDHEs resulted in a lagged increase in GPP (Rmax < 0) were more commonly found in the tropical Malay Archipelago, western Europe, and temperate zones of South America around 30° S. The climate zones statistics in Figure 4b showed consistent results, with the median Rmax (SCEICDHE vs. GPP) of −0.18 in tropical zone and −0.38 in temperate zone. In contrast, the median Rmax was 0.30 in arid zone, 0.42 in cold zone, and 0.21 in polar zone. The lagged effect of CDHEs differed between the NH and SH, with GPP decreasing in the NH (median Rmax = 0.34), while increasing in the SH due to the lagged impact of CDHEs (median Rmax = −0.22). We found 30% of regions showing a lag of less than 3 months, and 28% of regions having a lag of 10–12 months (Figure 4c). In the early stages following CDHEs (0–3 months), all climate zones outside the polar exhibited positive Rmax (SCEICDHE vs. GPP), with stronger correlations than those observed at 6–8 months of lag (Figure 4d). Except for the 12-month lag, positive correlations between GPP and SCEICDHE was consistently observed in cold zone across all lag months, with the highest Rmax (SCEICDHE vs. GPP) of 0.15 occurring at lag 0. In tropical and temperate zones, the correlation coefficient shifted from positive to negative as lag time increased. In contrast, in polar regions, the correlation transitioned from negative to positive with longer lag time.
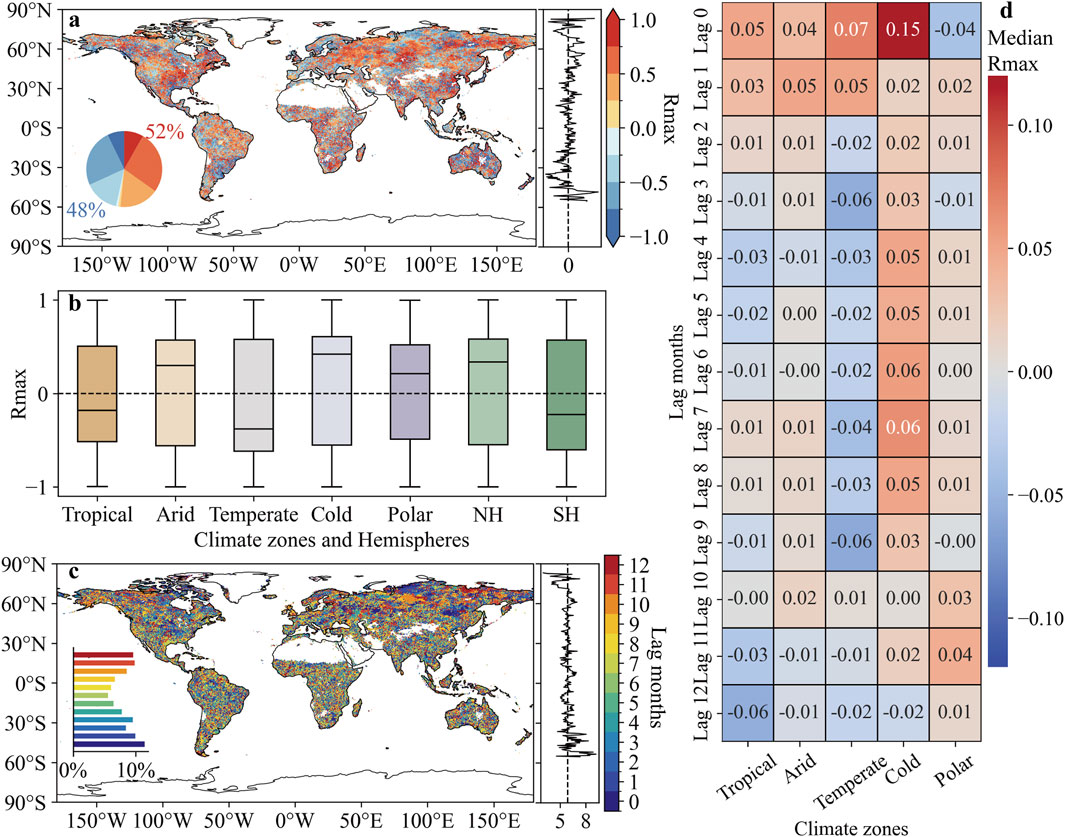
Figure 4. Lagged effect of compound dry-hot events. (a) Spatial distribution of maximum correlation coefficient (Rmax) between the SCEICDHE and GPP. (b) Rmax (SCEICDHE vs. GPP) in different climate zones. (c) Spatial distribution of the lag months corresponding to the Rmax (SCEICDHE vs. GPP). (d) The median value of Rmax (SCEICDHE vs. GPP) for different climate zones in different lag months.
More regions (53%) experienced an increase in GPP due to the lagged impact of CHHEs (Rmax [SCEICHHE vs. GPP] < 0), while no spatially distinct clustering of lagged correlations was observed (Figure 5a). Statistical results by climate zones demonstrated that CHHEs generally exerted favorable lagged effects, contributing to higher GPP across all climate zones (Figure 5b). The median values of Rmax (SCEICHHE vs. GPP) ranged from −0.42 in cold zone to −0.13 in tropical zone. The lagged effect of CHHEs on GPP was consistent in both hemispheres, with median Rmax values of −0.34 in the NH and −0.35 in the SH. The lag time of CHHEs showed a higher proportion (>9%) of lag months concentrated in the 0–3 and 10–12 months ranges (Figure 5c). In the polar zone, a negative correlation between GPP and SCEICHHE was observed for most lag months, except for months 0 and 2 (Figure 5d). However, as time progressed, CHHEs contributed to an increase in GPP. Furthermore, in tropical, temperate, and cold zones, the correlation coefficients shifted from negative to positive with increasing lag time.
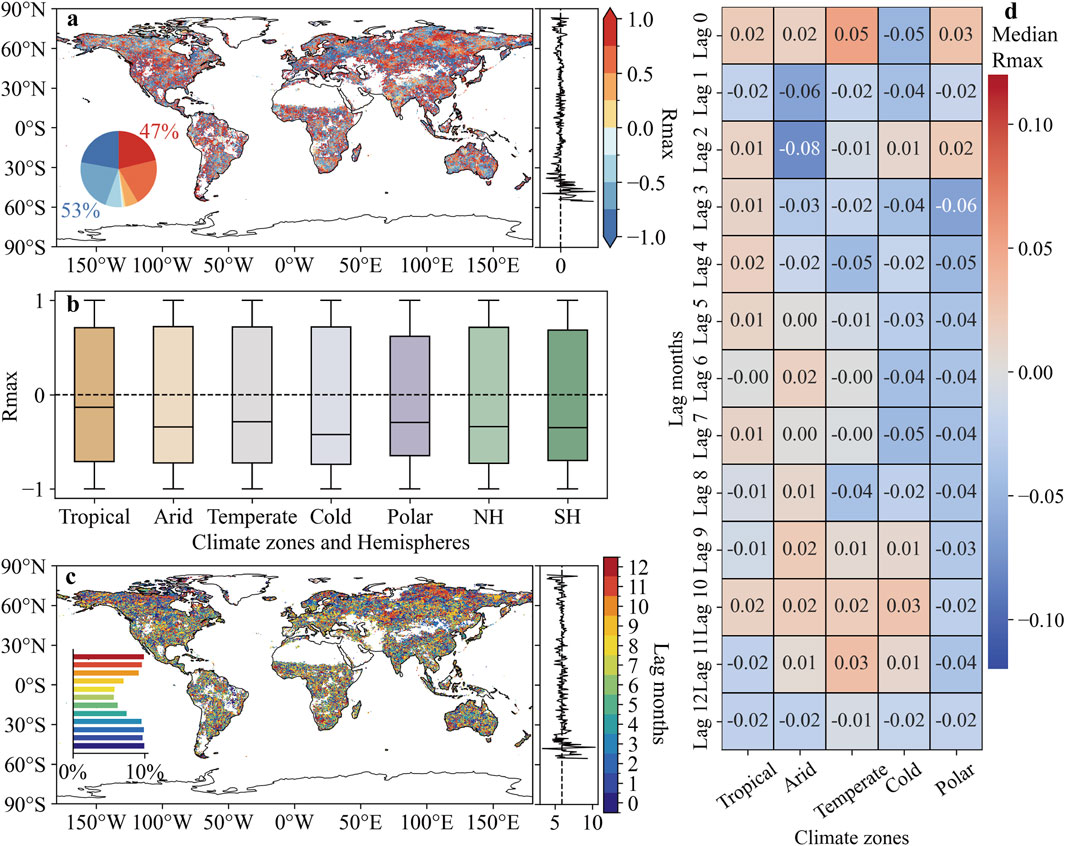
Figure 5. Lagged effect of compound humid-hot events. (a) Spatial distribution of maximum correlation coefficient (Rmax) between the SCEICHHE and GPP. (b) Rmax (SCEICHHE vs. GPP) in different climate zones. (c) Spatial distribution of the lag months corresponding to the Rmax (SCEICHHE vs. GPP). (d) The median value of Rmax (SCEICHHE vs. GPP) for different climate zones in different lag months.
3.4 Impacts of CHEs on GPP of different vegetation types
Based on the statistics involving the reclassification of 13 vegetation types (Figure 6a), we observed that all vegetation types responded more strongly to CDHEs than to CHHEs, as indicated by a greater average absolute ∆GPP under CDHEs across vegetation types (Figure 6c). With the exception of SHR(b) and GRA(b), the immediate GPP response patterns to CHEs were generally consistent across vegetation types, characterized by a decrease in GPP during CDHEs and an increase during CHHEs. The median average ∆GPPCDHE was −158.03 gC m−2 d−1, whereas the median average ∆GPPCHHE was 79.84 gC m−2 d−1. SHR(b) and GRA(b) exhibited opposite response patterns, with median ∆GPPCDHE values of 113.15 gC m−2 d−1 and 10.79 gC m−2 d−1, and median ∆GPPCHHE values of −43.97 gC m−2 d−1 and -2.34 gC m−2 d−1, respectively. Among all vegetation types, DBF experienced the most pronounced immediate decline in GPP during CDHEs (median ∆GPPCDHE = −301.02 gC m−2 d−1), while CRO exhibited the largest increase in GPP in response to CHHEs (median ∆GPPCHHE = 162.97 gC m−2 d−1). In SHR(t), SAV(t) and GRA(T), GPP was mainly influenced by the negative lagged effect of CDHEs, whereas other vegetation types exhibited positive lagged correlations between GPP and SCEICDHE (Figure 6d). DNF and GRA(t) were primarily affected by the positive lagged effect of CHHEs, while the remaining vegetation types experienced a negative lagged effect. Overall, the lag months for the two CHEs were similar, with an average of 5.77 months for CDHEs and 5.62 months for CHHEs (Figure 6b). In ENF, DNF, and SAV(b), the lag time for CDHEs was longer than for CHHEs, whereas the opposite pattern was observed in DBF, SHR(b), GRA(b), and CRO.
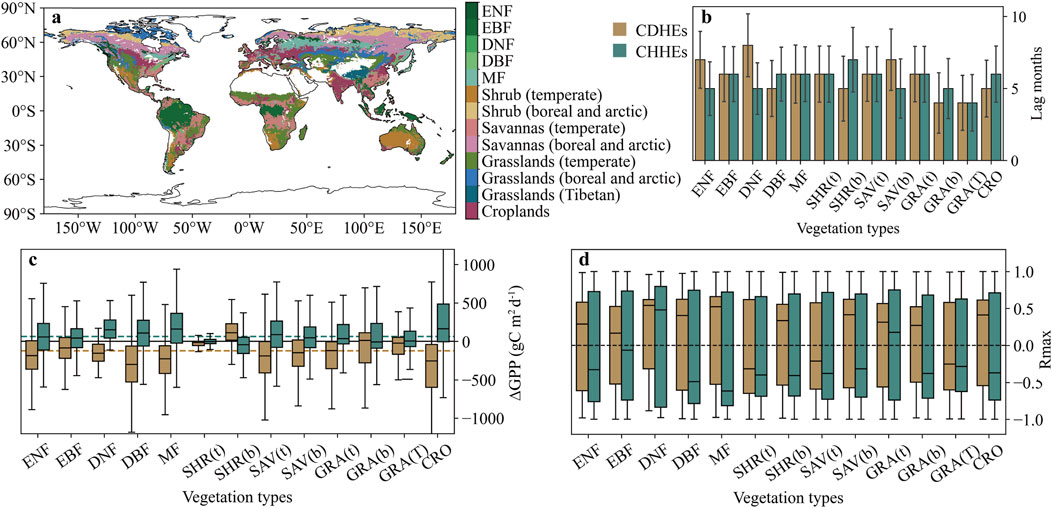
Figure 6. Effects of CHEs on GPP of different vegetation types. (a) Global distribution of reclassified vegetation types based on the MODIS land cover data and the Köppen–Geiger climate classification. (b) Lag time of the lagged effect of CDHEs and CHHEs on GPP in different vegetation types. (c) ∆GPP in different vegetation types caused by two CHEs. The brown and green dotted lines respectively indicate the mean values of median ∆GPPCDHE and ∆GPPCHHE across all vegetation types. (d) Lagged correlation between the two CHEs and GPP for various vegetation types.
4 Discussion
Our findings demonstrated the widespread and adverse immediate effects of CDHEs on GPP, with 68% of global vegetated areas experiencing reduced GPP during these events (Figure 2). This is consistent with previous research in Europe, southern China and eastern United States, which similarly observed the negative response of GPP to droughts and hot events (Bastos et al., 2020; Ting et al., 2023; Yuan et al., 2016; Zscheischler et al., 2014). The immediate effects of CDHEs are primarily attributed to the synergistic suppression of photosynthesis and ecosystem productivity by drought and elevated temperatures. High temperatures directly impair productivity by altering activity of photosynthetic enzymes (Dusenge et al., 2019; Mathur et al., 2014). Additionally, drought reduces soil moisture availability, limiting water supply to photosynthetic tissues (Turner, 2019). In response to water scarcity, plants typically close their stomata to reduce water loss. However, under extreme heat stress, some plants may reopen their stomata to cool down through transpiration (Lesk et al., 2022; Li et al., 2017; Pirasteh-Anosheh et al., 2016). When high temperatures and drought occur at the same time, VPD can induce stomatal closure leading to excessive leaf temperatures and further inhibiting photosynthesis (Zandalinas et al., 2020; Zhang and Sonnewald, 2017). This mechanism is supported by our SHAP-based analysis, which showed dominant roles of atmospheric dryness and water limitation in driving productivity losses during compound dry-hot conditions (Figure 3b).
Compared to CDHEs, CHHEs generally have a more positive influence on GPP, with GPP increasing in 58% of global vegetated areas during CHHEs (Figure 2). As the SHAP analysis indicates, high temperatures and high soil moisture enhance productivity (Figure 3c). Additionally, prerious studies reported that low VPD facilitates greater stomatal opening, enhancing transpiration-based cooling and mitigating heat stress while simultaneously boosting photosynthetic efficiency (An et al., 2024; Slot et al., 2024; Zhu et al., 2022). Polar, boreal shrub and boreal grassland ecosystems displayed contrasting responses to both CHEs compared to global average (Figures 2c, 6c). These ecosystems experienced increased GPP during CDHEs but declines under CHHEs. This reversal is closely linked to the cold climate of high-latitude regions, where snowmelt, low precipitation and even lower evaporation rates, sustain humid soil conditions during the growing season (Rasmussen et al., 2020; Xu et al., 2021). Furthermore, permafrost in deep layer limits water infiltration, leading to surface water accumulation (Blume-Werry et al., 2019; Man et al., 2022). In these environments, temperature is the primary limiting factor for vegetation growth rather than water availability (He et al., 2021; Seddon et al., 2016). Consequently, CDHEs in polar zones promote higher GPP by meeting vegetation temperature requirements (Lin et al., 2021; Zhang Z. et al., 2022). This mechanism is further corroborated by our SHAP results, which show that under CDHEs associated with increased GPP, Tmn and Tmx contribute most significantly and positively to GPP variation (Figure 3a).
The lagged effects of CDHEs and CHHEs on GPP exhibited obvious spatial heterogeneity, reflecting the complex and multifaceted responses of ecosystems to prolonged climate anomalies. Our analysis uncovered that CDHEs generally impose adverse lagged effects on GPP, whereas CHHEs tend to promote lagged enhancement in productivity (Figures 4, 5). This divergence primarily stems from the prolonged recovery of water availability following CHEs, which often requires extended periods to return to normal moisture levels (Gründemann et al., 2023; Jiao et al., 2021; Schwalm et al., 2017). However, biome-specific variations exist. In tropical and temperate regions, short-stature vegetation, including shrubs and savannas, exhibited enhanced GPP due to the lagged effects of CDHEs, whereas tropical EBF experienced adverse lagged impacts from dry heat. This differential response can be attributed to the rapid biomass accumulation and high resilience of short-stature vegetation following drought (He et al., 2025; Jiang et al., 2024; Yao et al., 2022). As water availability improves post-CDHEs, these vegetation types recover quickly and leverage elevated temperatures to stimulate GPP. Similar findings by Yu et al. (2017) indicate that moderate drought stress can enhance productivity and water use efficiency in tropical savannas.
The lagged effects of CDHEs on GPP also varied between hemispheres. In the NH, GPP showed a delayed decline following CDHEs (median Rmax = 0.34), while in the SH, GPP exhibited a lagged increase (median Rmax = −0.22). This hemispheric divergence may result from the variations in ecosystem composition. The SH is predominantly covered by shrubs and grasslands, whereas the NH has a greater proportion of forests and croplands. Forests, though resistant to extreme drought and heat events, are less resilient than short-stature vegetation (Yu et al., 2017). Meanwhile, crop yield reductions due to dry-hot conditions have been observed in both regional and global studies (Feng et al., 2019; Ting et al., 2023; Wu and Jiang, 2022). Additionally, human activities (Wada et al., 2013; Wanders and Wada, 2015) and climate systems such as monsoons and tropical high-pressure systems (Polson et al., 2014; Svoma et al., 2013) contribute to extensive drought in the NH (Balting et al., 2021; Naumann et al., 2018). In tropical and temperate zones, the impact of CDHEs transitioned from positive to negative over time, while CHHEs in arid and temperate zones exhibited a shift from negative to positive effects. These temporal dynamics suggest the potential for nonlinear, long-term impacts of compound heat events on vegetation productivity. Establishing a precise mechanistic explanation for the temporal shifts in the correlation between SCEI and GPP remains challenging. We propose analyzing the lag effects from both short-term and long-term perspectives. The initial lag phase (0–3 months) likely reflects immediate physiological responses, including stomatal closure (Li et al., 2017; Slot et al., 2024), photosynthetic inhibition (Von Buttlar et al., 2018; Zhang et al., 2016), and short-term stress-induced metabolic adjustments (Hasanagić et al., 2020). In contrast, the prolonged lag (10–12 months) may stem from carry-over effects spanning multiple growing seasons, such as delayed phenological shifts (Liu et al., 2025), depletion or accumulation of carbon reserves (Van Der Molen et al., 2011).
Additionally, several limitations in this study warrant further refinement. Firstly, the sliding lag correlation analysis used to assess the lagged effects of CHEs on GPP relies solely on the maximum absolute Pearson correlation coefficient, which may simplify the intricate interactions between CHEs and vegetation. For instance, CHEs might exert multi-layered lagged effects on GPP across different temporal scales or exhibit nonlinear lagged responses, posing challenges to the current methodologies (Wei et al., 2022; Zhao et al., 2020). Secondly, the use of monthly meteorological and GPP data, while informative, is inadequate in tracking short-term climate and vegetation dynamics. Previous studies indicate distinct variations in plant water content within 1–4 weeks following rainfall or heat events (Densmore-McCulloch et al., 2016; Dreesen et al., 2012; Feldman et al., 2020; Mainali et al., 2014). Therefore, employing higher temporal resolution data could facilitate more precise quantification of CHEs frequency and duration, while enabling a more nuanced exploration of vegetation responses. Moreover, given the influence of vegetation greenness, diurnal temperatures, and light use efficiency on vegetation productivity at fine temporal scales (Chen et al., 2021; Tang et al., 2021; Wang et al., 2022), as well as the findings by Wankmüller et al. (2024) highlighting soil texture as a decisive factor influencing ecosystem sensitivity to VPD and soil moisture, incorporating these additional environmental variables into future analyses could provide a more comprehensive mechanistic explanation of vegetation responses to compound heat events.
5 Conclusion
This study compared the immediate and lagged effects of compound dry-hot (CDHEs) and compound humid-hot (CHHEs) events on global GPP, while also investigating how these impacts vary across different climate zones and vegetation types. Our findings demonstrated that, CDHEs were more frequent and more severe during 2001–2018. Distinct patterns were observed in immediate GPP responses, as CDHEs led to a reduction in GPP across 68% of vegetated regions, while CHHEs increased GPP in 58% of areas. On a global scale, the net GPP change was −5.26 Pg C yr−1 caused by CDHEs and 1.67 Pg C yr−1 caused by CHHEs. In polar zones, boreal shrubs, and boreal grasslands, CDHEs and CHHEs exerted opposite immediate effects on GPP compared to the global average, causing net GPP changes of 0.17 Pg C yr−1 and −0.04 Pg C yr−1, respectively. Additionally, the lagged effect analysis revealed that CDHEs led to a lagged decrease in GPP in 52% areas, while CHHEs resulted in a lagged increase in 53% of areas, with obvious spatial heterogeneity in these effects. The temporal distribution of lagged effects primarily concentrated within 0–3 months and 10–12 month periods following the CHEs. These results enhance the understanding of global vegetation dynamics and carbon cycling in the context of future climate extremes.
Data availability statement
The original contributions presented in the study are included in the article/supplementary material, further inquiries can be directed to the corresponding author.
Author contributions
ML: Data curation, Writing – original draft. HY: Visualization, Formal Analysis, Writing – original draft. WD: Writing – original draft, Data curation. MW: Writing – review and editing, Conceptualization.
Funding
The author(s) declare that financial support was received for the research and/or publication of this article. M.W. is supported by the National Natural Science Foundation of China (42371486), and the National Key Research and Development Program of China (2023YFB3907402).
Conflict of interest
The authors declare that the research was conducted in the absence of any commercial or financial relationships that could be construed as a potential conflict of interest.
Generative AI statement
The author(s) declare that no Generative AI was used in the creation of this manuscript.
Publisher’s note
All claims expressed in this article are solely those of the authors and do not necessarily represent those of their affiliated organizations, or those of the publisher, the editors and the reviewers. Any product that may be evaluated in this article, or claim that may be made by its manufacturer, is not guaranteed or endorsed by the publisher.
References
An, H., Zhai, J., Song, X., Wang, G., Zhong, Y., Zhang, K., et al. (2024). Impacts of extreme precipitation and diurnal temperature events on grassland productivity at different elevations on the plateau. Remote Sens. 16, 317. doi:10.3390/rs16020317
Balting, D. F., AghaKouchak, A., Lohmann, G., and Ionita, M. (2021). Northern Hemisphere drought risk in a warming climate. NPJ Clim. Atmos. Sci. 4, 61. doi:10.1038/s41612-021-00218-2
Bastos, A., Ciais, P., Friedlingstein, P., Sitch, S., Pongratz, J., Fan, L., et al. (2020). Direct and seasonal legacy effects of the 2018 heat wave and drought on European ecosystem productivity. Sci. Adv. 6, eaba2724. doi:10.1126/sciadv.aba2724
Beguería, S., Vicente-Serrano, S. M., Reig, F., and Latorre, B. (2014). Standardized precipitation evapotranspiration index (SPEI) revisited: parameter fitting, evapotranspiration models, tools, datasets and drought monitoring. Int. J. Climatol. 34, 3001–3023. doi:10.1002/joc.3887
Bergstra, J., and Bengio, Y. (2012). Random search for hyper-parameter optimization. J. Mach. Learn. Res. 13, 281–305. doi:10.5555/2188385.2188395
Blume-Werry, G., Milbau, A., Teuber, L. M., Johansson, M., and Dorrepaal, E. (2019). Dwelling in the deep–strongly increased root growth and rooting depth enhance plant interactions with thawing permafrost soil. New Phytol. 223, 1328–1339. doi:10.1111/nph.15903
Buzan, J. R., and Huber, M. (2020). Moist heat stress on a hotter Earth. Annu. Rev. Earth Planet. Sci. 48, 623–655. doi:10.1146/annurev-earth-053018-060100
Chen, Y., Feng, X., Fu, B., Wu, X., and Gao, Z. (2021). Improved global maps of the optimum growth temperature, maximum light use efficiency, and gross primary production for vegetation. JGR Biogeosciences 126, e2020JG005651. doi:10.1029/2020JG005651
Ciais, P., Reichstein, M., Viovy, N., Granier, A., Ogée, J., Allard, V., et al. (2005). Europe-wide reduction in primary productivity caused by the heat and drought in 2003. Nature 437, 529–533. doi:10.1038/nature03972
Cranko Page, J., De Kauwe, M. G., Abramowitz, G., and Pitman, A. J. (2023). Non-stationary lags and legacies in ecosystem flux response to antecedent rainfall. JGR Biogeosciences 128, e2022JG007144. doi:10.1029/2022JG007144
Densmore-McCulloch, J. A., Thompson, D. L., and Fraser, L. H. (2016). Short-term effects of changing precipitation patterns on shrub-steppe grasslands: seasonal watering is more important than frequency of watering events. PLoS ONE 11, e0168663. doi:10.1371/journal.pone.0168663
Dong, Y., Liu, G., Wu, X., Wang, L., Xu, H., Yang, S., et al. (2025). Spatiotemporal variations in compound extreme events and their cumulative and lagged effects on vegetation in the northern permafrost regions from 1982 to 2022. Remote Sens. 17, 169. doi:10.3390/rs17010169
Dreesen, F. E., De Boeck, H. J., Janssens, I. A., and Nijs, I. (2012). Summer heat and drought extremes trigger unexpected changes in productivity of a temperate annual/biannual plant community. Environ. Exp. Bot. 79, 21–30. doi:10.1016/j.envexpbot.2012.01.005
Dusenge, M. E., Duarte, A. G., and Way, D. A. (2019). Plant carbon metabolism and climate change: elevated CO 2 and temperature impacts on photosynthesis, photorespiration and respiration. New Phytol. 221, 32–49. doi:10.1111/nph.15283
Fan, X., Miao, C., Wu, Y., Mishra, V., and Chai, Y. (2024). Comparative assessment of dry- and humid-heat extremes in a warming climate: frequency, intensity, and seasonal timing. Weather Clim. Extrem. 45, 100698. doi:10.1016/j.wace.2024.100698
Feldman, A. F., Short Gianotti, D. J., Trigo, I. F., Salvucci, G. D., and Entekhabi, D. (2020). Land-atmosphere drivers of landscape-scale plant water content loss. Geophys. Res. Lett. 47, e2020GL090331. doi:10.1029/2020GL090331
Feng, S., Hao, Z., Zhang, X., and Hao, F. (2019). Probabilistic evaluation of the impact of compound dry-hot events on global maize yields. Sci. Total Environ. 689, 1228–1234. doi:10.1016/j.scitotenv.2019.06.373
Flach, M., Brenning, A., Gans, F., Reichstein, M., Sippel, S., and Mahecha, M. D. (2021). Vegetation modulates the impact of climate extremes on gross primary production. Biogeosciences 18, 39–53. doi:10.5194/bg-18-39-2021
Gampe, D., Zscheischler, J., Reichstein, M., O’Sullivan, M., Smith, W. K., Sitch, S., et al. (2021). Increasing impact of warm droughts on northern ecosystem productivity over recent decades. Nat. Clim. Chang. 11, 772–779. doi:10.1038/s41558-021-01112-8
Gaur, S., and Drewry, D. T. (2024). Explainable machine learning for predicting stomatal conductance across multiple plant functional types. Agric. For. Meteorology 350, 109955. doi:10.1016/j.agrformet.2024.109955
Grimmer, M. K., John Foulkes, M., and Paveley, N. D. (2012). Foliar pathogenesis and plant water relations: a review. J. Exp. Bot. 63, 4321–4331. doi:10.1093/jxb/ers143
Gründemann, G. J., Zorzetto, E., Beck, H. E., Schleiss, M., Van De Giesen, N., Marani, M., et al. (2023). Extreme precipitation return levels for multiple durations on a global scale. J. Hydrology 621, 129558. doi:10.1016/j.jhydrol.2023.129558
Guo, Y., Wu, M., Yang, L., and Zuo, P. (2025). Asynchronous changes in vegetation greenness and climate variables isolines during 1986–2020 over the Tibetan plateau. Geophys. Res. Lett. 52, e2024GL111652. doi:10.1029/2024GL111652
Han, H., Jian, H., Liu, M., Lei, S., Yao, S., and Yan, F. (2023). Impacts of drought and heat events on vegetative growth in a typical humid zone of the middle and lower reaches of the Yangtze River, China. J. Hydrology 620, 129452. doi:10.1016/j.jhydrol.2023.129452
Hao, Y., Hao, Z., Fu, Y., Feng, S., Zhang, X., Wu, X., et al. (2021). Probabilistic assessments of the impacts of compound dry and hot events on global vegetation during growing seasons. Environ. Res. Lett. 16, 074055. doi:10.1088/1748-9326/ac1015
Hao, Z., Hao, F., Singh, V. P., and Zhang, X. (2019a). Statistical prediction of the severity of compound dry-hot events based on El Niño-Southern Oscillation. J. Hydrology 572, 243–250. doi:10.1016/j.jhydrol.2019.03.001
Hao, Z., Hao, F., Xia, Y., Singh, V. P., and Zhang, X. (2019b). A monitoring and prediction system for compound dry and hot events. Environ. Res. Lett. 14, 114034. doi:10.1088/1748-9326/ab4df5
Harris, I., Osborn, T. J., Jones, P., and Lister, D. (2020). Version 4 of the CRU TS monthly high-resolution gridded multivariate climate dataset. Sci. Data 7, 109. doi:10.1038/s41597-020-0453-3
Hasanagić, D., Koleška, I., Kojić, D., Vlaisavljević, S., Janjić, N., and Kukavica, B. (2020). Long term drought effects on tomato leaves: anatomical, gas exchange and antioxidant modifications. Acta Physiol. Plant 42, 121. doi:10.1007/s11738-020-03114-z
He, Q., Ju, W., Dai, S., He, W., Song, L., Wang, S., et al. (2021). Drought risk of global terrestrial gross primary productivity over the last 40 Years detected by a remote sensing-driven process model. JGR Biogeosciences 126, e2020JG005944. doi:10.1029/2020JG005944
He, X., Dong, X., Li, X., Chen, N., and Zhao, C. (2025). Divergent patterns and determinants of resistance and resilience in short and tall forests across global drylands. Environ. Res. Lett. 20, 034059. doi:10.1088/1748-9326/adb506
Houghton, R. A., Davidson, E. A., and Woodwell, G. M. (1998). Missing sinks, feedbacks, and understanding the role of terrestrial ecosystems in the global carbon balance. Glob. Biogeochem. Cycles 12, 25–34. doi:10.1029/97GB02729
Huang, M., Piao, S., Ciais, P., Peñuelas, J., Wang, X., Keenan, T. F., et al. (2019). Air temperature optima of vegetation productivity across global biomes. Nat. Ecol. Evol. 3, 772–779. doi:10.1038/s41559-019-0838-x
Huang, M., and Zhai, P. (2025). Protracted vegetation recovery after compound drought and hot extreme compared to general drought. Environ. Res. Lett. 20, 024001. doi:10.1088/1748-9326/ada4c3
IPCC (2021). in Climate change 2021: the physical science basis. Contribution of working group I to the sixth assessment report of the intergovernmental panel on climate change. Editors V. Masson-Delmotte, P. Zhai, A. Pirani, S. L. Connors, C. Péan, and S. Berger (Cambridge, United Kingdom and New York, NY, USA: Cambridge University Press). In press.
Jiang, L., Liu, B., Guo, H., Yuan, Y., Liu, W., and Jiapaer, G. (2024). Assessing vegetation resilience and vulnerability to drought events in Central Asia. J. Hydrology 634, 131012. doi:10.1016/j.jhydrol.2024.131012
Jiao, T., Williams, C. A., De Kauwe, M. G., Schwalm, C. R., and Medlyn, B. E. (2021). Patterns of post-drought recovery are strongly influenced by drought duration, frequency, post-drought wetness, and bioclimatic setting. Glob. Change Biol. 27, 4630–4643. doi:10.1111/gcb.15788
Kang, J., Yu, M., Xia, Y., Sun, S., and Zhou, B. (2024). Impacts of compound hot–dry events on vegetation productivity over northern east asia. Forests 15, 549. doi:10.3390/f15030549
Lahlali, R., Taoussi, M., Laasli, S.-E., Gachara, G., Ezzouggari, R., Belabess, Z., et al. (2024). Effects of climate change on plant pathogens and host-pathogen interactions. Crop Environ. 3, 159–170. doi:10.1016/j.crope.2024.05.003
Le Quéré, C., Raupach, M. R., Canadell, J. G., Marland, G., Bopp, L., Ciais, P., et al. (2009). Trends in the sources and sinks of carbon dioxide. Nat. Geosci. 2, 831–836. doi:10.1038/ngeo689
Lesk, C., Anderson, W., Rigden, A., Coast, O., Jägermeyr, J., McDermid, S., et al. (2022). Compound heat and moisture extreme impacts on global crop yields under climate change. Nat. Rev. Earth Environ. 3, 872–889. doi:10.1038/s43017-022-00368-8
Li, J., Bevacqua, E., Chen, C., Wang, Z., Chen, X., Myneni, R. B., et al. (2022). Regional asymmetry in the response of global vegetation growth to springtime compound climate events. Commun. Earth Environ. 3, 123. doi:10.1038/s43247-022-00455-0
Li, J., Zhang, Y., Bevacqua, E., Zscheischler, J., Keenan, T. F., Lian, X., et al. (2024). Future increase in compound soil drought-heat extremes exacerbated by vegetation greening. Nat. Commun. 15, 10875. doi:10.1038/s41467-024-55175-0
Li, Y., Li, H., Li, Y., and Zhang, S. (2017). Improving water-use efficiency by decreasing stomatal conductance and transpiration rate to maintain higher ear photosynthetic rate in drought-resistant wheat. Crop J. 5, 231–239. doi:10.1016/j.cj.2017.01.001
Lin, S., Li, J., Liu, Q., Gioli, B., Paul-Limoges, E., Buchmann, N., et al. (2021). Improved global estimations of gross primary productivity of natural vegetation types by incorporating plant functional type. Int. J. Appl. Earth Observation Geoinformation 100, 102328. doi:10.1016/j.jag.2021.102328
Liu, Y., Zhang, Y., Peñuelas, J., Kannenberg, S. A., Gong, H., Yuan, W., et al. (2025). Drought legacies delay spring green-up in northern ecosystems. Nat. Clim. Chang. 15, 444–451. doi:10.1038/s41558-025-02273-6
Luo, M., Wu, S., Lau, G.N.-C., Pei, T., Liu, Z., Wang, X., et al. (2024). Anthropogenic forcing has increased the risk of longer-traveling and slower-moving large contiguous heatwaves. Sci. Adv. 10, eadl1598. doi:10.1126/sciadv.adl1598
Mainali, K. P., Heckathorn, S. A., Wang, D., Weintraub, M. N., Frantz, J. M., and Hamilton, E. W. (2014). Impact of a short-term heat event on C and N relations in shoots vs. roots of the stress-tolerant C4 grass, Andropogon gerardii. J. Plant Physiology 171, 977–985. doi:10.1016/j.jplph.2014.04.006
Man, Z., Xie, C., Jiang, R., and Che, S. (2022). Freeze–thaw cycle frequency affects root growth of alpine meadow through changing soil moisture and nutrients. Sci. Rep. 12, 4436. doi:10.1038/s41598-022-08500-w
Martens, B., Miralles, D. G., Lievens, H., Van Der Schalie, R., De Jeu, R. A. M., Fernández-Prieto, D., et al. (2017). GLEAM v3: satellite-based land evaporation and root-zone soil moisture. Geosci. Model Dev. 10, 1903–1925. doi:10.5194/gmd-10-1903-2017
Mathur, S., Agrawal, D., and Jajoo, A. (2014). Photosynthesis: response to high temperature stress. J. Photochem. Photobiol. B Biol. 137, 116–126. doi:10.1016/j.jphotobiol.2014.01.010
Meng, Y., Hao, Z., Feng, S., Zhang, X., and Hao, F. (2022). Increase in compound dry-warm and wet-warm events under global warming in CMIP6 models. Glob. Planet. Change 210, 103773. doi:10.1016/j.gloplacha.2022.103773
Mo, K. C., and Lettenmaier, D. P. (2014). Objective drought classification using multiple land surface models. J. Hydrometeorol. 15, 990–1010. doi:10.1175/JHM-D-13-071.1
Muñoz-Sabater, J., Dutra, E., Agustí-Panareda, A., Albergel, C., Arduini, G., Balsamo, G., et al. (2021). ERA5-Land: a state-of-the-art global reanalysis dataset for land applications. Earth Syst. Sci. data 13, 4349–4383. doi:10.5194/essd-13-4349-2021
Naumann, G., Alfieri, L., Wyser, K., Mentaschi, L., Betts, R. A., Carrao, H., et al. (2018). Global changes in drought conditions under different levels of warming. Geophys. Res. Lett. 45, 3285–3296. doi:10.1002/2017GL076521
Pinker, R. T., Zhao, M., Wang, H., and Wood, E. F. (2010). Impact of satellite based PAR on estimates of terrestrial net primary productivity. Int. J. Remote Sens. 31, 5221–5237. doi:10.1080/01431161.2010.496474
Pirasteh-Anosheh, H., Saed-Moucheshi, A., Pakniyat, H., and Pessarakli, M. (2016). Stomatal responses to drought stress. Water stress crop plants A Sustain. approach 1, 24–40. doi:10.1002/9781119054450.ch3
Polson, D., Bollasina, M., Hegerl, G. C., and Wilcox, L. (2014). Decreased monsoon precipitation in the Northern Hemisphere due to anthropogenic aerosols. Geophys. Res. Lett. 41, 6023–6029. doi:10.1002/2014gl060811
Rammig, A., Wiedermann, M., Donges, J. F., Babst, F., Von Bloh, W., Frank, D., et al. (2015). Coincidences of climate extremes and anomalous vegetation responses: comparing tree ring patterns to simulated productivity. Biogeosciences 12, 373–385. doi:10.5194/bg-12-373-2015
Rasmussen, L. H., Michelsen, A., Ladegaard-Pedersen, P., Nielsen, C. S., and Elberling, B. (2020). Arctic soil water chemistry in dry and wet tundra subject to snow addition, summer warming and herbivory simulation. Soil Biol. Biochem. 141, 107676. doi:10.1016/j.soilbio.2019.107676
Ren, H., Wen, Z., Liu, Y., Lin, Z., Han, P., Shi, H., et al. (2023). Vegetation response to changes in climate across different climate zones in China. Ecol. Indic. 155, 110932. doi:10.1016/j.ecolind.2023.110932
Rojo, J., Rivero, R., Romero-Morte, J., Fernández-González, F., and Pérez-Badia, R. (2017). Modeling pollen time series using seasonal-trend decomposition procedure based on LOESS smoothing. Int. J. biometeorology 61, 335–348. doi:10.1007/s00484-016-1215-y
Ruehr, S., Keenan, T. F., Williams, C., Zhou, Y., Lu, X., Bastos, A., et al. (2023). Evidence and attribution of the enhanced land carbon sink. Nat. Rev. Earth Environ. 4, 518–534. doi:10.1038/s43017-023-00456-3
Schwalm, C. R., Anderegg, W. R. L., Michalak, A. M., Fisher, J. B., Biondi, F., Koch, G., et al. (2017). Global patterns of drought recovery. Nature 548, 202–205. doi:10.1038/nature23021
Seddon, A. W. R., Macias-Fauria, M., Long, P. R., Benz, D., and Willis, K. J. (2016). Sensitivity of global terrestrial ecosystems to climate variability. Nature 531, 229–232. doi:10.1038/nature16986
Slot, M., Rifai, S. W., Eze, C. E., and Winter, K. (2024). The stomatal response to vapor pressure deficit drives the apparent temperature response of photosynthesis in tropical forests. New Phytol. 244, 1238–1249. doi:10.1111/nph.19806
Stagge, J. H., Kingston, D. G., Tallaksen, L. M., and Hannah, D. M. (2017). Observed drought indices show increasing divergence across Europe. Sci. Rep. 7, 14045. doi:10.1038/s41598-017-14283-2
Svoma, B. M., Krahenbuhl, D. S., Bush, C. E., Malloy, J. W., White, J. R., Wagner, M. A., et al. (2013). Expansion of the northern hemisphere subtropical high pressure belt: trends and linkages to precipitation and drought. Phys. Geogr. 34, 174–187. doi:10.1080/02723646.2013.820657
Tang, Y., Luo, M., Wu, S., and Li, X. (2025). Increasing synchrony of extreme heat and precipitation events under climate warming. Geophys. Res. Lett. 52, e2024GL113021. doi:10.1029/2024GL113021
Tang, Y., Xu, X., Zhou, Z., Qu, Y., and Sun, Y. (2021). Estimating global maximum gross primary productivity of vegetation based on the combination of MODIS greenness and temperature data. Ecol. Inf. 63, 101307. doi:10.1016/j.ecoinf.2021.101307
Teskey, R., Wertin, T., Bauweraerts, I., Ameye, M., Mcguire, M. A., and Steppe, K. (2015). Responses of tree species to heat waves and extreme heat events. Plant Cell and Environ. 38, 1699–1712. doi:10.1111/pce.12417
Tian, L., Zhang, Y., Chen, P., Zhang, F., Li, J., Yan, F., et al. (2021). How does the waterlogging regime affect crop yield? A global meta-analysis. Front. Plant Sci. 12, 634898. doi:10.3389/fpls.2021.634898
Ting, M., Lesk, C., Liu, C., Li, C., Horton, R. M., Coffel, E. D., et al. (2023). Contrasting impacts of dry versus humid heat on US corn and soybean yields. Sci. Rep. 13, 710. doi:10.1038/s41598-023-27931-7
Turner, N. C. (2019). Imposing and maintaining soil water deficits in drought studies in pots. Plant Soil 439, 45–55. doi:10.1007/s11104-018-3893-1
Van Der Molen, M. K., Dolman, A. J., Ciais, P., Eglin, T., Gobron, N., Law, B. E., et al. (2011). Drought and ecosystem carbon cycling. Agric. For. Meteorology 151, 765–773. doi:10.1016/j.agrformet.2011.01.018
Velásquez, A. C., Castroverde, C. D. M., and He, S. Y. (2018). Plant–Pathogen warfare under changing climate conditions. Curr. Biol. 28, R619–R634. doi:10.1016/j.cub.2018.03.054
Vicente-Serrano, S. M., Beguería, S., and López-Moreno, J. I. (2010). A multiscalar drought index sensitive to global warming: the standardized precipitation evapotranspiration index. J. Clim. 23, 1696–1718. doi:10.1175/2009JCLI2909.1
Von Buttlar, J., Zscheischler, J., Rammig, A., Sippel, S., Reichstein, M., Knohl, A., et al. (2018). Impacts of droughts and extreme-temperature events on gross primary production and ecosystem respiration: a systematic assessment across ecosystems and climate zones. Biogeosciences 15, 1293–1318. doi:10.5194/bg-15-1293-2018
Wada, Y., Van Beek, L. P., Wanders, N., and Bierkens, M. F. (2013). Human water consumption intensifies hydrological drought worldwide. Environ. Res. Lett. 8, 034036. doi:10.1088/1748-9326/8/3/034036
Wanders, N., and Wada, Y. (2015). Human and climate impacts on the 21st century hydrological drought. J. Hydrology 526, 208–220. doi:10.1016/j.jhydrol.2014.10.047
Wang, J., Jiang, F., Wang, H., Qiu, B., Wu, M., He, W., et al. (2021). Constraining global terrestrial gross primary productivity in a global carbon assimilation system with OCO-2 chlorophyll fluorescence data. Agric. For. Meteorology 304–305, 108424. doi:10.1016/j.agrformet.2021.108424
Wang, P., Yang, Y., Tang, J., Leung, L. R., and Liao, H. (2021). Intensified humid heat events under global warming. Geophys. Res. Lett. 48, e2020GL091462. doi:10.1029/2020GL091462
Wang, S., Zhang, Y., Ju, W., Chen, J. M., Ciais, P., Cescatti, A., et al. (2020). Recent global decline of CO2 fertilization effects on vegetation photosynthesis. Science 370, 1295–1300. doi:10.1126/science.abb7772
Wang, Y., Shen, X., Jiang, M., Tong, S., and Lu, X. (2022). Daytime and nighttime temperatures exert different effects on vegetation net primary productivity of marshes in the western Songnen Plain. Ecol. Indic. 137, 108789. doi:10.1016/j.ecolind.2022.108789
Wankmüller, F. J. P., Delval, L., Lehmann, P., Baur, M. J., Cecere, A., Wolf, S., et al. (2024). Global influence of soil texture on ecosystem water limitation. Nature 635, 631–638. doi:10.1038/s41586-024-08089-2
Wei, X., He, W., Zhou, Y., Ju, W., Xiao, J., Li, X., et al. (2022). Global assessment of lagged and cumulative effects of drought on grassland gross primary production. Ecol. Indic. 136, 108646. doi:10.1016/j.ecolind.2022.108646
Wu, X., and Jiang, D. (2022). Probabilistic impacts of compound dry and hot events on global gross primary production. Environ. Res. Lett. 17, 034049. doi:10.1088/1748-9326/ac4c5b
Xiao, J., Chevallier, F., Gomez, C., Guanter, L., Hicke, J. A., Huete, A. R., et al. (2019). Remote sensing of the terrestrial carbon cycle: a review of advances over 50 years. Remote Sens. Environ. 233, 111383. doi:10.1016/j.rse.2019.111383
Xu, C., McDowell, N. G., Fisher, R. A., Wei, L., Sevanto, S., Christoffersen, B. O., et al. (2019). Increasing impacts of extreme droughts on vegetation productivity under climate change. Nat. Clim. Chang. 9, 948–953. doi:10.1038/s41558-019-0630-6
Xu, W., Prieme, A., Cooper, E. J., Mörsdorf, M. A., Semenchuk, P., Elberling, B., et al. (2021). Deepened snow enhances gross nitrogen cycling among Pan-Arctic tundra soils during both winter and summer. Soil Biol. Biochem. 160, 108356. doi:10.1016/j.soilbio.2021.108356
Yao, T., Thompson, L. G., Mosbrugger, V., Zhang, F., Ma, Y., Luo, T., et al. (2012). Third Pole environment (TPE). Environ. Dev. 3, 52–64. doi:10.1016/j.envdev.2012.04.002
Yao, Y., Fu, B., Liu, Y., Li, Y., Wang, S., Zhan, T., et al. (2022). Evaluation of ecosystem resilience to drought based on drought intensity and recovery time. Agric. For. Meteorology 314, 108809. doi:10.1016/j.agrformet.2022.108809
Yu, Z., Wang, J., Liu, S., Rentch, J. S., Sun, P., and Lu, C. (2017). Global gross primary productivity and water use efficiency changes under drought stress. Environ. Res. Lett. 12, 014016. doi:10.1088/1748-9326/aa5258
Yuan, W., Cai, W., Chen, Y., Liu, S., Dong, W., Zhang, H., et al. (2016). Severe summer heatwave and drought strongly reduced carbon uptake in Southern China. Sci. Rep. 6, 18813. doi:10.1038/srep18813
Zandalinas, S. I., Fritschi, F. B., and Mittler, R. (2020). Signal transduction networks during stress combination. J. Exp. Bot. 71, 1734–1741. doi:10.1093/jxb/erz486
Zhang, H., and Sonnewald, U. (2017). Differences and commonalities of plant responses to single and combined stresses. Plant J. 90, 839–855. doi:10.1111/tpj.13557
Zhang, Y., Piao, S., Sun, Y., Rogers, B. M., Li, X., Lian, X., et al. (2022). Future reversal of warming-enhanced vegetation productivity in the Northern Hemisphere. Nat. Clim. Chang. 12, 581–586. doi:10.1038/s41558-022-01374-w
Zhang, Y., Xiao, X., Zhou, S., Ciais, P., McCarthy, H., and Luo, Y. (2016). Canopy and physiological controls of GPP during drought and heat wave. Geophys. Res. Lett. 43, 3325–3333. doi:10.1002/2016GL068501
Zhang, Z., Ju, W., Zhou, Y., and Li, X. (2022). Revisiting the cumulative effects of drought on global gross primary productivity based on new long-term series data (1982–2018). Glob. Change Biol. 28, 3620–3635. doi:10.1111/gcb.16178
Zhao, A., Yu, Q., Feng, L., Zhang, A., and Pei, T. (2020). Evaluating the cumulative and time-lag effects of drought on grassland vegetation: a case study in the Chinese Loess Plateau. J. Environ. Manag. 261, 110214. doi:10.1016/j.jenvman.2020.110214
Zhao, B., Horvat, C., and Gao, H. (2025). An optimal path threshold method for rigorously identifying extreme climate events. Environ. Res. Lett. 20, 024048. doi:10.1088/1748-9326/adae24
Zhao, M., and Running, S. W. (2010). Drought-induced reduction in global terrestrial net primary production from 2000 through 2009. Science 329, 940–943. doi:10.1126/science.1192666
Zhou, S., Wu, S., Gao, J., Liu, L., Li, D., Yan, R., et al. (2024). Increased stress from compound drought and heat events on vegetation. Sci. Total Environ. 949, 175113. doi:10.1016/j.scitotenv.2024.175113
Zhu, X., Zhang, S., Liu, T., and Liu, Y. (2021). Impacts of heat and drought on gross primary productivity in China. Remote Sens. 13, 378. doi:10.3390/rs13030378
Zhu, Y., Cheng, Z., Feng, K., Chen, Z., Cao, C., Huang, J., et al. (2022). Influencing factors for transpiration rate: a numerical simulation of an individual leaf system. Therm. Sci. Eng. Prog. 27, 101110. doi:10.1016/j.tsep.2021.101110
Keywords: compound dry-hot events, compound humid-hot events, gross primary productivity, ecosystem types, climate zones
Citation: Liu M, Yu H, Duan W and Wu M (2025) Differential impacts of compound dry- and humid-hot events on global vegetation productivity. Front. Environ. Sci. 13:1597553. doi: 10.3389/fenvs.2025.1597553
Received: 21 March 2025; Accepted: 22 May 2025;
Published: 03 June 2025.
Edited by:
Binggeng Xie, Hunan Normal University, ChinaReviewed by:
Jiahua Zhang, Chinese Academy of Sciences (CAS), ChinaConstantin Nechita, National Institute for research and Development in Forestry Marin Dracea (INCDS), Romania
Copyright © 2025 Liu, Yu, Duan and Wu. This is an open-access article distributed under the terms of the Creative Commons Attribution License (CC BY). The use, distribution or reproduction in other forums is permitted, provided the original author(s) and the copyright owner(s) are credited and that the original publication in this journal is cited, in accordance with accepted academic practice. No use, distribution or reproduction is permitted which does not comply with these terms.
*Correspondence: Han Yu, aGFuLnl1QHNtYWlsLm5qdS5lZHUuY24=