 Yao Wenyan1
 Lin Fangzhou
- 1Informatization Office, Tongji University, Shanghai, China
- 2School of Economics and Management, Tongji University, Shanghai, China
- 3School of Education, UCSI University, Kuala Lumpur, Malaysia
Agricultural activities markedly influence China’s goals of reaching carbon emission peaks and achieving carbon neutrality. This study explores the mechanisms by which digitalization in agriculture impacts carbon emissions and develops a corresponding analytical model. It examines the extent of agricultural digitalization and carbon emissions across 31 Chinese provinces from 2013 to 2020. Empirical findings demonstrate that digital agricultural practices significantly reduce carbon emissions within the agricultural sector, exhibiting notable spatial spillover effects. Additionally, green technological innovation and environmental regulatory frameworks act as crucial intermediary factors. The efficacy of digital agricultural technologies in reducing emissions varies across regions, showing stronger effects in inland provinces and areas primarily engaged in grain production, compared to non-grain-producing regions. The results contribute to the ongoing discussions on pathways for agricultural carbon mitigation in the context of rapid digital transformation in China’s agriculture. Furthermore, the study emphasizes the necessity of addressing agricultural environmental externalities and emphasizes the pivotal role of environmental regulations in reducing agricultural carbon emissions, aligning with China’s ecological governance objectives.
1 Introduction
Since the 1980s, there has been a rising trend in the frequency of tsunamis, alongside environmental changes like glacier melts and global warming, posing severe threats to human life and production. A global consensus has emerged to proactively respond to climate change, with nations implementing various mitigation measures. During the 75th UN General Assembly held in September 2020, China officially announced its commitment to reaching peak carbon emissions before 2030 and attaining carbon neutrality before 2060. Agriculture, responsible for approximately 24% of total global emissions, significantly contributes to China’s carbon emissions (Zhao et al., 2023). China is a leading producer of key agricultural products, such as rice, aquatic products, and pork. In response, as early as 2015, the China Ministry of Agriculture (CMA) introduced initiatives such as “The Action Plan for Zero Growth of Fertilizer and Pesticide Usage” (CMA, 2015a) and “The Action Plan for Governance of Agricultural Non-point Source Pollution” (CMA, 2015b). In 2018, the China Ministry of Ecology and Environment (CMEE) launched “The Action Plan for the Battle of Agricultural and Rural Pollution Control” (CMEE, 2018). Consequently, reducing agricultural carbon emissions has become a critical goal for the Chinese government.
A key trend in China’s agricultural development is digital agriculture, as digital technologies are becoming increasingly prevalent. The ongoing advancement of digital services in rural areas, combined with improved digital skills among farmers, has promoted the widespread adoption of digital agricultural practices. Consequently, the impact of digital agriculture on agricultural carbon emissions has intensified. The Food and Agriculture Organization (FAO) has labeled digital agriculture as the “fourth agricultural revolution,” highlighting its potential to address climate-related challenges by enhancing efficiency, fairness, and ecological sustainability in agricultural supply chains (Klingenberg et al., 2022). However, existing studies indicate that digital agriculture may influence carbon emissions in a bimodal manner. On one hand, it increases energy use, thereby increasing emissions (Henderson et al., 2020); on the other hand, it enhances energy efficiency, contributing to emission reductions (Strubell et al., 2020). Yet, the specific mechanisms by which digital agriculture impacts carbon emissions remain insufficiently explored. Moreover, disparities in internet accessibility and digital infrastructure between urban and rural regions create a substantial “digital divide,” hampering the equitable deployment of digital agricultural technologies, especially in inland and underdeveloped provinces.
Existing research has provided valuable insights into the sources of agricultural carbon emissions and the role of digital technologies in energy conservation and carbon reduction. Studies on agricultural carbon emissions have primarily focused on identifying emission sources and quantifying their contributions (West and Marland, 2002; Johnson et al., 2007; Vleeshouwers and Verhagen, 2002; Tasman, 2009). Methane emissions from rice paddies, direct nitrous oxide emissions from soils, and livestock emissions are significant contributors (Tian and Zhang, 2013). Different agricultural practices, land-use changes, and climate conditions significantly influence emission levels (Babbar et al., 2021; Chang et al., 2022).
Meanwhile, digital innovation has been shown to reduce energy consumption, increase clean energy use, and decrease energy intensity across various sectors (Yoo et al., 2012; Jing et al., 2023; Bano et al., 2022; Hong et al., 2023). Research specific to agriculture is emerging: for example, Ma et al. (2022) identified digitalization as significantly lowering agricultural carbon emissions through digital financial inclusion, Wang et al. (2024) highlighted the role of technological advancement and farm expansion, and Zhao et al. (2023) confirmed digital transformation’s effectiveness in reducing agricultural carbon intensity. However, concerns regarding the rebound effect of digitalization (Smeets et al., 2014; Gelenbe and Caseau, 2015) suggest that the relationship may be more complex.
Notably, Chen and Li (2024) explored the relationship between digital agriculture and carbon emissions using China’s provincial panel data, confirming that digital transformation significantly reduces agricultural carbon emissions. However, their analysis predominantly focused on the direct effects of digitalization, without addressing the mediating mechanisms or potential spatial spillover effects associated with digital agricultural development. This gap highlights the need for more comprehensive investigations into how digital agriculture influences carbon emissions through both direct and indirect pathways.
Despite these advances, several limitations in the existing literature remain. First, prior research has largely concentrated on the direct impact of digital agriculture, often overlooking the roles of green technological innovation and environmental regulation as mediators. Second, few studies have explicitly examined how digital agriculture generates spatial spillover effects across regions. Compared with existing studies such as Chen and Li (2024), which primarily examine the direct effects of digital agriculture on carbon emissions, this study incorporates spatial spillover effects and investigates the mediating roles of green technological innovation and environmental regulation, thereby providing a more comprehensive and multidimensional analytical framework.
This study aims to explore two core research questions: (1) whether digital agriculture effectively lowers agricultural carbon emissions, and (2) through what underlying mechanisms digital agriculture affects these emissions. The key contributions of this paper are as follows: first, it constructs a comprehensive theoretical framework linking digital agriculture with environmental regulation, green technological innovation, and agricultural carbon emissions, addressing the gap in prior research concerning environmental regulation. Second, it extends the limited research on the impact of digital agriculture on carbon emissions by incorporating mediating and spatial spillover effects. Finally, it provides empirical evidence based on panel data from 31 Chinese provinces spanning from 2013 to 2020, using a Spatial Durbin Model (SDM) to capture spatial dependencies more effectively.
2 Theoretical analysis and hypotheses
2.1 Direct influence of digital agriculture on agricultural carbon emissions
Technologies such as 5G, IoT, cloud-based computing, and artificial intelligence (AI) are widely utilized in agriculture. These tools affect the entire agricultural supply chain—from initial input providers to final consumers—and significantly impact carbon emissions within the sector.
First, digital technologies in agricultural production conserve resources and enhance efficiency, thus reducing carbon emission intensity. Wearable sensors and real-time monitoring technology instantly identify livestock conditions; IoT-based systems optimize irrigation and fertilization, minimizing water and fertilizer usage; blockchain technologies, drones, and robots help reduce pesticide and herbicide application; IoT-based smart management systems facilitate the integration of various agricultural activities, providing renewable energy solutions such as agricultural photovoltaic and water-photovoltaic systems (Jouanjean, 2019).
Second, in agricultural product marketing, digital technologies address information asymmetry and enhance transaction efficiency. Digital platforms and tools not only enable more accessible and cost-effective information retrieval but also reduce trade and transaction costs throughout—from contract negotiation to delivery. They also connect suppliers, farms, traders, processing units, retailers, and consumers on a single platform, enabling the sharing of information and services. Even small farmers in remote areas can access market demand information and agricultural extension services through new digital platforms and applications. Yang (2022) utilized field surveys from 2018 to 2020 in Vietnam, Thailand, and China to illustrate how domestic and cross-border platforms facilitate the expansion of Southeast Asian fresh fruit trade into the Chinese market, creating a trade and distribution network. Digital technologies also support enhanced product traceability and ensure better monitoring of product compliance, integrity, and safety, fostering a more transparent and efficient trading and regulatory environment.
Third, in agricultural logistics, digital technologies reduce logistics costs and improve efficiency. Digital solutions introduce new approaches to agricultural and food trade logistics, including innovative trade financing tools. Alesiuniene et al. (2021) found that IoT-enabled sensors and systems within food and beverage supply chains provide real-time tracking and data-driven insights, enabling stakeholders to optimize operational efficiency, lower expenses, and conduct proactive maintenance. Based on these observations, we suggest:
Hypothesis 1. Digital agriculture significantly reduces carbon emissions in the agricultural sector.
2.2 Spatial spillover impacts of digital agriculture on agricultural carbon emissions
Tobler’s First Law of Geography (Tobler, 1970) suggests that spatial spillovers involve socio-economic activities that affect not only their immediate localities but also adjacent areas and more distant regions. The spatial spillover effects of digital agriculture on agricultural carbon emissions are evident from two perspectives.
Firstly, digital technologies facilitate the mobility and exchange of production resources. The rapid expansion of digital infrastructures enhances the collection, processing, and sharing of large-scale data, helping to dismantle “information silos” and facilitating the movement of labor, capital, and technology. In agriculture, the “core-periphery” model of new economic geography (Krugman, 1991) suggests that factor flow not only benefit the agglomeration of agricultural processing enterprises but also support the development of agricultural clusters, such as the corn-soybean cluster in Northeast China and the wheat cluster in the Huang-Huai-Hai region. According to the Marshall-Arrow-Romer (MAR) externality theory, industrial agglomeration reduces communication time costs and information asymmetry between agricultural enterprises and farmers, accelerates the dissemination of green technologies, and generates knowledge spillover effects, improving ecological performance and increasing efficiency while decreasing carbon emissions within agricultural clusters.
Second, peer effects. Niu et al. (2022) showed that adopting environmentally friendly pest management practices has a considerable peer influence, such as implementing ecological regulations and rational pesticide use, which are resource-saving and environmentally friendly measures. Deng and Zhao (2018) concluded that these peer influences arise mainly through learning, imitation, and competitive behaviors among agricultural businesses and farmers in adjacent areas. Based on these insights, we formulate:
Hypothesis 2. Digital agriculture produces negative spatial spillover effects on agricultural carbon emissions.
2.3 Indirect influence of digital agriculture on agricultural carbon emissions
Digital agriculture indirectly influences agricultural carbon emissions by fostering green innovation. Zheng and Zhang (2023), in their study of 2,660 Chinese manufacturing firms from 2015 to 2020, discovered that digital agriculture enhances firms’ capacities for green innovation, with corporate social responsibility serving as a mediator. Similarly, Liu D. et al. (2021) analyzed publicly listed agricultural enterprises in China from 2015 to 2020 and demonstrated that digital agriculture significantly boosts both the scale and quality of technological innovation in agriculture-related firms. According to Porter’s hypothesis (Porter and Van der Linde, 1995), inefficient resource use and significant resource waste are direct causes of pollution. The implementation of end-of-pipe regulations to reduce environmental pollution can incentivize innovations in upstream processes, improving resource utilization and driving both green technological advancements and pollution reduction.
Digital agriculture also affects agricultural carbon emissions through environmental regulation. Research indicates that digital agriculture contributes to minimizing information gaps and improves the transparency of information. Wang et al. (2022), utilizing data from Chinese listed firms spanning 2010 to 2020, revealed that digital agriculture markedly improves corporate information disclosure quality. Chen et al. (2024) discovered that digital technology significantly enhances companies’ information processing capabilities, using panel data from 929 listed companies in China from 2016 to 2020. AI extracts valuable information from diverse data sources and formats to provide tailored services; cloud computing offers computational power and storage resources to support the growing demands of data management and analysis; big data analytics allows for rapid, efficient analysis of large datasets, facilitating informed decision-making in a dynamic business environment; and blockchain technology ensures data confidentiality and authenticity through robust encryption, distributed ledgers, and decentralized methods, thereby enhancing the quality, reliability, and speed of information flow. Enhanced information disclosure places institutional pressure on local governments and companies to strengthen environmental regulation, given the negative impacts of pollution on talent retention, economic development, and government reputation (Chen et al., 2020). Environmental regulation is a critical method for addressing the externalities of environmental pollution (Kapp, 2011). Based on these insights, we propose:
Hypothesis 3. Digital agriculture influences agricultural carbon emissions through green technological innovation and environmental regulation.
3 Methods and data
3.1 Model construction
3.1.1 Baseline regression model
To analyze how digital agriculture influences carbon emissions in agriculture, we construct the following baseline econometric model:
In Equation 1, i and t denote province and year, respectively. The explained variable
3.1.2 Spatial spillover effects model
Existing studies demonstrate that agricultural carbon emissions exhibit clear spatial dependence (Tian and Yin, 2022). Many scholars highlight that ignoring spatial interactions among economic indicators can lead to biased conclusions. Therefore, this study employs spatial econometric techniques to account for spatial correlations between variables and to investigate the impact of digital agriculture on agricultural carbon emissions. The specific spatial econometric model is as follows:
In Equations 2, 3,
Spatial weighting matrices commonly include adjacency and geographic-distance matrices, representing geographic interactions. This research uses the adjacency matrix as the primary spatial weight structure, supplemented by the geographic-distance matrix for robustness testing. Specifically, the adjacency matrix considers first-order neighborhood relationships: if two provinces share a common boundary, the value is set to 1; otherwise, it is 0, as represented in Equations 4, 5:
3.1.3 Mechanism test model
To examine the channels through which digital agriculture influences carbon emissions in agriculture, we establish a mediation analysis framework, using environmental regulation and green technological innovation as intermediary variables. Initially, we investigate how digital agriculture impacts environmental regulation and green innovation by specifying the mediation models as follows:
Equation 6 investigates the effect of digital agriculture on the mediators, whereas Equation 7 analyzes the combined influence of digital agriculture and the mediators on agricultural carbon emissions.
3.2 Variable construction
3.2.1 Dependent variable
In this research, the dependent variable is defined as the carbon emission intensity from agriculture. Following Li et al. (2021), agricultural carbon emissions are estimated using IPCC-recommended coefficients. Six emission sources relevant to agricultural production are selected: fertilizers, pesticides, agricultural films, diesel consumption, irrigation, and tillage. Agricultural carbon emissions are computed using the corresponding emission factors, as shown below:
In Equation 8, E denotes total agricultural carbon emissions, Ti indicates the quantity of the i-th emission source, and
In agricultural production, various inputs contribute to carbon emissions, with their emission coefficients sourced from reputable references. Fertilizers have a carbon emission coefficient of 0.8956 kg C·kg-1, based on data from Oak Ridge National Laboratory in the United States. Pesticides, another crucial agricultural input, exhibit a carbon emission coefficient of 4.9341 kg C·kg-1, also from Oak Ridge National Laboratory. The carbon emission coefficient of agricultural films is reported as 5.1800 kg C·kg-1 by the Institute of Agricultural Resources and Ecological Environment at Nanjing Agricultural University. Diesel fuel, commonly used in agricultural machinery, has an emission coefficient of 0.5927 kg C·kg-1, according to the Intergovernmental Panel on Climate Change (IPCC). Tillage activities are associated with a significant emission coefficient of 312.60 kg C·hm-2, as documented by the College of Biology and Technology at China Agricultural University. Additionally, irrigation contributes an emission coefficient of 266.48 kg C·hm-2, according to Dubey and Lal (2009).
Using coefficient data and provincial statistical yearbooks, we calculated agricultural carbon emissions at the provincial level. ARCGIS 10.2 software was then employed to create spatial maps depicting provincial agricultural carbon emissions for the years 2013 and 2020 (Figure 1). The comparative analysis uncovered two primary trends: First, agricultural emissions demonstrated a declining pattern, decreasing from 81.9 million tons in 2013 to 74.67 million tons in 2020. This decline can likely be attributed to China’s recent promotion of green technologies, the push for zero growth in agricultural fertilizers and pesticides, and efforts aimed at mitigating agricultural non-point source pollution (Guo and Zhang, 2023). Secondly, significant spatial discrepancies in agricultural carbon emissions were identified. Provinces such as Shandong, Henan, Hebei, Jiangsu, Anhui, Heilongjiang, and Xinjiang reported higher emission levels, while provinces like Fujian, Jiangxi, Hainan, Ningxia, Shanxi, and Guizhou exhibited lower emissions. These variations may stem from differences in crop structures and the intensity of land use across provinces.
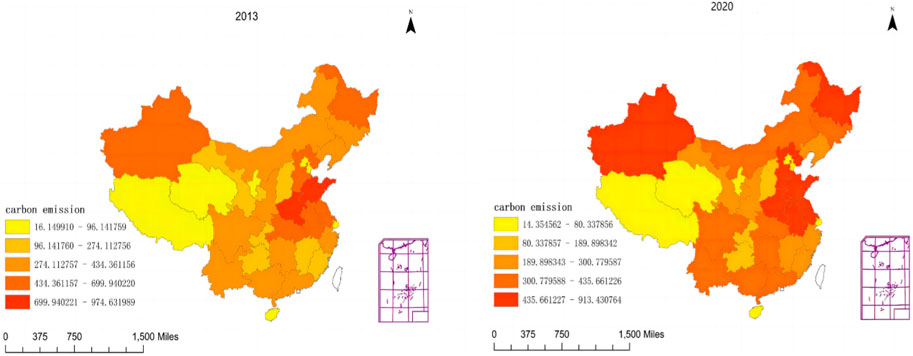
Figure 1. Geographical distribution of agricultural carbon emissions (104 tons) for the years 2013 and 2020.
3.2.2 Core explanatory variables
The main explanatory variable is the comprehensive development level of digital agriculture. Following the framework established by Jiang et al. (2022), digital agriculture is assessed across three key dimensions: digital infrastructure (Digital_infr), digital industrialization (Digital_indu), and farmers’ digital literacy (Digital_enti). The digital infrastructure dimension is quantified by the level of internet accessibility in rural areas, represented by the ratio of rural broadband subscribers to the rural population. The digital industrialization aspect is captured by the quantity of “Taobao Villages.” According to the Alibaba Research Institute (ARI), a “Taobao Village” is defined as a rural area where online businesses actively represent at least 10% of local households, and annual e-commerce transactions exceeding 10 million yuan (ARI, 2021). Farmers’ digital literacy is gauged by comparing the average communication expenditure per capita in rural areas to the average per capita consumption expenditure.
To integrate these metrics into a single comprehensive measure of digital agriculture, we applied the entropy weighting method. This data-driven technique assigns weights to indicators based on their intrinsic characteristics, offering greater objectivity, accuracy, and reliability compared to subjective weighting methods. The comprehensive digital agriculture development was evaluated using the entropy weighting approach in four steps:
1 Standardize the data using the formula:
In Equation 9,
2 Compute the proportion of each indicator for year i as represented in Equation 10.
3 Equations 11, 12 calculate the information entropy(
where K = 1/l nm, and m is the number of years.
4 Equation 13 calculates the indicator weights
The results indicate that over the study period, the dimension of digital agriculture industrialization received the highest weight, averaging 0.5454. This was followed by digital agriculture infrastructure, with an average weight of 0.2958, while farmers’ digital literacy ranked third with an average weight of 0.1562.
Finally, the formula for calculating the overall level of digital agriculture is provided in Equation 14.
Using Equation 13 and data from provincial statistical yearbooks, the comprehensive digital agriculture level for each province was determined. By selecting 2013 and 2020 as reference years, spatial patterns of provincial digital agriculture development were visualized using ARCGIS 10.2 software (Figure 2). A comparative analysis of these years revealed two key trends: First, there was a general upward trend in the overall digital agriculture development level. Second, significant regional differences in digital agricultural practices were observed. In 2013, eastern coastal provinces, including Zhejiang, Shanghai, and Guangdong, demonstrated higher development levels, while provinces in the central and western regions were relatively less advanced. Notably, Alibaba, China’s largest e-commerce company, headquartered in Hangzhou, Zhejiang, has played a critical role in promoting digital agriculture in surrounding cities. By 2020, policies and financial support from the central government boosted digital agriculture in major agricultural regions of central and western China, leading to significant growth.
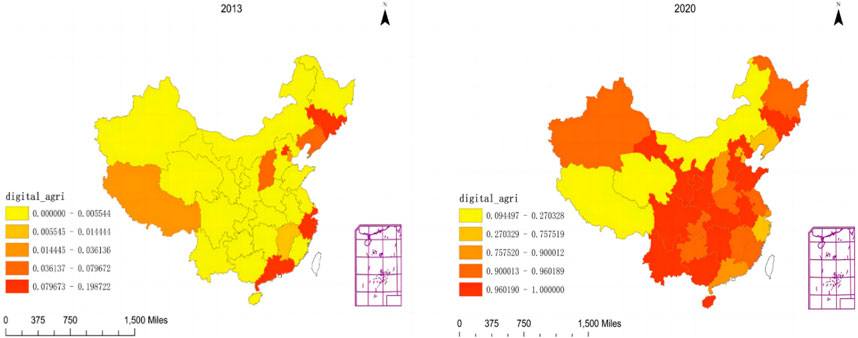
Figure 2. Spatial distribution of the agricultural digitalization index (dimensionless) for the years 2013 and 2020.
3.2.3 Control variables
Following the methodologies of Guo and Zhang (2023) and Yan et al. (2023), this study includes the following control variables: Industrial Structure (stru): This is represented by the proportion of agricultural output value in GDP. A higher proportion suggests greater agricultural activity, potentially increasing resource consumption and agricultural carbon emissions. Agricultural Mechanization Level (lnmachine): Defined as the natural logarithm of the total power of agricultural machinery, reflecting the degree of mechanization in rural production. Resource Consumption (lnelect): Defined as the natural logarithm of rural electricity consumption, capturing the intensity of agricultural energy use.
3.2.4 Mechanism variables
Agricultural Green Technology Innovation (GTI): Following Wang H. et al. (2021), green total factor productivity (TFP) in agriculture is used as the proxy indicator. We apply the Malmquist productivity approach, utilizing a non-radial, non-angular SBM directional distance model, which addresses issues of negative data values and angle biases in efficiency analysis. Inputs include agricultural fixed capital, labor, and energy, with the desired output being total agricultural production (in constant 2000 prices) and the undesirable output being agricultural carbon dioxide emissions. Agricultural fixed capital using the perpetual inventory approach, while labor is represented by the average number of employees in agriculture. Energy usage is measured in 10,000 tons of standard coal. This study calculates agricultural green TFP for each province from 2013 to 2020, using data from the China Rural Statistical Yearbook and the China Energy Statistical Yearbook.
Environmental Regulation (ER): Measured by a comprehensive environmental regulatory index. Following Hu et al. (2022), data on industrial wastewater discharge, industrial SO2, and dust emissions across provinces between 2013 and 2020 were collected. The entropy weighting approach was used to develop the index.
3.3 Data sources
This research utilizes panel data covering 31 provinces in China from 2013 to 2020. Variables such as industrial structure, agricultural mechanization, natural disaster impacts, and resource utilization were obtained from multiple editions of the “China Statistical Yearbook.” Information on Taobao Villages was sourced from the “2020 China Taobao Village Research Report” issued by the Alibaba Research Institute. Data gaps were supplemented by provincial-level statistical reports and annual yearbooks. Summary statistics are presented in Table 1. Since all data used in this study are at the provincial level and sourced from public government datasets, there are no data privacy concerns or individual-level data involved.
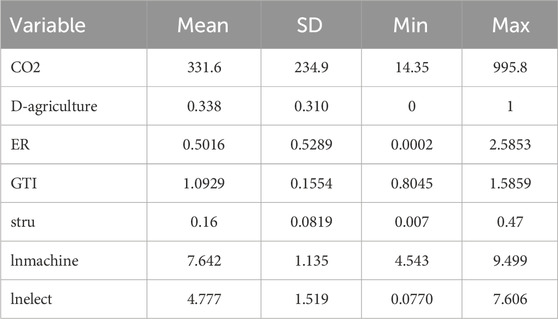
Table 1. Descriptive statistics.
4 Results and discussion
4.1 Baseline regression analysis
Column (1) in Table 2 indicates that digital agriculture significantly reduces agricultural carbon emissions, even without control variables, with significance at the 1% level. Column (2) further shows that after including control variables, the coefficient remains relatively unchanged, confirming Hypothesis 1: digital agriculture significantly reduces agricultural carbon emissions. One plausible reason is that digital agricultural technologies effectively reduce chemical inputs and promote the adoption of green, low-carbon, and intensive agricultural practices, enhancing agricultural total factor productivity, which in turn reduces agricultural carbon emissions (Liu H. et al., 2021).
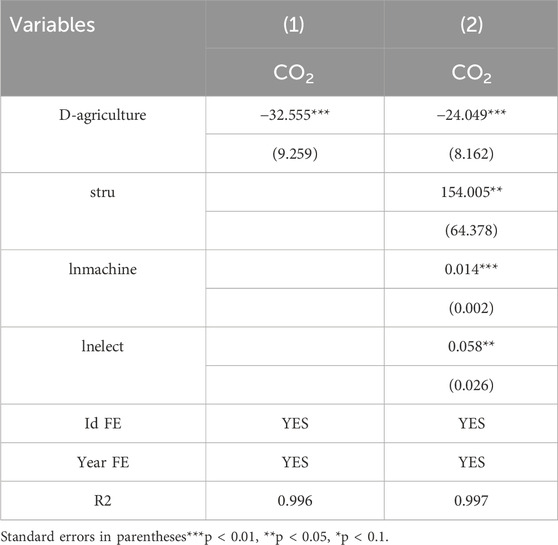
Table 2. Baseline regression analysis.
In terms of control variables, industrial structure has a significantly positive effect on agricultural carbon emissions at the 5% level. This indicates that regions with a higher share of agricultural output tend to experience greater carbon emissions, likely due to more intensive use of land, fertilizers, irrigation, and other inputs associated with traditional agricultural production (Yan et al., 2023). Agricultural mechanization significantly increases carbon emissions at the 1% level, likely due to the extensive use of machinery, which increases fossil fuel consumption (Rong et al., 2023). Resource consumption, particularly rural electricity, also contributes to carbon emissions at the 5% level, as rural electricity is primarily coal-based.
4.2 Spatial spillover effect analysis
4.2.1 Spatial autocorrelation test and model selection
The Global Moran’s Index is shown in Equation 15, where n represents the total provinces selected (in this study, n = 31), and
Before performing the spatial econometric analysis, multiple statistical procedures were applied to determine the appropriate model specification. Using the spatial adjacency weight matrix, we conducted LM, Wald, LR, Hausman, and fixed-effect tests. The significant LM test results suggested the use of a spatial econometric approach. Additionally, Wald and LR tests rejected the null hypothesis that the SDM could be simplified into either the Spatial Autoregressive Model (SAR) or Spatial Error Model (SEM), validating the suitability of the Spatial Durbin Model (SDM) model. The Hausman test indicated a preference for the fixed-effects approach over random-effects, confirming that the fixed-effects Spatial Durbin Model (SDM) using the spatial adjacency matrix is appropriate. Therefore, this study adopted the Spatial Durbin Model (SDM), incorporating bidirectional fixed effects. The choice of the Spatial Durbin Model (SDM) over the Spatial Autoregressive Model (SAR) and Spatial Error Model (SEM) is justified based on the results of the Wald and LR tests, which rejected the restrictions needed to simplify SDM into SAR or SEM. Moreover, SDM can capture both direct and indirect (spillover) effects, aligning with the study’s aim to investigate spatial externalities associated with digital agriculture. Therefore, SDM provides a more comprehensive framework for analyzing spatial dependencies.
4.2.2 Spatial effect analysis
The spatial spillover effects were further separated into direct and indirect components. The direct effect represents how digital agriculture affects local agricultural carbon emissions, while the indirect effect measures its spillover to neighboring regions. Table 3 summarizes the direct, indirect, and total effects of digital agriculture on agricultural carbon emissions using the spatial adjacency weight matrix. All coefficients are negative and statistically significant at the 1% level, confirming that digital agriculture effectively reduces agricultural carbon emissions both locally and in adjacent regions (Ma et al., 2022). The spatial autocorrelation parameter (ρ) is positive and significant at the 5% level, supporting Hypothesis 2. Additionally, the indirect (spillover) effects of digital agriculture on carbon emissions surpass the direct effects, highlighting the growing significance of spatial spillovers.
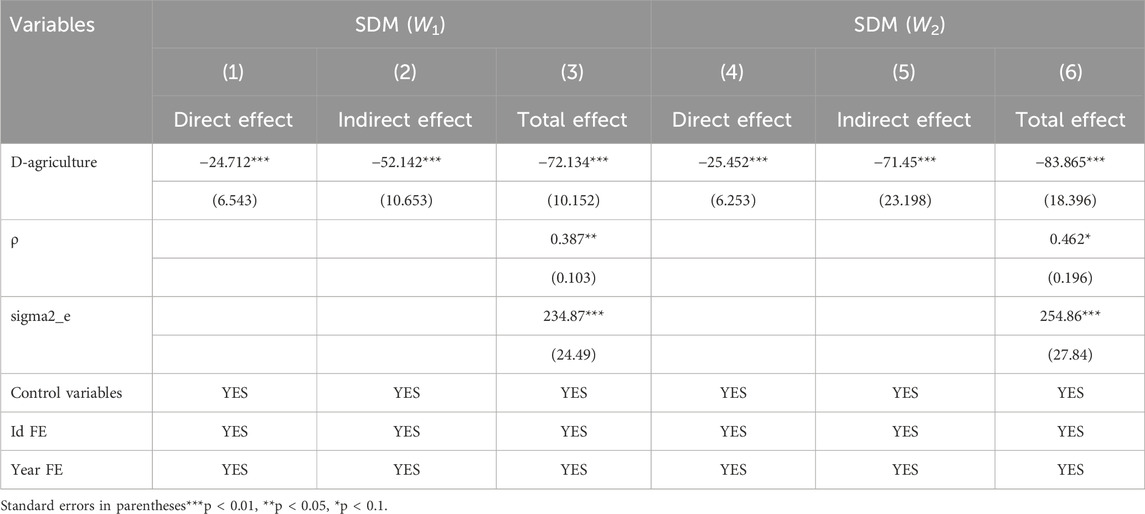
Table 3. Spatial effect analysis.
4.3 Endogeneity and robustness tests
4.3.1 Endogeneity discussion
To address potential endogeneity, two instrumental variables were introduced, following Shen et al. (2022): the number of post offices per million people in 1984 (post) and the spherical distance from provincial capitals to Hangzhou (dis). Historically, post offices were vital for information transmission, which correlates with digital agriculture without directly influencing agricultural carbon emissions, satisfying the exclusivity requirement. Additionally, since Hangzhou leads digital agricultural development, provinces closer to it are likely to have higher digital agriculture levels. The spherical distance from Hangzhou does not affect agricultural carbon emissions, fulfilling both the relevance and exclusivity requirements.
Columns (1) and (2) in Table 4 present the estimation results using two instrumental variables: post and dis. The instrumental relevance was verified through the first-stage F-statistic, which exceeded the conventional threshold of 10, indicating the absence of weak instruments. The Sargan overidentification test also confirmed the validity of the instruments. The first-stage coefficient is significantly positive, with an F-statistic value of 28.54, which exceeds the threshold of 10, indicating that weak instrumental variables are not an issue. Additionally, the Sargan statistic of 21.46 is significant at the 1% level, suggesting no over-identification problems. The findings from column (2) demonstrate that digital agriculture significantly reduces agricultural carbon emissions, remaining statistically significant at the 1% level even after addressing potential endogeneity issues related to omitted variables.
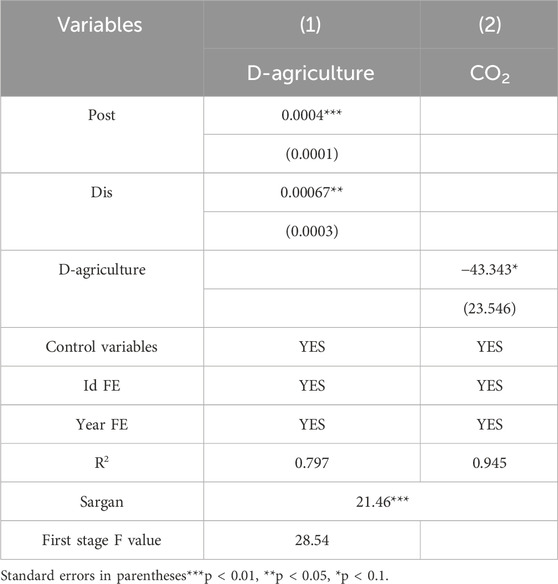
Table 4. Endogeneity and robustness tests.
4.3.2 Robustness checks
Exclusion of specific samples: Due to the unique administrative characteristics of Chinese municipalities, this study excludes municipalities from the sample. The regression outcomes following this exclusion are presented in Table 5. The coefficient magnitude, direction, and significance of digital agriculture remain consistent with the baseline estimations, confirming the robustness of the results.
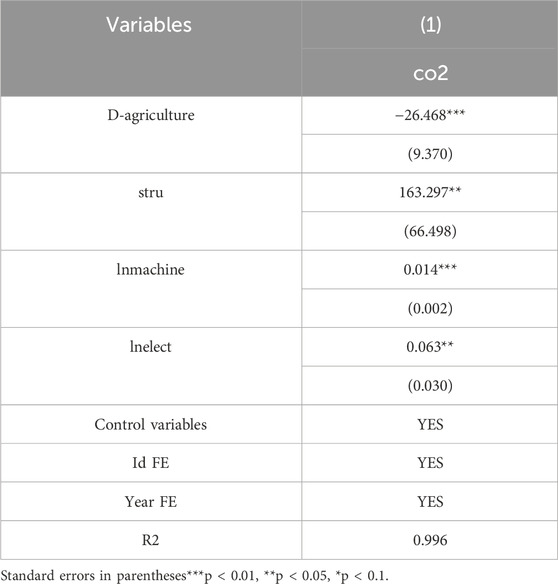
Table 5. Robustness tests.
Alternative spatial weighting matrices: This research replaces the adjacency matrix with a geographic distance-based matrix. The resulting regression outcomes are presented in columns (4), (5), and (6) of Table 3. The estimated coefficient magnitude, direction, and significance levels of digital agriculture remain stable, further validating the robustness of the findings.
4.4 Mechanism tests
The results of the mechanism tests are shown in Table 6.
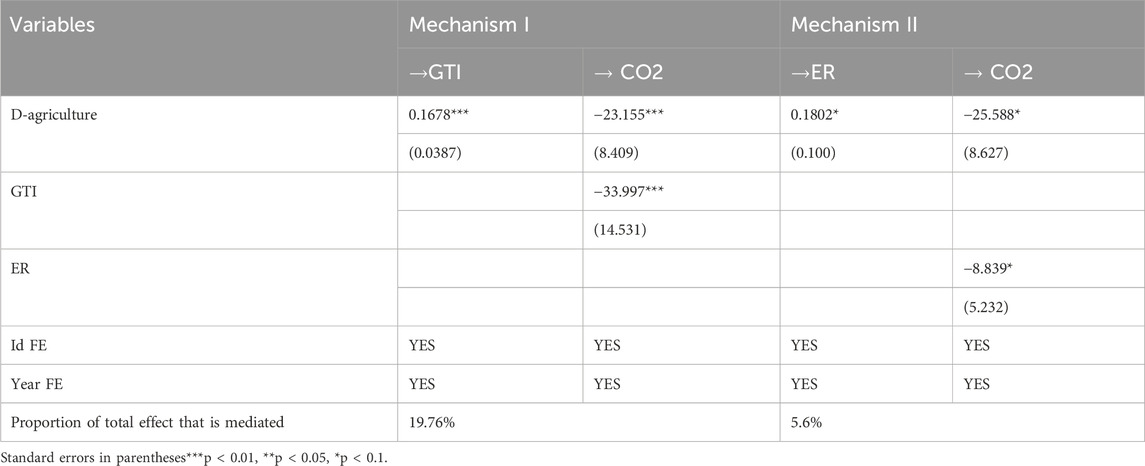
Table 6. Mechanism tests.
In Mechanism I: digital agriculture significantly promotes green technology innovation (GTI), which passes the significance test at the 1% level. Both digital agriculture (D-agriculture) and green technology innovation (GTI) significantly reduce agricultural carbon emissions at the 1% level, aligning with theoretical expectations. This outcome suggests that digital agriculture fosters the adoption and dissemination of green agricultural technologies, generating knowledge spillover effects, reducing pollution, and ultimately lowering agricultural carbon emissions (Wang H. et al., 2021).
In Mechanism II: digital agriculture (D-agriculture) significantly influences environmental regulation (ER), passing the 10% significance test. Both digital agriculture (D-agriculture) and environmental regulation (ER) show a significant negative effect on agricultural carbon emissions, also passing the 10% significance test, consistent with theoretical expectations. This result can be explained by digital technologies mitigating information asymmetry, leading to more comprehensive environmental disclosures, increasing pressure on local governments to strengthen regulations, and encouraging agricultural operators to comply with environmental laws, ultimately promoting green agricultural production and reducing carbon emissions.
4.5 Heterogeneity analysis
4.5.1 Heterogeneity in production structure
The adaptability of digital agricultural solutions to local conditions, including climate, crop types, and farming practices, is crucial for achieving optimal carbon reduction effects across diverse regions. In 2003, the China Ministry of Finance (CMF, 2003) designated 13 provinces as major grain-producing regions. In these areas, grain farming constitutes a larger share of agricultural activities, while non-major grain-producing regions focus more on other types of cultivation. Separate regression analyses were conducted for each group, with results shown in columns (1) and (2). Column (1) presents results for provinces primarily engaged in grain production, whereas column (2) displays findings for areas with lower grain production levels. The empirical results suggest that digital agriculture has a more substantial carbon emission reduction effect in regions predominantly focused on grain production. This is likely due to the specialized agricultural structures and larger-scale farming practices typical of grain-producing areas, which enhance resource use efficiency—particularly in water and fertilizer application—thereby reducing carbon emission intensity and bolstering carbon sequestration capacity (Zhu et al. 2022).
4.5.2 Heterogeneity in geographic location
Economic development disparities between coastal and inland provinces in China result in variations in the adoption of digital agriculture and its associated carbon reduction impacts. Separate regression analyses were performed for these two regional groups, with results provided in columns (3) and (4) of Table 7. The findings show that digital agriculture’s effect on carbon emission reduction is more significant in inland provinces. This may be attributed to the comparatively lower level of agricultural infrastructure development in inland regions, where carbon emission intensity is usually higher. Thus, the benefits of digital agriculture in emission reduction are more pronounced in these areas, reflecting a “latecomer advantage” when compared to coastal areas.
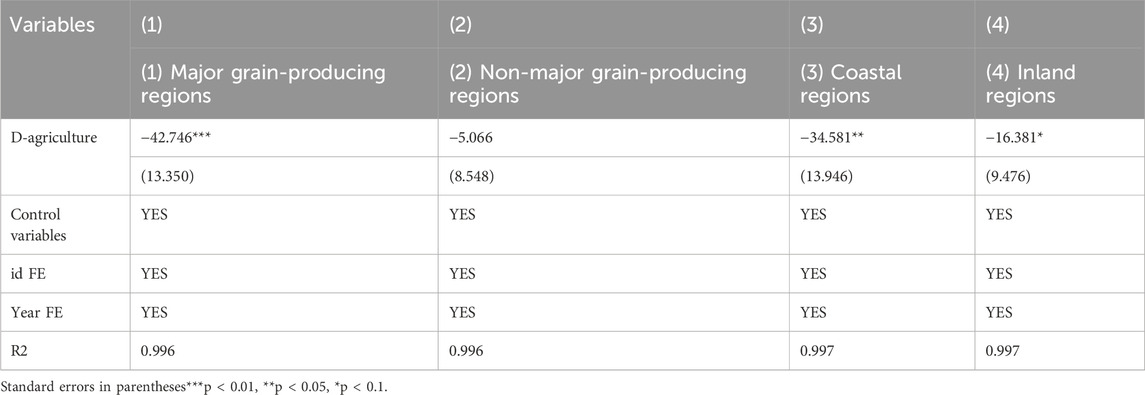
Table 7. Heterogeneity analysis.
5 Conclusion and implications
This research systematically examines the conceptual mechanism through which digital agriculture affects agricultural carbon emissions. It integrates environmental regulation and green technological innovation into the explanatory model, considering the externalities of agricultural carbon emissions. Using data from 31 Chinese provinces between 2013 and 2020, it calculates digital agriculture and total agricultural carbon emissions, while conducting empirical tests.
The findings indicate that digital agriculture significantly reduces agricultural carbon emissions, exhibiting considerable spatial spillover effects. Specifically, digital agriculture reduces emissions within provinces and also impacts neighboring regions. Mechanism testing reveals that both green technological innovation and environmental regulation show significant mediating effects. While green technological innovation has been extensively studied as a mediator in agricultural carbon emissions research, environmental regulation has often been overlooked. This study emphasizes the critical, yet often neglected, role of environmental regulation in reducing agricultural carbon emissions (Pawson, 2020).
The heterogeneity analysis reveals significant regional differences in the carbon reduction effects of digital agriculture. These effects are more pronounced in inland regions and major grain-producing areas, especially when comparing grain-producing to non-grain-producing regions.
The study offers several policy recommendations. First, to ensure that smallholder farmers and rural communities can effectively access and benefit from digital agricultural technologies, it is essential to implement government subsidies, promote inclusive digital infrastructure development, and establish targeted support programs to bridge the digital divide. Second, there is a need for enhanced government support for rural digital infrastructure, agricultural e-commerce, and the promotion and training of agricultural digital technologies. Recent studies (e.g., Dayıoğlu and Turker, 2021) highlight that digital agriculture plays a vital role in addressing rural economic challenges and improving livelihoods, underscoring the necessity for increased policy support. Furthermore, there is a pressing need to establish comprehensive digital literacy and technical training programs for farmers to enhance their capacity to effectively utilize new agricultural technologies. Thirdly, regional coordination in carbon reduction governance should be strengthened. Given the observed spatial spillover impacts associated with agricultural carbon emissions, governance and regulation should not be confined to individual regions but should involve collaboration across different areas. This requires neighboring local governments to align on environmental standards, policies, and actions, with stronger oversight from higher-level governments to ensure consistency. Fourth, the emission-reducing potential of digital agriculture should be supported by environmental regulations and green innovation policies. The carbon-reducing impacts of digital agriculture, both direct and indirect, can be amplified when combined with other supporting policies. Fifth, enhancing regional carbon reduction policies is crucial. Considering the significant differences in carbon emissions between coastal and inland areas, as well as between grain-producing and non-grain-producing regions, government investments in digital infrastructure should prioritize rural, inland, and major grain-producing areas to bridge the “digital divide” and ensure equitable development across regions.
This study contributes to the literature on agricultural carbon emissions by exploring carbon reduction pathways through China’s rapidly advancing digital agriculture sector. However, limitations arise due to data availability. By using provinces as the spatial unit of analysis, this approach may obscure regional differences within provinces. For instance, a single province in China can span multiple climate zones and diverse terrains with varying levels of agricultural development. Therefore, conclusions drawn at the provincial level may not fully capture the carbon reduction effects and mediating mechanisms of digital agriculture at smaller spatial scales. Moreover, provincial-level data may not entirely reflect theoretical expectations. For example, data on total agricultural machinery power at the provincial level overlooks the mobility of mechanization services, and environmental regulation based on industrial pollutants ignores cross-regional pollutant flows. Future research should focus on collecting and analyzing data on digital agriculture and carbon emissions at smaller spatial scales, enabling a more detailed exploration of digital agriculture’s carbon reduction effects in diverse rural areas. Future research could systematically assess the environmental impacts of digital agricultural technologies by adopting a full life cycle assessment (LCA) approach. This would involve defining system boundaries covering raw material extraction, manufacturing, distribution, operation, and disposal phases; collecting comprehensive inventory data; modeling environmental impacts using established LCA software tools; and analyzing carbon emission hotspots to identify opportunities for optimization and greener design of digital agriculture systems. Moreover, to ensure accountability and transparency, advanced verification and monitoring technologies such as remote sensing, blockchain-based ledgers, and AI-driven data analytics should be employed to validate carbon emission reductions achieved through digital agriculture.
Data availability statement
The raw data supporting the conclusions of this article will be made available by the authors, without undue reservation.
Author contributions
YW: Writing – original draft, Writing – review and editing, Data curation, Investigation, Project administration, Methodology, Validation. LC: Writing – original draft, Resources, Writing – review and editing, Validation, Visualization, Supervision. LF: Writing – review and editing, Software, Writing – original draft, Formal Analysis, Data curation, Methodology, Conceptualization, Investigation.
Funding
The author(s) declare that financial support was received for the research and/or publication of this article. This work was supported by the National Social Science Foundation of China, grant number 19BJY132.
Conflict of interest
The authors declare that the research was conducted in the absence of any commercial or financial relationships that could be construed as a potential conflict of interest.
Generative AI statement
The author(s) declare that no Generative AI was used in the creation of this manuscript.
Publisher’s note
All claims expressed in this article are solely those of the authors and do not necessarily represent those of their affiliated organizations, or those of the publisher, the editors and the reviewers. Any product that may be evaluated in this article, or claim that may be made by its manufacturer, is not guaranteed or endorsed by the publisher.
References
Alesiuniene, K. S., Simanaviciene, Z., Bickauske, D., Mosiiuk, S., and Belova, I. (2021). Increasing the effectiveness of food supply chain logistics through digital transformation. Indep. J. Manag. Prod. 12 (6), 677–701. doi:10.14807/ijmp.v12i6.1748
ARI (2021). 2020 China Taobao village research report. Available online at: http://www.aliresearch.com.
Babbar, D., Areendran, G., Sahana, M., Sarma, K., Raj, K., and Sivadas, A. (2021). Assessment and prediction of carbon sequestration using Markov chain and InVEST model in Sariska Tiger Reserve, India. J. Clean. Prod. 278, 123333. doi:10.1016/j.jclepro.2020.123333
Bano, S., Liu, L., and Khan, A. (2022). Dynamic influence of aging, industrial innovations, and ICT on tourism development and renewable energy consumption in BRICS economies. Renew. energy 192, 431–442. doi:10.1016/j.renene.2022.04.134
Chang, X., Xing, Y., Wang, J., Yang, H., and Gong, W. (2022). Effects of land use and cover change (LUCC) on terrestrial carbon stocks in China between 2000 and 2018. Resour. Conservation Recycl. 182, 106333. doi:10.1016/j.resconrec.2022.106333
Chen, Y., and Li, M. (2024). How does the digital transformation of agriculture affect carbon emissions? Evidence from China’s provincial panel data. Humanit. Soc. Sci. Commun. 11 (1), 713–717. doi:10.1057/s41599-024-03223-x
Chen, Y., Wang, Y., and Hu, R. (2020). Sustainability by high–speed rail: the reduction mechanisms of transportation infrastructure on haze pollution. Sustainability 12 (7), 2763. doi:10.3390/su12072763
Chen, Y., Zhang, M., Matthews, L., and Guo, H. (2024). Digital transformation and environmental information disclosure in China: the moderating role of top management team's ability. Bus. Strategy Environ. 33, 8456–8470. doi:10.1002/bse.3930
CMA (2015a). The action plan for zero growth in fertilizer use by 2020 and the action plan for zero growth in pesticide use by 2020. Available online at: http://www.moa.gov.cn.
CMA (2015b). Implementation opinions on winning the battle against agricultural non-point source pollution. Available online at: https://www.gov.cn.
CMEE (2018). The action plan for the battle of agricultural and rural pollution control. Available online at: https://www.gov.cn.
CMF (2003). Notice on printing and distributing the opinions on reforming and improving several policies and measures for comprehensive agricultural development. Available online at: https://www.mof.gov.cn.
Dayıoğlu, M. A., and Turker, U. (2021). Digital transformation for sustainable future-agriculture 4.0: a review. J. Agric. Sci. 27 (4), 373–399. doi:10.15832/ankutbd.986431
Deng, H. H., and Zhao, J. L. (2018). Peer effects in economic decision-making of China’s local governments. China Ind. Econ. 4, 59–78.
Dubey, A., and Lal, R. (2009). Carbon footprint and sustainability of agricultural production systems in Punjab, India, and Ohio, USA. J. Crop Improv. 23 (4), 332–350. doi:10.1080/15427520902969906
Gelenbe, E., and Caseau, Y. (2015). The impact of information technology on energy consumption and carbon emissions. ubiquity 2015 (June), 1–15. doi:10.1145/2755977
Guo, Z., and Zhang, X. (2023). Carbon reduction effect of agricultural green production technology: a new evidence from China. Sci. Total Environ. 874, 162483. doi:10.1016/j.scitotenv.2023.162483
Henderson, P., Hu, J., Romoff, J., Brunskill, E., Jurafsky, D., and Pineau, J. (2020). Towards the systematic reporting of the energy and carbon footprints of machine learning. J. Mach. Learn. Res. 21 (248), 1–43.
Hong, J., Shi, F., and Zheng, Y. (2023). Does network infrastructure construction reduce energy intensity? Based on the “Broadband China” strategy. Technol. Forecast. Soc. Change 190, 122437. doi:10.1016/j.techfore.2023.122437
Hu, S., Bao, H., Hao, J., and Zeng, G. (2022). Research on the impact of environmental regulation on urban green development in the Yangtze River Delta: an analysis of intermediary mechanism based on technological innovation. J. Nat. Resour. 37 (06), 1572–1585. doi:10.31497/zrzyxb.20220614
Jiang, S., Zhou, J., and Qiu, S. (2022). Digital agriculture and urbanization: mechanism and empirical research. Technol. Forecast. Soc. Change 180, 121724. doi:10.1016/j.techfore.2022.121724
Jing, S., Wu, F., Shi, E., Wu, X., and Du, M. (2023). Does the digital economy promote the reduction of urban carbon emission intensity? Int. J. Environ. Res. Public Health 20 (4), 3680. doi:10.3390/ijerph20043680
Johnson, J. M. F., Franzluebbers, A. J., Weyers, S. L., and Reicosky, D. C. (2007). Agricultural opportunities to mitigate greenhouse gas emissions. Environ. Pollut. 150 (1), 107–124. doi:10.1016/j.envpol.2007.06.030
Jouanjean, M. A. (2019). Digital opportunities for trade in the agriculture and food sectors. OECD Food, Agric. Fish. Pap. 122.
Kapp, K. W. (2011). The central hypothesis of institutional economics: circular and cumulative causation. Found. Instituional Econ., 170–179.
Klingenberg, C. O., Júnior, J. A. V. A., and Müller-Seitz, G. (2022). Impacts of digitalization on value creation and capture: evidence from the agricultural value chain. Agric. Syst. 201, 103468. doi:10.1016/j.agsy.2022.103468
Krugman, P. (1991). Increasing returns and economic geography. J. political Econ. 99 (3), 483–499. doi:10.1086/261763
Li, Y., Yang, X., Ran, Q., Wu, H., Irfan, M., and Ahmad, M. (2021). Energy structure, digital economy, and carbon emissions: evidence from China. Environ. Sci. Pollut. Res. 28, 64606–64629. doi:10.1007/s11356-021-15304-4
Liu, D., Zhu, X., and Wang, Y. (2021). China's agricultural green total factor productivity based on carbon emission: an analysis of evolution trend and influencing factors. J. Clean. Prod. 278, 123692. doi:10.1016/j.jclepro.2020.123692
Liu, H., Wang, P., and Li, Z. (2021). Is there any difference in the impact of digital transformation on the quantity and efficiency of enterprise technological innovation? Taking China’s agricultural listed companies as an example. Sustainability 13 (23), 12972. doi:10.3390/su132312972
Ma, S., Li, J., and Wei, W. (2022). The carbon emission reduction effect of digital agriculture in China. Environ. Sci. Pollut. Res., 1–18. doi:10.1007/s11356-022-24404-8
Niu, Z., Chen, C., Gao, Y., Wang, Y., Chen, Y., and Zhao, K. (2022). Peer effects, attention allocation and farmers' adoption of cleaner production technology: taking green control techniques as an example. J. Clean. Prod. 339, 130700. doi:10.1016/j.jclepro.2022.130700
Pawson, E. (2020). Into the anthropocene: environmental history and the morality of climate change. Int. Rev. Environ. Hist. 6 (2), 57–73. doi:10.22459/ireh.06.02.2020.04
Porter, M., and Van der Linde, C. (1995). Green and competitive: ending the stalemate. Dyn. eco-efficient Econ. Environ. Regul. Compet. Advant. 33, 120–134.
Rong, J., Hong, J., Guo, Q., Fang, Z., and Chen, S. (2023). Path mechanism and spatial spillover effect of green technology innovation on agricultural CO2 emission intensity: a case study in Jiangsu Province, China. Ecol. Indic. 157, 111147. doi:10.1016/j.ecolind.2023.111147
Shen, Z., Wang, S., Boussemart, J. P., and Hao, Y. (2022). Digital transition and green growth in Chinese agriculture. Technol. Forecast. Soc. Change 181, 121742. doi:10.1016/j.techfore.2022.121742
Smeets, E., Tabeau, A., van Berkum, S., Moorad, J., van Meijl, H., and Woltjer, G. (2014). The impact of the rebound effect of the use of first generation biofuels in the EU on greenhouse gas emissions: a critical review. Renew. Sustain. Energy Rev. 38, 393–403. doi:10.1016/j.rser.2014.05.035
Strubell, E., Ganesh, A., and McCallum, A. (2020). Energy and policy considerations for modern deep learning research. Proc. AAAI Conf. Artif. Intell. 34 (09), 13693–13696. doi:10.1609/aaai.v34i09.7123
Tasman, B. A. (2009). Agriculture and GHG mitigation policy: options in addition to the CPRS. Sydney, Australia: New South Wales: Industry & Investment NSW.
Tian, Y., and Yin, W. (2022). Recalculation of China’s agricultural carbon emissions: basic status, dynamic evolution, and spatial spillover effect. China Agric. Econ. (3), 104–127.
Tian, Y., and Zhang, J. (2013). Research progress on agricultural carbon emissions both domestically and internationally. J. China Agric. Univ. 18 (3), 203–208.
Tobler, W. R. (1970). A computer movie simulating urban growth in the Detroit region. Econ. Geogr. 46 (Suppl. 1), 234–240. doi:10.2307/143141
Vleeshouwers, L. M., and Verhagen, A. (2002). Carbon emission and sequestration by agricultural land use: a model study for Europe. Glob. change Biol. 8 (6), 519–530. doi:10.1046/j.1365-2486.2002.00485.x
Wang, H., Cui, H., and Zhao, Q. (2021). Effect of green technology innovation on green total factor productivity in China: evidence from spatial durbin model analysis. J. Clean. Prod. 288, 125624. doi:10.1016/j.jclepro.2020.125624
Wang, T., Chen, C., and Jia, X. (2022). Can digital transformation improve the quality of corporate information disclosure? 40.
Wang, Z., Zhang, J., He, Y., and Liu, H. (2024). A study on the potential of digital economy in reducing agricultural carbon emissions. Heliyon 10 (11), e31941. doi:10.1016/j.heliyon.2024.e31941
West, T. O., and Marland, G. (2002). A synthesis of carbon sequestration, carbon emissions, and net carbon flux in agriculture: comparing tillage practices in the United States. Agric. Ecosyst. and Environ. 91 (1-3), 217–232. doi:10.1016/s0167-8809(01)00233-x
Yan, G., Chen, W., and Qian, H. (2023). Effects of agricultural technical efficiency on agricultural carbon emission: based on spatial spillover effect and threshold effect analysis. Chin. J. Eco-Agriculture 31 (2), 226–240.
Yang, C. (2022). Cross-border expansion of digital platforms and transformation of the trade and distribution networks of imported fresh fruits from Southeast Asia to China. Glob. Netw. 22 (4), 716–734. doi:10.1111/glob.12352
Yoo, Y., Boland Jr, R. J., Lyytinen, K., and Majchrzak, A. (2012). Organizing for innovation in the digitized world. Organ. Sci. 23 (5), 1398–1408. doi:10.1287/orsc.1120.0771
Zhao, L., Rao, X., and Lin, Q. (2023). Study of the impact of digitization on the carbon emission intensity of agricultural production in China. Sci. Total Environ. 903, 166544. doi:10.1016/j.scitotenv.2023.166544
Zheng, Y., and Zhang, Q. (2023). Digital transformation, corporate social responsibility and green technology innovation-based on empirical evidence of listed companies in China. J. Clean. Prod. 424, 138805.
Keywords: agricultural digitalization, carbon emissions, agriculture sector, spatial spillover effects, green technological innovation, environmental regulatory
Citation: Wenyan Y, Chenghan L and Fangzhou L (2025) Digital agriculture drives carbon emission reduction in China. Front. Environ. Sci. 13:1600884. doi: 10.3389/fenvs.2025.1600884
Received: 27 March 2025; Accepted: 08 May 2025;
Published: 19 May 2025.
Edited by:
Saige Wang, University of Science and Technology Beijing, ChinaReviewed by:
Ismail Suardi Wekke, Institut Agama Islam Negeri Sorong, IndonesiaYali Zhu, Chinese Academy of Sciences (CAS), China
Copyright © 2025 Wenyan, Chenghan and Fangzhou. This is an open-access article distributed under the terms of the Creative Commons Attribution License (CC BY). The use, distribution or reproduction in other forums is permitted, provided the original author(s) and the copyright owner(s) are credited and that the original publication in this journal is cited, in accordance with accepted academic practice. No use, distribution or reproduction is permitted which does not comply with these terms.
*Correspondence: Lin Fangzhou, NDkzMTIxODQ0QHFxLmNvbQ==