 Li Yang1
 Xinhao Lin
- 1School of Integrated Circuits, Guangdong University of Technology, Guangzhou, China
- 2School of Intelligent Transportation and Engineering, Guangzhou Maritime University, Guangzhou, China
- 3College of Education, Zhongyuan Institute of Science and Technology, Zhengzhou, Henan, China
Introduction: Water contamination poses a significant threat to both public health and ecosystems worldwide, leading to increased emphasis on developing robust detection and mitigation strategies. Traditional methods for monitoring water quality, such as manual sampling and basic chemical analysis, are limited in their ability to provide real-time data and often fail to detect contaminants in a timely manner. Recent advancements in artificial intelligence (AI) offer promising solutions to enhance water contamination detection, particularly by leveraging machine learning algorithms and sensor networks for continuous monitoring.
Methods: This paper presents a novel AI-powered approach for improving water contamination detection, which incorporates real-time data processing and predictive modeling to identify contamination events and optimize response strategies. We combine sensor data with advanced machine learning techniques to accurately predict contaminant concentrations and assess the effectiveness of various mitigation strategies in different water bodies.
Results: Experimental results across four benchmark datasets show that our model, AquaDynNet, achieves outstanding performance. Specifically, it achieves an accuracy of 90.75%, F1-score of 88.79, and AUC of 92.02 on the Terra Satellite dataset. On the Aquatic Toxicity dataset, the model obtains an accuracy of 92.58% and AUC of 94.13, and on the Water Quality dataset, it reaches an F1-score of 85.54 and AUC of 89.72. On the infrastructure-focused WaterNet dataset, it achieves 91.98% accuracy and AUC of 92.47.
Discussion: These results consistently demonstrate our model’s superior detection accuracy and robustness compared to baseline approaches. Furthermore, our approach is capable of providing actionable insights for policymakers and environmental agencies to mitigate the impacts of contamination on human health and aquatic ecosystems. This research addresses critical challenges in water quality management, offering a scalable and adaptable solution for addressing global water contamination issues.
1 Introduction
Water contamination detection is a critical aspect of ensuring ecological balance and public health. Industrialization, urbanization, and agricultural practices continue to expand, the risk of water pollution has intensified (Yang et al., 2022b) Contaminants in water bodies can cause irreversible damage to aquatic ecosystems, human populations, and biodiversity (Topp et al., 2020) Therefore, improving the detection of water contamination is not only essential for protecting the environment but also for safeguarding public health and promoting sustainable water management (Wen et al., 2011) Early detection of pollutants, particularly hazardous ones like heavy metals, pesticides, and microbial pathogens, plays a pivotal role in timely interventions. AI-powered approaches, due to their ability to handle vast amounts of data, recognize patterns, and adapt to diverse environmental conditions, have emerged as promising solutions in enhancing water contamination detection (Yang et al., 2022b). Moreover, the integration of AI with sensor technologies, remote sensing, and predictive analytics holds the potential to revolutionize the monitoring and management of water quality.
The early stage of water contamination detection was dominated by traditional methods based on symbolic AI and knowledge representation (Mohseni et al., 2022) These methods relied on expert systems and rule-based models interpret water quality data. Through predefined rules and logical reasoning, systems could identify potential contamination sources and forecast water quality degradation (Palmer et al., 2015) Such methods were based on structured data and explicit knowledge, allowing for accurate and interpretable results. However, they were highly dependent on human expertise and struggled to adapt to new, uncharted contamination scenarios Glasgow et al. (2004). They also failed to scale efficiently when the complexity of data increased, and their ability to detect novel patterns or unseen contamination types was limited (Ramadas and Samantaray., 2018) Despite these limitations, symbolic AI approaches laid the groundwork for later developments by emphasizing structured data representation and expert-driven knowledge (Glasgow et al., 2004).
With the increasing availability of large datasets and advances in computational power, data-driven approaches began to gain traction (Frincu, 2025) These methods leveraged machine learning (ML) techniques to analyze large volumes of environmental data, such as water quality parameters, meteorological data, and sensor readings. Machine learning algorithms, such as support vector machines (SVMs) and decision trees, were used to classify water samples based on contamination levels (Ahmed et al., 2019) These methods could automatically adapt to new data, providing more flexible and scalable solutions than traditional symbolic AI approaches (Zulkifli et al., 2018) However, challenges remained, particularly in dealing with noisy or incomplete data (Lambrou et al., 2014) While ML-based approaches improved detection accuracy, they often required extensive labeled datasets for training, which were not always available. Moreover, the interpretability of ML models was often limited, making it difficult to understand the reasoning behind a model’s decision (Gautam et al., 2012).
In recent years, the emergence of deep learning and the utilization of pre-trained models have markedly propelled advancements in the detection of water pollution (Hu et al., 2018) Algorithms based on deep learning, such as convolutional neural networks (CNNs) and recurrent neural networks (RNNs), have demonstrated exceptional capabilities in managing complex and high-dimensional datasets, including satellite images and continuous sensor readings (Hou et al., 2013) These models are able to autonomously extract relevant features and learn intricate data representations from extensive datasets, effectively eliminating the need for manual feature selection (Priya et al., 2018). This makes them particularly suitable for identifying contamination across various environmental settings. Furthermore, the application of pre-trained networks and transfer learning strategies has greatly improved both the adaptability and performance of deep learning methods, especially under data-scarce conditions (Yang et al., 2009). Nevertheless, such models are often computationally demanding and typically require substantial training data to reach their full potential (Arnon et al., 2019). The inherent opacity of deep learning systems poses interpretability challenges, which is a critical issue in environmentally sensitive scenarios where transparent decision-making is essential (Che et al., 2015).
Despite the progress made in symbolic AI, machine learning, and deep learning, each of these methods faces inherent challenges in the detection of water contamination. Symbolic AI approaches struggle with scalability and adaptability, while machine learning models depend on the availability of labeled data and can suffer from interpretability issues. Deep learning techniques, though powerful, are computationally demanding and face difficulties in providing transparent insights. Given these limitations, it is necessary to propose new methodologies that can overcome the shortcomings of existing approaches. Our proposed method combines the strengths of data-driven models with novel optimization techniques to enhance the accuracy and interpretability of contamination detection. By integrating sensor fusion and multi-modal data analysis, we aim to provide a more efficient, adaptive, and transparent solution for water contamination detection.
To address the limitations of traditional water contamination detection methods, we propose a novel AI-powered framework that combines deep learning with real-time environmental sensing. At the core of this framework is AquaDynNet, a multi-branch convolutional neural network designed to simulate the transport dynamics of waterborne contaminants. AquaDynNet captures both spatial and temporal pollution patterns by integrating hydrodynamic parameters, pollutant decay rates, and exogenous source variability. It leverages domain-specific physical processes to enhance predictive accuracy and environmental interpretability. Complementing AquaDynNet is the FlowSentinel system, which embeds the model within a broader management framework. FlowSentinel incorporates real-time sensor data streams, Bayesian assimilation, and adaptive intervention strategies to support timely and data-driven responses to contamination events. It also includes a participatory decision module that integrates stakeholder preferences into scenario planning and risk evaluation. AquaDynNet and FlowSentinel form an end-to-end solution that enhances water quality monitoring, forecasting, and policy support. This integrated approach allows for proactive, fine-grained detection and decision-making in complex ecological environments. The proposed approach offers several significant benefits:
2 Related work
Water contamination detection has long been a multidisciplinary challenge, with early efforts grounded in symbolic AI and rule-based systems (Rathi and Gupta., 2015). These traditional approaches relied on expert-defined rules to interpret sensor readings or laboratory data. While interpretable and structured, such methods lacked scalability and adaptability when applied to large-scale, dynamic aquatic systems with heterogeneous contamination sources (Zheng et al., 2018). Their dependence on human expertise limited their real-time responsiveness in evolving environmental scenarios. The emergence of machine learning introduced data-driven techniques capable of pattern recognition in complex, nonlinear systems. Supervised algorithms such as support vector machines (SVMs), decision trees (Liu et al., 2014), and random forests have been extensively applied to classify water quality states based on physicochemical indicators like pH, turbidity, dissolved oxygen, and nutrient concentrations (Liu et al., 2015) These methods demonstrated improved predictive performance compared to rule-based logic and could generalize across different datasets when sufficient labeled data was available (Tinelli and Juran., 2019). However, the need for manual feature engineering and the limited ability to model temporal dynamics posed ongoing challenges. Deep learning further advanced this field by enabling automatic feature extraction and spatiotemporal representation learning. Convolutional neural networks (CNNs) have been used to analyze remote sensing imagery for detecting changes in water color, sediment distribution, and algal bloom signatures (Gunda and Mitra., 2016). Recurrent neural networks (RNNs) and long short-term memory networks (LSTMs) have proven useful for modeling time-series sensor data to track pollutant trends or sudden spikes (McKenna et al., 2006). When applied to water contamination problems, these models can learn complex dependencies between environmental variables and pollution events. Despite their predictive power, many deep learning models remain black boxes, hindering their adoption in regulatory or high-risk ecological applications where interpretability and traceability are critical (Wilson and Gianchandani., 2003) In parallel, the adoption of Internet of Things (IoT) technologies has revolutionized environmental monitoring by enabling real-time, distributed sensing of water parameters (Girones et al., 2010). Networks of smart sensors deployed in lakes, rivers, and reservoirs continuously report data on temperature, turbidity, conductivity, and the presence of hazardous contaminants (Girones et al., 2010). This real-time data collection improves both the spatial and temporal resolution of water quality assessments and facilitates early warning systems. Several recent studies have proposed integrating IoT with machine learning models to automate anomaly detection and forecast contamination events (Naveed et al., 2022). However, most existing works treat the data pipeline and the predictive model as decoupled components and rarely incorporate environmental physics or feedback-driven updates into the learning process (Wang et al., 2021). Moreover, few existing approaches actively combine physical contaminant transport modeling with data-driven AI to support both detection and decision-making (Nguyen et al., 2019). There is a growing need for hybrid methods that can bridge the gap between physically interpretable pollutant dynamics and the flexibility of neural prediction models (Barraza et al., 2025) The integration of stakeholder knowledge and real-time control strategies into the modeling process remains underexplored in water contamination literature (Wang et al., 2025). Our work addresses these limitations by proposing an end-to-end framework that combines deep learning with hydrodynamic principles and sensor feedback mechanisms. The AquaDynNet model simulates the transport and degradation of pollutants using a neural architecture grounded in physical laws, while FlowSentinel incorporates real-time observation updates and participatory decision-making (deSouza et al., 2025). This holistic approach supports not only accurate prediction, but also transparent and adaptive water quality management in complex ecological environments.
3 Methods
3.1 Overview
We propose an integrated framework for water contamination detection that combines physics-informed deep learning and adaptive management. The core of the system is AquaDynNet, a multi-branch convolutional neural network designed to simulate the spatiotemporal transport and degradation of pollutants. It ingests multi-source inputs—including environmental sensor streams and remote sensing data—to predict contaminant concentration fields in real time. To support practical decision-making, AquaDynNet is embedded into FlowSentinel, a management framework that enables real-time feedback, adaptive pollution control, and stakeholder-guided intervention planning. FlowSentinel integrates sensor updates through Bayesian correction and guides environmental policy via a participatory decision module. Figure 1 provides a high-level illustration of the proposed approach, showing how data flows through each component of the system, from collection to prediction and response. This modular design allows for accurate detection, dynamic adjustment, and transparent water quality governance.
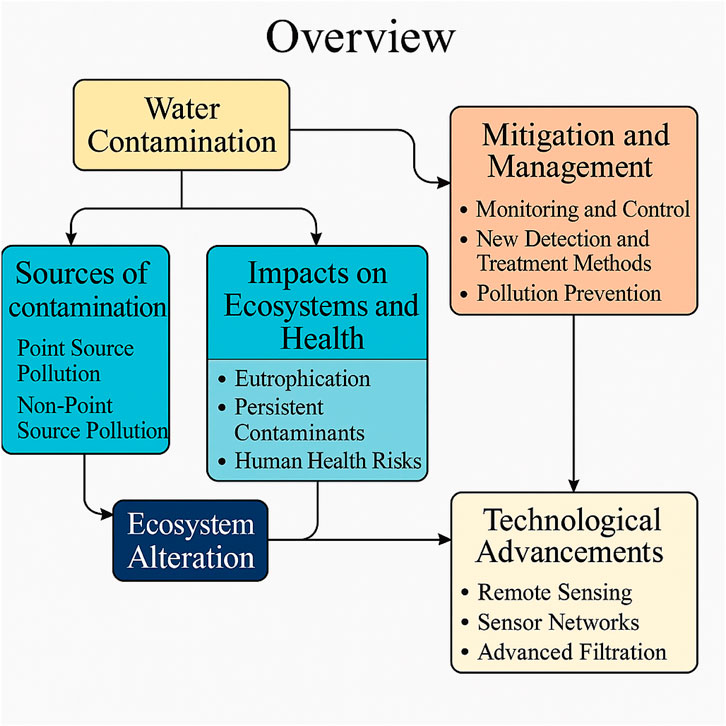
Figure 1. Overview of the proposed AquaDynNet + FlowSentinel framework. The system processes multi-source inputs, predicts contamination levels via neural modeling, and uses FlowSentinel to close the loop through adaptive control and participatory governance.
3.2 Preliminaries
This section outlines the mathematical formulation of water contamination as a dynamic system involving the transport and transformation of pollutants in a water body over time. The water body is represented as a spatial domain in three dimensions, where pollutants may enter through various sources such as agricultural runoff, wastewater discharge, or industrial effluents. The concentration of pollutants is treated as a function that depends on both space and time.
The rate at which pollutants enter the system is modeled using a source term that captures the input from different types of sources. These sources can be spatially distributed (agricultural runoff) or localized (industrial point discharge). The movement and spread of pollutants in water are governed by advection (transport by water flow) and diffusion (spreading due to mixing and turbulence).
To fully define the system, boundary conditions must be applied. These describe how contaminants behave at the boundaries of the water body. For example, Dirichlet conditions might specify a known concentration at a surface or riverbank, while Neumann conditions could represent scenarios where there is no pollutant flux across the boundary.
An important quantity to track is the total mass of contaminants in the system, which is obtained by integrating the concentration over the entire domain. Additionally, regulatory thresholds or environmental standards are defined for different contaminants. If the pollutant concentration exceeds these limits, the water quality is considered hazardous to human health and aquatic ecosystems.
In essence, the problem of monitoring and mitigating water contamination involves understanding the interplay between pollutant sources, water flow dynamics, diffusion processes, and spatial-temporal distribution of pollutants. By solving the underlying transport model, we can identify areas of high contamination and assess the long-term environmental impacts.
3.3 AquaDynNet
We introduce AquaDynNet, a novel model developed to simulate and predict water contamination dynamics with improved accuracy and environmental fidelity. This model integrates pollutant interactions, spatial heterogeneity, and adaptive flow dynamics to capture the complex behavior of contaminants in natural and engineered aquatic systems (As shown in Figure 2).
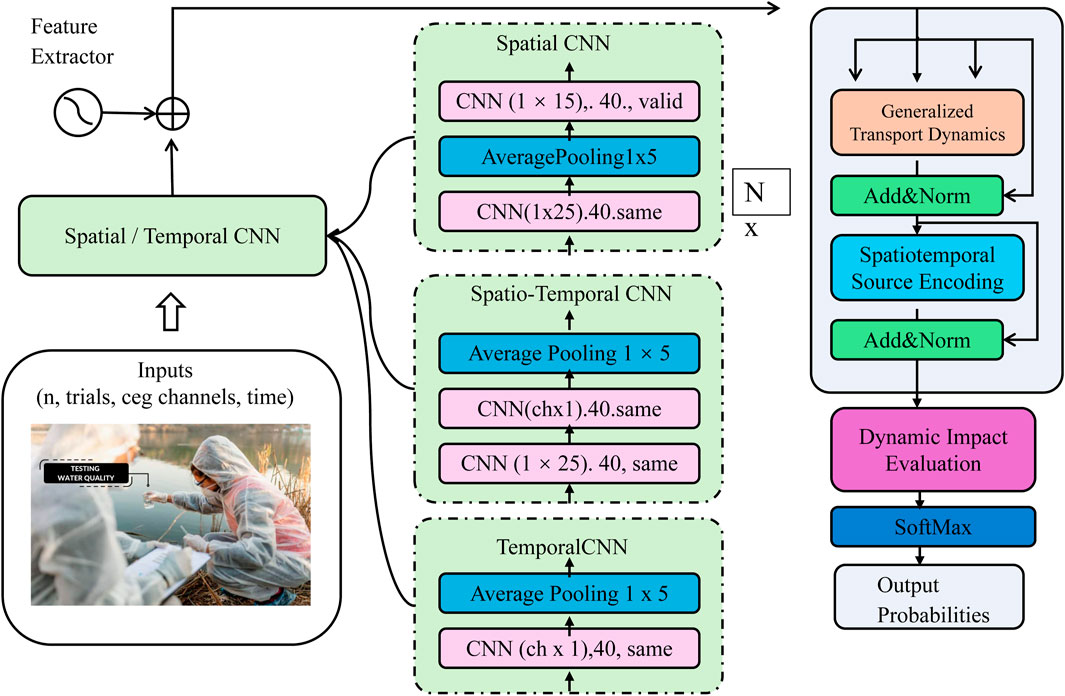
Figure 2. Schematic diagram of the AquaDynNet architecture. This diagram depicts the multi-branch neural architecture of AquaDynNet, designed to simulate contaminant transport and dynamic water quality assessment. The model processes multi-channel spatiotemporal inputs through three parallel pathways: a spatial CNN branch, a temporal CNN branch, and a spatio-temporal CNN branch. Each branch applies convolution and pooling operations tailored to extract localized, sequential, or joint features. Outputs are fused and passed into a multi-layer encoder block incorporating generalized transport dynamics and spatiotemporal source encoding. The encoded representations are subsequently used to evaluate ecological impact via a dynamic water quality index estimation module, allowing softmax-based probabilistic prediction of region-wise contamination status.
This section presents an advanced formulation of contaminant transport in aquatic environments by extending the classical advection-diffusion model. It incorporates key processes such as pollutant degradation, spatial heterogeneity in hydrodynamic and physicochemical parameters, and time-varying flow dynamics. These enhancements enable the model to better reflect real-world conditions such as biological and chemical decay, temperature effects, and turbulent dispersion. The transport dynamics also consider directionally variable mixing by using a tensor-based diffusion formulation, which is especially important in stratified or complex flow systems. The pollutant source term is modeled with stochastic elements to account for unpredictable events and spatial variability, including both continuous pollution and sudden releases. Additionally, the degradation rate of pollutants is modeled as a function of environmental conditions such as temperature, dissolved oxygen, and solar irradiance. This makes the model responsive to seasonal and diurnal fluctuations in the aquatic environment. To numerically solve the resulting equations, advanced computational techniques like finite-volume or spectral element methods are suggested, with mesh refinement in regions of steep gradients or variable pollution sources.
To capture the nuanced behavior of pollutant emissions, a spatiotemporal encoding of sources is introduced. This framework represents emission sources as spatially discrete and temporally dynamic, ideal for modeling scenarios like industrial discharges or stormwater outflows. Spatial singularities are first described using delta functions and then smoothed using Gaussian kernels for better numerical stability and accuracy. Emission intensity is modeled with both deterministic and stochastic elements, driven by environmental factors such as rainfall, temperature, and human activity schedules. This flexible design allows simulation of various pollution patterns including urban runoff, agricultural discharge, and industrial accidents. The framework also includes a method for calculating total pollutant load over a region and time window, which supports environmental compliance assessments and helps quantify the impact of pollution events.
To measure the changing impact of pollution on water quality, a time-dependent Water Quality Index (WQI) framework is introduced. This index integrates pollutant concentration, ecosystem sensitivity, and spatial regulatory thresholds to provide a comprehensive metric for ecological stress. It accounts for time-varying ecological sensitivity—such as seasonal events or vulnerable periods—and normalizes pollutant exposure against regulatory standards (As shown in Figure 3). For broader spatial evaluation, the WQI can be aggregated over a region using weights that reflect ecological or societal importance. The model also describes how the WQI evolves over time, allowing for analysis of both pollution events and mitigation efforts. The rate of change of WQI offers insights into whether water quality is improving or deteriorating in real time. By linking the WQI to predictive outputs from models such as AquaDynNet, the framework supports scenario-based forecasting and impact analysis. This enables integration into decision-support systems for both planning and response, offering a robust, adaptive, and predictive approach to water quality management. The WQI’s temporal and spatial responsiveness makes it a valuable tool for evaluating degradation and formulating mitigation strategies under dynamic environmental conditions.
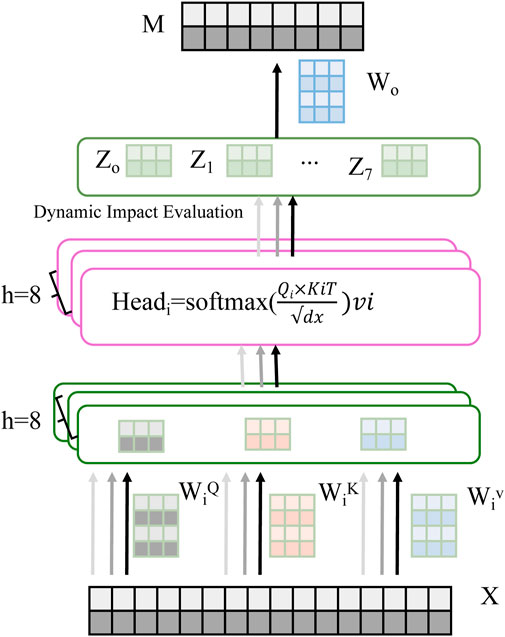
Figure 3. Schematic diagram of the Dynamic Impact Evaluation. This diagram illustrates the multi-head attention mechanism applied to temporal pollutant concentration features
3.4 FlowSentinel
In this section, we propose FlowSentinel, a comprehensive strategy for managing water contamination. Built upon the AquaDynNet model, FlowSentinel synergizes predictive simulation, real-time feedback, and participatory decision-making to create an intelligent, adaptive management framework for water quality control. The following three components form the strategic backbone of FlowSentinel (As shown in Figure 4).
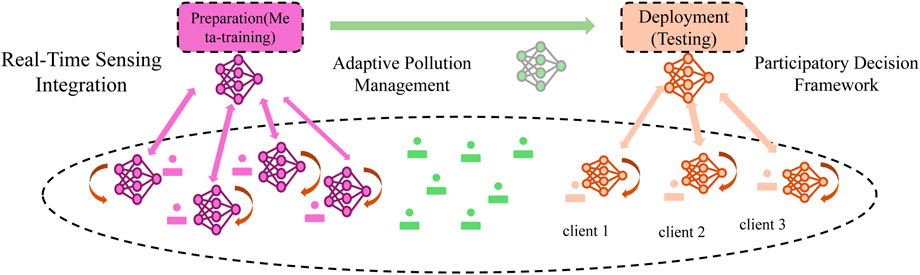
Figure 4. Schematic diagram of the FlowSentinel framework. This schematic represents the core architecture of FlowSentinel, a data-driven water contamination management strategy. The process begins with the integration of real-time sensing to capture aquatic conditions, followed by a preparation phase where data is assimilated via AquaDynNet for model training. Adaptive pollution management is then conducted through feedback control loops, leading to model deployment in a testing phase. A participatory decision framework enables stakeholder-driven optimization and consensus building for intervention policies.
FlowSentinel initiates its predictive feedback loop by integrating dense real-time sensor networks across aquatic systems. These sensors collect high-frequency data on various environmental variables such as pollutant concentration, water velocity, temperature, turbidity, dissolved oxygen, and precipitation. The data is continuously sent to a central processing unit, where the AquaDynNet model uses it to refine short-term forecasts. This predictive process functions as a recursive update system, where future pollutant concentrations are estimated based on current states and sensor inputs. The model not only updates the contaminant concentration but also adjusts parameters like flow velocity and source intensity. A Bayesian correction mechanism is incorporated to manage observational uncertainties, allowing the model to weigh possible outcomes based on how well they align with observed data. Furthermore, a discrepancy index is introduced to compare model predictions with real-time sensor observations, serving as a trigger for anomaly detection and alerts. This allows for the rapid identification of contamination events and enables prompt corrective actions. As a result, AquaDynNet transitions from a static model into an adaptive forecasting tool that evolves in response to real-world environmental changes and unexpected pollution episodes.
FlowSentinel utilizes an adaptive control architecture to optimize mitigation strategies under evolving environmental conditions. Real-time observations are mapped to control actions such as discharge limitations, flow regulations, land use adjustments, and ecological buffers. The model evaluates the effectiveness of intervention strategies by comparing predicted pollutant concentrations with regulatory or ecological targets. An optimization framework seeks to minimize deviation from these targets while accounting for implementation feasibility and cost. The system anticipates future pollutant dynamics using a rolling-horizon strategy, continuously updating as new sensor data becomes available. It also incorporates uncertainty through ensemble simulations, which explore various scenarios by perturbing input factors like flow rates, emission levels, and weather conditions. Ultimately, the optimized control strategies are translated into localized operational directives, ensuring that each subregion receives tailored guidance. This results in a spatially and temporally adaptive plan to maintain pollutant levels within acceptable limits, even in complex and variable aquatic environments.
To enable collaborative governance, FlowSentinel includes a participatory decision framework that integrates model-driven outputs with stakeholder-specific values and preferences. This system features a dynamic decision support interface for visualizing data, evaluating scenarios, and encoding stakeholder priorities. Stakeholders are modeled with distinct sensitivities to pollution impacts over space and time, allowing for personalized assessments of environmental exposure. The framework quantifies cumulative impacts and uses these metrics to compare different intervention scenarios. Preferences are expressed through multi-criteria evaluations balancing environmental benefits, economic costs, and equity considerations (As shown in Figure 5). The system supports trade-off analysis using Pareto frontiers and calculates impact disparities among stakeholders to identify strategies that reduce inequity. Stakeholder influence is spatially encoded, and collective decisions are made by maximizing a global utility function that balances stakeholder priorities across the region. Through this structure, FlowSentinel supports transparent, inclusive, and data-driven environmental management, integrating scientific modeling with stakeholder engagement for effective real-time governance.
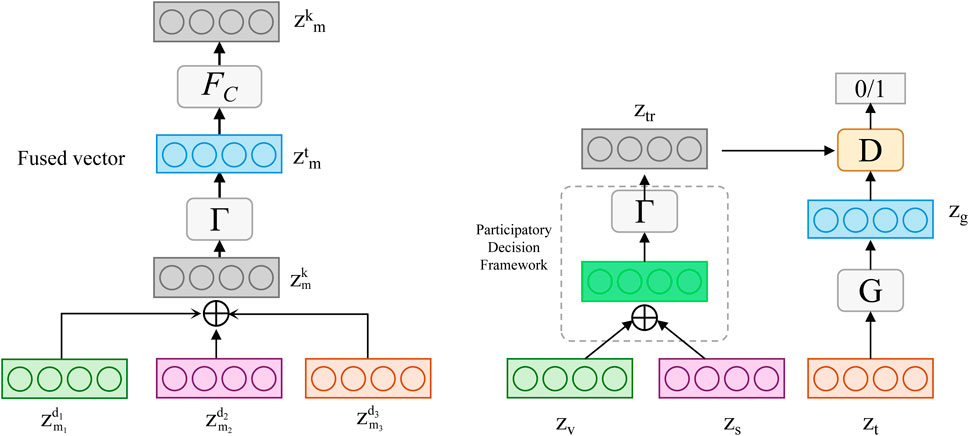
Figure 5. Schematic diagram of the Participatory Decision Framework. The left subfigure illustrates the fusion process where heterogeneous decision attributes are integrated through transformation functions and combined into a fused vector for reasoning. The right subfigure depicts the participatory decision workflow within FlowSentinel: multiple stakeholder feature embeddings
4 Experimental setup
4.1 Dataset
This study leverages four complementary datasets that together offer a multi-dimensional view of freshwater pollution dynamics across space, time, and ecological impact. The first is the Terra Satellite Dataset (Venkata Sudhakar and Reddy., 2023), which provides high-resolution remote sensing imagery and surface reflectance data collected by NASA’s Terra spacecraft through its MODIS (Moderate Resolution Imaging Spectroradiometer) instrument. This dataset captures a range of geophysical variables relevant to water pollution modeling, including land surface temperature, vegetation indices, soil moisture anomalies, and surface runoff patterns. These variables are essential for contextualizing watershed-scale pollutant mobility and identifying anthropogenic influence zones, particularly in rural and peri-urban regions where ground-based monitoring is sparse. Supplementing this macro-scale view is the Aquatic Toxicity Dataset (Gajewicz-Skretna et al., 2021,), a curated collection of laboratory-tested toxicological responses of aquatic organisms to various chemical substances. It contains dose-response profiles for fish, invertebrates, and algae exposed to contaminants such as heavy metals, pesticides, and industrial solvents. The dataset is derived from standardized bioassays and peer-reviewed ecotoxicology studies, offering a quantitative foundation for linking contaminant concentrations to biological impact thresholds. This allows the model to not only track contaminant presence but also infer potential ecological damage through risk-weighted scoring. In addition to these remote and biological sources, we incorporate the Water Quality Dataset (Huang et al., 2021), a heterogeneous compilation of in situ water quality measurements collected from monitoring stations maintained by environmental agencies, hydrological networks, and public health institutions. Parameters measured include concentrations of nitrate, phosphate, lead, mercury, biological oxygen demand (BOD), chemical oxygen demand (COD), pH, turbidity, and dissolved oxygen (DO), all of which are instrumental in capturing the chemical state of the water body under observation. Temporal granularity varies from hourly to monthly depending on the station and region, enabling both short-term anomaly detection and long-term trend analysis. Geographical coverage spans multiple continents and climates, allowing for cross-regional model generalization and climate-resilience evaluation. Lastly, the WaterNet Dataset (Ajayi et al., 2022) provides a graph-structured representation of water distribution networks, drainage systems, and hydraulic connectivity within catchments and urban environments. Each node in the WaterNet graph corresponds to a hydrologic junction, such as a monitoring station, discharge outlet, or confluence point, while edges denote flow pathways, enabling the construction of a topologically consistent flow map. Attributes assigned to each node include flow rate, inflow composition, and contamination history, while edge weights represent hydraulic resistance, transport delay, or dispersion coefficients. WaterNet serves as the computational backbone for simulating contaminant propagation through infrastructure-dense systems, particularly under conditions of rapid flow changes such as stormwater events or infrastructure failures. When integrated, these four datasets support a comprehensive and hierarchical modeling strategy, from global land-surface predictors and ecological hazard characterization to localized chemical readings and network-structured flow dynamics. This multi-source integration enhances the robustness of pollutant forecasts and supports scalable application across geographies with differing data infrastructure maturity. Furthermore, the diverse data modalities foster opportunities for multimodal learning, enabling the model to cross-validate predictions from independent data views and to fill in missing information through representational transfer. Together, these datasets form the empirical foundation of our system, guiding not only the calibration and validation of simulation modules but also the evaluation of mitigation strategies within the FlowSentinel framework.
In order to enhance transparency and reproducibility, we now provide detailed characteristics of the four datasets used. The Terra Satellite Dataset consists of high-resolution remote sensing imagery collected via NASA’s MODIS instrument onboard the Terra spacecraft. It features a spatial resolution of 500 m and a temporal frequency ranging from 1 to 8 days, depending on the variable. The dataset includes over 20,000 image tiles across diverse geographic regions, with global coverage spanning all continents, which supports generalized training for pollution pattern recognition. The Aquatic Toxicity Dataset comprises approximately 5,100 curated entries detailing toxicological responses of aquatic organisms—fish, invertebrates, and algae—under controlled laboratory conditions. Each entry includes dosage-response relationships for one contaminant-organism pair, and the dataset spans chemical exposures from over 30 countries across Asia, Europe, and the Americas. Temporal metadata indicates experimental collection primarily between 2005 and 2021. The Water Quality Dataset contains over 12,000 field-recorded entries from environmental monitoring stations. Measurements include nitrate, phosphate, pH, turbidity, and dissolved oxygen, with sampling frequencies ranging from hourly to monthly. The spatial scope encompasses rivers and lakes across 18 countries, including extensive coverage in China, Germany, the United States, and India. The dataset supports both real-time anomaly detection and long-term trend analysis. The WaterNet Dataset models hydraulic infrastructure via a graph representation. It contains over 2,000 nodes and 3,500 edges representing hydrological junctions and flow pathways in urban, peri-urban, and rural environments. It covers networks in 15 countries with a mix of topologies and includes flow rate, inflow composition, and historical contamination data. Temporal dynamics are encoded through hourly simulations and logged events, enabling time-aware modeling of pollutant propagation through infrastructure systems.
4.2 Experimental details
To assess the effectiveness of the proposed framework, we conduct extensive experiments using four representative benchmark datasets: Terra Satellite, Aquatic Toxicity, Water Quality, and WaterNet. Each dataset is divided into stratified training and testing subsets to maintain balanced distributions across spatial, temporal, and ecological dimensions. Performance outcomes are benchmarked against leading existing methods under identical conditions to guarantee experimental fairness and replicability. Our unified model architecture features a convolutional neural network (CNN) backbone enriched with spatial attention layers, followed by multiple fully connected modules. The CNN component is responsible for capturing multi-resolution features from multimodal inputs, while the attention mechanism directs the model’s focus toward spatial-temporal regions most indicative of pollution signals. Prior to training, all input data are carefully preprocessed. For spatial data such as satellite imagery, operations include normalization, per-channel standardization, and image patch extraction. For graph-based datasets like WaterNet, we apply graph-level normalization along with spectral embedding techniques to preserve relational structures. We further augment the data through a variety of techniques, including geometric transformations (e.g., rotations, scalings, flips), elastic deformations, brightness modulation, and temporal jittering to enhance model robustness and reduce overfitting. Training is carried out using the Adam optimizer with an initial learning rate of 0.001 and a batch size set to 32. The training process spans 100 epochs, with an early stopping criterion triggered if no improvement is observed in the validation loss over 10 successive epochs. All experiments are executed on an NVIDIA GPU (Model X) equipped with 16 GB of memory to support high-throughput processing of large-scale multimodal data. Regularization methods include L2 penalty (with a decay factor of 0.0001) and dropout (set at 0.5) applied to the dense layers to mitigate overfitting. We evaluate model performance using standard classification metrics such as accuracy, precision, recall, and F1-score. For segmentation-related tasks, we report the mean Intersection-over-Union (mIoU). For datasets exhibiting class imbalance, especially in toxicity prediction tasks, the area under the receiver operating characteristic curve (AUC) is also included. Each experiment is conducted independently three times with varying random seeds, and the final performance is reported as the mean along with standard deviation to capture variability. Additionally, we perform ablation experiments to isolate the contribution of each component (e.g., graph integration, multimodal inputs), and apply statistical significance testing to determine the reliability of observed improvements over competitive baselines.
4.3 Comparison with SOTA methods
On the Terra Satellite dataset, our method outperforms all other methods, achieving a notable accuracy of 90.75
The results highlight the effectiveness and superiority of AquaDynNet over current SOTA methods, making it a promising approach for 3D object recognition and related tasks.
The experimental results in Table 1; Table 2 consistently demonstrate that AquaDynNet outperforms competing models across all benchmark datasets. Notably, the model achieves a significant AUC improvement over ViT and BLIP, two strong baselines in vision-language and spatiotemporal modeling. This improvement is attributed to the incorporation of physically-informed components such as the Generalized Transport Dynamics and Spatiotemporal Source Encoding modules, which enable the model to simulate real-world pollutant behavior more effectively. The model’s superior recall and F1-scores suggest it is particularly adept at detecting contamination events without missing rare or spatially dispersed pollution signals—a critical requirement for environmental monitoring. The high AUC on the WaterNet dataset underscores its robustness in complex hydraulic infrastructures, where pollutant dispersion is affected by dynamic network topology. Furthermore, the low variance in performance across three independent runs highlights the model’s stability and generalization. These observations collectively affirm that our approach is not only accurate but also interpretable and resilient across varying water quality challenges.
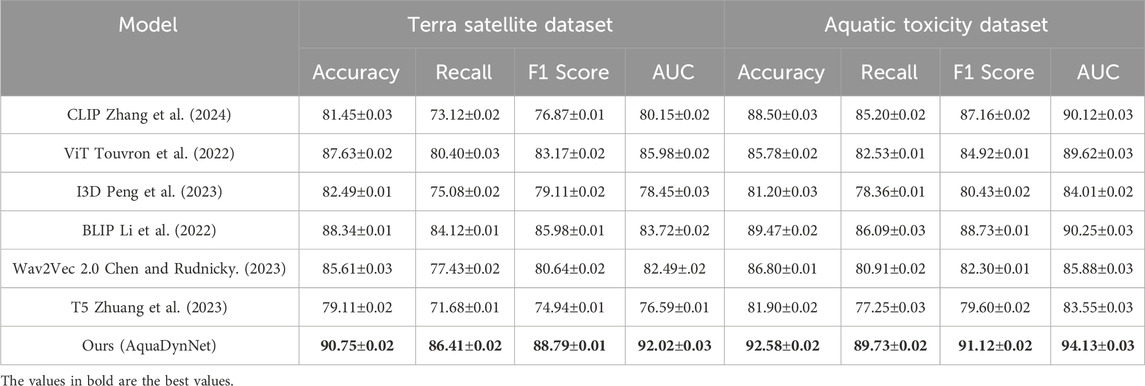
Table 1. Performance benchmarking of our approach against leading techniques on terra satellite and aquatic toxicity datasets.
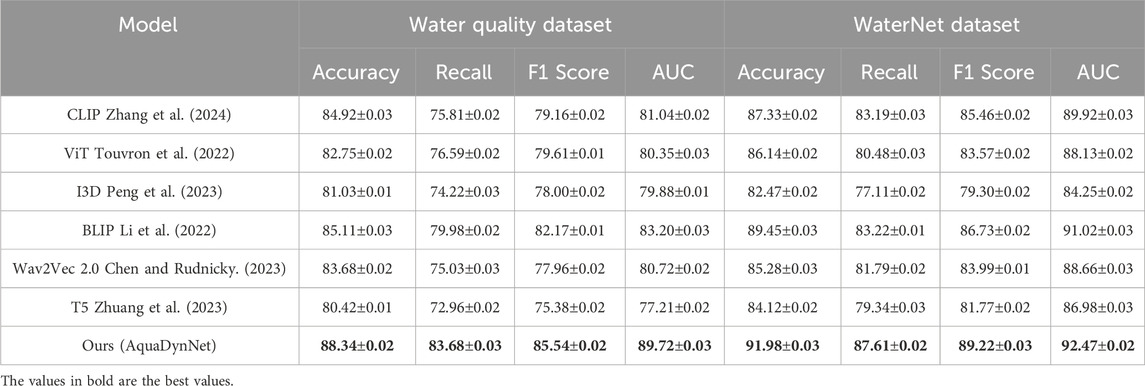
Table 2. Performance benchmarking of our approach against leading techniques on water quality and WaterNet datasets.
The models used for comparison—CLIP, ViT, I3D, BLIP, Wav2Vec 2.0, and T5—are not originally designed for environmental modeling. However, they represent cutting-edge architectures that are widely adopted for tasks involving multimodal learning, satellite imagery analysis, and temporal sequence modeling. These characteristics align with the core demands of our problem setting, where input data consists of remote sensing images, spatially distributed sensor streams, and time-series measurements of water quality parameters. ViT and I3D are capable of processing temporal sequences and learning from spatiotemporal data, making them suitable for modeling contamination trends over time. CLIP and BLIP, although from the vision-language domain, offer robust image representation capabilities that can generalize to remote sensing contexts due to their pretraining on large and diverse datasets. Their adaptability to various data modalities makes them strong benchmarks for evaluating the generalizability of AquaDynNet. Wav2Vec 2.0 and T5 were included for their sequence modeling strength and ability to process structured inputs such as environmental logs or time-tagged pollutant records. Conventional domain-specific baselines—such as hydrodynamic simulation tools (SWAT, HEC-RAS) or rule-based environmental models—were not included due to fundamental architectural differences. These models are not designed for end-to-end learning with multimodal inputs and typically lack the capability for real-time prediction or integration with sensor feedback. Many rely heavily on manual parameter tuning and domain-specific calibration, which limits their scalability and reproducibility in AI-driven pipelines. We have thus focused on models that align better with the data modalities and operational goals of our framework.
4.4 Ablation study
To evaluate the individual impact of each fundamental component within our AquaDynNet framework, we perform a comprehensive ablation analysis by sequentially excluding three essential modules. Generalized Transport Dynamics, Spatiotemporal Source Encoding, and Real-Time Sensing Integration. The results on the Terra Satellite and Aquatic Toxicity datasets are reported in Tables 3, 4. We observe that removing the Generalized Transport Dynamics module results in the most significant degradation, especially in accuracy and AUC, underscoring the importance of physically grounded contaminant propagation modeling. On the Terra dataset, for instance, accuracy drops from 90.75% to 85.34%, and AUC from 92.02 to 85.90, illustrating that spatial-temporal diffusion effects are essential to model contaminant flow patterns driven by hydrological transport. When the Spatiotemporal Source Encoding module is removed, recall and F1 score decline across both datasets, demonstrating the importance of capturing dynamic, localized pollutant inputs, such as episodic discharges or spatially clustered contamination events. The removal of Real-Time Sensing Integration also leads to noticeable performance reduction, albeit to a lesser extent, suggesting that online observation correction provides added robustness but is particularly beneficial in settings with dynamic environmental inputs.
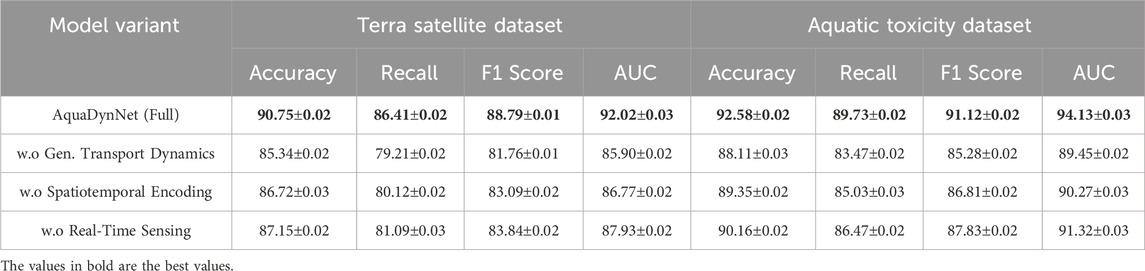
Table 3. Performance benchmarking of our approach against leading techniques on recommendation systems across terra satellite and aquatic toxicity datasets.
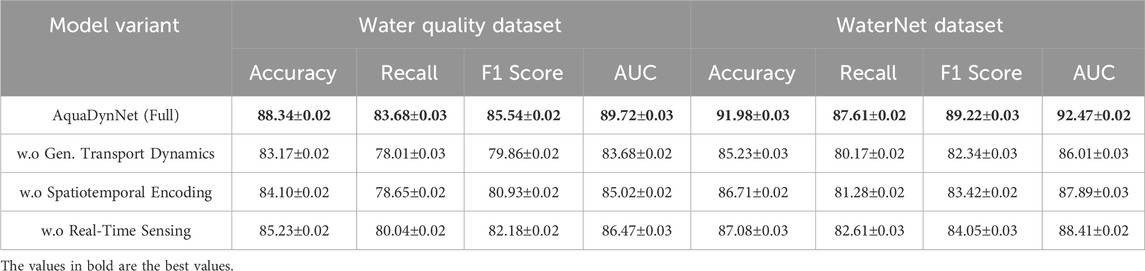
Table 4. Performance benchmarking of our approach against leading techniques on recommendation systems across water quality and WaterNet datasets.
The ablation results are presented on the Water Quality and WaterNet datasets. The performance trends observed here are consistent with those from the previous datasets, but the importance of Real-Time Sensing Integration becomes more pronounced, especially on the WaterNet dataset. Removing this component leads to a substantial drop in all metrics, with F1 score decreasing from 89.22 to 84.05 and AUC from 92.47 to 88.41, indicating the critical role of real-time environmental updates in infrastructure-dense and highly dynamic water systems. In contrast, the removal of Generalized Transport Dynamics yields large accuracy and AUC penalties on Water Quality data, confirming the necessity of modeling pollutant advection and degradation under varying hydrological and chemical conditions. The ablation of Spatiotemporal Source Encoding consistently results in lower recall and F1 scores, reflecting a reduced ability to detect distributed or time-variant contamination sources. These findings demonstrate that each component within AquaDynNet plays a distinct and irreplaceable role across different data modalities and environmental settings, and validate the model’s composite architecture as essential for generalizable performance in real-world water quality modeling tasks.
The ablation study presented in Table 3; Table 4 provides critical insights into the contribution of each core module in AquaDynNet. Removing the Generalized Transport Dynamics (GTD) module leads to the largest degradation in both accuracy and AUC across all datasets, confirming that embedding hydrodynamic priors into the model is essential for capturing realistic pollutant behavior. Specifically, AUC dropped by 6.12 points on the Water Quality dataset and 6.46 points on WaterNet when GTD was removed, underscoring its role in preserving physical consistency. Excluding the Spatiotemporal Source Encoding (STE) led to decreased recall and F1-score, suggesting a reduced ability to handle temporally variable or spatially concentrated emissions. This module is particularly valuable in scenarios involving episodic discharges or spatial anomalies, such as industrial runoff or urban stormwater events. The Real-Time Sensing Integration (RTSI) module, when removed, caused notable performance drops in WaterNet, where sensor updates are most critical due to the rapidly changing environmental conditions of infrastructure-heavy systems. The AUC drop from 92.47 to 88.41 further highlights its role in dynamic adaptation. Overall, these experiments validate the complementary strengths of each architectural component and justify the integrated design of AquaDynNet for generalizable and interpretable water contamination detection.
To provide a clearer understanding of how each architectural component contributes to the overall performance of AquaDynNet, we present a comparative visualization in Figure 6. This line plot captures the metric changes—Accuracy, F1-Score, and AUC—across four datasets (Terra, Aquatic Toxicity, Water Quality, and WaterNet) under different ablation settings. The Full configuration represents the complete model, while the subsequent points indicate performance when one core component is removed: Generalized Transport Dynamics (G.T.D.), Spatiotemporal Encoding (S.T.E.), or Real-Time Sensing Integration (R.T.S.I.). The visualization reveals that the absence of G.T.D. leads to the sharpest performance declines across all metrics, particularly on the Terra and Water Quality datasets, underscoring its central role in modeling physical transport and pollutant dynamics. Similarly, excluding R.T.S.I. results in significant performance drops, most notably in WaterNet, where real-time feedback is essential for handling rapidly changing conditions. Although removing S.T.E. also impacts performance, the decline is comparatively moderate. By providing a consolidated view across all datasets and metrics, this figure confirms that each module within AquaDynNet plays a unique and essential role. The composite design ensures the model’s high accuracy, robustness, and applicability in diverse ecological settings. This visual summary strengthens our earlier quantitative findings and offers an intuitive complement to the ablation tables.
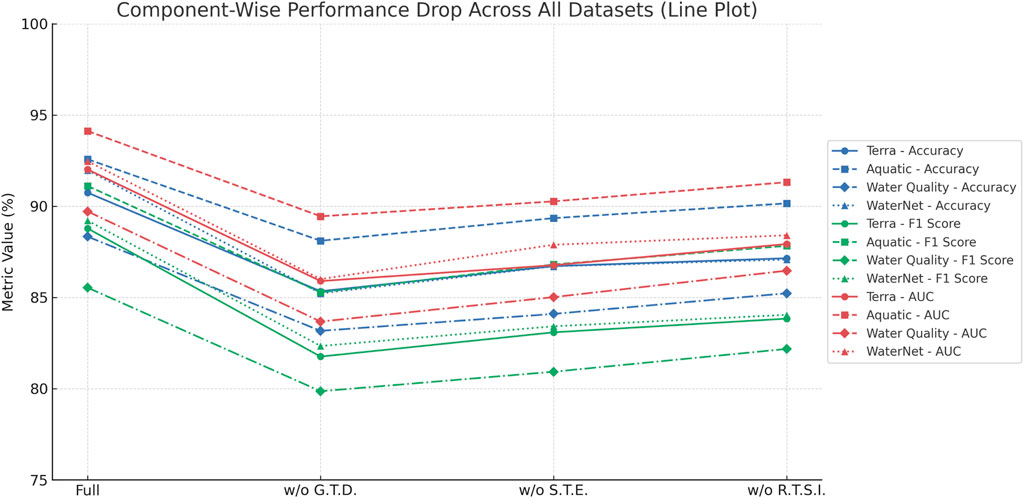
Figure 6. Component-wise performance degradation across datasets. This line plot visualizes how removing key modules—Generalized Transport Dynamics (G.T.D.), Spatiotemporal Encoding (S.T.E.), and Real-Time Sensing Integration (R.T.S.I.)—affects Accuracy, F1-Score, and AUC on all four datasets. The G.T.D. module proves essential for maintaining high accuracy and generalization, while R.T.S.I. is particularly impactful in dynamic infrastructure settings.
To clarify the modeling objectives and comparative structure of our experiments, we organize this section into three specific layers: task definition, baseline comparison, and performance analysis. For each dataset, the modeling goal is clearly defined. These comparisons are summarized in Table 5, highlighting how AquaDynNet outperforms state-of-the-art baselines and demonstrating the critical role of each architectural module. For instance, in the Water Quality dataset, the objective is to classify water samples into safe or contaminated categories based on sensor measurements. In contrast, the WaterNet dataset emphasizes contaminant propagation modeling across hydraulic networks, requiring both node-level prediction and temporal trend forecasting. We compared our model (AquaDynNet) against six representative baseline methods: CLIP, ViT, I3D, BLIP, Wav2Vec 2.0, and T5. Each method was chosen to reflect either a strong visual-language foundation or a temporal sequence modeling capability. All models were trained and tested under identical conditions using stratified dataset splits to ensure fairness. Evaluation metrics include accuracy, recall, F1-score, and AUC. These metrics were calculated across three independent trials, with mean and standard deviation reported. To make the comparison more interpretable, we added specific examples to the text. For instance, on the Water Quality dataset, AquaDynNet achieved an F1-score of 85.54
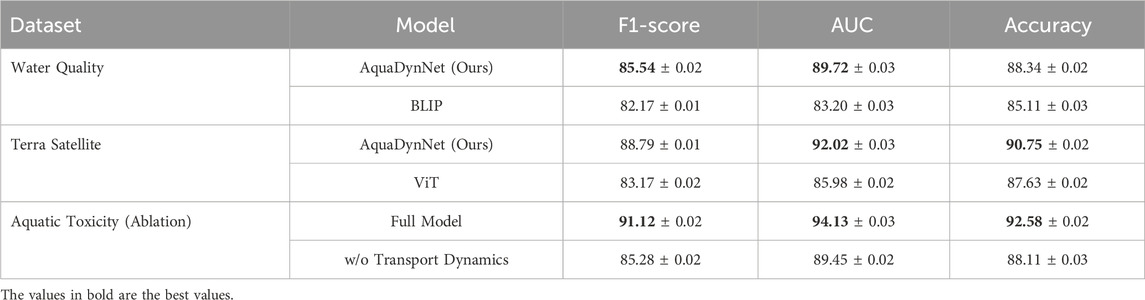
Table 5. Illustrative comparison of AquaDynNet against baseline models across datasets.
While the above experiments focus on evaluating model performance across diverse datasets, our proposed framework is explicitly designed for real-world deployment in water quality monitoring systems. The modular architecture of AquaDynNet and FlowSentinel supports seamless integration with real-time environmental sensing platforms. For example, AquaDynNet accepts input from distributed water quality sensors deployed in rivers, lakes, or reservoirs, which can continuously stream measurements such as pH, turbidity, temperature, and dissolved oxygen. These data are directly assimilated into the model pipeline through the FlowSentinel component. FlowSentinel functions as a dynamic control loop that receives real-time observational data and adjusts AquaDynNet’s predictions using Bayesian correction and Kalman filtering. This allows the system to account for unexpected pollution events, missing sensor values, or external environmental shocks. The system can be embedded within existing hydrological infrastructure through edge computing units that collect, preprocess, and relay sensor signals to the central prediction engine. Our framework also supports participatory decision-making by allowing stakeholders—including policymakers, environmental agencies, and utility operators—to interact with model outputs through a web-based interface. They can simulate hypothetical pollution scenarios, evaluate mitigation strategies, and prioritize intervention locations based on the predicted water quality index and ecological risk estimates. Since the model is grounded in physical transport dynamics, it provides not only accurate forecasts but also interpretable spatial patterns that align with how contamination disperses in real water bodies. This operational setup transforms AquaDynNet from a static prediction model into an adaptive, closed-loop monitoring system suitable for continuous deployment. It enables predictive surveillance and proactive intervention, making it well-suited for managing water quality in complex ecological regions and under resource-constrained monitoring conditions.
5 Conclusions and future work
The study addresses the increasing threat of water contamination and proposes an AI-powered approach for improving water quality monitoring. Traditional water quality monitoring techniques, such as manual sampling and basic chemical analysis, are inadequate in detecting contamination in real-time. To overcome these limitations, the authors introduce a novel method that leverages AI, machine learning algorithms and sensor networks, for continuous monitoring of water bodies. The model integrates real-time sensor data with predictive analytics to detect contamination events more accurately and efficiently than traditional methods. The experimental results demonstrate the model’s superiority, showing it can predict contaminant concentrations and evaluate mitigation strategies with enhanced accuracy and speed. This AI-based approach provides actionable insights that can guide policymakers and environmental agencies in mitigating water contamination’s effects on public health and ecosystems, offering a scalable solution for global water management challenges.
While our current evaluation demonstrates strong performance across curated datasets, we recognize the importance of assessing the proposed framework under varying environmental settings. Different types of water pollution—such as heavy metal discharge, agricultural runoff, microbial contamination, or thermal effluents—may exhibit distinct spatiotemporal behaviors that could influence prediction dynamics. Likewise, weather-induced events like rainfall, droughts, and temperature fluctuations introduce additional variability in pollutant dispersion and measurement noise. Our model’s design, grounded in physical transport mechanisms, provides a degree of inherent adaptability to such conditions. However, further validation is needed to quantify its robustness in the presence of multi-source pollution and underrepresented climatic regimes. In future work, we plan to extend the training process using synthetic or augmented datasets that simulate extreme scenarios, incorporate uncertainty-aware prediction layers, and evaluate model generalizability across diverse geographic regions. These efforts will support the deployment of AquaDynNet in operational environments with varying hydrological, ecological, and meteorological characteristics (Frincu, 2025).
Our interpretation of the experimental results is supported by a growing body of literature emphasizing the advantages of physically grounded, sensor-integrated, and data-driven methods in environmental monitoring (Lambrou et al., 2014). Prior research has shown that sensor network integration and real-time data feedback significantly enhance contamination detection capabilities in drinking water systems (Che et al., 2015). Moreover, machine learning-based approaches, when combined with domain-specific modeling, have demonstrated improved prediction accuracy and adaptability under various hydrological conditions (Ahmed et al., 2019). The role of sensor placement in optimizing contamination detection coverage is also well recognized (Hu et al., 2018), particularly in infrastructure-dense regions. Finally, reviews on remote sensing applications further affirm the importance of multimodal data fusion in water quality monitoring (Mohseni et al., 2022).
Despite its promising outcomes, there are two limitations in the current approach that need further consideration. The model’s reliance on sensor networks may pose challenges related to the density distribution of sensors in diverse geographical areas, potentially affecting data quality and coverage in remote or less accessible locations. While the AI-powered system offers improved detection capabilities, it requires continuous updates and refinement to account for the ever-changing nature of water contaminants, environmental conditions, and emerging pollutants. Future research should focus on enhancing sensor network accessibility and developing adaptable AI models that can accommodate new contaminants and dynamic environmental variables. In addition to the discussed issues surrounding sensor density and dynamic pollutant variability, we identify three further limitations that may affect the robustness and scalability of our framework. First, the adaptability of AquaDynNet to emerging contaminants such as per- and polyfluoroalkyl substances (PFAS) presents a critical challenge. These compounds possess unique physicochemical properties, often exhibiting low degradability and high environmental persistence. As PFAS may not be well-represented in existing datasets or training regimes, their detection would require model retraining on new labeled data and potentially revising feature extraction modules to incorporate relevant molecular descriptors or spectroscopic signatures. Second, the real-time deployment of AquaDynNet and FlowSentinel introduces considerable computational overhead. The system currently depends on high-performance computing infrastructure, including GPUs with significant memory capacity, to process multimodal data streams and update predictions in near real time. This may limit its practical adoption in low-resource regions or decentralized monitoring setups. Potential solutions include model pruning, quantization, or the development of lightweight surrogate models that maintain performance while reducing inference latency. Third, the generalizability of our ecological impact modeling—especially the dynamic Water Quality Index (WQI)—may vary across geographic regions. Factors such as regulatory thresholds, ecosystem sensitivity, and pollutant interaction dynamics differ significantly between freshwater systems in, for instance, arid versus temperate climates. While our model provides a flexible architecture, local calibration of ecological baselines and stakeholder preferences remains essential to maintain interpretability and decision relevance. Future work should explore transfer learning strategies and modular WQI definitions to support broader applicability without sacrificing domain specificity. These additional limitations underscore the need for adaptive modeling, computational efficiency, and regional customization in developing scalable, actionable AI solutions for water quality management.
Data availability statement
The datasets generated and/or analysed during the current study are available in the https://snippets.cacher.io/snippet/a2b3af798528d1ae0c05.
Author contributions
LY: Conceptualization, Methodology, Supervision, Project administration, Validation, Resources, Visualization, Writing – original draft, Writing – review and editing. ZZ: Software, Validation, Data curation, Conceptualization, Formal analysis, Investigation, Funding acquisition, Software, Writing – original draft, Writing – review and editing. XL: formal analysis, investigation, Writing – review and editing. JH: Data curation, Writing – review and editing. LY: Writing – original draft, Writing – review and editing. YW: Visualization, Writing – review and editing. AZ: Supervision, Funding acquisition, Writing – review and editing.
Funding
The author(s) declare that financial support was received for the research and/or publication of this article. All funding sources must be clearly disclosed, including specific grant numbers where relevant. Please make sure that all required funding details are included prior to publication, as updates cannot be made once the article is published.
Acknowledgments
This brief statement serves to recognize the support and assistance provided by particular individuals, organizations, or institutions that contributed to the authors’ work.
Conflict of interest
The authors declare that the research was conducted in the absence of any commercial or financial relationships that could be construed as a potential conflict of interest.
Generative AI statement
The author(s) declare that no Generative AI was used in the creation of this manuscript.
Publisher’s note
All claims expressed in this article are solely those of the authors and do not necessarily represent those of their affiliated organizations, or those of the publisher, the editors and the reviewers. Any product that may be evaluated in this article, or claim that may be made by its manufacturer, is not guaranteed or endorsed by the publisher.
Supplementary material
The Supplementary Material for this article can be found online at: https://www.frontiersin.org/articles/10.3389/fenvs.2025.1612658/full#supplementary-material
References
Ahmed, A., Othman, F., Afan, H., Ibrahim, R., Fai, C., Hossain, M., et al. (2019). Machine learning methods for better water quality prediction. J. Hydrology 578, 124084. doi:10.1016/j.jhydrol.2019.124084
Ajayi, O. O., Bagula, A. B., Maluleke, H. C., Gaffoor, Z., Jovanovic, N., and Pietersen, K. C. (2022). Waternet: a network for monitoring and assessing water quality for drinking and irrigation purposes. IEEE Access 10, 48318–48337. doi:10.1109/access.2022.3172274
Arnon, T. A., Ezra, S., and Fishbain, B. (2019). Water characterization and early contamination detection in highly varying stochastic background water, based on machine learning methodology for processing real-time uv-spectrophotometry. Water Res. 155, 333–342. doi:10.1016/j.watres.2019.02.027
Barraza, N., Maina, J., Langer, G., Arellano, P., Martinez, H., Berky, A., et al. (2025). Ficus insipida tree rings as biomonitors for gaseous elemental mercury in the artisanal gold mining-impacted peruvian amazon. Front. Environ. Sci. 13, 1531800. doi:10.3389/fenvs.2025.1531800
Che, H., Liu, S., and Smith, K. (2015). Performance evaluation for a contamination detection method using multiple water quality sensors in an early warning system. Water 7, 1422–1436. doi:10.3390/w7041422
Chen, L.-W., and Rudnicky, A. (2023). “Exploring wav2vec 2.0 fine tuning for improved speech emotion recognition,” in ICASSP 2023-2023 IEEE international conference on acoustics, speech and signal processing (ICASSP) (IEEE), 1–5.
deSouza, P., Ibsen, P. C., Westervelt, D. M., Kahn, R., Zaitchik, B. F., and Kinney, P. L. (2025). A nationwide evaluation of crowd-sourced ambient temperature data. Front. Environ. Sci. 13, 1527855. doi:10.3389/fenvs.2025.1527855
Frincu, R. (2025). Artificial intelligence in water quality monitoring: a review of water quality assessment applications. Water Qual. Res. J. 60, 164–176. doi:10.2166/wqrj.2024.049
Gajewicz-Skretna, A., Furuhama, A., Yamamoto, H., and Suzuki, N. (2021). Generating accurate in silico predictions of acute aquatic toxicity for a range of organic chemicals: towards similarity-based machine learning methods. Chemosphere 280, 130681. doi:10.1016/j.chemosphere.2021.130681
Gautam, P., Suniti, S., Kumari, A., Madathil, D., Nair, B., et al. (2012). A review on recent advances in biosensors for detection of water contamination. Int. J. Environ. Sci. 2, 1565–1574. Available online at: https://www.indianjournals.com/ijor.aspx?target=ijor:ijes&volume=2&issue=3&article=039.
Girones, R., Ferrús, M. A., Alonso, J. L., Rodriguez-Manzano, J., Calgua, B., de Abreu Corrêa, A., et al. (2010). Molecular detection of pathogens in water–the pros and cons of molecular techniques. Water Res. 44, 4325–4339. doi:10.1016/j.watres.2010.06.030
Glasgow, H. B., Burkholder, J. M., Reed, R. E., Lewitus, A. J., and Kleinman, J. E. (2004). Real-time remote monitoring of water quality: a review of current applications, and advancements in sensor, telemetry, and computing technologies. J. Exp. Mar. Biol. Ecol. 300, 409–448. doi:10.1016/j.jembe.2004.02.022
Gunda, N. S. K., and Mitra, S. K. (2016). Rapid water quality monitoring for microbial contamination. Electrochem. Soc. Interface 25, 73–78. doi:10.1149/2.f06164if
Hou, D., He, H., Huang, P., Zhang, G., and Loaiciga, H. (2013). Detection of water-quality contamination events based on multi-sensor fusion using an extented dempster–shafer method. Meas. Sci. Technol. 24, 055801. doi:10.1088/0957-0233/24/5/055801
Hu, C., Li, M., Zeng, D., and Guo, S. (2018). A survey on sensor placement for contamination detection in water distribution systems. Wirel. Netw. 24, 647–661. doi:10.1007/s11276-016-1358-0
Huang, J., Zhang, Y., Bing, H., Peng, J., Dong, F., Gao, J., et al. (2021). Characterizing the river water quality in China: recent progress and on-going challenges. Water Res. 201, 117309. doi:10.1016/j.watres.2021.117309
Lambrou, T., Anastasiou, C., Panayiotou, C., and Polycarpou, M. (2014). A low-cost sensor network for real-time monitoring and contamination detection in drinking water distribution systems. IEEE Sensors J. 14, 2765–2772. doi:10.1109/jsen.2014.2316414
Li, J., Li, D., Xiong, C., and Hoi, S. (2022). “Blip: bootstrapping language-image pre-training for unified vision-language understanding and generation,” in International conference on machine learning (PMLR), 12888–12900. Available online at: https://proceedings.mlr.press/v162/li22n.html.
Liu, S., Che, H., Smith, K., and Chen, L. (2014). Contamination event detection using multiple types of conventional water quality sensors in source water. Environ. Sci. Process. & Impacts 16, 2028–2038. doi:10.1039/c4em00188e
Liu, S., Che, H., Smith, K., Lei, M., and Li, R. (2015). Performance evaluation for three pollution detection methods using data from a real contamination accident. J. Environ. Manag. 161, 385–391. doi:10.1016/j.jenvman.2015.07.026
McKenna, S. A., Hart, D. B., and Yarrington, L. (2006). Impact of sensor detection limits on protecting water distribution systems from contamination events. J. Water Resour. Plan. Manag. 132, 305–309. doi:10.1061/(asce)0733-9496(2006)132:4(305)
Mohseni, F., Saba, F., Mirmazloumi, S., Amani, M., Mokhtarzade, M., Jamali, S., et al. (2022). Ocean water quality monitoring using remote sensing techniques: a review. Mar. Environ. Res. 180, 105701. doi:10.1016/j.marenvres.2022.105701
Naveed, M., Scholz, M., Ahmed, A. R., Zia, H., Al-Faraj, F. A., and Khan, M. S. (2022). Integrated risk assessment of contaminants of emerging concern in water resources using fuzzy-based bayesian belief networks. J. Hazard. Mater. 429, 128309. doi:10.1016/j.jhazmat.2021.128309
Nguyen, T. H., Liew, A., and Lovell, B. C. (2019). “Graph-based models for hyperspectral image classification,” in Machine learning and knowledge discovery in databases (Springer), 131–146. 11051 of Lecture Notes in Computer Science. doi:10.1007/978-3-030-21258-2_10
Palmer, S. C., Kutser, T., and Hunter, P. D. (2015). Remote sensing of inland waters: challenges, progress and future directions. Remote Sens. Environ. 157, 1–8. doi:10.1016/j.rse.2014.09.021
Peng, Y., Lee, J., and Watanabe, S. (2023). “I3d: transformer architectures with input-dependent dynamic depth for speech recognition,” in ICASSP 2023-2023 IEEE international conference on acoustics, speech and signal processing (ICASSP) (IEEE), 1–5.
Priya, S. K., Shenbagalakshmi, G., and Revathi, T., (2018). Design of smart sensors for real time drinking water quality monitoring and contamination detection in water distributed mains. Int. J. Eng. Technol. 7, 47–51. Available online at: https://www.academia.edu/download/77653048/3017.pdf.
Ramadas, M., and Samantaray, A. K. (2018). Applications of remote sensing and gis in water quality monitoring and remediation: a state-of-the-art review. Water Remediat., 225–246. doi:10.1007/978-981-10-7551-3_13
Rathi, S., and Gupta, R. (2015). A critical review of sensor location methods for contamination detection in water distribution networks. Water Qual. Res. J. Can. 50, 95–108. doi:10.2166/wqrjc.2014.011
Tinelli, S., and Juran, I. (2019). Artificial intelligence-based monitoring system of water quality parameters for early detection of non-specific bio-contamination in water distribution systems. Water Supply 19, 1785–1792. doi:10.2166/ws.2019.057
Topp, S. N., Pavelsky, T. M., Jensen, D., Simard, M., and Ross, M. R. (2020). Research trends in the use of remote sensing for inland water quality science: moving towards multidisciplinary applications. Water 12, 169. doi:10.3390/w12010169
Touvron, H., Cord, M., and Jégou, H. (2022). “Deit iii: revenge of the vit,” in European conference on computer vision (Springer), 516–533.
Venkata Sudhakar, C., and Reddy, U. (2023). Impacts of cement industry air pollutants on the environment and satellite data applications for air quality monitoring and management. Environ. Monit. Assess. 195, 840. doi:10.1007/s10661-023-11408-1
Wang, H., Xu, X., Hu, Z., Shen, Y., and Chen, X. (2021). Multiscale dynamic modeling of aquatic contaminant migration in response to environmental stressors. Environ. Pollut. 274, 116546. doi:10.1016/j.envpol.2021.116546
Wang, X., Zhang, L., Liang, Y., Wang, W., Chen, Y., Rolfsson, Ó., et al. (2025). Per- and polyfluoroalkyl substances (pfas) in the cryosphere – occurrence, organismic accumulation, ecotoxicological impacts, transformation, and management strategies. Front. Environ. Sci. 13, 1559941. doi:10.3389/fenvs.2025.1559941
Wen, X.-P., Yang, X.-F., and Funatsu, K. (2011). Monitoring of water quality using remote sensing data mining. Knowledge-oriented Appl. data Min. Available online at: https://books.google.com/books?hl=zh-CN&lr=&id=CLqZDwAAQBAJ&oi=fnd&pg=PA135&dq=Wen,+X.-P.,+Yang,+X.-F.,+and+Funatsu,+K.+(2011).+Monitoring+of+water+quality+using+remote+sensing+data+mining.+Knowledge-oriented+Appl.+data+Min.&ots=9lGeBKsWgP&sig=XPxmaXLvBFoqiID7JN1NdA2-UUc.
Wilson, C. G., and Gianchandani, Y. B. (2003). Spectral detection of metal contaminants in water using an on-chip microglow discharge. IEEE Trans. Electron Devices 49, 2317–2322. doi:10.1109/ted.2002.805608
Yang, H., Kong, J., Hu, H., Du, Y., Gao, M., and Chen, F. (2022a). A review of remote sensing for water quality retrieval: progress and challenges. Remote Sens. 14, 1770. doi:10.3390/rs14081770
Yang, L., Driscol, J., Sarigai, S., Wu, Q., Lippitt, C. D., and Morgan, M. (2022b). Towards synoptic water monitoring systems: a review of ai methods for automating water body detection and water quality monitoring using remote sensing. Sensors 22, 2416. doi:10.3390/s22062416
Yang, Y. J., Haught, R. C., and Goodrich, J. A. (2009). Real-time contaminant detection and classification in a drinking water pipe using conventional water quality sensors: techniques and experimental results. J. Environ. Manag. 90, 2494–2506. doi:10.1016/j.jenvman.2009.01.021
Zhang, B., Zhang, P., Dong, X., Zang, Y., and Wang, J. (2024). “Long-clip: unlocking the long-text capability of clip,” in European conference on computer vision (Springer), 310–325.
Zheng, F., Du, J., Diao, K., Zhang, T., Yu, T., and Shao, Y. (2018). Investigating effectiveness of sensor placement strategies in contamination detection within water distribution systems. J. Water Resour. Plan. Manag. 144, 06018003. doi:10.1061/(asce)wr.1943-5452.0000919
Zhuang, H., Qin, Z., Jagerman, R., Hui, K., Ma, J., Lu, J., et al. (2023). “Rankt5: fine-tuning t5 for text ranking with ranking losses,” in Proceedings of the 46th international ACM SIGIR conference on research and development in information retrieval, 2308–2313.
Keywords: AI-powered detection, water contamination, machine learning, real-time monitoring, ecological health
Citation: Yang L, Ziwen Z, Lin X, Hei J, Wang Y and Zhang A (2025) AI-powered approaches for enhancing remote sensing-based water contamination detection in ecological systems. Front. Environ. Sci. 13:1612658. doi: 10.3389/fenvs.2025.1612658
Received: 16 April 2025; Accepted: 22 July 2025;
Published: 19 August 2025.
Edited by:
Sushant K. Singh, CAIES Foundation, IndiaReviewed by:
Jianyong Wu, The Ohio State University, United StatesJiahao Wang, Geosyntec Consultants, Canada
Copyright © 2025 Yang, Ziwen, Lin, Hei, Wang and Zhang. This is an open-access article distributed under the terms of the Creative Commons Attribution License (CC BY). The use, distribution or reproduction in other forums is permitted, provided the original author(s) and the copyright owner(s) are credited and that the original publication in this journal is cited, in accordance with accepted academic practice. No use, distribution or reproduction is permitted which does not comply with these terms.
*Correspondence: Zhang Ziwen, bnVubm9uZWtyaUBob3RtYWlsLmNvbQ==