 Ruiyan Gao
 Taohan Ni2†
 Qin Zhang
- 1Business School, Ningbo University, Ningbo, China
- 2Nottingham University Business School China, Ningbo, China
- 3Zhoushan Branch, State Tobacco Monopoly Administration, Zhoushan, China
Introduction: With the rapid development of the economy in recent years, along with global warming, the chemical industry is an important contributor to global carbon emissions. The rapid development of the digital economy has in turn brought new opportunities for chemical companies to reduce emissions. In this study, chemical industry enterprises are taken as the research object, aiming to explore how the development of digital economy has a specific impact on the carbon emission intensity of the chemical industry through the paths of enhancing the efficiency of resource utilization and optimizing the industrial structure.
Methods: To analyze the carbon emissions of the chemical industry, we first applied decoupling, quadratic, and cubic models to measure emission trends. The impact mechanisms were then examined using externality theory and enterprise environmental behavior theory, focusing on industrial enterprises in prefecture-level cities. The influence of the digital economy on carbon emissions was assessed through baseline regression analysis and robustness tests.
Results: (1) digital economy development can reduce carbon emission intensity; (2) The higher the level of digital economy development, the greater the degree of digitization and informatization across society, the more efficient the resource utilization by chemical enterprises, and the stronger the push towards green and low-carbon industry, all of which contribute to reducing carbon emission intensity.
Discussion: The results demonstrate that digital transformation plays a crucial role in reducing carbon emissions in the chemical industry. Enhanced digitalization enables enterprises to optimize production processes, increase energy efficiency, and adopt cleaner technologies. To further promote emission reductions, chemical enterprises should increase R&D investment in digital and green technologies, form innovation alliances to accelerate knowledge sharing, and pursue strategic transformation toward low-carbon business models.
1 Introduction
1.1 Formulation of the problem
Since the Industrial Revolution, science and technology have developed rapidly, and production efficiency has been greatly improved. Economic development has been fruitful. However, behind the brilliant economic achievements, it is accompanied by the wanton exploitation of resources and serious damage to the environment, and the extent of the damage has far exceeded the ability of the ecosystem to repair itself, resulting in adverse consequences such as haze, acid rain, ozone holes, and climate warming. The international community has gradually realized the seriousness of environmental problems and has taken active measures to deal with this global disaster. For example, after the discovery of the ozone hole in 1984, the Vienna Convention for the Protection of the Ozone Layer was introduced in 1985, and the Montreal Protocol on Substances that Deplete the Ozone Layer was enacted in 1987, aiming to reduce the scale of Freon use through the cooperation of several countries and regions. According to relevant observations, the ozone hole has been gradually shrinking since 2017. It can be seen that international cooperation is an effective means of realizing self-help for mankind, and the remediation of ozone-depleting substances in air-conditioning systems also provides a good example for the solution of other global environmental problems.
Climate warming has become a major problem constraining economic and social development, causing global issues such as melting glaciers, rising sea levels, climate anomalies, reduced food production, and the collapse of the food chain. In addition to cyclical climate fluctuations, greenhouse gas emissions from the consumption of fossil fuels in human production and life are undoubtedly the most significant cause of climate change. Since the end of the 20th century, the international community has begun to extensively study how to address this global challenge. In 1992, the United Nations Framework Convention on Climate Change was adopted, establishing the principle of “common but differentiated responsibilities” between developed and developing countries. In 1997, the Kyoto Protocol specifically proposed that major global industrialized nations reduce their carbon emissions by 5% from 1990 levels by 2008–2012. Despite the difficulties, the Copenhagen Accord in 2009 was still a significant step forward in the international community’s joint efforts to address climate change. In 2015, the Paris Climate Agreement was reached, which is widely recognized and came into effect in 2020.
As the world’s largest developing nation, China has demonstrated a proactive approach in fulfilling its global responsibilities. In 2015, the Chinese government established binding emission reduction targets: to decrease carbon dioxide emissions per unit of GDP by 40%–45% by 2020 compared to 2005 levels, while striving to peak total carbon emissions around 2030. These binding quantitative targets were systematically integrated as key performance indicators within China’s strategic planning framework for socioeconomic advancement over extended time horizons. According to statistical data, by 2017, China had already reduced its carbon intensity by approximately 46% relative to 2005 levels. This achievement not only met the 2020 target 3 years ahead of schedule but also exceeded the original emission reduction goal. Under the Paris Agreement framework, China further refined its climate commitments, pledging to raise the share of non-fossil energy in primary energy consumption to around 20% by 2030. Additionally, the country aims to enhance carbon sequestration by increasing forest stock volume, targeting a growth of 4.5 billion cubic meters by 2030 compared to 2005. Currently, China is undergoing rapid industrialization and urbanization. These well-defined emission reduction requirements will effectively drive the transformation of economic development toward green and low-carbon practices, ensuring the implementation of sustainable development principles.
Therefore, chemical industry enterprises are taken as the research object, aiming to explore how the development of digital economy has a specific impact on the carbon emission intensity of the chemical industry through the paths of enhancing the efficiency of resource utilization and optimizing the industrial structure. Firstly, the carbon emission coefficient method proposed by the IPCC Committee, which fits the actual situation of the enterprise, is selected as the measurement index, and the carbon emission of the enterprise is accurately measured based on this method. Secondly, the entropy weight method is utilized and combined with the principal component analysis method to measure the development of digital economy. Finally, the OECD decoupling model is used to preliminarily test the promotion effect of digital economy development on carbon emission reduction, and the OECD model is supplemented and improved by the Tapio decoupling model, which further improves the accuracy of the assessment and evaluates the policy effect. On the one hand, through the systematic assessment, the carbon emission performance of enterprises can be reasonably evaluated, providing scientific basis and targeted opinions for enterprises to enhance the level of green development; on the other hand, this study is not only of guiding significance for large-scale chemical industry enterprises, but also of reference value for small and medium-sized enterprises (SMEs), and it can play a leading role in the green development of SMEs, and promote the transformation of the entire chemical industry into a low-carbon and sustainable direction.
1.2 Literature review
Research on the nexus between carbon emissions and economic development has emerged as a prominent focus in environmental economics, yielding substantial scholarly achievements. Two predominant research directions have dominated this field: the decoupling analysis of economic growth from carbon emissions, and investigations into the Environmental Kuznets Curve (EKC) hypothesis concerning their relationship. The decoupling concept was firstly introduced by the Organization for Economic Cooperation and Development (OECD) in 2002, referring to a developmental state where economic expansion becomes independent of material resource consumption. Historically, economic development has been fundamentally tied to substantial energy inputs, maintaining a strong coupling relationship between growth and energy use throughout industrialization processes. However, through technological innovation, industrial upgrading, and transformations in economic development patterns, advanced economies have demonstrated significant improvements in resource efficiency. Notably, certain developed nations have achieved a divergence between economic growth rates and energy consumption trends - a phenomenon characterized as decoupling. OECD (2002) analyzed the decoupling of pollution emissions and economic growth in 30 member countries and found that the average decoupling rate of member countries was 52%, while Juknys (2003) and Herry et al. (2003) studied the decoupling situation of transportation and other related industries in Lithuania and Austria as samples respectively (Juknys, 2003; Herry et al., 2003). Tapio (2005) supplemented and improved the decoupling indicator system to address the shortcomings of the OECD research system and formed a new decoupling indicator system, which is the Tapio decoupling indicator system. The system covers eight cases such as strong decoupling, weak decoupling and growth connection (Tapio, 2005). Foreign literature, such as Wang and Yang (2015) measured the decoupling of economic growth and carbon emissions in Beijing, Tianjin and Hebei from 1996 to 2010 through the Tapio method, and the empirical results show that the “weak decoupling” is the decoupling between the “Ninth Five-Year Plan (1996–2000)” and the “11th Five-Year Plan (2006–2010)”, and “weak coupling” is the main feature of the “10th Five-Year Plan (2001–2005)” (Wang and Yang, 2015). Dong et al. (2016) investigated the Tapio decoupling status of energy consumption and economic growth in Liaoning Province (Dong et al., 2016). Ning et al. (2017) divided China’s interprovincial regions into seven economic zones and investigated the Tapio decoupling indices of these seven regions from 1996 to 2013 (Ning et al., 2017). Wu et al. (2018) investigated the trend of Tapio decoupling in typical industrialized and developing nations from 1965 to 2015 utilizing decoupling theory as a foundation (Wu et al., 2018). This research methodology has also been used in domestic literature to study regional carbon emissions. The characteristics of energy consumption in China’s industrial sector and its changes in relation to carbon emissions were examined in related literature like Wang et al. (2010), which also thoroughly discussed the relationship between energy consumption, economic growth, and carbon emissions in the industrial sector (Wang et al., 2010). Li et al. (2010) constructed a decoupling analysis framework for the low carbon development of Chinese industries based on the tracing of decoupling research and the construction of low carbon decoupling indexes, and modified the Tapio model, and selected the construction industry in Shanxi for empirical analysis (Li et al., 2010). The Tapio decoupling model was used by Yue and Li (2011) to investigate the dynamic link between carbon emissions and economic growth in Gansu Province, China. Their methodological approach treated carbon decoupling indices as key metrics for assessing regional low-carbon development performance. The research yielded significant findings regarding Gansu’s industrial structure, revealing that the province’s core economic sectors demonstrated weak decoupling characteristics between gross domestic product growth and corresponding carbon dioxide emissions (Yue and Li, 2011). Zhou (2016) used Tapio model to examine the evolution and decoupling dynamics of carbon emissions from China’s transportation sector in connection to the industry’s economic growth from 1990 to 2013. The report also suggested methods for reducing emissions, emphasizing the creation of rules and laws pertaining to transportation, the optimization of energy structures, and the application of technical developments for emission reduction (Zhou, 2016). Qian and Yu (2018) conducted an empirical analysis within the Tapio decoupling framework, revealing significant spatial heterogeneity in the decoupling relationship between economic growth and carbon emissions across China’s eastern coastal region. Their findings indicate that while the studied areas collectively demonstrated a decoupling effect, the degree of decoupling exhibited substantial regional variations. Notably, Shanghai municipality and Zhejiang province emerged as top performers, achieving strong decoupling, the most desirable state where economic growth occurs alongside absolute reductions in carbon emissions (Qian and Yu, 2018).
The influencing factors of carbon emission include industrial structure, energy consumption structure, energy intensity, urbanization level, population structure, environmental regulation level, etc. Scholars at home and abroad have carried out extensive researches around the above factors by using the methods of Input-Output Analysis (IOA), Logarithmic Mean Differential Decomposition (LMDI) and STIRPAT. Foreign literature, such as Bhattacharyya and Matsumura (2010), has used the LMDI methodology to decompose the drivers of carbon emissions from 1990 to 2007, focusing on the influence of energy structure and energy intensity, taking the 15 countries of the European Union (EU) as the subject of the study (Bhattacharyya and Matsumura, 2010). Using the LMDI approach, variance decomposition, and impulse response function, Alves and Moutinho (2013) examined the carbon emissions of 36 Portuguese economic sectors between 1996 and 2009 and found that energy intensity is the primary factor affecting carbon emission intensity (Alves and Moutinho, 2013). Jiang et al. (2018) looked at the factors that affect carbon emissions in China and the United States and came to the conclusion that the main cause of China’s carbon emission fluctuations is economic activity. The study also found that lowering energy intensity was essential to reducing China’s carbon emissions. Furthermore, it was shown that China’s proportion of coal and oil consumption had a higher effect on emissions than that of other countries. The primary causes of carbon emissions in the US are population increase and energy intensity (Jiang et al., 2018).
Wang et al. (2005), who is one of the earlier domestic scholars to conduct relevant research, used the LMDI method to decompose carbon emissions in China over two sample intervals, 1957–1979 and 1980–2000 (Wang et al., 2005). Other domestic studies, like Zhang (2010), examined the effect of China’s economic development approach on its carbon emission intensity between 1987 and 2007 using the input-output decomposition method. The empirical findings demonstrated that, during the study period, the improvement of the development approach decreased the carbon emission intensity by 66.02% (Zhang, 2010). Tan et al. (2011) examined the driving forces of China’s carbon emission intensity using the LMDI decomposition method (Tan et al., 2011). Yu et al. (2022a) employed the Theil index decomposition technique to quantify geographical variations in ecological performance efficiency (Yu et al., 2022a). Lu et al. (2011) calculated the carbon footprint of energy consumption and its influencing factors in the three cities of Suzhou, Wuxi and Changzhou from 1991 to 2008 using the STIRPAT model. Economic growth was found to be the main cause of carbon footprint changes (Lu et al., 2011). Zhang (2013) similarly concluded that the level of economic development has the most significant impact on carbon emissions, while the impact of energy utilization efficiency and energy consumption structure is relatively small in the study of carbon emissions in Beijing from 1981 to 2010 (Zhang, 2013). Yu et al. (2022b) conducted a comprehensive decomposition analysis of carbon emission drivers employing LMDI method at multiple scales. Their research examined emission determinants across: national and provincial administrative levels, and distinct production process stages. The study revealed significant differential impacts among key factors - production efficiency gains, industrial structure optimization, and urbanization progression exhibited constraining effects on carbon emissions. Conversely, economic expansion and population growth demonstrated positive correlations with emission increases (Yu et al., 2022b). China’s carbon emissions from 1994 to 2008 were broken down using LMDI’s “two-layer complete decomposition method” by Lu et al. (2013). They then examined the impact of energy consumption structure, energy intensity, industrial structure, and economic scale on carbon emissions, as well as the contribution of six major industrial sectors. The study’s findings indicate that while energy intensity and energy structure factors are the most significant variables preventing the increase in carbon emissions, economic scale expansion and industrial structure factors are the most significant causes causing the increase in carbon emissions (Lu et al., 2013). Yu et al. (2024) applied the spatial Durbin model to examine key determinants affecting green innovation efficiency in resource-dependent urban areas. Their empirical analysis confirmed significant spatial autocorrelation effects, indicating that innovation patterns in these cities are geographically interdependent. The results revealed that government policy interventions, industrial structural upgrades, and regional economic growth positively contribute to enhancing green innovation performance. Conversely, stringent environmental regulatory measures and excessive external openness were found to exert suppressive effects on innovation capacity (Yu et al., 2024). Zhang et al. (2014) evaluated the variables influencing the increase in energy use and carbon emissions linked to urbanization using the STIRPAT model and principal component analysis. According to the study, the main causes of the rise in energy consumption and carbon emissions are the growth of built-up regions in cities and towns as well as the level of industrialization (Zhang et al., 2014). Huang et al. (2016) conducted a study on the impact of various factors, including population, affluence, technological progress, and urbanization level, on carbon emissions in Jiangsu Province using the STIRPAT model and ridge regression. The research determined that population had the most substantial influence, with a 1% change in population size leading to a 3.467% increase in carbon emissions. On the other hand, the urbanization level had the least impact, with a 1% increase in urbanization level causing only a 0.151% increase in carbon emissions. Then on the basis of empirical research, the future trend of carbon emissions in Jiangsu Province was studied by setting up eight different development scenarios (Huang et al., 2016). Chen et al. (2018) investigated the variables affecting carbon emissions in Chinese cities at or above the prefecture level using an expanded STIRPAT model. The study came to the conclusion that factors that contribute to higher urban carbon emissions include population size, the share of secondary industrial product value, and heating demand. But the relationship between the rate of urbanization and carbon emissions is still erratic (Chen et al., 2018). Chen and Xu (2018) used inter-provincial panel data to incorporate population, wealth degree, technology level, openness level, financial development level and innovation factors into the extended STIRPAT model, and the results show that GDP per capita, urbanization level and the share of the secondary industry all play a positive role in increasing carbon emissions, while foreign direct investment and innovation factors inhibit the increase in carbon emissions (Chen and Xu, 2018).
While the Internet has profoundly transformed real-world socioeconomic activities and the digital economy has increasingly become a pivotal component of national economic systems, rigorous empirical research systematically evaluating its impact on high-quality development remains extremely limited. Existing scholarly work addressing this phenomenon remains limited to the theoretical elaboration of realization paths and how the Internet affects total factor productivity (Guo and Luo , 2016; Huang et al., 2019b), innovation efficiency (Han et al., 2019; Luo and Li, 2015) and optimization of the economic geography (An and Yang, 2020), as well as the digital economy’s impact on inclusive growth (Zhang et al., 2019) impact of digital economy on inclusive growth (Zhang et al., 2019), and other high-quality development sub-themes (Guo and Luo, 2016; Huang H. Q. et al., 2019; Han et al., 2019; Luo and Li, 2015; An and Yang, 2020; Zhang et al., 2019). An empirical study based on a combination of pertinent theories and the actual Chinese setting is required to address the aforementioned problems. Thus, this paper has the opportunity to contribute marginally to this field.
Existing theoretical studies have concluded that the digital economy influences economic high-quality development through complex, multi-channel mechanisms. From a microeconomic perspective, Internet-based technologies create a unique ecosystem that simultaneously harnesses scale economies, scope economies, and long-tail effects. This integrated environment enhances market efficiency by optimizing supply-demand matching and refining price discovery mechanisms, ultimately elevating economic equilibrium. At the macroeconomic level, the digital economy’s transformative effects manifest through three fundamental pathways: (1) introducing novel production factors, (2) revolutionizing resource allocation efficiency, and (3) augmenting total factor productivity. These interconnected channels collectively drive the transition toward high-quality economic development (Hong, 2018; Jing and Sun, 2019; Hong, 2018; Jing and Sun, 2019). However, there exists an important question in this, through which path the digital economy mainly promotes high-quality development, and previous studies have not provided a unified framework to answer the question. In response to this question, this paper chooses to study the digital economy from the perspective of its impact on entrepreneurial activity. Entrepreneurial initiatives serve as an intrinsic catalyst for economic expansion, significantly contributing to: facilitating the transition between traditional and emerging growth drivers, advancing structural economic upgrading, generating employment opportunities and enhancing social welfare, and fostering equitable access to opportunities and upward social mobility. These combined effects establish a robust foundation for achieving superior-quality economic growth. Through this perspective, this paper tries to explore how the digital economy promotes high-quality development based on a complete framework, assuming that there exists a transmission mechanism of “digital economy → entrepreneurial activity → high-quality development of the economy → reduction of carbon emission intensity”. The higher the level of development of the digital economy, the higher the level of digitization and informatization of the whole society, the higher the level of resource utilization efficiency of enterprises, the higher the level of development of industries in the direction of green and low-carbon, and the lower the intensity of carbon emissions. Moreover, this paper selects the city level as the regional target to explore whether there is regional heterogeneity in the above transmission mechanism so that the digital economy, entrepreneurial activity and high-quality development can be studied at a more detailed spatial scale.
2 Carbon emission theory and evaluation models
2.1 Concepts related to carbon emissions
2.1.1 The concept of carbon emissions
Carbon emissions are greenhouse gas emissions represented by carbon dioxide. According to the Kyoto Protocol and other relevant information, carbon dioxide, methane, nitrous oxide, hydrofluorocarbons, perfluorocarbons, and sulfur hexafluoride are the six major greenhouse gases that cause global warming, of which carbon dioxide accounts for more than 60%, and carbon dioxide belongs to the inert gases, so it is not only difficult but also costly to eliminate it directly by using the relevant chemical methods. Therefore, controlling carbon dioxide emissions at source is undoubtedly the most important measure to solve climate warming. Carbon emissions can be divided into two categories: those originating from non-renewable energy sources like coal, oil, and natural gas, and those originating from renewable energy sources like wind, water, biomass, and tidal energy. Since non-renewable energy now makes up the majority of energy, its carbon emissions are far higher than those of renewable energy. Since the industrial sector in particular uses the most fossil fuels, industrial carbon emissions have emerged as a key area for carbon control and emission reduction.
2.1.2 Indicators for evaluating the level of carbon emissions
2.1.2.1 Total carbon emissions
Total carbon emissions represent the amount of carbon dioxide emitted from production and life in a certain country or region within a certain time span, reflecting the absolute scale of carbon emissions. The total carbon emission is the main evaluation indicator for the early stage of carbon emission reduction and an important basis for the division of responsibility for emission reduction and policy formulation. However, the total carbon emission index has a significant flaw, which ignores the development stages of developing and developed countries. After industrialization, the total carbon emissions of developed countries have stabilized or even declined, while the majority of developing countries are still in the accelerated period of industrialization and urbanization, and their carbon emissions are gradually increasing. Developed countries have accumulated a large amount of carbon emissions historically, while developing countries have a correspondingly small amount. Therefore, by directly restricting the scale of carbon emissions from developing countries clearly violates the right to equal development and is not in the interests of developing countries. In general, it is not possible to require that all countries and regions be subject to a limit on the total amount of carbon emissions, and carbon emission measurement indicators that are more in line with the interests of all parties should be devised.
2.1.2.2 Carbon emissions per capita
The ratio of the total carbon emissions of a nation or region to the size of its population is known as per capita carbon emissions. At a certain stage of development, per capita carbon emissions are closely related to the standard of living. Apportioning the total amount of carbon emissions to individuals reflects the division of responsibility for carbon emission reduction from the perspective of individuals, taking into account the issue of development stages. Relevant studies show that the per capita carbon emissions of developed countries are significantly higher than those of developing countries, and accordingly, developed countries will take more responsibility for emission reduction. This is in conflict with the interests of developed countries, and therefore has not been adopted in the official criteria for the division of responsibility for carbon emission reduction.
2.1.2.3 Carbon intensity
Carbon intensity indicates the amount of carbon emissions per unit of GDP. In conclusion, the lower the carbon intensity, the higher the energy efficiency. Carbon emission intensity will gradually decrease with the stage of economic development and technological level. Carbon emission intensity is affected by many factors, such as technology level, energy structure, energy intensity, industrial structure, economic fluctuations and so on. Generally speaking, developed countries have lower carbon emission intensity due to mature industrial development and higher technological level, while developing countries have higher carbon emission intensity due to the high proportion of energy-consuming and high-emission industries and low technological level. Carbon emission intensity will make the majority of developing countries face severe pressure to reduce emissions. Furthermore, it is evident that the carbon intensity target will not be able to simultaneously meet the needs of both developed and emerging nations. Nevertheless, in contrast to the direct reduction of both per capita and overall carbon emissions. However, lowering carbon intensity is a more gradual approach to reducing emissions than directly lowering total and per capita carbon emissions. It is closely related to the mode of development and the adjustment of industrial structure, and it serves as a crucial foundation for gauging the level of low-carbon development. In summary, it can be found that all types of carbon emission indicators have certain shortcomings, and the main point of contention is that developed and developing countries are at different stages of development, and it is not possible to use a unified indicator to evaluate their carbon emissions.
2.2 Relevant theoretical foundations and research hypotheses
2.2.1 Ecological economic theory
As the global climate change situation has become increasingly severe, the issue of carbon emissions has become an important factor constraining the sustainable development of the economy and society, which not only has a far-reaching impact on the global climate system, but also poses complex and multidimensional challenges to economic and social development. The digital economy, with its high efficiency, intelligence and green features, is profoundly changing the mode of production in all walks of life. American economist Kenneth Boulding put forward the theory of ecological economics in 1968, the core of which lies in revealing the dynamic equilibrium relationship between economic activities and natural ecosystems. According to the United Nations Environment Program (1981), ecological economics covers three major theoretical categories: ecological economic system, ecological economic balance and ecological economic efficiency. Among them, the ecological-economic system provides the material and energy basis for economic activities, the ecological-economic balance maintains the stability of the system by regulating the flow of resources, and the ecological-economic benefit is the synergistic result of economic and ecological benefits.
In the traditional industrialization process, the excessive pursuit of economic efficiency often leads to an imbalance in the ecological and economic system, which is manifested in resource depletion and environmental pollution, such as carbon emissions. For example, developed countries achieved economic growth in the early stages of industrialization through the “high energy consumption, high emissions” model, but ultimately paid high governance costs due to ecosystem collapse. Ecological economics emphasizes that sustainable economic development must be achieved through technological innovation and institutional design to improve resource efficiency and internalize ecological benefits (Daly, 1996). As a new type of economy, digital economy optimizes resource allocation and reduces energy and material consumption in the production process through the Internet of Things (IoT), big data and other technologies, thus promoting the ecological and economic system to evolve towards “low entropy” (Zhao et al., 2020). Specifically, digital technology can monitor the efficiency of energy use in real time, promote process optimization and circular economy model, and ultimately reduce the carbon emission intensity per unit of output.
2.2.2 Theory of externalities
The academic definition of externality has not been unified, but in general it can be divided into two categories based on the subject of generation and the subject of acceptance of the externality. The representative of the former is Samuelson, that externality refers to the production or consumption of other organizations imposed non-compensable costs or given without compensation for the benefits of the situation. The latter is represented by Randall, who states that an externality is an inefficiency that arises when the costs or benefits of a business organization’s actions are not taken into account in the relevant decision-making. Both definitions are essentially the same, i.e., an economic agent has an external impact on another economic agent that is not reflected and bought and sold through market prices. Externalities can be categorized into positive and negative externalities, either of which affects the economic efficiency of an equilibrium market. In the chemical industry, the traditional production model often exists negative externalities, such as high energy consumption, high pollution, the enterprise in pursuit of profit maximization, did not fully consider the carbon emissions and other environmental costs, resulting in the market equilibrium when the supply of products is excessive, the carbon emissions intensity remains high.
The development of the digital economy can precisely change this situation. Through the application of digital technology, chemical enterprises can realize the intelligent and refined management of the production process, improve the efficiency of energy utilization, and reduce energy waste and pollutant emissions. At the same time, the digital economy can also promote inter-enterprise cooperation and resource sharing, optimize the industrial structure, and promote the chemical industry to the direction of green and low-carbon development. From the theory of externality of production, the development of digital economy helps to reduce the negative externality of the chemical industry, reduce the intensity of carbon emissions, and realize the coordinated development of the economy and the environment. Therefore, based on the above two analyses, the hypotheses proposed in this paper are as follows:
Hypothesis 1. The development of digital economy helps to reduce the carbon emission intensity of chemical industry.
3 Determination of econometric models
3.1 Carbon emission measurement models
3.1.1 Decoupling model
The related concept of decoupling was proposed by the Organization for Economic Cooperation and Development (OECD) in 2002 to measure the decoupling between economic growth and environmental pollution pressures, where sustained economic growth is accompanied by a slowdown or even a decline in the rate of growth of resource consumption or environmental pollution, and since then decoupling and its related theories have been widely used in academia, including the evaluation of regional sustainable development, economic material consumption, carbon emission reduction and other fields. There are two main methods in specific analysis, OECD decoupling index and Tapio decoupling index.
3.1.1.1 OECD decoupling index
Calculate the ratio of the rate of economic growth to the rate of change of environmental pressures. The OECD decoupling index reflects decoupling at a fixed point in time, and it uses the base period as a reference to evaluate the relevant situation in the reporting period. The specific formula is as in Equation 1:
3.1.1.2 Tapio decoupling index
The Tapio decoupling index can effectively address the bias in the OECD methodology due to the selection of the reference and reporting periods. It can more accurately characterize short-term dynamics and is suitable for evaluating policy effects. The specific calculation formula is given in Equation 2 below:
When both economic growth and carbon emissions rise, but economic growth increases more than carbon emissions, weak decoupling takes place. Strong decoupling is characterized by a negative growth in carbon emissions alongside positive economic growth. Recessionary decoupling happens when both the economy and carbon emissions decline, but the reduction in carbon emissions is more substantial than the economic downturn. Growth linkage is a scenario where carbon emissions and the economy both increase, with carbon emissions growing at a rate close to or exceeding that of the economy. Economic growth and carbon emissions are both negative and almost equal in a recessionary relationship. When the economy and carbon emissions both rise, but the economy expands more slowly than the carbon emissions, this is known as negative growth decoupling. When the economy shrinks while carbon emissions rise, this is known as strong negative decoupling. Last but not least, weak negative decoupling occurs when carbon emissions and the economy both fall, but the economy’s loss is more noticeable than the carbon emissions'.
3.1.2 Carbon emission EKC curves
The traditional “inverted U” EKC curve indicates that in the early stage of industrialization, as per capita GDP rises, per capita carbon emission also shows an increasing trend, but when per capita GDP grows to a certain stage, per capita carbon emission no longer continues to rise, but shows a decreasing characteristic. As can be seen from the previous literature review section, the EKC curve is not only limited to the traditional inverted U-shape, because of the different research objects and research intervals, the U-shape, inverted N-shape, N-shape and other situations may occur. Therefore, in order to study the EKC curve of industrial economic growth and industrial carbon emission more accurately, this paper sets out the cubic model and the quadratic model respectively in the model setting. When the coefficients of the relevant variables in the regression results of the three-dimensional model pass the significance test, it indicates that the three-dimensional model setting is more reasonable. If the coefficients of the relevant variables in the three times model are not significant, the significance of the relevant regression variables in the secondary model is tested, and if it is significant, the secondary model is chosen. If the coefficients of the relevant variables in both the cubic model and the secondary model show significance, then it is necessary to make a trade-off at this point based on the Akaike Information Criterion (AIC) as well as the model’s goodness-of-fit (R2).
3.2 Comprehensive evaluation index for digital economy development
Only studies conducted at the provincial level are currently available, and there is a dearth of pertinent literature addressing particular metrics of the digital economy: There is a gap in the measurement of the digital economy at the city level. Liu et al. (2020) developed a system of evaluation indicators for China’s sub-provincial digital economy from the three dimensions of informatization development, Internet development, and digital transaction development. They measured it using data from 30 Chinese provinces between 2015 and 2018 (Liu et al., 2020). This study constructs an urban digital economy evaluation system by integrating Liu et al. (2020) Internet-centered framework with digital financial inclusion indicators. For Internet development measurement, we adopt Huang H. Q. et al. (2019) four-dimensional approach: penetration rate, ICT workforce, digital outputs, and mobile adoption. This synthesized method enables comprehensive city-level assessment while ensuring data availability. The four specified metrics are operationalized as follows: broadband penetration rate per 100 inhabitants, workforce concentration in ICT service sectors across urban employment units, per capita telecommunications service volume, and mobile device adoption rate per 100 population. The reputable China Urban Statistical Yearbook served as the direct source of these indicators. We use the China Digital Inclusive Finance Index, a meticulously built composite indicator created jointly by Ant Group’s research division and Peking University’s Digital Finance Research Center, to gauge the progress of digital finance (Guo et al., 2020). We standardized and dimensionally reduced these five component indicators using principal component analysis to create our composite Digital Economy Development Index. The specific steps of the measurement include:
Step 1: Data standardization. As the outline and numerical range of different indicators may differ greatly, the original data need to be standardized to eliminate the influence of the outline and ensure the uniformity of the subsequent calculation. The calculation method is shown in the formula.
Positive indicators are standardized as in Equation 3:
Negative indicators are standardized as in Equation 4:
wherein,
Step 2: Calculate the entropy value of indicators. Based on the standardized data, the entropy value of each indicator is calculated. The entropy value is used to measure the information content of the indicator, and the smaller the entropy value is, the more informative the indicator is and the higher the weight is. As shown in Equations 5-7 below:
where,
Step 3: Calculate the weight coefficient. Calculate the weight coefficient of the indicator according to its entropy value, the smaller the entropy value, the higher the weight. As shown in Equation 8 below:
where,
Step 4: Weighted standardized data. Multiply the standardized data with the weight coefficients to get the weighted standardized data, in order to reduce the interference of low-informative indicators and enhance the impact of high-informative indicators. As shown in Equation 9 below:
where
Step 5: Principal component analysis (PCA) dimensionality reduction. Principal Component Analysis (PCA) is performed on the weighted standardized data to extract the principal components to reduce the dimensionality of the data while retaining the main information. Principal components are linear combinations of the original variables that reflect the main changing characteristics of the data.
The covariance matrix is given in Equation 10 as follows:
where
where,
Step 6: Calculate the composite score. According to the variance contribution ratio of the principal components, calculate the composite score of each sample, which is used to evaluate the new quality productivity development results. As shown in Equation 12 below:
where,
Through the above steps, the entropy weight method combined with principal component analysis can evaluate the development results of digital economy more objectively and accurately.
4 Influence mechanisms and accounting methods of carbon emissions of prefecture-level chemical industrial enterprises
4.1 Factors affecting carbon emissions of chemical industry enterprises
4.1.1 Industrial scale factors
In different studies on the factors affecting carbon emissions, the relevant conclusions also vary considerably, but they all generally agree that the industrial scale factor is an important category of factors affecting carbon emissions. From a micro perspective, under a certain level of technology, the impact of industrial scale on industrial carbon emissions may be two-way. On the one hand, under the influence of scale gain, along with the expansion of scale, the utilization rate and potential of related machinery and equipment can be fully exploited, the division of labor is more detailed, and the skill proficiency of workers is improved, so that the level of specialization of enterprise production is continuously increased, and the performance of carbon emissions is improved. On the other hand, when the production scale exceeds a certain threshold, the returns to scale decline, and the scale factor hinders the improvement of carbon emissions performance. From a macro perspective, under the promotion stimulus and related unreasonable assessment system, to obtain certain political achievements in a short period, local governments tend to ignore the law of industrial development and resource endowment conditions in the region, and follow the traditional rough development mode, which generates a dependence on the traditional high-carbon path, causes duplicated construction, and creates a large amount of industrial inefficient production capacity, which is manifested in the expansion of industrial scale.
4.1.2 Industrial structure factors
The industrial structure factor indicates the proportion of the composition of various industrial sectors and the corresponding technical and economic links, and the proportion of light and heavy industries is a commonly used indicator of industrial structure. When the proportion of heavy industries such as metallurgy, iron and steel, and petrochemicals increases, it is often accompanied by high energy consumption and high emissions, industrial heavy is not conducive to the orderly promotion of industrial carbon emission reduction. According to the research of Wan (2011), the decarbonization of industrial structure is a change process of industrial structure built based on low-carbon technological innovation and changing with the change of technology, including the decline of the proportion of high-carbon industries and the rise of the proportion of low-carbon industries; the decrease of high-carbon product supply and the increase of low-carbon product supply; and the decarbonization of high-carbon industries and the gradual growth of new industries and other three connotations. Industrial technological innovation is the main power source to promote the decarbonization of industrial structures. On the one hand, technological innovation effectively improves the efficiency of resource utilization and changes the substitution relationship between various types of resources. On the other hand, technological innovation also refines the division of labor, accelerates the divestment of related industries, and gives rise to the emergence of new industries. Furthermore, the application of digital technologies such as blockchain significantly improves the collaborative efficiency of the chemical industry supply chain and optimizes the production process. This structural change has led to a gradual decoupling of economic growth from carbon emissions. In the context of tightening environmental regulations and the country’s vigorous development of low-carbon industries, optimizing industrial structure, continuously strengthening industrial technological innovation, product cycle interaction, and technological links between industries, and realizing industrial integration is an effective way to implement carbon emission reduction.
4.1.3 Energy intensity factor
The ratio of energy output to energy consumption is known as energy intensity. The industrial economy’s degree of energy dependence or efficiency in energy use is reflected in its industrial energy intensity. While variations in energy intensity are mostly influenced by shifts in the energy intensity of the industrial sector, lowering energy intensity is a crucial component of achieving carbon emission reduction and a key contributor in slowing the growth of carbon emissions. According to the International Energy Agency’s calculations, by the middle of the 21st century, the energy intensity reduction will contribute nearly one-third to the realization of the overall emission reduction target. At a certain level, energy intensity is also a response to the comprehensive technological level of the region, and energy intensity should be reduced by continuously strengthening investment in research and development and improving the level of technological innovation.
4.1.4 Energy structure factors
The high proportion of traditional fossil energy in energy consumption and the low proportion of clean and green energy constrain the process of industrial decarbonization. Restricted by the resource endowment of “rich coal, poor oil, and less gas” and the long-term distortion of energy prices, the current industrial sector is highly dependent on traditional fossil energy, with coal accounting for nearly 70% of total energy consumption. Insufficient development of clean energy, the new energy industry makes use of high cost, which affects the replacement of new energy with traditional energy. In the short term, this structure of energy consumption is difficult to substantial change, which also reflects the promotion of industrial carbon emission reduction will be a long-term process. As new energy sectors like nuclear and hydropower are developed and expanded gradually, focus should be placed on enhancing energy efficiency, encouraging the effective use of pertinent coal technologies, and reducing the adverse effects of the energy structure’s high carbonization on emission reduction and energy conservation.
4.2 Influence mechanism of carbon emissions of chemical industry enterprises
4.2.1 External environment
Along with the growing severity of environmental problems in various regions, environmental regulations have been gradually tightened, mainly in the following areas. First, environmental laws and regulations: since the promulgation of the Environmental Protection Law in 1989, nearly thirty environmental laws, including the Water Pollution Prevention and Control Law, the Fixed Waste Pollution Prevention and Control Law, and the Environmental Noise Pollution Prevention and Control Law have been promulgated one after another, so that there is a law to follow in environmental management. At the same time, provinces and municipalities have also formulated corresponding regional environmental protection laws and regulations, and the implementation of which has been significantly strengthened, has gradually formed an orderly environmental governance system. Second, the development concept: the 17th Party Congress report put forward the construction of ecological civilization, the 18th Party Congress included ecological civilization into the “five-in-one” overall layout, and the 19th Party Congress proposed relevant measures on how to implement the ecological civilization. A series of top-level designs highlights that the development concept and development mode are changing, and ecological construction is gradually strengthened. Third, the institutional framework underwent a significant transformation in 2007 when energy conservation and emission reduction targets were formally integrated into China’s socioeconomic development evaluation metrics. These environmental indicators became critical components in both governmental leadership assessments and corporate performance evaluations. The implementation of a strict “one-vote veto” policy, where failure to meet targets resulted in penalties including potential dismissal. This regulatory shift fundamentally altered behavioral patterns, compelling both public and private sector actors to prioritize investments in low-carbon technologies and environmental protection initiatives. Fourth, economic pollution control: the sewage fee levy standard was raised four times in the period from 1998 to 2015, to internalize the negative externalities of enterprise production, thus incorporating environmental issues into enterprise production constraints and forcing enterprises to accelerate emission reduction. The carbon trading market was launched in 2017, and carbon trading is essentially an incentive-based quantitative environmental regulatory instrument, which allocates carbon emission rights through market means to improve the efficiency of resource utilization. Fifth, the public: with the improvement of living standards, the public’s demand for an ecological environment is also increasing. With the promotion of modern technological means such as the Internet, the public has a stronger ability to express their wishes and demands, and exerts more environmental pressure on the relevant governments and enterprises and organizations.
4.2.2 Industrial enterprise level
From the analysis of the external environment, it can be found that both formal and informal environmental regulations are gradually strengthening. According to the theory of enterprise environmental behavior, environmental regulation is an important factor influencing the environmental behavior of enterprises. Therefore, the gradually increasing formal and informal environmental regulation will have a profound impact on the environmental behavior of industrial enterprises in various regions. The environmental behavior of enterprises, in turn, changes various factors such as products, technology, and management of enterprises. In the context of the general awakening of low-carbon awareness in society, the digital transformation of enterprises presents an obvious emission reduction orientation: firstly, through the industrial Internet to achieve the production of the whole process of energy consumption visualization and control; secondly, relying on big data analysis to optimize the cleaner production process; and finally, the use of artificial intelligence technology to develop a new type of low-carbon production style.
Specifically, on the product side, firms increase the supply of low-carbon products when formal environmental regulations are strong, and reinforce the supply of high-carbon products when formal environmental regulations are weak. Low-carbon products are generally more expensive than high-carbon products, and are “good money” in a market economy, while high-carbon products belong to “bad money”. Therefore, when informal environmental regulations are strengthened, public awareness of low-carbon enhances, and the number of green consumers grows, thus increasing the consumption of low-carbon products and forcing enterprises to increase the supply of low-carbon products, good money drives out bad money. When the informal environment is weaker, there are more price-sensitive consumers, which will increase the consumption of high-carbon products, prompting enterprises to increase the supply of high-carbon products, bad money drives out good money. In terms of technology, environmental regulation can have a two-way impact on firms’ technology.
The enterprise budget is fixed in a certain period, when the environmental regulation is too strong, unreasonable environmental regulation will crowd out the enterprise research and development investment, which is not conducive to the enterprise technology level improvement, that is, the green paradox phenomenon. However, when environmental regulation is weak, enterprises have insufficient incentive for low-carbon research and development, generating a strong dependence on traditional high-carbon paths, which puts them into a locked-in state that blocks low-carbon development. In terms of management, in the context of a strong government and weak market, the local government holds the initial allocation of resources when the cost of “rent-seeking” from the environmental protection department is lower than the cost of purchasing emission reduction targets or the cost of emission reduction is greater than the cost of rent-seeking, it is easy to breed corruption in the field of emission reduction so that emission reduction effect is greatly reduced. On the contrary, if the carbon market construction has been improved, information disclosure is timely, and the distribution of carbon allowances is fair, enterprises will strengthen the emission reduction under the constraint of carbon emission credits.
4.3 Selection of carbon emission accounting methods for the chemical industry
Since carbon emissions data are not directly given in various statistical yearbooks, they need to be accounted for according to relevant methods. According to different accounting modes, the mainstream carbon emission accounting methods can be divided into two types, namely top-down accounting methods and bottom-up accounting methods. Specifically, the top-down accounting method is mainly based on the IPCC National Greenhouse Gas Guidelines proposed by the Intergovernmental Panel on Climate Change (IPCC), and the final carbon emissions are calculated by analyzing the carbon emission sources. This method is relatively simple to operate and is supported by more reliable and authoritative data, so it is widely used in carbon emission accounting. The bottom-up accounting method is mainly based on the calculation of carbon footprints of products, projects, and organizations to obtain the total carbon emissions. This method is prone to omission defects in the selection of objects, and the accounting process is more complicated and less operable. Therefore, when regional carbon emissions are the object of research, the top-down accounting method is a better choice.
In terms of specific accounting methods, combined with the actual research in this paper, considering that energy consumption is the most important source of carbon emissions in industrial enterprises and is easier to obtain, while supply chain data, such as input-output tables, or full life cycle data are more difficult to cover, the carbon emission coefficient method is chosen among the many common calculation methods, such as the input-output method, the life cycle method, and the carbon emission coefficient method (Mo et al., 2025). Energy combustion is the main source of industrial carbon emissions, and direct measurement of end-use energy consumption can accurately reflect the core part of emissions. Therefore, the final carbon emissions are estimated according to the terminal consumption of various types of energy, and the following calculation formula is adopted concerning the calculation method published in 2006 IPCC National Greenhouse Gas Guidelines and related research results. The following formula is used:
where CE denotes carbon emissions (tons), i is the type of energy, and this paper selects 10 types of energy terminal consumption such as raw coal, washed coal, coke, coke oven gas, natural gas, gasoline, kerosene, diesel fuel, fuel oil, liquefied petroleum gas. F is the terminal fossil energy consumption (10,000 tons or hundred million cubic meters), CV is the average low-level heating value (kilojoules per kilogram or kilojoules per cubic meter), and CCF is the types of energy carbon content (kilogram of carbon per billion joules), COF is the carbon oxidation rate, and 44 and 12 indicate the molecular weight of carbon dioxide and the atomic weight of carbon respectively. Using this formula, one can directly calculate the carbon emissions of industrial firms plus the total.
5 Empirical test of the impact of digital economy development on carbon emissions of industrial enterprises
5.1 Baseline regression
To account for macroeconomic fluctuations and time-invariant individual heterogeneity, a dual fixed-effects specification is employed in the regression analysis. Table 1 shows the baseline regression results of the impact of the digital economy on regional carbon emissions, with no control variables added in Model 1 and control variables added in Model 2. The results of the benchmark regression show that the coefficients of the digital economy are negative at the 5% significance level in both Model 1 without added control variables and Model 2 with added control variables. This result shows that there is a significant negative correlation between the development of digital economy and carbon emission intensity, and the development of digital economy can reduce carbon emission intensity, i.e., for every 1% increase in the level of development of digital economy, the intensity of carbon emission will be reduced by about 0.5%, that is, Hypothesis 1 is valid. The higher the level of development of the digital economy, the greater the degree of societal digital transformation and information technology integration, the more enhanced becomes corporate resource allocation efficiency, inevitably propelling industrial sectors toward environmentally sustainable and carbon-neutral development trajectories, which can help to reduce the intensity of carbon emissions and achieve the “30·60” dual-carbon goal.
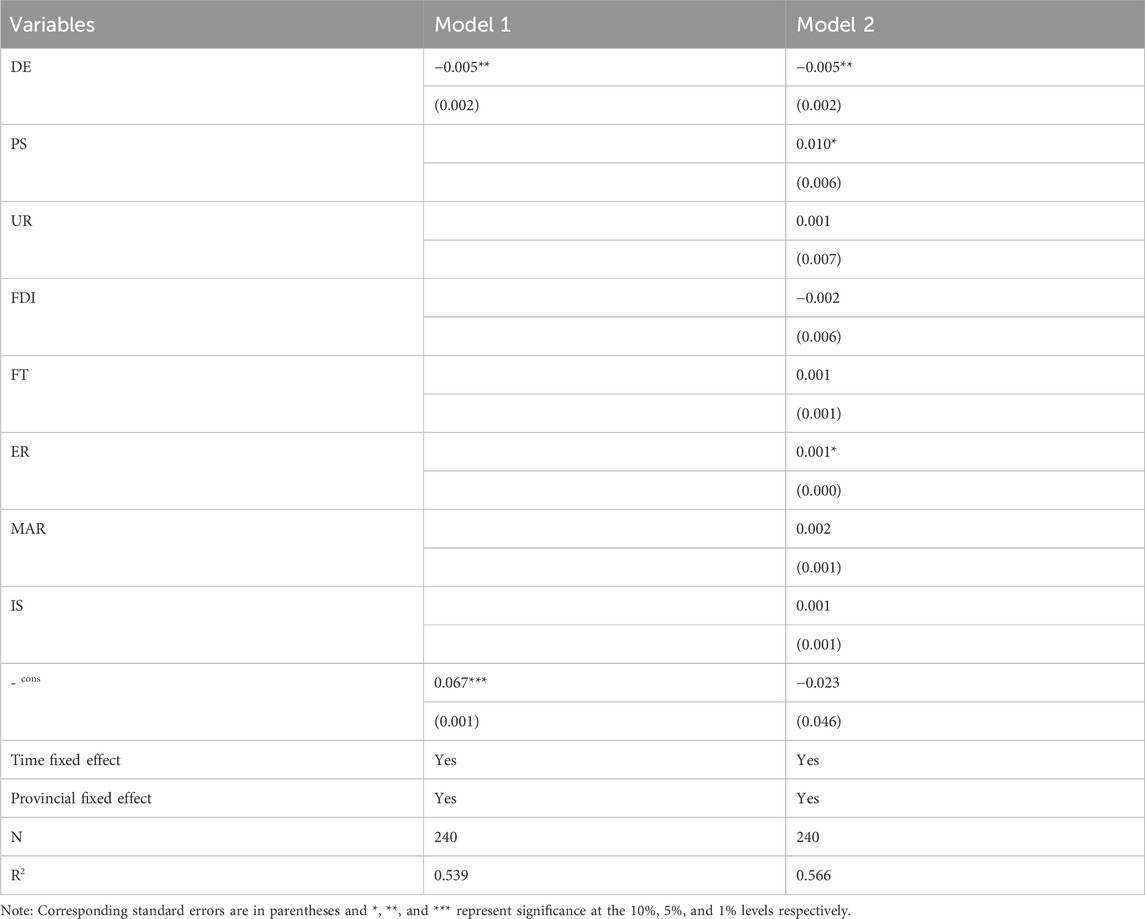
Table 1. Baseline regression results.
From the perspective of control variables, only the coefficients of population size and environmental regulation are statistically significant. Among them, the coefficient of population size is significantly positive, indicating that population size will significantly exacerbate the intensity of carbon emissions, mainly because the expansion of population size will cause an increase in the demand for energy, and then lead to an growth in the consumption of fossil energy, and ultimately contribute to the increase of carbon dioxide; as the environmental regulation index selected in this paper is a composite index of three major pollutants, the larger the value of the environmental regulation, which indicates that the higher the degree of pollution, and the regression results of the environmental regulation is significantly positive, indicating that the more serious environmental pollution, the carbon emissions, which is mainly due to carbon emissions and industrial pollution emissions have the same root and the same source of nature, such as coal, oil and other fossil fuels in the combustion process, not only produces carbon dioxide, but also produces sulfur dioxide and soot and other pollutants.
5.2 Robustness test
5.2.1 Substitution of explanatory variables
Considering the difference in the level of economic development of each region, carbon emission intensity is used to measure the level of regional carbon emissions. At the same time, there are also large differences in the population size of each region, so this paper uses per capita carbon emissions to replace carbon emission intensity for robustness testing. The regression results are shown in Table 2, Models 1 and 2, the estimated coefficient for the digital economy remains statistically significant and negative across all model specifications, irrespective of the inclusion of control variables. Suggesting that digital economic development reduces per capita carbon emissions, and that there is a significant negative correlation between digital economic development and carbon emission intensity, this is generally consistent with the results of the baseline regression, and robustness test passed.
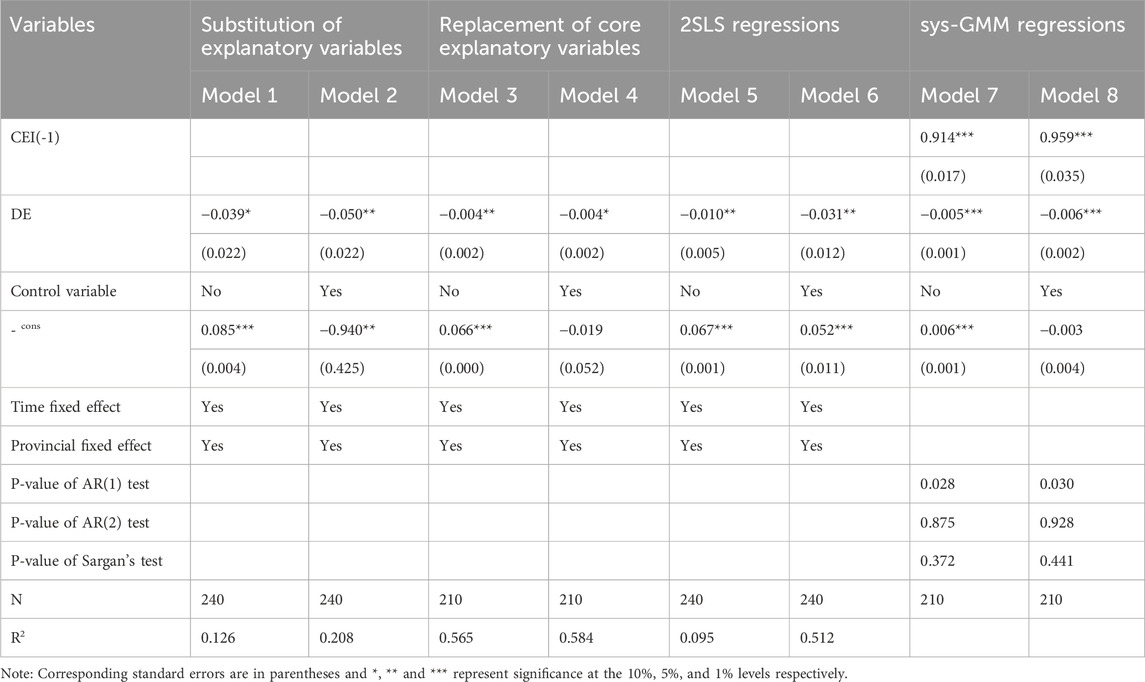
Table 2. Robustness test.
5.2.2 Replacement of core explanatory variables
As an authoritative commercial organization with in-depth research on macroeconomic indices, Caixin Think Tank, in conjunction with Numerical Union, publishes the digital economy development index every month, which consists of the digital economy industry index, digital economy integration index, digital economy spillover index, and digital economy infrastructure index (Zhang and Xu, 2024). It can reflect the development of the digital economy in various regions of China more comprehensively, and a lot of scholars have already used this data to research the digital economy. Model 3 and Model 4 in Table 2 report the regression results with the Caixin Think Tank digital economy index as the core explanatory variables, and it can be seen that the coefficient of digital economy is significantly negative, which confirms the robustness of the baseline regression conclusions.
5.2.3 Endogenous processing
To avoid the endogenous problems caused by two-way causality and some unobtrusive factors, this paper will adopt the instrumental variable method for endogenous testing. Referring to Ivus et al.'s study, this paper chooses the Relief Degree of Land Surface (RDLS) as an instrumental variable for the digital economy. On the one hand, RDLS can be used to reflect the complexity of the local terrain, which affects the installation and commissioning of digital infrastructure. Generally speaking, the greater the RDLS, the greater the cost and difficulty of the construction of digital infrastructure, and therefore RDLS meets the relevance conditions as an instrumental variable (Huang Q. H. et al., 2019). On the other hand, as a natural factor, RDLS is not directly related to other economic variables, so it meets the condition of exogenous as an instrumental variable. In addition, considering that RDLS is a constant that does not change over time, 2SLS regressions were conducted using the product of RDLS and the dummy variable for each year as an instrumental variable set, following the practice of Duflo et al. and Eddie Ji et al.
Model 5 and Model 6 in Table 2 report the instrumental variables regression results in detail, and the impact of the digital economy on carbon intensity is significantly negative regardless of whether control variables are added or not, indicating that the basic conclusions are still robust after considering endogeneity issues. Meanwhile, the Kleibergen-Paap rk LM statistic is 21.817, corresponding to a P-value of 0, indicating that there is no under-identification problem; the value of Cragg-Donald Wald F is 22.8, which is larger than the empirical value of 10 for the relevant instrumental variable proposed by Staiger et al. the empirical results demonstrating the absence of weak instrument concerns, and confirm the validity of the selected instrumental variables in our analysis.
5.2.4 Dynamic panel regression
Static panel was used to examine the impact of digital economy development on regional carbon emissions and to ensure the robustness of the conclusions, the dynamic panel model was further used in this paper to check the robustness of the baseline regression, and the sys-GMM method was selected for the regression considering that sys-GMM introduces level equations and reduces the estimation error relative to dif-GMM. From the regression results of Model 7 and Model 8 in Table 2, it can be seen that the P-value of AR(2) test is greater than 0.1, indicating that there is no second-order autocorrelation in the difference of the perturbation term of the regression equations, and at the same time, the P-value of Sargan’s test is greater than 0.1, indicating that the instrumental variables are valid, and the regression results of the sys-GMM once again confirm the robustness of the baseline regression.
5.2.5 Analysis of regional emissions heterogeneity
According to the baseline regression results, the growth of the digital economy generally helps to lower the intensity of carbon emissions in a given region. However, is this effect consistent across different regions? In order to do this, the following subregional regression analysis was carried out in this article. Table 3 below demonstrates that the digital economy only significantly reduces carbon emissions in the central and western areas. In comparison to eastern coastal regions, central and western China exhibit noticeably higher levels of carbon emissions, according to a cross-regional analysis. Compared to the eastern region, the middle and western regions usually show worse energy usage efficiency, slower economic development, and a greater reliance on traditional resources. Conversely, the ongoing digital transformation, facilitated by widespread adoption of digital technologies, enables market participants to more accurately monitor energy market dynamics and price fluctuations, thereby enhancing the allocative efficiency of energy resources across regional economies. Furthermore, the utilization of digital technology aids industrial businesses in lowering carbon emissions, increasing energy efficiency, and decreasing energy intensity. According to the empirical findings, the central and western areas have a stronger latecomer’s advantage in the process of achieving the “30·60” dual-carbon target, and the digital economy’s impact on reducing carbon emissions has a greater marginal utility on these regions.
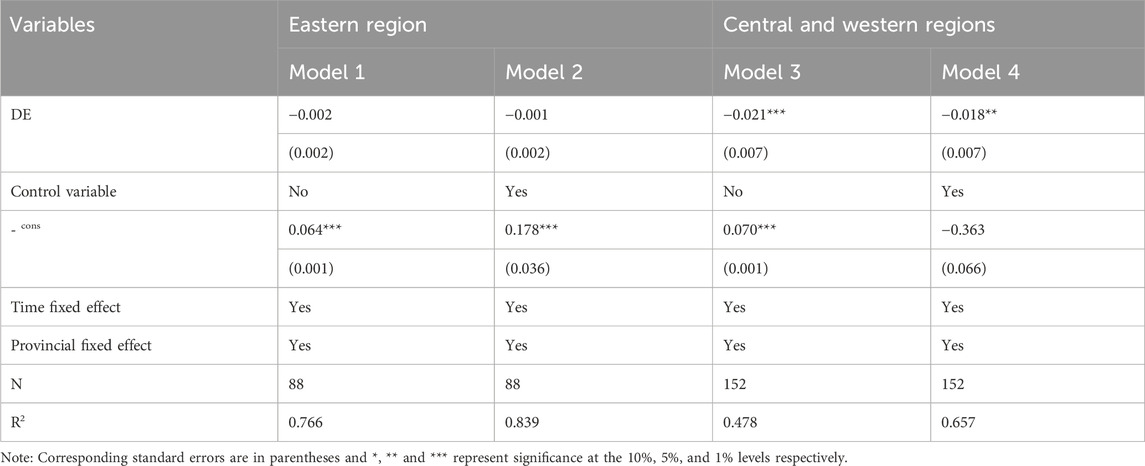
Table 3. Subregional regression results.
To further distinguish whether there are differences in the impact of digital economy development on carbon emissions when regional carbon emission levels are different, and considering that quantile regression has the advantage of eliminating the interference of extreme values and comprehensively portraying the conditional distributions, five representative quantile points corresponding to regions with different levels of carbon emissions are selected, 10%, 25%, 50%, 75% and 90%, to investigate the heterogeneous impact of the digital economy on the regional carbon emission levels. The results of quantile regression are shown in Table 4 below, through which it can be seen that when the quantile point is lower than 50%, the absolute value of the regression coefficient of the digital economy affecting carbon emissions gradually increases with the increase of the quantile point, but it is not significant. When the quantile point exceeds 50%, the absolute value of the regression coefficient of the digital economy increases, and it is significant at least at the 5% level. It can be seen that the development of the digital economy does not have a significant inhibiting effect on regions with low carbon emission intensity but has a significant carbon reduction effect on regions with high carbon emission intensity, which is consistent with the results of the previous sub-regional regression.
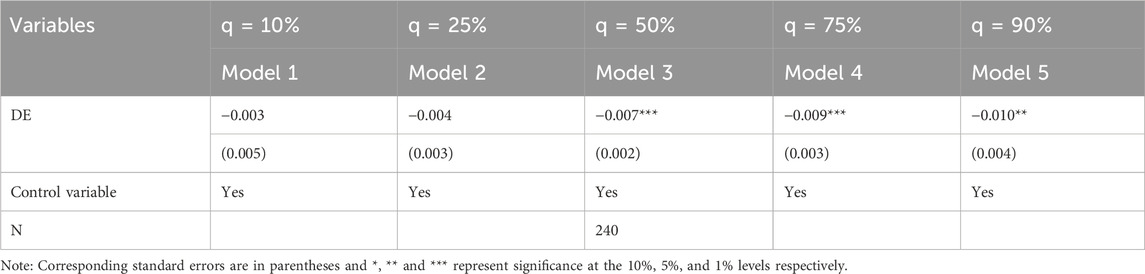
Table 4. Quantile regression results.
6 Countermeasures for carbon emission reduction of chemical industry enterprises
6.1 From the perspective of industrial enterprise
6.1.1 Developing low-carbon strategies to accelerate low-carbon transformation of enterprises
In an environment where the contradiction between economic development and ecological environment is becoming more and more prominent, the implementation of the concept of low-carbon green development can effectively alleviate the intensification of contradictions. Low-carbon development path is based on the ecological industry chain as a carrier, with clean production as the main means. Power, metallurgy, petrochemicals and other heavy industries account for a high proportion of Zhenjiang’s industries, and accelerating the carbon emission reduction of these enterprises is conducive to promoting the early peak of industrial carbon emissions, to make room for the carbon emissions of other industries. This requires industrial enterprises to gradually change the traditional extensive production methods, formulate scientific and reasonable low-carbon strategies, and accelerate the low-carbon transformation of enterprises. Specific reference can be made to the following steps: to begin with, conduct energy efficiency and emission assessment to identify risks and opportunities, carbon audits of key industries led by the government to establish carbon emission inventories of enterprises. Then, this is followed by the setting of phased emission reduction targets and the implementation of incentives such as environmental tax reductions for companies that meet the targets, making them operational and linking them to business strategies. Furthermore, carbon emission reduction program assessment, through which ways and technologies to reduce emissions, considering the promotion of intelligent energy management, green hydrogen substitution and other low-carbon technologies, and provide equipment investment subsidies. Next, carbon emission reduction financing will be conducted to analyze what kind of financing means can effectively support the realization of carbon emission reduction targets. Finally, internal and external synergies, where actions related to the carbon reduction strategy are carried out from the periphery to the core of the business.
6.1.2 Increase investment in research and development to enrich the supply of low-carbon technologies
Advanced low-carbon technologies are key to the development of low-carbon economy. Japan, for example, has the world’s most advanced greenhouse gas measurement technologies, new low-carbon material manufacturing technologies, renewable energy manufacturing technologies, and green energy storage technologies, so its low-carbon level is already at the forefront of the world. In 2010, the United Nations Development Programme (UNDP) released the “China Human Development Report In 2010, Toward a Sustainable Future with a Low-Carbon Economy and Society,” which stated that China needs at least 60 types of backbone technologies to realize the goal of a low-carbon economy in the future. Of more than 60 technologies, 42 of them are not core technologies that China currently possesses. This means that 70% of China’s core technologies for emissions reduction need to be “imported”. The vast majority of these key technologies are difficult to obtain for free from foreign countries through the compulsory licensing system, which means that China will have to pay high licensing fees for “low carbon technologies”. Chen et al. (2010) also suggest that after the “peak per capita carbon emissions to total carbon emissions peak stage” and the “stable decline in total carbon emissions stage” carbon emission reduction technology will play an important role or even an absolute role. And with the in-depth implementation of the low-carbon concept, low-carbon products will also cater to the market (Chen et al., 2010). Therefore, enterprises can not only realize energy saving and emission reduction by strengthening the research and development of low-carbon technologies but also seize market opportunities to promote the upgrading and transformation of enterprises.
6.1.3 Formation of innovation alliances and implementation of enterprise collaborative innovation
Scientific and technological innovation is one of the important factors for industrial low-carbon development, and it can shorten the research and development cycle by setting up technological innovation synergy centers to strengthen cooperation on major key technologies. Although the environment of science and technology innovation for Zhenjiang’s economic development has been continuously optimized, due to the mismatch of target structure, technology route and resource integration, the collaborative innovation ability among enterprises is weak, and there is no high-efficiency technological innovation alliance. Low-carbon key technologies are still mainly developed by a few large enterprises, which has a weak driving effect on small and medium-sized enterprises, which is not conducive to further carbon emission reduction in industry. From the empirical results, it can also be found that the development degree of carbon emission reduction among industrial sectors is high, but the coordination level is generally not high, and a phenomenon of “high development - low coordination” appears. Enterprises should actively look for key common technologies and points of convergence of interests, gradually establish a talent and expert pool, set up technology research and development cooperation alliances, and implement collaborative innovation. Take advantage of the annual Zhenjiang International Low Carbon Conference to build more technical cooperation platforms. At the same time, strengthen the industry-university-research cooperation with universities and scientific research institutes in Nanjing, Zhenjiang and Yangzhou, and cohesion of innovation resources from all sides through the establishment of new research and development institutions, joint laboratories, and other forms.
6.2 From the perspective of government
6.2.1 Phase out backward coal-consuming production capacity and optimize industrial structure
A reasonable industrial structure will effectively reduce the pressure on carbon emission reduction and promote the transformation of high energy-consuming industries to low energy-consuming industries within the industry. At present, Zhenjiang’s industrial sector is characterized by small-scale enterprises and low-level products. From the type of enterprise, high pollution, high emission and low-efficiency enterprises still exist, small and medium-sized industrial enterprises are relatively lagging in the development of low-carbon recycling. From the type of industry, traditional industries need to be upgraded and transformed, and the scale of strategic emerging industries needs to be expanded. Against the corresponding industrial planning and combined with the law of industrial development, the two ways of shutting down and upgrading are adopted to encourage enterprises to eliminate backward production capacity and increase the supply of low-carbon products. Gradually shut down the current heavy chemical projects that are more polluting, and accelerate the promotion of traditional high-energy-consuming and high-emission industries such as chemical, paper, electric power, metal smelting, and so on to carry out in-depth coal-saving transformation. At the same time, the government needs to strictly control the entry threshold of projects, and curb new backward production capacity and excess capacity projects. For excess capacity to make full use of market mechanisms to speed up the dissolution. Combined with the situation of Zhenjiang city situation and industrial foundation, focus on the development of advanced equipment manufacturing industry represented by “shipbuilding offshore support, automobile manufacturing and support, aerospace three major industries”, and ultimately build up an industrial structure with high technological content, low consumption of resources and less environmental pollution, reduce the pressure of industrial economic development on the carbon peak target, and realize the decoupling of industrial development and carbon emissions.
6.2.2 Development of productive services to improve the quality of the industrial economy
Industrial scale expansion is the only factor that raises industrial carbon emissions, and it is also a factor that has the greatest impact on industrial carbon emissions. Against the background of improving the quality and efficiency of the economy, the traditional development mode of simple and rough expansion of the industrial economy should be changed, the overall scale of the industry should be appropriately controlled, and the productive service industry should be actively developed. The level of development of the productive service industry reflects the supporting service capacity of regional industries, and relevant studies also show that with the deepening of synergistic development and integration of industrial chains, the degree of dependence between the productive service industry and the industrial industry will also be strengthened. Advanced production concepts, talents and technologies will be embedded in industrial production through productive service industry, and the industrial sector will continue to move towards the high-end value chain. In terms of energy utilization, it is manifested in the improvement of energy utilization efficiency and the acceleration of the substitution of new energy resources for traditional fossil energy, which is ultimately reflected in the reduction of carbon emissions. Therefore, the development of the productive service industry can not only optimize the overall industrial structure, but also control the rough expansion of the industrial scale, and achieve industrial quality and efficiency and industrial carbon emission reduction.
6.2.3 Enactment of incentive legislation to upgrade industrial technology
The high level of industrial technology is one of the important factors affecting carbon emissions. By upgrading the level of industrial technology, the energy consumption and carbon emission intensity per unit of output can be effectively reduced. The government, as a third party, and the behavior is mandatory, the promulgation of regulations is more effective, and government incentives and regulations to promote the adoption of digital technology to achieve sustainable development of the chemical industry can be proposed. Specifically: first, the establishment of special funds for chemical digital transformation, 40% transformation subsidies for enterprises applying industrial Internet, digital twin, AI optimization control and other technologies; second, the implementation of the “digital carbon reduction” tax incentives for enterprises that achieve energy efficiency improvement of more than 15% through digital means, VAT will be given a 50% discount; third, the establishment of the “Digital Carbon Reduction” tax incentives for enterprises that achieve energy efficiency improvement of more than 15% through digital means, VAT will be given a 50% discount. The second is to implement the “digital carbon reduction” tax incentives to enterprises that achieve energy efficiency improvement of more than 15% through digital means, and provide them with VAT rebates of 50%; the third is to establish a digital supervision platform in chemical parks, and force key enterprises to connect to real-time emission monitoring systems; the fourth is to implement the “Digital Carbon Account” system, which links the effectiveness of enterprises’ digital emission reduction to the allocation of carbon quotas; and the fifth is to set up the Chemical Industry Digital Technology Innovation Center, which focuses on breaking through process simulation and optimization, intelligent safety and early warning and other key technologies.
6.3 Other countermeasures
6.3.1 Strengthening digital infrastructure
The construction of the digital economy can help reduce the intensity of carbon emissions, and in addition to bringing about the economic effects mentioned in previous classic literature, the digital economy can also bring environmental dividends to China and enhance social welfare by reducing the intensity of carbon emissions and mitigating climate change. This provides new support for accelerating the construction of a strong network country and a strong digital country in the new period, so China should further strengthen the construction of digital infrastructure and accelerate the integration of the real economy with the digital economy, so as to provide a feasible path for realizing the “30·60” dual-carbon goal.
6.3.2 Appropriate bias towards digital resources
Fully consider the regional heterogeneity characteristics of the digital economy affecting carbon emission intensity, and realize the overall environmental climate improvement. Our empirical findings demonstrate a pronounced decarbonization effect from digital transformation in China’s interior provinces, where each unit increase in digital adoption yields greater marginal emission reductions compared to eastern coastal areas. It demonstrates that despite having higher carbon emission intensities, the central and western regions have a stronger latecomer advantage in the environmental dividend brought about by the digital economy because their digital foundations are more archaic. Additionally, if digital resources are oriented appropriately toward the central and western regions, they can achieve “corner overtaking” on environmental issues, which will enable them to achieve the Pareto and improve the climate overall.
6.3.3 Emphasizing the integration of traditional industries with the digital economy
The inhibitory effect of “industrial digitization” on carbon emission intensity is not yet obvious, indicating that the integration of traditional industries with digital industries still has a great deal of room for improvement. Alongside the incorporation of digital technologies into conventional production systems to enhance operational efficiency, particular emphasis should be placed on advancing the innovation and deployment of environmentally sustainable technologies. And give full play to the leading role of low-carbon industries, so as to promote the transformation of the industry as a whole to intelligent and low-carbon.
6.3.4 Realizing the deep integration of the energy and digital revolutions
Additionally, enhance the energy mix through digital transformation. Within energy consumption systems, leverage advanced technologies—including big data analytics, cloud computing, and IoT—to revolutionize consumption patterns and boost energy efficiency. By adopting data-driven energy management frameworks, traditional industrial and service-sector consumers can transition from passive energy users to proactive producer-consumers. This shift reduces reliance on conventional energy sources, refines consumption architectures, and accelerates decarbonization initiatives.
6.4 Research shortcomings and outlook
6.4.1 Inadequate research
There are many types of industrial enterprises, and the reduction of carbon emissions is complicated, due to the realistic conditions, the research content of this paper is still insufficient, the following two aspects need to be improved:
Firstly, at the data level, the number of industrial enterprises is quite diverse, and it is difficult to select the samples; and it is difficult to obtain the data at the enterprise level, and there is a long lag period. Therefore, the study in this paper mainly relies on macro data at the city level, which may be difficult to capture the heterogeneous characteristics of enterprises at the micro level, and it is difficult to accurately quantify the contribution of specific digital technologies, such as MES systems, smart meters, etc., to carbon emission reduction. Secondly, this paper may not have fully considered the impact of the external environment, such as the strength of inter-regional policy implementation and the degree of marketization, on the emission reduction of industrial enterprises. Therefore, the digital economy to promote carbon emission reduction in industrial enterprises needs to be analyzed in a comprehensive and systematic way to strip the external environmental impact as much as possible.
6.4.2 Research outlook
First, at the level of data and methodology, future research should be committed to obtaining more comprehensive and detailed enterprise-level data, such as the level of enterprise digital technology application, energy consumption structure, carbon emission data, etc., in order to more accurately quantify the contribution of digital technology to carbon emission reduction, and at the same time, case study analysis methods can be introduced to verify the micro mechanism of the macro conclusions. Second, in terms of model construction, more variables can be introduced or more advanced measurement methods, such as spatial measurement models, can be used to reflect more comprehensively the mechanism of digital economy’s impact on carbon emission reduction. In particular, external environmental factors such as the strength of policy implementation and the degree of marketization can be considered to be included in the model analysis to more accurately assess the carbon emission reduction effect of the digital economy. Finally, future research can also focus on the differentiated impacts of the digital economy in different industries and regions, in order to deeply analyze the heterogeneous mechanism of the carbon emission reduction effect of the digital economy, for example, comparing the technological diffusion efficiency, policy response speed and industrial structure differences between the central and western regions and the eastern regions, and proposing regional synergistic emission reduction strategies, as well as exploring the differentiated impacts of the digital economy on chemical industry segments in sub-sectors, so as to provide the basis for the precise application of policies and to formulate more targeted carbon emission reduction strategies. Different impacts of the digital economy are disscussesed on chemical industry segments by industry, providing a scientific basis for the precise application of policies and for the formulation of more targeted carbon emission reduction policies.
Data availability statement
The original contributions presented in the study are included in the article/supplementary material, further inquiries can be directed to the corresponding author.
Author contributions
RG: Writing – review and editing, Methodology, Writing – original draft, Data curation, Visualization. TN: Resources, Conceptualization, Writing – review and editing, Writing – original draft, Supervision. QZ: Funding acquisition, Writing – original draft, Validation, Writing – review and editing. YZ: Visualization, Writing – review and editing. BY: Writing – review and editing, Validation. QM: Writing – review and editing, Software.
Funding
The author(s) declare that financial support was received for the research and/or publication of this article. This research was funded by the 2024 Ningbo Soft Science Research Program “Domestic and International Practices of Attracting Social Funds to Invest in Basic Research and Implications for the City” (2024R017), the Advanced Humanities and Social Sciences Cultivation Project in Ningbo University in 2022 (Pro-phase Project of Cultivation) “Research on Synergistic Effect of Reducing Pollution and Carbon (XPYQ22001)” and the 2023 “Social Science Empowerment Action” special project of Zhejiang Province’s social science planning (“Research Results of Social Science Empowerment of High Quality Development Action in Mountain (Island) Counties”) “Research on the Mechanism and Integration Path of Digital Economy Empowering the High Quality Development of Zhejiang’s Mountain Economy”.
Conflict of interest
The authors declare that the research was conducted in the absence of any commercial or financial relationships that could be construed as a potential conflict of interest.
Generative AI statement
The author(s) declare that no Generative AI was used in the creation of this manuscript.
Publisher’s note
All claims expressed in this article are solely those of the authors and do not necessarily represent those of their affiliated organizations, or those of the publisher, the editors and the reviewers. Any product that may be evaluated in this article, or claim that may be made by its manufacturer, is not guaranteed or endorsed by the publisher.
References
Alves, M. R., and Moutinho, V. (2013). Decomposition analysis and Innovative Accounting Approach for energy-related CO2 (carbon dioxide) emissions intensity over 1996-2009 in Portugal. Energy 57, 775–787. doi:10.1016/j.energy.2013.05.036
An, T. L., and Yang, C. (2020). How the Internet is reshaping China's economic geography: micro mechanism and macro effects. Econ. Res. J. 55 (02), 4–19.
Bhattacharyya, S. C., and Matsumura, W. (2010). Changes in the GHG emission intensity in EU-15: lessons from a decomposition analysis. Energy 35 (8), 3315–3322. doi:10.1016/j.energy.2010.04.017
Chen, B. L., and Xu, M. P. (2018). Analysis of influence factors of carbon emissions in China: an empirical study by STIRPAT-alasso model using panel data. Ecol. Econ. 34 (01), 20–24+48.
Chen, S. F., Liu, Y., Zou, X. P., Su, L. Y., and Ru, X. J. (2010). A theoretical and empirical study on driving forces of carbon dioxide emissions evolution. Sci. Manag. Res. 28 (01), 43–48. doi:10.19445/j.cnki.15-1103/g3.2010.01.011
Chen, Z. M., Wu, S. M., Ma, W. B., Liu, X. M., Cai, B. F., Liu, J. W., et al. (2018). Driving forces of carbon dioxide emission for China's cities: empirical analysis based on extended STIRPAT Model. China Popul. Resour. Environ. 28 (10), 45–54.
Dong, B., Zhang, M., Mu, H., and Su, X. (2016). Study on decoupling analysis between energy consumption and economic growth in Liaoning Province. Energy Policy 97, 414–420. doi:10.1016/j.enpol.2016.07.054
Guo, J. T., and Luo, P. L. (2016). Does the Internet promote China's total factor productivity? J. Manag. World (10), 34–49.
Guo, F., Wang, J. Y., Wang, F., Kong, T., Zhang, X., and Cheng, Z. Y. (2020). Measuring the development of China’s digital inclusive finance in China: index compilation and spatial characteristics. Economics 19 (4), 1401–1418. doi:10.13821/j.cnki.ceq.2020.03.12
Han, X. F., Song, W. F., and Li, B. X. (2019). Can the Internet become a new momentum to improve the efficiency of regional innovation in China 2019, (07), 119–136. doi:10.19581/j.cnki.ciejournal.2019.07.007
Herry, C., Mas, H., and Norbert, S. (2003). Decoupling economic growth and transport demand case study Austria. Paris: OECD.
Hong, Y. X. (2018). Efficiency of resource allocation and high quality of supply system. Jianghai Acad. J. (05), 84–91.
Huang, H. Q., Yu, Y. Z., and Zhang, S. L. (2019a). Internet development and productivity growth in manufacturing industry: internal mechanism and China experiences. China Ind. Econ. (08), 5–23. doi:10.19581/j.cnki.ciejournal.2019.08.001
Huang, Q. H., Yu, Y. Z., and Zhang, S. L. (2019b). Internet development and manufacturing productivity improvement: internal mechanism and Chinese experience. China’s ind. Econ. (08), 5–23. doi:10.19581/j.cnki.ciejournal.2019.08.001
Huang, R., Wang, Z., Ding, G. Q., Gong, Y. R., and Liu, C. X. (2016). Trend prediction and analysis of influencing factors of carbon emissions from energy consumption in Jiangsu province based on STIRPAT model. Geogr. Res. 35 (04), 781–789.
Jiang, X. T., Wang, Q., and Li, R. (2018). Investigating factors affecting carbon emission in China and the USA: a perspective of stratified heterogeneity. J. Clean. Prod. 199, 85–92. doi:10.1016/j.jclepro.2018.07.160
Jing, W. J., and Sun, B. W. (2019). Digital economy promotes high-quality economic development: a theoretical analysis framework. Economist (02), 66–73. doi:10.16158/j.cnki.51-1312/f.2019.02.008
Li, Z. M., Yao, Y., and Qing, D. R. (2010). Study on the decoupling relationship between industrial development, GDP growth and carbon dioxide emissions. Statistics and Decis. (11), 108–111.
Liu, J., Yang, Y. J., and Zhang, S. F. (2020). Research on the measurement and driving factors of China’s digital economy. Shanghai J. Econ. (06), 81–96. doi:10.19626/j.cnki.cn31-1163/f.2020.06.008
Lu, N., Qu, F. T., Feng, S. Y., and Shao, X. L. (2011). Trends and determining factors of energy consumption carbon footprint —an analysis for suzhou-wuxi-changzhou region based on STIRPAT model. J. Nat. Resour. 26 (05), 814–824.
Lu, W. B., Qiu, T. T., and Du, L. (2013). A study on influence factors of carbon emissions under different economic growth stages in China. Econ. Res. J. 48 (04), 106–118.
Luo, M., and Li, L. Y. (2015). Business model innovation in the Internet Age: a Value creation perspective. China Ind. Econ. (01), 95–107.
Mo, X. Y., Shi, Y., and Li, B. Q. (2025). Summary of carbon emission calculation methods. Liaoning Chem. 54 (03), 480–483. doi:10.14029/j.cnki.issn1004-0935.2025.03.022
Ning, Y., Zhang, B., Ding, T., and Zhang, M. (2017). Analysis of regional decoupling relationship between energy-related CO2 emission and economic growth in China. Nat. Hazards 87, 867–883. doi:10.1007/s11069-017-2798-2
Qian, Z. W., and Yu, J. L. (2018). The decoupling effect of economic growth and CO2 emissions in“Six provinces and one City”of east China. Econ. Manag. 32 (01), 54–59.
Tan, Z., Li, L., Wang, J., and Wang, J. (2011). Examining the driving forces for improving China’s CO2 emission intensity using the decomposing method. Appl. Energy 88 (12), 4496–4504. doi:10.1016/j.apenergy.2011.05.042
Tapio, P. (2005). Towards a theory of decoupling: degrees of decoupling in the EU and the case of road traffic in Finland between 1970 and 2001. Transp. policy 12 (2), 137–151. doi:10.1016/j.tranpol.2005.01.001
Wan, Y. Y. (2011). Preliminary study on low carbonization of industrial structure in China. Honghua University of Science and Technology.
Wang, C., Chen, J., and Zou, J. (2005). Decomposition of energy-related CO2 emission in China: 1957–2000. Energy 30 (1), 73–83. doi:10.1016/j.energy.2004.04.002
Wang, Q., Wu, S. D., and Li, T. T. (2010). Relational analysis between energy consumption and C emission of industry sector and their Tapio effect during the period of economic transition in China. J. Fujian Normal Univ. Soc. Sci. Ed. (04), 17–22.
Wang, Z., and Yang, L. (2015). Delinking indicators on regional industry development and carbon emissions: Beijing–Tianjin–Hebei economic band case. Ecol. Indic. 48, 41–48. doi:10.1016/j.ecolind.2014.07.035
Wu, Y., Zhu, Q., and Zhu, B. (2018). Decoupling analysis of world economic growth and CO2 emissions: a study comparing developed and developing countries. J. Clean. Prod. 190, 94–103. doi:10.1016/j.jclepro.2018.04.139
Yu, Y. G., Li, Q., Bao, Y. Z., Fu, E. S., Chen, Y. T., and Ni, T. H. (2024). Research on the measurement and influencing factors of carbon emissions in the swine industry from the perspective of the industry chain. Sustainability 16 (5), 2199. doi:10.3390/su16052199
Yu, Y. G., Xu, Z. Z., and Li, Y. T. (2022a). Spatial differentiation and dynamic evolution of environmental efficiency in wheat planting in China. Sustainability 14 (9), 5241. doi:10.3390/su14095241
Yu, Y. G., Xu, Z. Z., Shen, P. Y., Zhang, L. N., and Ni, T. H. (2022b). Efficiency evaluation and influencing factors of green innovation in Chinese resource-based cities: based on SBM-undesirable and spatial durbin model. Int. J. Environ. Res. Public Health 19 (21), 13772. doi:10.3390/ijerph192113772
Yue, L., and Li, F. (2011). Empirical analysis of the Tapio decoupling of western provincial economic growth and carbon dioxide with Gansu province as a case. J. Beijing Inst. Technol. Sci. Ed. 13 (02), 19–22. doi:10.15918/j.jbitss1009-3370.2011.02.004
Zhang, L. F. (2013). Research of carbon emissions influence factors in Beijing based on varying parameters model. Resour. Dev. and Mark. 29 (12), 1247–1250.
Zhang, X., Wan, G. H., Zhang, J. J., and He, Z. Y. (2019). Digital economy, financial inclusion, and inclusive growth. Econ. Res. J. 54 (08), 71–86. doi:10.19602/j.chinaeconomist.2020.05.07
Zhang, Y., Zhang, L. Q., and Bao, T. T. (2014). Research on the influential factors of carbon emissions in the process of urbanization in Anhui Province——based on STIRPAT Model. Resour. Environ. Yangtze Basin 23 (04), 512–517.
Zhang, Y. F., and Xu, X. C. (2024). Research on digital economy related index and index system. Financial trade Econ. 45 (04), 5–19. doi:10.19795/j.cnki.cn11-1166/f.20240418.001
Zhang, Y. G. (2010). Economic development pattern change impact on China's carbon intensity. Econ. Res. J. 45 (04), 120–133.
Zhao, T., Zhang, Z., and Liang, S. K. (2020). Digital economy, entrepreneurial activity, and high-quality development: empirical evidence from Chinese cities. Manag. World 36, 65–76. doi:10.19744/j.cnki.11-1235/f.2020.0154
Keywords: digital economy, carbon emission reduction, chemical industry, internal mechanism, enhancement strategy
Citation: Gao R, Ni T, Zhang Q, Zhou Y, Yang B and Mao Q (2025) Internal mechanism and enhancement strategy of chemical industry carbon emission reduction promoted by the development of digital economy. Front. Environ. Sci. 13:1615002. doi: 10.3389/fenvs.2025.1615002
Received: 20 April 2025; Accepted: 19 May 2025;
Published: 04 June 2025.
Edited by:
Riccardo Boero, Norwegian Institute for Air Research, NorwayReviewed by:
Ismail Suardi Wekke, Institut Agama Islam Negeri Sorong, IndonesiaUbair Nisar, United Arab Emirates University, United Arab Emirates
Copyright © 2025 Gao, Ni, Zhang, Zhou, Yang and Mao. This is an open-access article distributed under the terms of the Creative Commons Attribution License (CC BY). The use, distribution or reproduction in other forums is permitted, provided the original author(s) and the copyright owner(s) are credited and that the original publication in this journal is cited, in accordance with accepted academic practice. No use, distribution or reproduction is permitted which does not comply with these terms.
*Correspondence: Qin Zhang, emhhbmdxaW5AbmJ1LmVkdS5jbg==
†These authors have contributed equally to this work and share first authorship