 Bei Ji1
 Lei Ding
- 1 Party Organization Department, Ningbo Polytechnic University, Ningbo, China
- 2 International Office, Ningbo Polytechnic University, Ningbo, China
- 3 Scientific Research Office, Ningbo Polytechnic University, Ningbo, China
Introduction: The scientific measurement of urban atmospheric environmental efficiency is a vital prerequisite for achieving air pollution control and regional green high-quality development.
Methods: Based on the data of 11 cities in Zhejiang Province from 2014 to 2022, this study calculates the synergistic governance environmental efficiency (SGEE) of PM2.5 and O3 from both static and dynamic perspectives. Furthermore, a quantile regression model (QRM) is employed to reveal the impact mechanisms of educational investment and technological innovation on the efficiency.
Results: The results show that: (1) there are significant spatio-temporal variations in the concentrations of PM2.5 and O3 among the 11 cities. The effectiveness of coordinated governance is not significant. (2) The average value of SGEE of PM2.5 and O3 in Zhejiang Province is 0.533. Technological advancement is the primary driving force behind the improvement of the SGEE of PM2.5 and O3. (3) The results of QRM indicate that educational investment primarily improves the SGEE of PM2.5 and O3 at lowefficiency stages, while it exerts a certain resource “Crowding-out effect” at highefficiency stages.In contrast, the rise in the level of technological innovation and the transformation and adjustment of industrial structure can effectively promote the improvement of the SGEE of PM2.5 and O3.
Discussion: In the future, it need strengthen the role of technological innovation in improving the SGEE of PM2.5 and O3.
1 Introduction
Continuous improving air quality and promoting high-quality economic development are key measures in the fight for blue skies (Li et al., 2024). With the strong push for the battle against air pollution, the environmental air quality in China has shown a steady upward trend. Initial results have been achieved in the synergistic control of PM2.5 and ozone (O3) (Kong et al., 2024). In 2024, the PM2.5 concentration in cities at the prefecture level and above nationwide is expected to be 29.3 μg/m3, a year-on-year decrease of 2.7%; compared to 2019, the national PM2.5 concentration has decreased by 19.4%. O3 concentration has decreased by 2.7% and has remained stable at 144–145 μg/m3 for three consecutive years. Since 2015, the rising trend of ozone has been initially curbed (Yang J. et al., 2025; Yang Z. et al., 2025). Therefore, adhering to precise, scientific, and law-based pollution control, and emphasizing environmental air quality management, are of great significance for achieving high-quality green transformation and development (Wang H. et al., 2025; Shao et al., 2025).
Environmental efficiency characterizes the environmental performance level of production units through the ratio of economic output to environmental impact (Zadmirzaei et al., 2024; Paramati et al., 2022; Song et al., 2012). Atmospheric environmental efficiency (AEE) represents a further deepening and expansion of environmental efficiency in the field of atmospheric environments, which can effectively reflect the comprehensive management level of the atmospheric environment and embody the efficiency of transforming resource input into economic value while managing atmospheric pollution emissions (Fang et al., 2023; Huang et al., 2021).
As the prevention and control of air pollution in China has received widespread attention from society these years, numerous scholars have conducted research on the measurement and evaluation of AEE (Ren et al., 2023; Miao et al., 2019a), specifically including: (1) Indicators for measuring AEE: One category uses inputs such as labor, capital, energy, and land, with GDP as the output indicators and the amount of air pollutant emissions as the undesirable output or input indicators (Fang et al., 2023; Lu et al., 2019; Ding et al., 2019). The other category uses indicators such as the number of pollution control facilities and operational costs as inputs, and the removal rate or amount of air pollutants as output indicators, which are commonly referred to as atmospheric pollution control efficiency (Zhou et al., 2023; Wu et al., 2020; Yang and Li, 2018). The first category takes into account both economic development and environmental governance, providing a more comprehensive reflection of the overall performance in air pollution control (Sueyoshi and Yuan, 2015; Wu et al., 2021). However, the selected indicators for air pollutant emissions or concentrations often rely on traditional metrics such as SO2, NOx, PM10, and the rate of good air quality (Wu et al., 2021; Lu et al., 2019; Wang et al., 2017), while lacking efficiency measurements for newer air pollution control targets such as PM2.5, O3, and VOCs. (2) Measurement methods for AEE: Data Envelopment Analysis (DEA) has been widely applied in the measurement of AEE due to its advantages in handling multiple input and output indicators (Zhou et al., 2023; Song et al., 2012). In terms of specific model construction, existing literature has employed various DEA models, including the traditional DEA model, non-radial directional distance function DEA model (Wang et al., 2017), weighted DEA (Ye and Wang, 2019), dynamic network SBM model (Rashid et al., 2024; Fu et al., 2024), Super-efficiency SBM model (Xu et al., 2024; He et al., 2018), two-stage DEA (Guo et al., 2020) and three-stage slack based measure-data envelopment analysis (SBM-DEA) model (Li et al., 2025; Zhang et al., 2024). Additionally, techniques such as the Malmquist index (Ma et al., 2021), Luenberger index (Miao et al., 2019b), and Global Malmquist-Luenberger index have been used to analyze the dynamic changes in AEE (Lu et al., 2019). (3) Socio-economic factors influencing AEE: These factors mainly include the level of economic development, population density, environmental regulations, industrial structure, technological level, degree of openness, urbanization level, and the level of digital economy development (Fang et al., 2023; Miao et al., 2019b; Li et al., 2019). The analysis models used are primarily based on ordinary least squares (OLS) regression models, lacking detailed comparative analysis of the varying degrees of influence among the different explanatory variables (Liu H. et al., 2022). Meanwhile, the selected indicators did not take into account potential impacts of variables such as educational investment on pollution control. Existing studies have pointed out that education could achieve ecological benefits not only by improving production methods and technological levels but also by promoting ecological protection and cultivating environmental awareness during the basic education phase (Liu K. et al., 2022; Žalėnienė and Pereira, 2021). It, in turn, could change people’s consumption concepts and lifestyles, thereby reducing resource consumption and protecting the air environment (Uralovich et al., 2023). However, an increase in educational investment also lead to a resource “Crowding-out effect” on environmental governance investment to some extent, which could be detrimental to the short-term guarantee of air pollution control (Tao et al., 2022; Underdal, 2010).
In summary, while existing research has made many valuable explorations regarding AEE, there are still several shortcomings. Firstly, most studies use a single pollutant indicator as an undesirable output, without adequately considering the impacts of synergistic control of comprehensive and compound air pollutants (such as PM2.5 and O3). Secondly, the existing literature mainly focuses on static dimensional efficiency and lacks studies that comprehensively measure AEE from both static and dynamic dual dimensions, as well as from a long-term and broad spatial perspective. Lastly, there is a lack of comprehensive examination of the socio-economic influencing factors related to AEE, particularly regarding educational investment and technological innovation at different levels.
Given that PM2.5 and O3 pollution is influenced by various intersecting factors such as natural conditions, economic development, and political factors, scientifically evaluating AEE has become a key measure for improving regional air quality (Mo et al., 2024; Zhou et al., 2023). Therefore, this study focuses on Zhejiang Province, a developed coastal economic region in eastern China. It uses the annual average concentrations of PM2.5 and O3 as undesirable outputs and employs a Slacks-Based Measure (SBM)-Undesirable DEA model that accounts for undesirable outputs to measure urban AEE from 2014 to 2022. Then, a Quantile Regression model (QRM) is used to comprehensively reveal the mechanisms of how educational investment and technological innovation impact AEE, and it proposes governance strategies and recommendations. It aims to provide evidence and decision-making references for the synergistic governance of PM2.5 and O3 in rapidly urbanizing areas.
2 Methodology
2.1 Study area
The study area is selected as Zhejiang Province because it is a typical economically developed province in the southeast coastal region of China, and it represents an area facing dual pressures of economic transformation towards green development and environmental governance. In addition, it is also one of the key areas in China for air pollution prevention and control (Fang et al., 2023; Zhang et al., 2023; Lu et al., 2019).
The air quality in Zhejiang Province has improved to some extent (as shown in Table 1) in recent years. For instance, SO2 and NO2 have reached the national first-level standard for ambient air quality, while PM10 has met the national second-level standard (Xia et al., 2020). However, the ongoing improvement of air quality across the province has become increasingly challenging. The concentration of PM2.5 remains relatively high and shows some signs of rebound, especially during the spring and winter seasons. Meanwhile, the Hangzhou Bay area (including Hangzhou, Huzhou, Jiaxing, and Shaoxing) has a high proportion of days with O3 exceeding the standard, making it the primary pollutant affecting the improvement of urban ambient air quality (Ding et al., 2024). Thus, focusing on the two pollutants, PM2.5 and O3, can provide a more accurate assessment of the urban air pollution situation. Besides, existing studies that use conventional pollutants such as SO2, NO2, and PM10 for measuring and assessing AEE cannot accurately reflect the current environmental quality status and lead to an overestimation of the efficiency values. It highlights the need to scientifically the regional atmospheric environmental efficiency by constructing a new indicator for undesirable outputs (PM2.5 and O3).
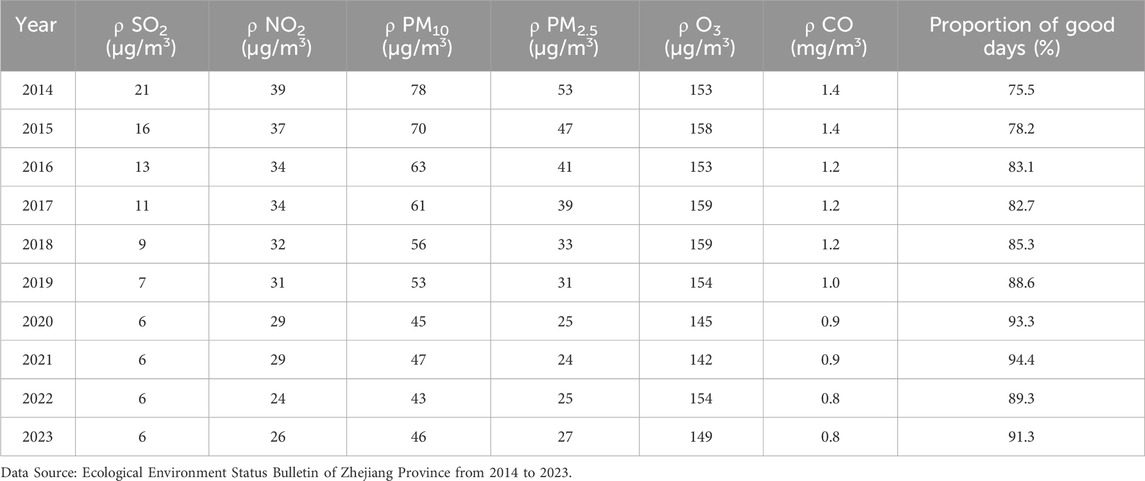
Table 1. Air pollution status in Zhejiang province from 2014 to 2023.
2.2 Data sources
This study employs labor, capital, and energy as input indicators, regional Gross Domestic Product (GDP) as the output indicators (Fang et al., 2023; Lu et al., 2019), and PM2.5 and O3 annual average concentrations as undesirable outputs to construct an evaluation system for the synergistic governance environmental efficiency (SGEE) of PM2.5 and O3 in Zhejiang Province (Table 2). The aim is to achieve economic development and improve the quality of PM2.5 and O3 while decreasing the input of production factors per unit simultaneously. The above indicators are all sourced from the Zhejiang Statistical Yearbook and the Zhejiang Natural Resources and Environment Statistical Yearbook for the years 2015–2023, with individual missing data filled in by linear interpolation (Fang et al., 2023). To eliminate the deviation of economic indicators caused by the influence of inflation, the GDP value we have taken here has been inflation-adjusted. The undesirable outputs are the annual average PM2.5 concentration values and annual average O3 concentrations (the 90th percentile of the maximum 8-h average O3 daily concentration in each city) expressed for each city (Ding et al., 2024).
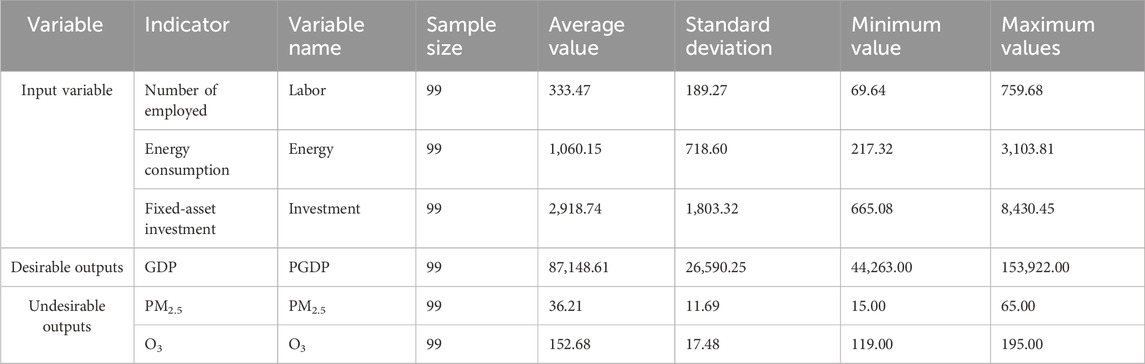
Table 2. Descriptive statistics of variables from 2000 to 2020 in Zhejiang Province.
The descriptive statistics for each variable are shown in Table 2.
2.3 Methods and models
2.3.1 Nemerov integrated pollution index
To comprehensively assess the pollution levels of PM2.5 and O3 in different cities, the Nemero integrated pollution (NIP) index method is introduced for evaluation (Ciarkowska and Gambus, 2020). This index is one of the most common-used methods for calculating comprehensive pollution indices both domestically and internationally. It particularly takes into account the factors with the most severe pollution and avoids the influence of subjective factors in the weighting process (Świdwa-Urbańska and Batlle-Sales, 2021). The specific calculation formula (Equations 1, 2) is as follows:
In the formula: P i is the single-factor pollution index of air pollutant i; C i is the measured concentration value of i; S i is the standard limit concentration value of air quality. According to the China Ambient Air Quality Standards (GB3095-2012), the secondary standard limits for PM2.5 and O3 are 35 μg/m3 and 160 μg/m3 respectively. NIP is the Nemero integrated pollution index, which means the higher the value, the greater the integrated pollution, the worse the synergistic management of PM2.5 and O3; P imax is the maximum value of the pollution index of air pollutant i; P iave is the arithmetic mean value of each air pollution index.
2.3.2 Undesirable output SBM-DEA model
2.3.2.1 SBM-DEA model
In this study, the Slacks-Based Measure (SBM)-Undesirable DEA model was employed to assess the SGEE of PM2.5 and O3. The SBM model, constructed by Tone (2001), is a non-radial and non-angular DEA model. In the standard DEA model, radial requires that inputs or outputs move in the same proportion when evaluating efficiency, while oriented requires that modeling choices based on inputs (assuming outputs are constant) or outputs (assuming inputs are constant) be made when evaluating efficiency (Lu et al., 2019; Banker et al., 2004). The SBM model measures efficiency based on slack variables, overcomes the radial and oriented problems of classical DEA and facilitates the measurement of final results (Zhang et al., 2024; Lee, 2021; Deng et al., 2016).
Here,
Among them,
Equation 3 satisfies the assumption of constant returns to scale (CRS), and if constraints
When
2.3.2.2 Malmquist index based on SBM model
The Malmquist index is essentially the ratio of two distance function values and it is a theoretical index (Zheng, 2021). This research evaluates the Malmquist index using the Malmquist productivity index developed by Färe et al. (1992), which is based on input orientation and operates under the assumption of constant returns to scale (CRS):
Where,
When
Färe et al. (1994), based on the decomposition method by Färe et al. (1992), derived different efficiency values using VRS and CRS. It further decomposed the efficiency change (EC) from Färe et al. (1992) decomposition method into pure technical efficiency change (PEC) and scale efficiency change (SEC).
Among them,
2.3.3 Quantile regression model
To quantitatively study the influencing factors of AEE, and combined with existing relevant research (Lu et al., 2019; Ding et al., 2019), this study selected the following independent variables: education investment (EI, measured by fiscal education spending), scientific and technological innovation (STI, measured by R&D expenditure), industrial structure (IS, measured by the proportion of secondary industrial output value to GDP), and environmental regulation (ER, measured by the operating expenses of industrial waste gas treatment facilities in the current year, in ten thousand yuan). To reduce the deviation caused by different dimensions of explanatory variables, logarithmic processing was carried out to improve the interpretation accuracy of the model (Fang et al., 2023; Ding et al., 2024). Furthermore, based on the most common and fundamental estimation method in ordinary linear regression model—the Ordinary Least Squares (OLS) method—the following regression equation (Equation 6) has been constructed (Liu H. et al., 2022):
In the above equation: Y represents the SGEE of PM2.5 and O3; i denotes the 11 cities within the sample; t indicates the time variable (9 years); β 1 ∼β 4 represents the impact coefficients of various factors on the SGEE of PM2.5 and O3; α is the city fixed effect; and ε it is the random error term, which follows the normal distribution assumption, and it represents the changed parts of the dependent variable that cannot be explained by the independent variables.
However, ordinary linear regression only obtain the expected value of the impact of various influencing factors on AEE and cannot analyze the effect of these factors on the distribution pattern of AEE (Wang, 2024). Quantile regression model (QRM) analysis more comprehensively describe the impact of independent variables on the changes in the dependent variable and its conditional distribution (Huang et al., 2017). It can profoundly reveal the marginal effects of influencing factors on AEE in different cities and delve into the quantile heterogeneity of these effects. When estimating parameters, the heterogeneity analysis of quantile methods uses the explained variable as a reference and specifies several different quantile points (Chou et al., 2020). It groups the sample points according to these quantile points and applies different weights to the sample points in different groups during estimation, thereby obtaining the estimated values. This method of exploring the quantile heterogeneity of influencing factors does not rely on reducing the sample size and takes into account the information from the entire sample, resulting in more robust outcomes (Veeravel et al., 2024; Ozkan et al., 2024).
Koenker and Hallock (2001) first proposed the theory of QRM, which involved a detailed study of significant quantiles in the distribution of Y|X to analyze and compare the effects of independent variables on the dependent variable at different quantile points. When the dependent variable is influenced differently by various portions of the independent variable distribution, such as exhibiting left or right skewness, QRM capture the tail features of the distribution, providing a more comprehensive characterization of its properties. For a random variable Y in general, the linear conditional quantile function (Equation 7) for the τ-th quantile is given by Chou et al. (2020):
For any τ
Finally, this study takes static SGEE of PM2.5 and O3 as the dependent variable and uses a QRM to reveal the key influencing factors at different levels of static SGEE of PM2.5 and O3. The calculation formula (Equation 9) is as follows:
In the above formula: q represents the selected quantiles, which are 10%, 25%, 50%, 75%, and 90%; β 1,q ∼ β 4,q indicates the impact effect of various factors on the SGEE of PM2.5 and O3 at different level quantiles (Wang, 2024). i denotes the 11 cities within the sample; t indicates the time variable (9 years); ε it,q is the random error term, which follows the normal distribution assumption.
3 Results
3.1 Overall pollution characteristics of PM2.5 and O3
3.1.1 Spatial-temporal distribution of PM2.5 and O3 concentrations
Based on Arcgis 10.0 software, the spatial-temporal distribution characteristics of PM2.5 and O3 concentrations in 11 cities of Zhejiang Province are revealed. For comparison, the distribution status of pollutant concentrations in four cross-sectional time periods from 2014–2017-2020–2022 are selected for specific analysis. The results are shown in Figures 1, 2.
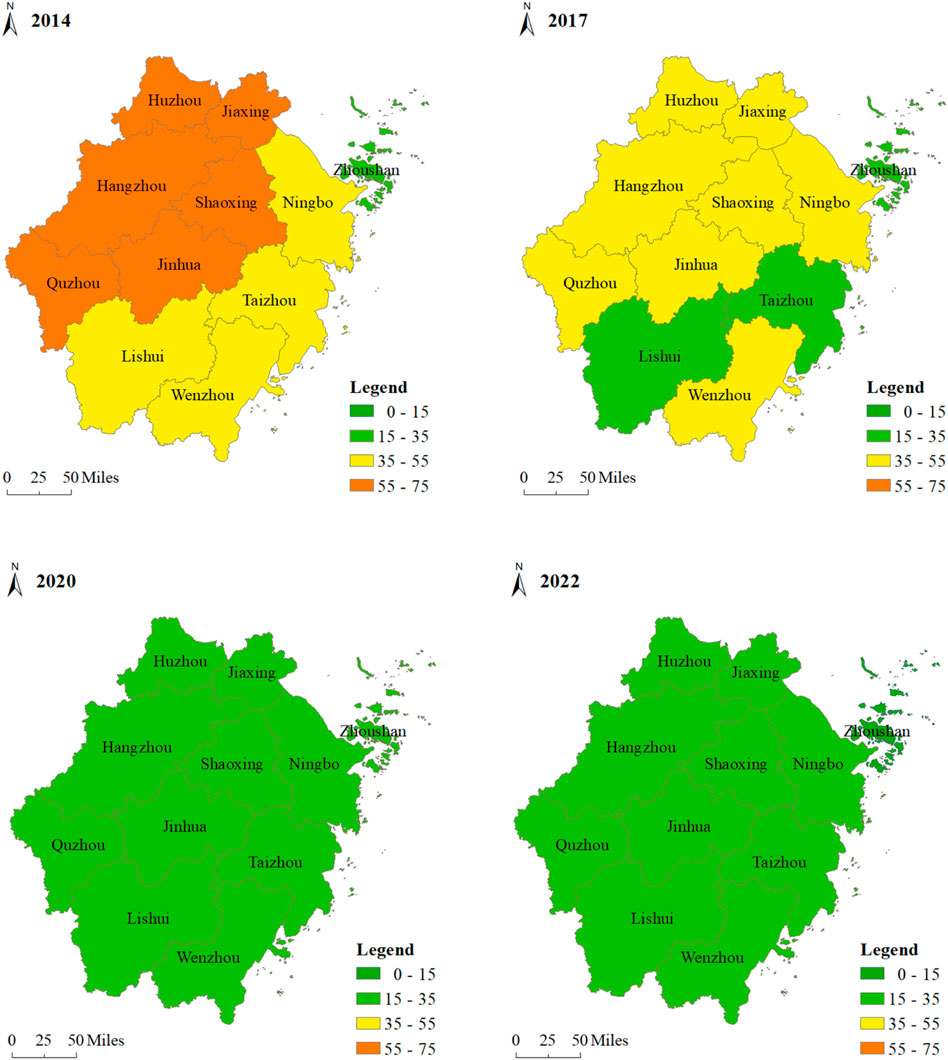
Figure 1. Spatial and temporal distribution characteristics of PM2.5 concentration in 11 cities in Zhejiang Province, 2014–2022.
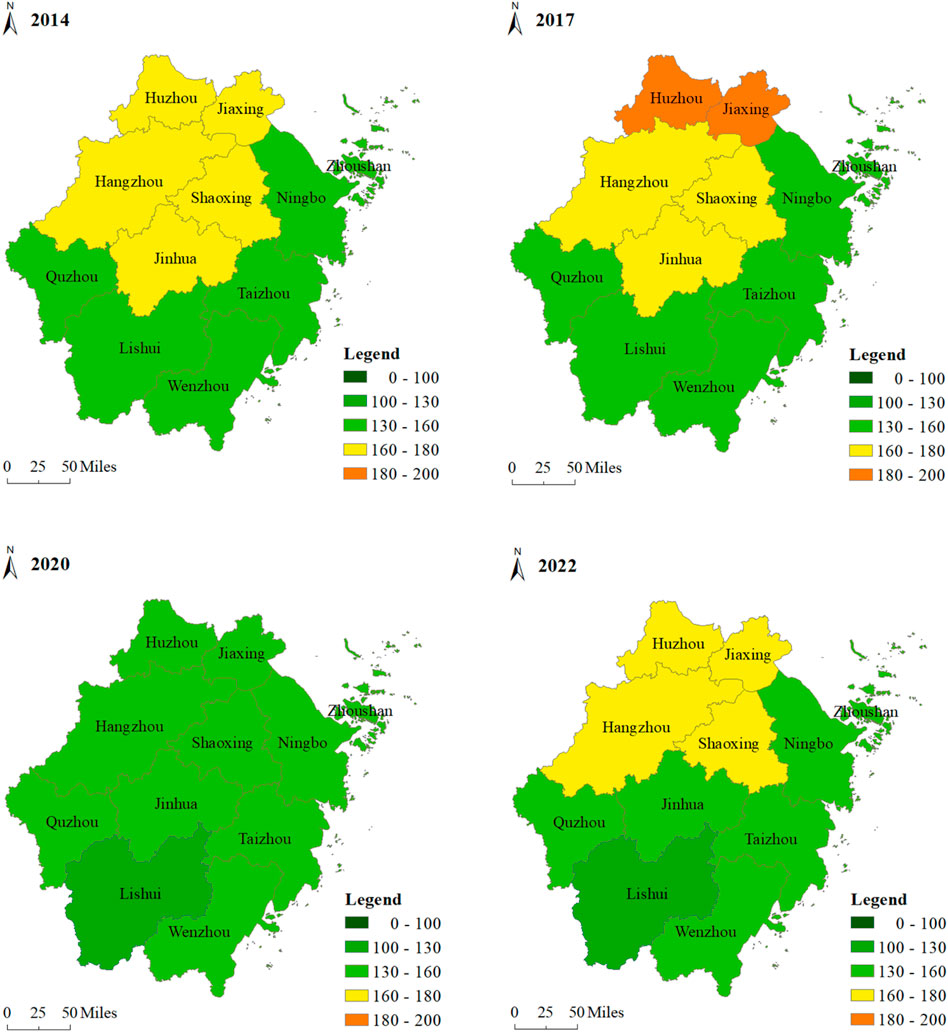
Figure 2. Spatial and temporal distribution characteristics of O3 concentration in 11 cities in Zhejiang Province, 2014–2022.
Comparing Figures 1, 2, it can be found that, (1) there were significant time-series variation differences in PM2.5 and O3 concentrations in 11 cities in Zhejiang Province, with PM2.5 generally more polluted before 2017 and O3 generally more severe after 2017. In particular, PM2.5 concentrations showed a steady improvement trend, while O3 concentrations showed multiple fluctuations, with pollution first increasing, then decreasing and improving, and finally rebounding and worsening. It has been shown that O3 is the primary pollutant in the air environment of Zhejiang Province in recent years (Ding et al., 2024), especially in the summer when the temperature is high. (2) There were some spatial distribution differences of PM2.5 and O3 concentrations in 11 cities in Zhejiang Province. In terms of the average PM2.5 concentration in the past years, Hangzhou > Shaoxing > Huzhou > Jinhua > Jiaxing > Quzhou > Wenzhou > Ningbo > Taizhou > Lishui > Zhoushan. Sorting from the average O3 concentration in the past years, Huzhou > Jiaxing > Hangzhou > Shaoxing > Jinhua > Ningbo > Quzhou > Taizhou > Wenzhou > Zhoushan > Lishui. Cities with more severe pollution of both are mainly located in the cities around Hangzhou Bay in the north-central part of Zhejiang, such as Huzhou, Jiaxing, Hangzhou and Shaoxing, which are also the key cities in the Yangtze River Delta region for the prevention and control of air pollution. Cities with relatively mild pollution levels are mainly located in Zhoushan and Lishui, characterized by relatively backward industrial output, minimal anthropogenic pollution emissions, and favorable natural conditions. (3) Generally, Zhejiang Province has not yet achieved significant synergistic management of PM2.5 and O3. In the future, how to efficiently promote the stable reduction of PM2.5 and O3 remains a tough task (Shu et al., 2024).
3.1.2 Comprehensive evaluation of PM2.5 and O3 pollution
Based on the above mentioned NIP index calculation, an evaluation of the comprehensive status of PM2.5 and O3 pollution in 11 cities of Zhejiang Province was conducted, with the results shown in Figure 3.
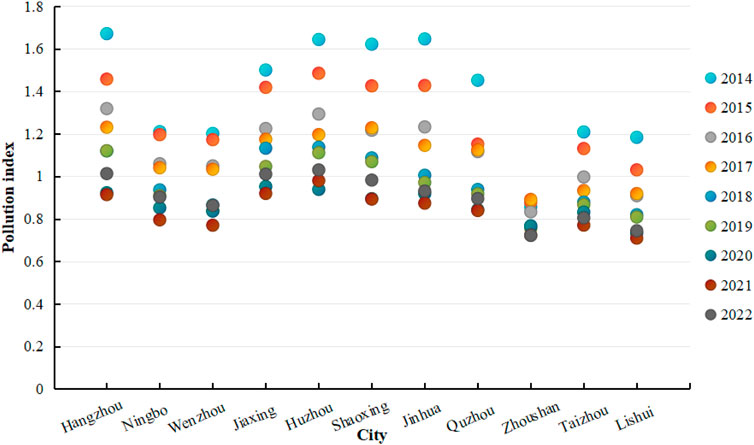
Figure 3. Analysis of NIP index of PM2.5 and O3 pollution in Zhejiang Province from 2014 to 2022.
From the above Figure 3, it can be seen that (1) the NIP values in various cities showed a significant downward trend, indicating that the comprehensive pollution status of PM2.5 and O3 in these cities has improved to some extent. Among them, the cities with relatively lighter comprehensive pollution are mainly coastal cities such as Zhoushan, Ningbo, and Wenzhou. (2) The NIP values of various cities exhibited certain regional disparities. Based on the average NIP values over the years, the ranking is as follows: Huzhou > Hangzhou > Jiaxing > Shaoxing > Jinhua > Quzhou > Ningbo > Wenzhou > Taizhou > Lishui > Zhoushan. Cities in northern and central Zhejiang have significantly higher NIP values compared to those in the southeastern part. The former has a relatively higher concentration of air pollution-intensive industries (Ding and Fang, 2022), and their meteorological and topographical conditions are less favorable for pollutant dispersion compared to the coastal cities in the southeast. (3) In 2022, the NIP values of various cities showed a certain rebound, indicating that there were considerable challenges in the coordinated management of PM2.5 and O3. In particular, affected by adverse meteorological conditions and precursor pollution emissions, it is necessary to actively prevent the rebound of PM2.5 and O3 pollution concentrations (Wang L. et al., 2025).
3.2 Estimation results of SGEE of PM2.5 and O3
3.2.1 Analysis of static SGEE of PM2.5 and O3
Through the non-radial measurement SBM-DEA model, the SGEE of PM2.5 and O3 in 11 prefecture-level cities in Zhejiang Province was estimated based on the aforementioned Equation 3, and the results are shown in Table 3.
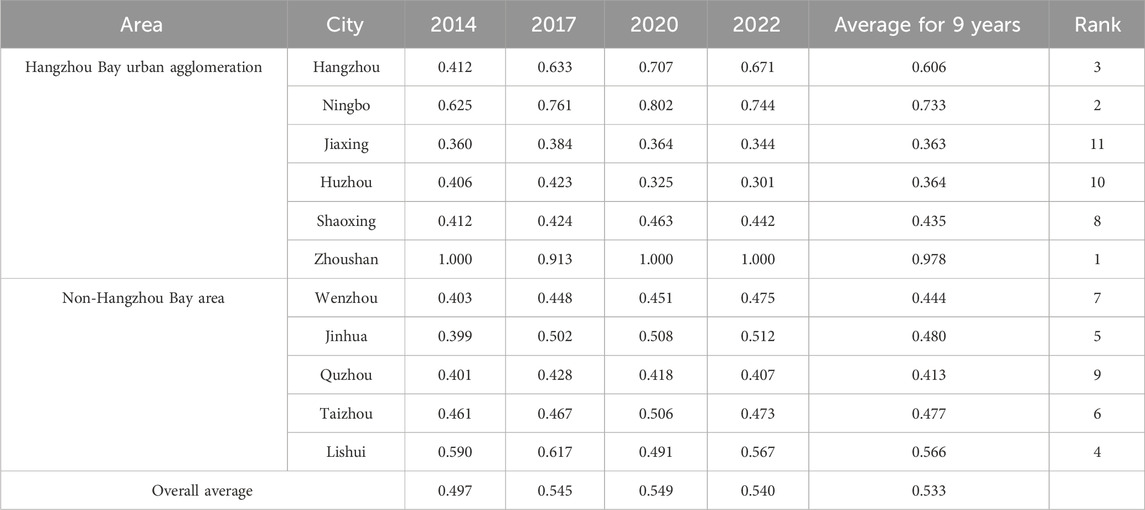
Table 3. The static estimation results of SGEE of PM2.5 and O3 in 11 cities in Zhejiang Province from 2014 to 2022.
From the above Table 3, it can be seen that during the 9 years, the average value of the overall SGEE of PM2.5 and O3 of the 11 cities in Zhejiang Province was 0.533, which was still about 46.7% of the improvement margin from the production frontier (the maximum output level that can be achieved with a given input), and a large potential for PM2.5 and O3 environmental improvement existed.
In terms of SGEE of PM2.5 and O3 in each city, the static efficiency values showed a fluctuating increasing trend. Among them, only Zhoushan City achieved the production frontier in 7 years, while the remaining 10 cities have not reached the synergistic emission reduction technology level of PM2.5 and O3 compared to the leading cities. It implies that the vast majority still have significant potential for improving SGEE of PM2.5 and O3, indicating regional differences in SGEE of PM2.5 and O3 among different cities. From the average environmental efficiency values of the 9-year period in each city, the ranking is as follows: Zhoushan > Ningbo > Hangzhou > Lishui > Jinhua > Taizhou > Wenzhou > Shaoxing > Quzhou > Huzhou > Jiaxing. The ranking indicates similarities with the city ranking based on PM2.5 environmental efficiency in previous study (Fang et al., 2023).
Over different years, the ranking of SGEE of PM2.5 and O3 have varied across different cities. The cities with higher SGEE of PM2.5 and O3 are mainly Zhoushan, Ningbo, and Hangzhou, which are important regions leading the development of science and technology and emerging industries in Zhejiang Province. Since the 13th Five-Year Plan, relying on huge investment in education and technological innovation, especially the role of new research and development institutions in the process of enterprises’ green transformation, Ningbo and Hangzhou have strengthened the digital management transformation and end-of-pipe control of key polluting industries (Lu et al., 2019; Ding and Fang, 2022; Ding et al., 2024), effectively reducing emissions of atmospheric pollutants such as NOx and particulate matter. It has accelerated the treatment of volatile organic compounds (VOCs) and improved the SGEE of PM2.5 and O3. As an international island tourism city, Zhoushan has its unique characteristics of being green and low-pollution in terms of industrial policy positioning. In recent years, around technological innovations such as green new materials and digital marine industries, Zhoushan has continued to perform significantly in the control of air pollution sources, thus having the highest SGEE value. Cities with low SGEE of PM2.5 and O3 include Jiaxing, Huzhou, Quzhou, and Shaoxing. It means that in the future, the area around Hangzhou Bay will continue to be a key region for the coordinated control of PM2.5 and O3 in Zhejiang Province, including preventing the rebound of PM2.5 and O3 concentrations (Wang H. et al., 2025).
3.2.2 Analysis of dynamic SGEE of PM2.5 and O3
To further clarify the dynamic evolution process of the SGEE of PM2.5 and O3 in various cities in Zhejiang Province, a non-radial DEA model with the Malmquist index (Zofio, 2007) was employed. Based on Equations 4, 5, the total factor productivity (TFP) of each city was measured (Lu et al., 2019; Ding et al., 2019), decomposed into three components: pure technical efficiency change (PEC), scale efficiency change (SEC), and technological progress index (TC), as shown in Figure 4.
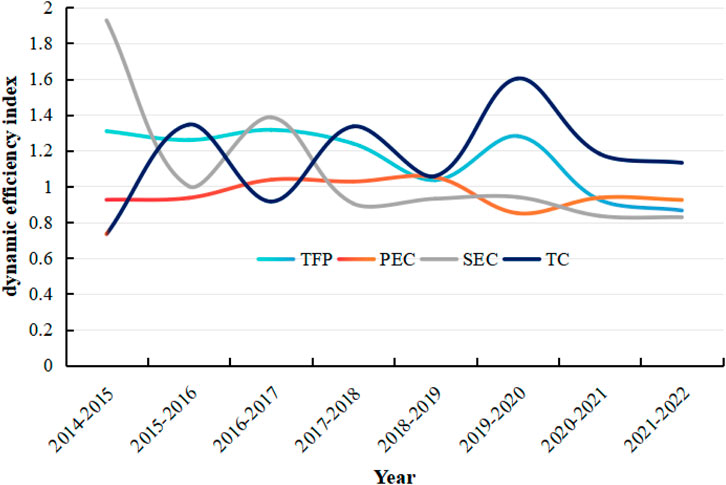
Figure 4. Changes in total factor productivity and decomposition indicators of dynamic SGEE of PM2.5 and O3 in Zhejiang Province.
From a provincial perspective, the average TFP of the SGEE of PM2.5 and O3 in Zhejiang Province from 2014 to 2022 was 1.153, indicating an annual average growth of 15.3% in the overall SGEE of PM2.5 and O3. It suggests a clear improvement trend in the relationship between atmospheric PM2.5 and O3 coordinated control and regional economic development in Zhejiang Province.
From the results of the index decomposition, the average value of the PEC is 0.961 and shows a slightly decreasing trend in general, which means that the PEC is an important factor inhibiting the improvement of environmental productivity in the synergistic management of PM2.5 and O3 in Zhejiang Province.
The average value of SEC is 1.094 and shows a decreasing trend, which implies that enterprise scale expansion contributes to the increase of economic efficiency. Relying on the current digital transformation of enterprises and the development of digital economy in Zhejiang Province, SEC helps to improve the efficiency of optimal allocation of resources, reduce energy consumption and pollution emissions in dimensions such as product management and transportation (Ding et al., 2019; Fang et al., 2023), and promote synergistic emission reduction of PM2.5 and VOCs, but the effect of this role is gradually weakening.
The average value of the TC is 1.163, fluctuating up and down around 1 and tending to be stable and greater than 1, with an overall average annual growth rate of 16.3%, which is higher than the average annual growth rate of the index of SCE of 9.4%.
The above indicates that technological progress represented by process innovation, equipment improvement, and upgrading of pollution control technologies is the main driving force for improving the SGEE of PM2.5 and O3 (with Hangzhou and Ningbo as typical examples). However, the contribution of pure technical efficiency characterized by soft technical conditions such as innovative management modes and optimized industrial structures has not yet been realized. Therefore, actively and effectively optimizing industrial structures (such as reducing the proportion of industries with high VOCs emissions), innovating enterprise management modes, optimizing resource allocation, and focusing on enhancing technological efficiency are key pathways for future improvements in SGEE of PM2.5 and O3 in Zhejiang.
3.3 Factors influencing the SGEE of PM2.5 and O3
3.3.1 Estimation of OLS regression model
Due to the potential correlations or multi-collinearity among the aforementioned influencing factors, this study first conducted a correlation coefficient test and Variance Inflation Factor test on the four variables mentioned above (Dormann et al., 2013). The test results indicated that the average VIF was 9.87 (<10), suggesting that there was no serious multi-collinearity, allowing all explanatory variables to be included in the regression model.
Then, employing OLS regression, the study analyzed the SGEE of PM2.5 and O3 along with four independent variables for 11 cities from 2004 to 2022. The results indicate that the model passed the diagnostic tests. The effects of EI and STI on the SGEE of PM2.5 and O3 are estimated by step-based regression (see Table 4 for details). It can be found that in the initial OLS model (M1), LnEI coefficient is positive but does not pass the significance test, and LnSTI has a significant negative impact. With the introduction of intermediary variables (M2 and M3), there is a significant negative correlation between the influence of LnIS on the SGEE of PM2.5 and O3, while other variables fail the significance test. At the same time, in the three OLS models, the goodness of fit are low, and the OLS model estimation results are generally not ideal.
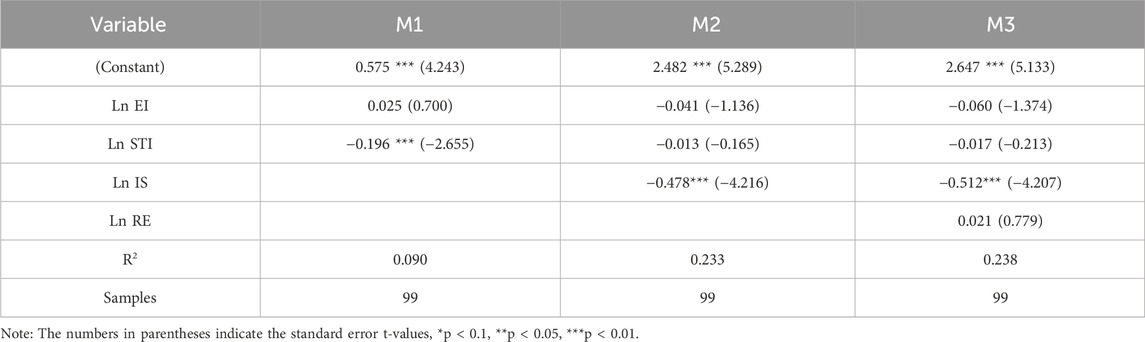
Table 4. OLS regression results of static SGEE of PM2.5 and O3 in Zhejiang Province.
3.3.2 Estimation of the QRM
Since the low goodness of fit of the OLS regression model, accurate influence judgments cannot be made based solely on the obtained regression coefficients (Cade and Noon, 2003; Wang, 2024). Therefore, it is necessary to further analyze the influence coefficient using a QRM. The results are presented in Table 5 and Figure 5.
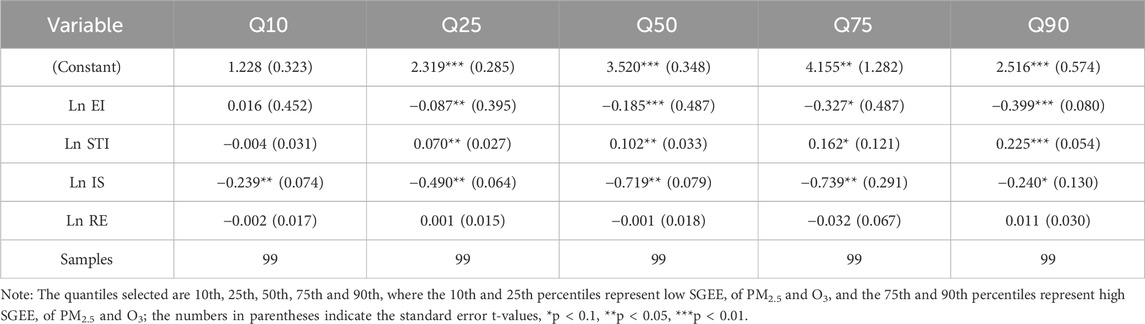
Table 5. Quantile regression estimation of the static SGEE of PM2.5 and O3 in Zhejiang Province.
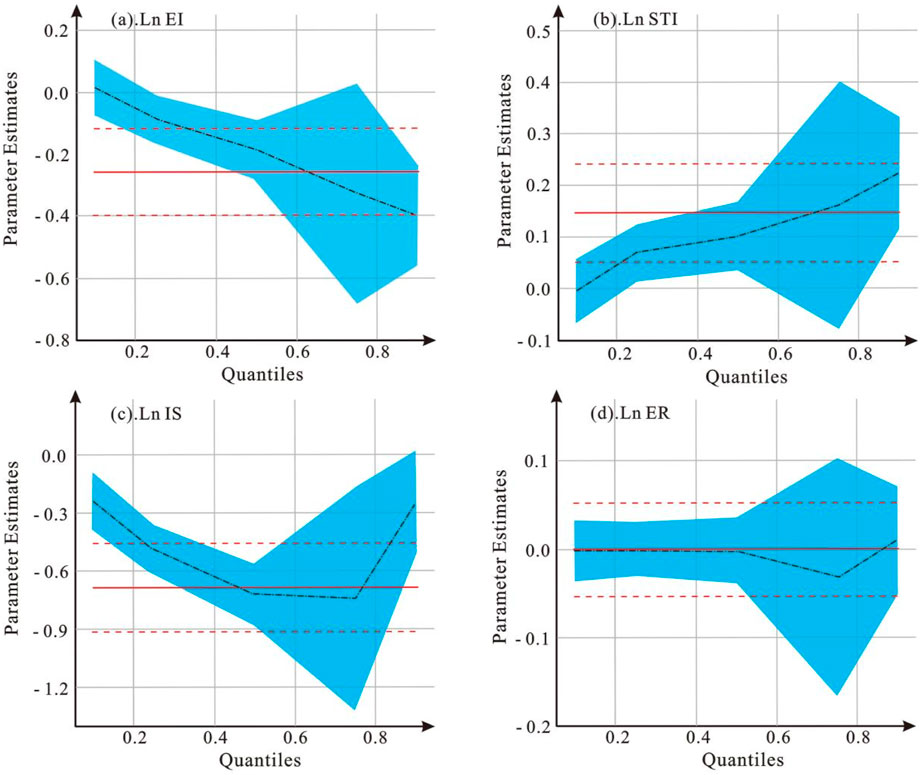
Figure 5. Dynamic trend of impact coefficients for 10∼90 quantile variables (Note: The black dashed lines represent the quantile regression estimates for each explanatory variable, the blue area indicates the 95% confidence interval for the regression coefficients, the red horizontal line in the middle represents the regression coefficients of the influencing factors in the mean regression model, and the area between the upper and lower red dashed horizontal lines represents the 95% confidence interval for the regression coefficients of the explanatory variables in the mean regression model.).
Based on the regression results, the influence coefficients of different factors show significant variation across different quantiles, specifically reflected in the following aspects:
(1) Educational investment: it shows a non-significant positive correlation before the 0.1 quantile, but a significant negative correlation after the 0.25 quantile (Figure 5a). It indicates that in regions with low SGEE of PM2.5 and O3, an increase in the level of educational investment promotes the improvement of environmental efficiency. Conversely, in regions with high SGEE of PM2.5 and O3, an increase in educational investment suppresses the improvement of environmental efficiency. Existing research has shown that green education helps to consolidate the achievements of ecological civilization construction and improve the level of environmental governance (Liu K. et al., 2022; Cheng et al., 2024). An increase in educational investment could, in the short term, mobilize students and stimulate public participation in environmental protection, gradually assisting to raise ecological conservation awareness throughout society. It, in turn, strengthens public supervision of environmental pollution and enhances the efficiency of environmental governance (Varela-Candamio et al., 2018). Therefore, in regions with SGEE of PM2.5 and O3 for medium to low levels (such as Jiaxing and Shaoxing), an increase in educational investment is beneficial for managing key air pollutants. However, in high environmental efficiency areas like Zhoushan and Ningbo, increased educational investment lead to a resource “Crowding-out effect” on the inputs for managing air pollutants (Tao et al., 2022; Underdal, 2010). Given limited financial resources, an increase in educational investment can undermine the stable operation of facilities for managing industrial emissions, thereby reducing the SGEE of PM2.5 and O3. Moreover, an increase in educational investment enhances the overall human capital of the province, thereby accelerating economic growth, but it does not directly lead to an improvement in environmental quality.
(2) Technological innovation: After the 0.25 quantile point, there is a significant positive correlation, and the regression coefficient increases to some extent (Figure 5b). It indicates that the rise in the level of technological innovation can effectively promote the improvement of the SGEE of PM2.5 and O3, and the enhancing effect is more pronounced in areas with higher SGEE of PM2.5 and O3. Existing research indicates that through technological breakthroughs and innovation, it is possible to gradually elucidate the mechanisms of PM2.5 and O3 formation, develop catalytic technologies and equipment to eliminate pollutant concentrations, and establish a comprehensive and multi-dimensional monitoring system for ozone and its precursors (Cui et al., 2023; Chen et al., 2019). It can effectively organize and implement collaborative prevention and control plans and strategies for PM2.5 and O3 pollution, thereby improving the SGEE of PM2.5 and O3. Meanwhile, cities like Hangzhou and Ningbo, which have advanced modern technological means, have constructed a digitized and intelligent air governance system that achieves precise identification of pollution sources, real-time aggregation of PM2.5 and O3 monitoring data, and early prediction and warning processing, thereby enabling SGEE of PM2.5 and O3.
(3) Industry structure: a significant negative correlation is observed at all quantile points. It illustrates that a decrease in the proportion of industrial output value effectively enhances the SGEE of PM2.5 and O3 (Figure 5c). From the perspective of the impact coefficients, in cities with low and high SGEE of PM2.5 and O3, the suppressive effect of industrial structure adjustment on environmental efficiency is somewhat reduced. Thus, the improvement of SGEE of PM2.5 and O3 through industrial structure adjustment is mainly reflected in cities at the 0.25–0.75 quantile points, while its impact on high-efficiency cities is limited. Existing research demonstrates that industrial sources are the primary contributors to PM2.5 and O3 pollution (Li et al., 2024; Yang J. et al., 2025). With the adjustment of the industrial structure, the reduction and elimination of industries related to severe air pollution, along with Zhejiang Province’s acceleration of the green transformation and upgrading of traditional industries (Ding et al., 2020), and the vigorous promotion of the development of high-tech industries and strategic emerging industries, will help enhance the SGEE of PM2.5 and O3. It is particularly evident in cities such as Hangzhou, Ningbo, and Wenzhou. For instance, Hangzhou and Ningbo are promoting industrial digitalization and the digitalization of industries, utilizing digital technologies to advance smart manufacturing. It enhances operational efficiency in enterprises, drives technological iteration, and focuses on air pollution reduction and control in key industries. The aim is to address the prominent issues causing PM2.5 and O3 pollution.
(4) Environmental regulation: there is no significant correlation at any quantile (Figure 5d), which indicates that the current investment and intensity of air pollution environmental regulation have not had a significant impact on the SGEE of PM2.5 and O3. On one hand, the current operational funding for air pollution control under environmental regulation mainly focuses on the management of industrial pollutants such as SO2 and NOx, and has not had a direct and effective impact on the collaborative governance of PM2.5 and O3 pollution. On the other hand, a significant portion of the pollution sources for urban PM2.5 and O3 comes from traffic and mobile sources, which are not directly reflected in the investments in environmental regulation. Therefore, environmental regulations need to raise the emission standards for environmental pollutants and strengthen the supervision and control of pollutant emissions (Fang et al., 2023). Meanwhile, while continuing to address industrial pollution sources, there should be increased efforts for the collaborative governance of pollution from traffic and mobile sources (Jiang et al., 2019). For instance, cities can reduce the impact of motor vehicle emissions of PM2.5 and O3 by promoting clean energy vehicles, strengthening vehicle exhaust emission standards, and facilitating the development of public transportation.
3.4 Discussion and policy implications
Based on the above analysis, the following strategies and recommendations for the synergistic governance of PM2.5 and O3 are proposed:
(1) Rationally value the limited role of educational investment in enhancing the SGEE of PM2.5 and O3. In existing research, educational investment has been an overlooked variable influencing AEE (Lu et al., 2019; Fang et al., 2023). The study indicates that educational investment primarily affects the enhancement of SGEE of PM2.5 and O3 during the medium to low efficiency stages. It suggests that in terms of the areas severely affected by PM2.5 and O3 pollution and with relatively low SGEE of PM2.5 and O3, increasing educational investment and public awareness could mobilize public recognition of PM2.5 and O3 pollution in the short term, leading to the adoption of proactive and effective measures to improve pollution management efficiency. However, in regions with higher SGEE of PM2.5 and O3, an increase in educational investment may lead to a “Crowding-out effect” on resources allocated for PM2.5 and O3 synergistic governance, necessitating the use of other regulatory measures for deeper efficiency enhancements (Tao et al., 2022; Underdal, 2010).
(2) Strengthen the role of technological innovation in improving the SGEE of PM2.5 and O3. Existing research has shown that technological advancement is a key factor in enhancing AEE. Therefore, cities in Zhejiang should increase investment in technological research and development, cultivate high-level scientific and technological talent, implement innovation-driven development strategies, and strengthen independent innovation capabilities (Hua et al., 2022). It is essential to enhance the cooperation and connection among local research institutions, enterprises, and environmental protection departments, and to establish various forms of technology innovation alliances to improve the technologies and capabilities for the synergistic governance of PM2.5 and O3. Cities like Hangzhou and Ningbo should continue to elevate the level of technological innovation applications, with a focus on enterprises that are highly polluting, difficult to manage, and have significant pollution outputs. Additionally, they should promote the extensive application of cutting-edge fields such as Internet+ and big data to enhance the applicability of technological innovations and improve the level of comprehensive governance technologies (Jiang et al., 2019; Ding et al., 2020).
(3) Continuous optimization of industrial structure to promote the improvement of SGEE of PM2.5 and O3. Existing research has shown that adjusting the industrial structure is an important factor in enhancing AEE (Fang et al., 2023). Currently, Zhejiang should continue to eliminate high energy consumption, high pollution, and high emissions industries, reduce the proportion of heavy-polluting industrial output, and accelerate the green transformation and development of traditional industries (Wang et al., 2023; Ding and Fang, 2022). Among them, Hangzhou and Ningbo should fully leverage the advantages of the service sector and strategic emerging industries, and continue to capitalize on the advantages of the digital economy to accelerate the technological upgrading of the manufacturing sector and vigorously develop high-tech industries (Zhang et al., 2023). Meanwhile, cities like Jiaxing and Shaoxing should focus on improving their own environmental protection industries while enhancing the processes of industrial products, reducing high-energy-consuming enterprises, and promoting industrial transformation and upgrading.
4 Conclusion
A scientific evaluation of atmospheric environmental efficiency is an important measure for continuously improving regional air quality. The study focuses on the synergistic governance environmental efficiency of PM2.5 and O3, using 11 cities in Zhejiang Province, a typical green transformation area in eastern China, as a case study for empirical analysis. The results show that:
(1) The PM2.5 and O3 concentrations in the 11 cities of Zhejiang Province show significant spatio-temporal variation. Cities experiencing severe levels of both types of pollution are primarily found in the central and northern parts of Zhejiang, especially in the Hangzhou Bay area, including Huzhou, Jiaxing, Hangzhou, and Shaoxing, which also exhibit higher NIP values. There remain challenges in the simultaneous governance and emission reduction of PM2.5 and O3.
(2) The average SGEE of PM2.5 and O3 in Zhejiang Province is 0.533, indicating there is approximately 46.7% room for improvement compared to the production frontier. Cities with higher environmental efficiency mainly include Zhoushan, Ningbo, and Hangzhou. Technological advancement is the main driving force behind the improvement of SGEE of PM2.5 and O3, while the contribution of pure technical efficiency needs further exploration.
(3) The results of the quantile regression indicate that the influence coefficients of different factors on the synergistic governance environmental efficiency of PM2.5 and O3 vary significantly at different quantiles. Educational investment primarily improves the SGEE of PM2.5 and O3 during low-efficiency stages, while it exerts a certain “Crowding-out effect” on resources during high-efficiency stages. In contrast, the rise in technological innovation levels and the adjustment of industrial structures can effectively promote the improvement of SGEE of PM2.5 and O3.
Although the study has explored the SGEE of PM2.5 and O3 to some extent, there are limitations due to the restricted range of sample cities and indicator data. Future studies could focus on other emerging pollutants, such as VOCs, to continuously optimize the indicator system for undesirable outputs of AEE. Additionally, it will be necessary to expand the sample size of cities over a broader range, to assess the impact and incentives of indicators such as educational investment, technological innovation, and the digital economy on AEE at a larger scale (e.g., at the inter-city or national level) and in a more precise manner.
Data availability statement
The original contributions presented in the study are included in the article/Supplementary Material, further inquiries can be directed to the corresponding author.
Author contributions
BJ: Conceptualization, Data curation, Investigation, Resources, Writing – original draft. QZ: Data curation, Investigation, Writing – original draft. LL: Formal Analysis, Investigation, Methodology, Validation, Visualization, Writing – original draft. LD: Conceptualization, Methodology, Supervision, Writing – original draft, Writing – review and editing.
Funding
The author(s) declare that financial support was received for the research and/or publication of this article. This work was supported by 2024 Zhejiang Provincial Philosophy and Social Science Planning “Provincial-City Cooperation” Project (24SSHZ067YB), Soft Science Project of Zhejiang Science and Technology Department (2024C35096), 2024 Planning Projects of China Vocational Education Association (ZJS2024YB33).
Conflict of interest
The authors declare that the research was conducted in the absence of any commercial or financial relationships that could be construed as a potential conflict of interest.
Generative AI statement
The author(s) declare that no Generative AI was used in the creation of this manuscript.
Publisher’s note
All claims expressed in this article are solely those of the authors and do not necessarily represent those of their affiliated organizations, or those of the publisher, the editors and the reviewers. Any product that may be evaluated in this article, or claim that may be made by its manufacturer, is not guaranteed or endorsed by the publisher.
Supplementary material
The Supplementary Material for this article can be found online at: https://www.frontiersin.org/articles/10.3389/fenvs.2025.1632050/full#supplementary-material
References
Banker, R. D., Cooper, W. W., Seiford, L. M., Thrall, R. M., and Zhu, J. (2004). Returns to scale in different DEA models. Eur. J. Operational Res. 154 (2), 345–362. doi:10.1016/s0377-2217(03)00174-7
Cade, B. S., and Noon, B. R. (2003). A gentle introduction to quantile regression for ecologists. Front. Ecol. Environ. 1 (8), 412–420. doi:10.1890/1540-9295(2003)001[0412:agitqr]2.0.co;2
Chen, J., Wang, S., Zhou, C., and Li, M. (2019). Does the path of technological progress matter in mitigating China's PM2.5 concentrations? Evidence from three urban agglomerations in China. Environ. Pollut. 254, 113012. doi:10.1016/j.envpol.2019.113012
Cheng, Y., Zhao, G., Meng, W., and Wang, Q. (2024). Resources utilization, taxation and green education: a path to sustainable power generation. Resour. Policy 88, 104389. doi:10.1016/j.resourpol.2023.104389
Chou, L. C., Zhang, W. H., Wang, M. Y., and Yang, F. M. (2020). The influence of democracy on emissions and energy efficiency in America: new evidence from quantile regression analysis. Energy Environ. 31 (8), 1318–1334. doi:10.1177/0958305x19882382
Ciarkowska, K., and Gambus, F. (2020). Building a quality index for soils impacted by proximity to an industrial complex using statistical and data-mining methods. Sci. Total Environ. 740, 140161. doi:10.1016/j.scitotenv.2020.140161
Cui, Y., Zhong, C., Cao, J., and Guo, M. (2023). Can green finance effectively mitigate PM2.5 pollution? What role will green technological innovation play? Energy Environ., doi:10.1177/0958305X231204030
Deng, G., Li, L., and Song, Y. (2016). Provincial water use efficiency measurement and factor analysis in China: based on SBM-DEA model. Ecol. Indic. 69, 12–18. doi:10.1016/j.ecolind.2016.03.052
Ding, L., Chen, K., Hua, Y., Dong, H., and Wu, A. (2020). Investigating the relationship between the industrial structure and atmospheric environment by an integrated system: a case study of Zhejiang, China. Sustainability 12 (3), 1278. doi:10.3390/su12031278
Ding, L., and Fang, X. (2022). Spatial–temporal distribution of air-pollution-intensive industries and its social-economic driving mechanism in Zhejiang Province, China: a framework of spatial econometric analysis. Environ. Dev. Sustain. 24 (2), 1681–1712. doi:10.1007/s10668-021-01503-z
Ding, L., Lu, Y. Y., and Ye, S. S. (2019). Evaluation of atmospheric environment efficiency and regional differences in Zhejiang. J. Saf. Environ. 19 (3), 1075–1085.
Ding, L., Wang, L., Fang, X., Diao, B., Xia, H., Zhang, Q., et al. (2024). Exploring the spatial effects and influencing mechanism of ozone concentration in the Yangtze River Delta urban agglomerations of China. Environ. Monit. Assess. 196 (7), 603. doi:10.1007/s10661-024-12762-4
Dormann, C. F., Elith, J., Bacher, S., Buchmann, C., Carl, G., Carré, G., et al. (2013). Collinearity: a review of methods to deal with it and a simulation study evaluating their performance. Ecography 36 (1), 27–46. doi:10.1111/j.1600-0587.2012.07348.x
Fang, X., Gao, B., Cui, S., Ding, L., Wang, L., and Shen, Y. (2023). Regional differences in PM2.5 environmental efficiency and its driving mechanism in Zhejiang Province, China. Atmosphere 14 (4), 672. doi:10.3390/atmos14040672
Färe, R., Grosskopf, S., Lindgren, B., and Roos, P. (1992). Productivity changes in Swedish pharamacies 1980–1989: a non-parametric malmquist approach. J. Prod. Analysis 3 (1), 85–101. doi:10.1007/bf00158770
Färe, R., Grosskopf, S., Norris, M., and Zhang, Z. (1994). Productivity growth, technical progress, and efficiency change in industrialized countries. Am. Econ. Rev., 66–83. Available online at: https://www.jstor.org/stable/2117971.
Fu, Y. X., Xie, H. J., Zhan, J. J., and Zhang, X. (2024). Research on atmospheric environmental efficiency in China based on dynamic NSBM model. J. Syst. Sci. Math. Sci., 1–20. doi:10.12341/jssms240135
Guo, J., Wu, X. H., and Chen, Y. F. (2020). Construction and demonstration of two-stage DEA model for estimation of haze emission efficiency. China Soft Sci. Mag. 10, 184–192.
He, Q., Han, J., Guan, D., Mi, Z., Zhao, H., and Zhang, Q. (2018). The comprehensive environmental efficiency of socioeconomic sectors in China: an analysis based on a non-separable bad output SBM. J. Clean. Prod. 176, 1091–1110. doi:10.1016/j.jclepro.2017.11.220
Hua, Y. D., Hu, K. M., Qiu, L. Y., Dong, H. A., Ding, L., and Lo, S. L. (2022). Exploring the interaction relationship between beautiful China-SciTech innovation using coupling coordination and predictive analysis: a case study of Zhejiang. Environ. Dev. Sustain. 24, 12097–12130. doi:10.1007/s10668-021-01936-6
Huang, Q., Zhang, H., Chen, J., and He, M. (2017). Quantile regression models and their applications: a review. J. Biometrics Biostat. 8 (3), 1–6. doi:10.4172/2155-6180.1000354
Huang, X., Liu, M., Chen, R., Gao, S., Xie, Q., and Feng, Q. (2021). Evaluation and spatiotemporal characteristics of atmospheric environment efficiency in Shandong province based on super-SBM model. Environ. Res. Commun. 3 (11), 115002. doi:10.1088/2515-7620/ac3409
Jiang, B., Ding, L., and Fang, X. (2019). Sustainable development of new urbanization from the perspective of coordination: a new complex system of urbanization‒technology innovation and the atmospheric environment. Atmosphere 10 (11), 652. doi:10.3390/atmos10110652
Koenker, R., and Hallock, K. F. (2001). Quantile regression. J. Econ. Perspect. 15 (4), 143–156. doi:10.1257/jep.15.4.143
Kong, L., Song, M., Li, X., Liu, Y., Lu, S., Zeng, L., et al. (2024). Analysis of China's PM2.5 and ozone coordinated control strategy based on the observation data from 2015 to 2020. J. Environ. Sci. 138, 385–394. doi:10.1016/j.jes.2023.03.030
Lee, H. S. (2021). An integrated model for SBM and Super-SBM DEA models. J. Operational Res. Soc. 72 (5), 1174–1182. doi:10.1080/01605682.2020.1755900
Li, L., He, M., Liang, X., Deng, H., and Yang, R. (2024). How does the impact of a two-stage air pollution control policy on air quality different? Evidence from 258 cities in China. Atmos. Pollut. Res. 15 (7), 102148. doi:10.1016/j.apr.2024.102148
Li, M., Huang, Y., and Han, M. (2019). How to maintain a sustainable environment? A spatial evolution of urban atmospheric pollution and impact factors in China. Sustainability 11 (16), 4376. doi:10.3390/su11164376
Li, Q., Chai, S., and Chen, S. (2025). “Evaluation of the environmental efficiency of China’s power generation industry considering carbon emissions and air pollution: an improved three-stage SBM-SE-DEA model,” in Environment, development and sustainability (Springer), 1–22.
Liu, H., Alharthi, M., Atil, A., Zafar, M. W., and Khan, I. (2022a). A non-linear analysis of the impacts of natural resources and education on environmental quality: green energy and its role in the future. Resour. Policy 79, 102940. doi:10.1016/j.resourpol.2022.102940
Liu, K., Wang, X., and Zhang, Z. (2022b). Assessing urban atmospheric environmental efficiency and factors influencing it in China. Environ. Sci. Pollut. Res. 29, 594–608. doi:10.1007/s11356-021-15692-7
Lu, Y. Y., He, Y., Wang, B., Ye, S. S., Hua, Y., and Ding, L. (2019). Efficiency evaluation of atmospheric pollutants emission in Zhejiang Province China: a DEA-malmquist based approach. Sustainability 11 (17), 4544. doi:10.3390/su11174544
Ma, X., Zhao, X., Zhang, L., Zhou, Y., and Chen, H. (2021). Spatial-temporal characteristics and influencing factors of atmospheric environmental efficiency in China. Environ. Sci. Pollut. Res. 28, 12428–12440. doi:10.1007/s11356-020-11128-w
Miao, Z., Baležentis, T., Tian, Z., Shao, S., Geng, Y., and Wu, R. (2019a). Environmental performance and regulation effect of China’s atmospheric pollutant emissions: evidence from “three regions and ten urban agglomerations”. Environ. Resour. Econ. 74, 211–242. doi:10.1007/s10640-018-00315-6
Miao, Z., Chen, X., Baležentis, T., and Sun, C. (2019b). Atmospheric environmental productivity across the provinces of China: joint decomposition of range adjusted measure and luenberger productivity indicator. Energy Policy 132, 665–677. doi:10.1016/j.enpol.2019.06.019
Mo, B., Hou, M., and Huo, X. (2024). The synergistic reduction effect of PM2.5 and CO2: evidence from national key ecological functional areas in China. Environ. Sci. Pollut. Res. 31 (9), 13766–13779. doi:10.1007/s11356-024-32063-0
Ozkan, O., Eweade, B. S., and Usman, O. (2024). Assessing the impact of resource efficiency, renewable energy R&D spending, and green technologies on environmental sustainability in Germany: evidence from a wavelet quantile-on-quantile regression. J. Clean. Prod. 450, 141992. doi:10.1016/j.jclepro.2024.141992
Paramati, S. R., Shahzad, U., and Doğan, B. (2022). The role of environmental technology for energy demand and energy efficiency: evidence from OECD countries. Renew. Sustain. Energy Rev. 153, 111735. doi:10.1016/j.rser.2021.111735
Rashid, A. A., See, K. F., and Yu, M. M. (2024). Measuring airline efficiency using a dynamic network data envelopment analysis in the presence of innovation capital. Technol. Forecast. Soc. Change 206, 123457. doi:10.1016/j.techfore.2024.123457
Ren, F. R., Cui, Z., Ding, X., Zhang, X. R., Li, R. H., Yao, Q., et al. (2023). The co-benefit of emission reduction efficiency of energy, CO2 and atmospheric pollutants in China under the carbon neutrality target. Energy Strategy Rev. 49, 101125. doi:10.1016/j.esr.2023.101125
Shao, Z., Zheng, X., Zhao, J., and Liu, Y. (2025). Evaluating the health impact of air pollution control strategies and synergies among PM2.5 and O3 pollution in Beijing-Tianjin-Hebei Region, China. Environ. Res. 274, 121348. doi:10.1016/j.envres.2025.121348
Shu, L., Wang, T., Li, M., Xie, M., and Liu, J. (2024). Optimizing emission control strategies for mitigating PM2.5 and O3 pollution: a case study in the Yangtze river Delta region of eastern China. Atmos. Environ. 319, 120288. doi:10.1016/j.atmosenv.2023.120288
Song, M., An, Q., Zhang, W., Wang, Z., and Wu, J. (2012). Environmental efficiency evaluation based on data envelopment analysis: a review. Renew. Sustain. Energy Rev. 16 (7), 4465–4469. doi:10.1016/j.rser.2012.04.052
Sueyoshi, T., and Yuan, Y. (2015). China’s regional sustainability and diversified resource allocation: DEA environmental assessment on economic development and air pollution. Energy Econ. 49, 239–256. doi:10.1016/j.eneco.2015.01.024
Świdwa-Urbańska, J., and Batlle-Sales, J. (2021). Data quality oriented procedure, for detailed mapping of heavy metals in urban topsoil as an approach to human health risk assessment. J. Environ. Manag. 295, 113019. doi:10.1016/j.jenvman.2021.113019
Tao, H., Tao, M., and Wang, R. (2022). Do education human capital and environmental regulation drive the growth efficiency of the green economy in China? Sustainability 14 (24), 16524. doi:10.3390/su142416524
Tone, K. (2001). A slacks-based measure of efficiency in data envelopment analysis. Eur. J. Oper. Res. 130, 498–509. doi:10.1016/s0377-2217(99)00407-5
Underdal, A. (2010). Complexity and challenges of long-term environmental governance. Glob. Environ. Change 20 (3), 386–393. doi:10.1016/j.gloenvcha.2010.02.005
Uralovich, K. S., Toshmamatovich, T. U., Kubayevich, K. F., Sapaev, I. B., Saylaubaevna, S. S., Beknazarova, Z. F., et al. (2023). A primary factor in sustainable development and environmental sustainability is environmental education. Casp. J. Environ. Sci. 21 (4), 965–975. doi:10.22124/CJES.2023.7155
Varela-Candamio, L., Novo-Corti, I., and García-Álvarez, M. T. (2018). The importance of environmental education in the determinants of green behavior: a meta-analysis approach. J. Clean. Prod. 170, 1565–1578. doi:10.1016/j.jclepro.2017.09.214
Veeravel, V., Sadharma, E. K. S., and Kamaiah, B. (2024). Do ESG disclosures lead to superior firm performance? A method of moments panel quantile regression approach. Corp. Soc. Responsib. Environ. Manag. 31 (1), 741–754. doi:10.1002/csr.2598
Wang, H., Xie, Y., Xue, W., Yan, G., Lei, Y., and Wang, J. (2025a). Revealing sources for synergistic control of PM2.5, O3, and CO2 in China: based on social costs of air pollution and climate impact. J. Environ. Manag. 374, 123964. doi:10.1016/j.jenvman.2024.123964
Wang, K. L., Meng, X. R., Yang, L., Yang, B. C., Wang, J. M., and Cheng, Y. H. (2017). The regional differences, changing trends and causes decomposition of atmospheric pollution emissions efficiency of China’s major industrial provinces. China Environ. Sci. 37 (3), 888–898.
Wang, L., Chen, B., Ouyang, J., Mu, Y., Zhen, L., Yang, L., et al. (2025b). Causal-inference machine learning reveals the drivers of China’s 2022 ozone rebound. Environ. Sci. Ecotechnology 24, 100524. doi:10.1016/j.ese.2025.100524
Wang, Y. (2024). Power source and driving factors of green transformation of resource-based cities in China. Econ. Geogr. 44 (4), 75–84. doi:10.15957/j.cnki.jjdl.2024.04.008
Wang, Y., Zhao, Y., Liu, Y., Jiang, Y., Zheng, B., Xing, J., et al. (2023). Sustained emission reductions have restrained the ozone pollution over China. Nat. Geosci. 16 (11), 967–974. doi:10.1038/s41561-023-01284-2
Wu, X., Chen, Y., Zhao, P., Guo, J., and Ma, Z. (2020). Study of haze emission efficiency based on new coopetition data envelopment analysis. Expert Syst. 37 (4), e12466. doi:10.1111/exsy.12466
Wu, X., Guo, J., Wu, X., and Guo, J. (2021). “Inputs optimization to reduce the undesirable outputs by environmental hazards: a DEA model with data of PM2.5 in China,” in Economic impacts and emergency management of disasters in China (Springer), 547–580.
Xia, H., Ding, L., Yang, S., and Wu, A. (2020). Socioeconomic factors of industrial air pollutants in Zhejiang Province, China: decoupling and decomposition analysis. Environ. Sci. Pollut. Res. 27, 28247–28266. doi:10.1007/s11356-020-09116-1
Xu, L., Shen, C., Chen, J., Pan, X., and Xiao, G. (2024). Efficiency evaluation and improvement pathway of sulfur-oxide emissions in European ports based on Context-dependent SBM-DEA model. Mar. Pollut. Bull. 208, 117002. doi:10.1016/j.marpolbul.2024.117002
Yang, J., Wang, Y., Zhang, L., and Zhao, Y. (2025a). Investigating the response of China’s surface ozone concentration to the future changes of multiple factors. Atmos. Chem. Phys. 25 (4), 2649–2666. doi:10.5194/acp-25-2649-2025
Yang, W., and Li, L. (2018). Efficiency evaluation of industrial waste gas control in China: a study based on data envelopment analysis (DEA) model. J. Clean. Prod. 179, 1–11. doi:10.1016/j.jclepro.2017.12.277
Yang, Z., Li, Z., Cheng, F., Lv, Q., Li, K., Zhang, T., et al. (2025b). Two-decade surface ozone (O3) pollution in China: enhanced fine-scale estimations and environmental health implications. Remote Sens. Environ. 317, 114459. doi:10.1016/j.rse.2024.114459
Ye, F. F., and Wang, Y. M. (2019). Strategy selection of regional cooperative governance in air pollution: game analysis based on weighted DEA. J. Syst. Sci. Math. Sci. 39 (01), 37–50.
Zadmirzaei, M., Hasanzadeh, F., Susaeta, A., and Gutiérrez, E. (2024). A novel integrated fuzzy DEA–artificial intelligence approach for assessing environmental efficiency and predicting CO2 emissions. Soft Comput. 28 (1), 565–591. doi:10.1007/s00500-023-08300-y
Žalėnienė, I., and Pereira, P. (2021). Higher education for sustainability: a global perspective. Geogr. Sustain. 2 (2), 99–106. doi:10.1016/j.geosus.2021.05.001
Zhang, N., Sun, F., and Hu, Y. (2024). Carbon emission efficiency of land use in urban agglomerations of Yangtze River economic belt, China: based on three-stage SBM-DEA model. Ecol. Indic. 160, 111922. doi:10.1016/j.ecolind.2024.111922
Zhang, Q., Ye, S., Ma, T., Fang, X., Shen, Y., and Ding, L. (2023). Influencing factors and trend prediction of PM2.5 concentration based on STRIPAT-scenario analysis in Zhejiang Province, China. Environ. Dev. Sustain. 25 (12), 14411–14435. doi:10.1007/s10668-022-02672-1
Zheng, Z. (2021). Energy efficiency evaluation model based on DEA-SBM-Malmquist index. Energy Rep. 7, 397–409. doi:10.1016/j.egyr.2021.10.020
Zhou, W., Zhuang, Y., and Chen, Y. (2023). Spatial convergence and transfer path of atmospheric emission efficiency: an empirical analysis from China. J. Clean. Prod. 414, 137675. doi:10.1016/j.jclepro.2023.137675
Keywords: synergistic governance environmental efficiency of PM2.5 and O3, data envelopment analysis, quantile regression model, educational investment, technological innovation
Citation: Ji B, Zhang Q, Liu L and Ding L (2025) Educational investment, technological innovation, and atmospheric environmental ffficiency: evidence from SBM-DEA and quantile regression model. Front. Environ. Sci. 13:1632050. doi: 10.3389/fenvs.2025.1632050
Received: 20 May 2025; Accepted: 23 July 2025;
Published: 06 August 2025.
Edited by:
Mohamed R. Abonazel, Cairo University, EgyptReviewed by:
Ihsan Oluç, Mehmet Akif Ersoy University, TürkiyePrabhat Kashyap, University of Delhi, India
Copyright © 2025 Ji, Zhang, Liu and Ding. This is an open-access article distributed under the terms of the Creative Commons Attribution License (CC BY). The use, distribution or reproduction in other forums is permitted, provided the original author(s) and the copyright owner(s) are credited and that the original publication in this journal is cited, in accordance with accepted academic practice. No use, distribution or reproduction is permitted which does not comply with these terms.
*Correspondence: Lei Ding, ZGluZ2xlaTM2MTYwMjhAMTYzLmNvbQ==