 Mei-Kuei Lu
 Sorin C. Popescu
 Brian A. Campbell
- 1Department of Ecology and Conservation Biology, Texas A&M University, College Station, TX, United States
- 2Earth Sciences Division, NASA Goddard Space Flight Center, Greenbelt, MD, United States
- 3Laboratory for Atmospheres, NASA Wallops Flight Facility, Wallops Island, VA, United States
- 4Global Science and Technology, Inc., Greenbelt, MD, United States
Citizen science plays a crucial role in enhancing the spatial and temporal resolutions of environmental observations. The Global Learning and Observations to Benefit the Environment (GLOBE) Observer application is a mobile extension of the GLOBE Program that is empowering the public to collect environmental data in support of both scientific research and educational outreach. In this study, we leverage citizen science data from the GLOBE Observer program to evaluate and validate three canopy height models: the ice, cloud, and land elevation satellite-2 (ICESat-2) product, a global ecosystem dynamics investigation (GEDI)-Landsat-derived global map (GL), and a GEDI-Sentinel-2 fusion map (GS-2). Tree height measurements obtained with GLOBE were filtered for forested areas using the Landscape Fire and Resource Management Planning Tools (LANDFIRE) existing vegetation cover data and analyzed across multiple ecozones within the contiguous United States; then, manual comparisons were performed with airborne lidar data from selected sites. Our findings indicate that although GLOBE data provide extensive temporal and spatial coverage, these exhibit low general agreement with airborne lidar reference heights (R2 = 0.14) owing to geolocation inaccuracies and measurement inconsistencies inherent in citizen-collected data. Validations performed with spaceborne lidar-derived canopy height maps (ICESat-2, GL, and GS-2) showed generally low correlations (R2 = 0.08–0.17) that could be improved (up to R2 = 0.22) by filtering for greater location accuracy (0–25 m), even though challenges persist. These results underscore both the potential and limitations of using citizen science data for validating spaceborne lidar-derived canopy height maps while highlighting the need for enhanced data collection protocols to improve geolocation accuracies for future ecological monitoring efforts.
1 Introduction
Forest canopy height mapping is crucial for understanding and managing forest ecosystems as it provides essential information about the structures, health, and biodiversity of forests (Alvites et al., 2024; Migliavacca et al., 2021). Accurate canopy height maps are essential for estimating aboveground biomasses that are key indicators of carbon storage and sequestration potential in forests (Potapov et al., 2021; Qadeer et al., 2024; Malambo and Popescu, 2024) as well as fundamental for climate change studies and development of effective strategies to mitigate global warming by enhancing carbon sinks (Lang et al., 2023). Additionally, canopy height information can help with monitoring forest dynamics, such as the growth rates, disturbances, and recovery processes, thereby aiding in sustainable forest management and conservation efforts (Wulder et al., 2012; Malambo and Popescu, 2024; Liu and Popescu, 2022).
Traditionally, tree heights are obtained through in situ field measurements that require considerable amounts of manpower and time while being difficult to scale up (Enterkine et al., 2022). Satellite-based observations provide opportunities to map the canopy heights globally through efforts like NASA’s current ice, cloud, and land elevation satellite-2 (ICESat-2) (Markus et al., 2017) and global ecosystem dynamics investigation (GEDI) (Dubayah et al., 2020a) missions. ICESat-2 has been in operation since September 2018 and provides surface elevation measurements of the Earth with its Advanced Topographic Laser Altimeter System (ATLAS) instrument by counting the photons transmitted and received. The main purpose of ICESat-2 was to detect changes in the elevation of sea ice (Markus et al., 2017), although ICESat-2 data and its derivatives have also been used for vegetation and water management applications. Various ICESat-2-derived products have been developed for mapping canopy heights (Malambo and Popescu, 2021; Malambo et al., 2022), monitoring forest fires (Liu and Popescu, 2022), and estimating biomass levels (Narine et al., 2020; Nandy et al., 2021). Malambo and Popescu (2024) integrated ICESat-2 data with ancillary datasets to model canopy heights across the continental United States. The canopy height map produced thus was generally consistent with reference airborne lidar data (R2 = 0.72, mean absolute error (MAE) = 3.9 m) across the United States, and the model performances varied by biome type.
GEDI was launched in December 2018 and has been collecting data since April 2019. GEDI is a spaceborne lidar installed on the International Space Station and has been specifically designed for vegetation structure measurements. GEDI measures and maps three-dimensional forest structures and provides high-resolution data on forest canopy heights, canopy vertical structures, aboveground biomass estimates, and surface elevations (Dubayah et al., 2020a). GEDI provides sparse footprint-level data, so it is necessary to integrate GEDI data with continuous optical time-series data such as Landsat and Sentinel-2 satellite imagery to extrapolate and monitor forest changes in a specific area (Schlund et al., 2023). GEDI level-2 data include two products, namely, GEDI L2A elevation and height metrics as well as GEDI L2B canopy cover and vertical profile metrics (Dubayah et al., 2020b). Potapov et al. (2021) extracted multiple relative height metrics from GEDI L2A data and integrated these metrics with global Landsat data to create a 30-m global forest canopy height map for the year 2019, which is referred to herein as the GL map. This global GEDI canopy height map was validated with airborne lidar data with the desired accuracy (root mean-squared error (RMSE) = 9.07 m, MAE = 6.36 m, R2 = 0.61). In another similar work, Lang et al. (2023) fused the sparse height data from GEDI with dense Sentinel-2 images (GS-2) using a probabilistic deep-learning model and created a continuous 10-m global canopy height map; this method improved the retrieval of canopy heights for tall trees. This map was further evaluated against independent airborne lidar data (RMSE = 7.9 m, bias = 1.7 m), which indicated its general tendency to overestimate canopy heights compared to the airborne lidar measurements. This 10-m GEDI-derived global canopy height product will be referred to herein as the GS-2 canopy height map.
Despite the availability of spaceborne lidar-derived data, it is critical to understand their performances in measuring tree heights. One approach is to utilize ground-based measurements to validate the maps produced (Enterkine et al., 2022). Citizen science data serve as alternative data for comparisons given their broad temporal and spatial coverages (Enterkine et al., 2022; Molinier et al., 2016). NASA’s Global Learning and Observations to Benefit the Environment (GLOBE) Program is an international and educational program where users collect tree height data from around the world using the GLOBE Observer (GO) application. Such citizen science data with global coverage serve as valuable sources to validate satellite-based measurements, including canopy height data derived from ICESat-2 and GEDI (Enterkine et al., 2022). Other studies have also illustrated the usability and potential of citizen science data in ecological research and forestry (Dujardin et al., 2022; Roman et al., 2017; Molinier et al., 2016). Although citizen science data have been utilized in various ecological studies, their use in validating high-resolution satellite-derived canopy height products remains limited. Campbell (2021) and Enterkine et al. (2022) explored the potential of GLOBE data as comparison for tree height information obtained with ICESat-2, but there are currently no studies assessing its applicability for validating large-scale spaceborne lidar-derived canopy height models (CHMs). The present study is the first comprehensive evaluation of GLOBE citizen science tree height data against multiple spaceborne lidar canopy height products across diverse biomes in the contiguous United States (CONUS). Therefore, we integrated ground-based measurements from citizen science data with spaceborne lidar-derived canopy height maps in this study to investigate the potential utility of citizen science data in ecological studies. The specific objectives of this study are as follows: evaluate the reliability of manually collected GLOBE data with airborne lidar data; validate the performances of spaceborne lidar-derived canopy height data against GLOBE data.
2 Materials and methods
2.1 Study areas
The validation of canopy height maps encompasses the CONUS, which is a diverse region characterized by a wide range of climatic zones, topographies, and vegetation types. The region spans the dense forests of the Pacific Northwest and towering redwoods of California to the mixed hardwood forests of the northeast and subtropical forests of the southeast United States; this area can be considered a comprehensive representation of the forest ecosystems in North America (Oswalt et al., 2019). The variability in forest types, management practices, and environmental conditions across the CONUS provides an ideal setting for assessing the accuracy and applicability of spaceborne lidar-derived height maps. This diversity allows validation of the canopy height maps obtained with ICESat-2, GL, and GS-2 as representative data for capturing forest canopy heights across different biomes and land cover types. The findings of this study are expected to have broad implications for forest management, carbon accounting, and ecological research across a wide array of forested landscapes in the United States.
2.2 Data
2.2.1 GLOBE citizen science data
The GLOBE Program is an international effort involving science, citizen science, and education that encourages volunteers to collect environmental observations, such as tree height and circumference, using the GO application. These data support Earth system science and enhance the interpretation of tree height data from satellite missions like ICESat-2 and GEDI. Before measuring the tree heights, the citizen scientists need to enter their own heights, from which the average stride length of the user and height of the phone at eye level are estimated. The users are prompted to measure trees for which the base and crown are clearly visible and within 7–25 m of walking distance from themselves. The users then use the cameras on their phones or tablets to measure the angles to the base and crown of the tree at their eye levels. Next, the users walk to the base of the tree in a straight line without obstacles, record the number of steps taken, confirm the longitude and latitude of the tree, and are able to set the tree location using a touchscreen map. The app then uses the information collected by the citizen scientists to estimate tree heights. Users may also enter their actual average stride lengths, heights of their phones at eye level, and distances to the trees with measured values to improve data accuracy. The app records the tree location and estimates the location accuracy. Measuring the circumference of the tree at breast height using a tape is an optional step. Details of the geometry used to calculate the tree heights are mentioned in a previous report (Enterkine et al., 2022). The GLOBE data are available for download online through the GLOBE Advanced Data Access Tool (https://datasearch.globe.gov/), GLOBE Visualization System (https://vis.globe.gov/GLOBE/), and GLOBE API (https://www.globe.gov/globe-data/globe-api). In this study, the tree height data collected through the GO application were used to validate three CHMs across United States. The ICESat-2 and G2-2 canopy height maps were produced for 2020, while the GL canopy height map was created for 2019. We downloaded the GLOBE data from 2019 to 2021 to match the years of the three CHMs. We then overlaid all the citizen science data on the 2020 Landscape Fire and Resource Management Planning Tools (LANDFIRE) existing vegetation cover (EVC) data to investigate the data distribution. As shown in Table 1, the distribution indicates that a substantial portion of the GLOBE tree height data (∼65%) was collected in developed or urbanized areas (Developed - High Intensity, Developed - Low Intensity, Developed - Medium Intensity, Developed - Roads), while only ∼12.5% of the data were from forested regions where canopy height measurements are most relevant. This uneven distribution suggests that although the GLOBE dataset is valuable for broad citizen science engagement, it may have limited representation for large-scale forest canopy height validation without additional filtering.
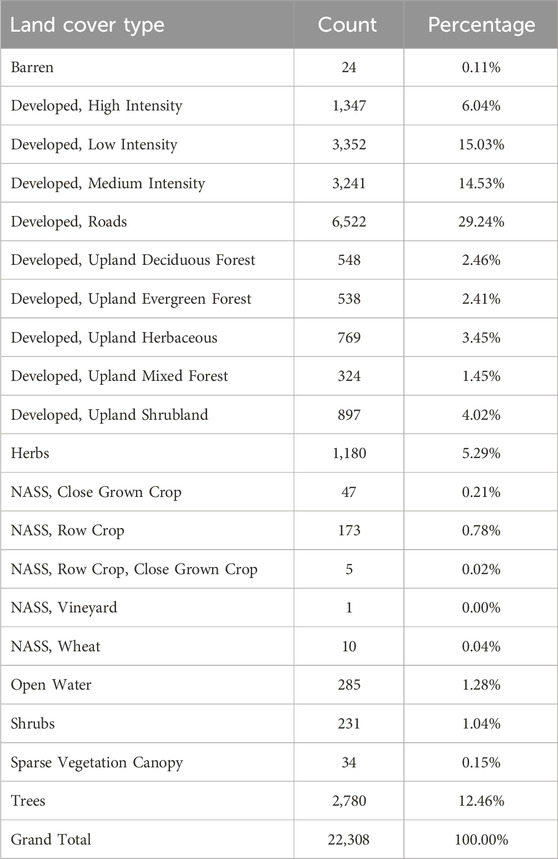
Table 1. Distribution of GLOBE data across LANDFIRE EVC data from 2020.
2.2.2 Airborne lidar data
To validate the GLOBE data, we selected three sites in the United States (Figure 1) and downloaded the airborne lidar data for each site from OpenTopography (https://opentopography.org/) for manual comparisons between the GLOBE tree heights and airborne laser scanning (ALS) CHM. The spatial resolution of the airborne lidar data is 1 m; these three ALS sites were chosen because their temporal coverages matched those of the GLOBE data, and the density of GLOBE data was higher at these sites. The GLOBE tree heights ranged from 5.06 m to 45.73 m, representing variable tree heights. The airborne lidar data were further processed to produce CHMs. Digital elevation models (DEMs) were downloaded to produce digital surface models (DSMs) using the LAS dataset to raster tool in ArcGIS Pro, and the CHMs were created by subtracting the DEMs from DSMs. We then overlapped the GLOBE data with the airborne-lidar-derived CHMs. In addition, since the GO application encourages measuring the tallest tree in a cluster of trees near the user and obtaining measurements from a distance of 7–25 m to clearly see the top and bottom of each tree, we created a buffer of 25 m for the selected trees from GLOBE data, manually identified the tallest tree within the buffer, and recorded the height of the tallest tree. Then, we compared the manually rectified tree height with the GLOBE tree height and investigated their relationship using the performance metrics detailed in Section 2.3.3.
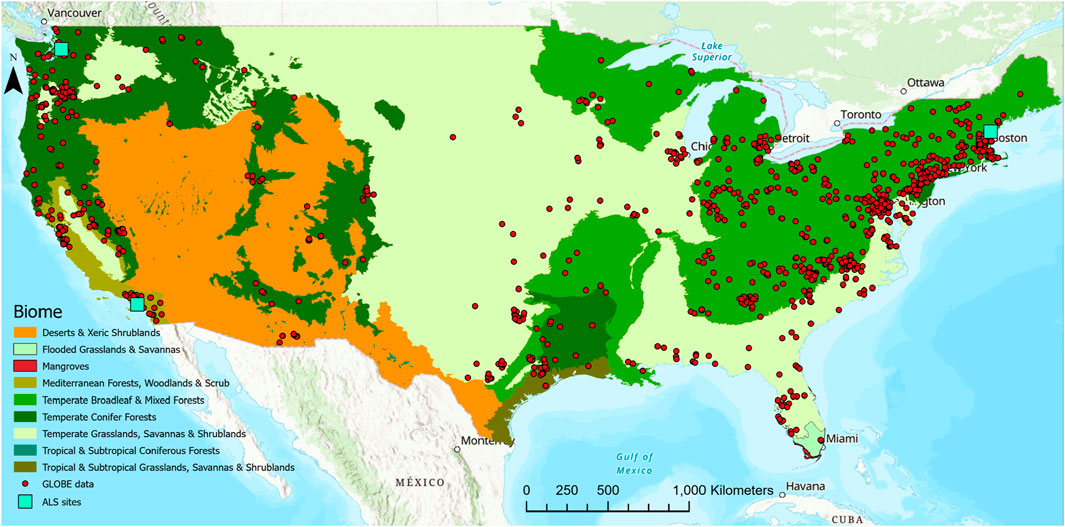
Figure 1. Nine major biomes defined in the RESOLVE Ecoregions 2017 base map showing the GLOBE tree height data and validation sites.
2.2.3 ICESat-2 canopy height map
The ICESat-2 canopy height map was modeled for the year 2020 using the ancillary Landsat, LANDFIRE, and topographic variables along with a gradient-boosted trees regression across different biomes (Malambo and Popescu, 2024). The 30-m continental canopy height map was produced across the CONUS. The fitted model achieved a general overestimation with an overall R2 value of 0.76, a mean bias of 0.1 m, and an MAE of 2.5 m on the 15% hold-out validation dataset. The CHM performed differently across the biomes (R2 = 0.49–0.73, mean bias = −0.3 to 0.8 m, MAE = 1.4–3.3 m). Independent validation datasets were also used for comparisons (airborne lidar data: R2 = 0.72, MAE = 3.9 m; NEON canopy height data: R2 = 0.67, MAE = 6.9 m), and the results showed consistent agreement across the continental United States. The produced CHM provides finer details of the canopy heights across the United States and is publicly available online for download (Malambo and Popescu, 2024).
2.2.4 GL canopy height map
The GL canopy height map was created by fusing GEDI lidar forest structure measurements with Landsat time-series data to extrapolate the sparse GEDI footprint-level canopy height data to global coverage. The GL map was provided with a spatial resolution of 30 m for the year 2019 and compared with GEDI validation data (RMSE = 6.6 m, MAE = 4.45 m, R2 = 0.62) and airborne lidar data (RMSE = 9.07 m, MAE = 6.36 m, R2 = 0.61). The global forest canopy height mapping efforts involving integration of GEDI data with optical imagery is useful for estimating carbon emissions, understanding forest dynamics, and supporting decision making for global climate change (Potapov et al., 2021).
2.2.5 GS-2 canopy height map
The GS-2 canopy height map was created by fusing the sparse height data from GEDI with dense optical satellite images from Sentinel-2 using a deep-learning model. Here, the model was used to extrapolate the canopy height to global coverage and was provided with a spatial resolution of 10 m for the year 2020. To assess the model globally, we divided the dataset according to Sentinel-2 tiles. Among the 100 km × 100 km regions defined by the Sentinel-2 tiling, 20% were retained for validation while the remaining 80% were used for model training. The RMSE across all validation samples (without height balancing) is 6.0 m with a bias of 1.3 m; this bias is a result of a slight overestimation of low canopy heights, which is a trade-off for improving the performances for tall canopies. The GS-2 map was also validated with independent airborne lidar data (RMSE = 7.9 m, bias = 1.7 m), which showed a tendency for GS-2 to overestimate the airborne lidar data in most cases. The uncertainty values were also estimated for the canopy heights, which showed that the GS-2 map improved canopy height estimates for tall vegetation and can serve as a reference for forest conservation as well as carbon modeling since it can provide important insights about forest distribution (Lang et al., 2023). To ensure consistent spatial resolution between the GS-2 map and the other two CHMs, the GS-2 map was resampled to 30 m by calculating the maximum height among the eight nearest cells.
2.3 Methods
2.3.1 Data preprocessing and filtering
The tree height data contributions from citizen science were downloaded from the GLOBE Program website through the advanced data access tool (https://datasearch.globe.gov/). The GLOBE tree height data across the United States were downloaded from 2019 to 2021 for analysis since the three spaceborne lidar-derived canopy height maps were produced for the years 2019–2020. Since the GLOBE data mainly comprises information from urban areas and our study focuses on the canopy height of forests, the LANDFIRE EVC data for the year 2020 were used to filter information that was not in the forest landscapes (Picotte et al., 2019). Moreover, since the ICESat-2 and GL CHMs have a spatial resolution of 30 m, the GS-2 map was aggregated to a spatial resolution of 30 m to ensure consistent comparisons and comparability with other map products and airborne lidar data. Then, we extracted the canopy heights of the three maps for locations that coincided with the GLOBE point data to investigate the relationships. To exclude outliers from the analysis, we further filtered the trees by height. Then, we calculated the 2nd and 98th percentiles of the three spaceborne lidar-derived CHMs to represent the minimum and maximum tree heights, respectively. If the tree heights are lower than the minimum or higher than the maximum values, the data points were excluded (Figure 2).
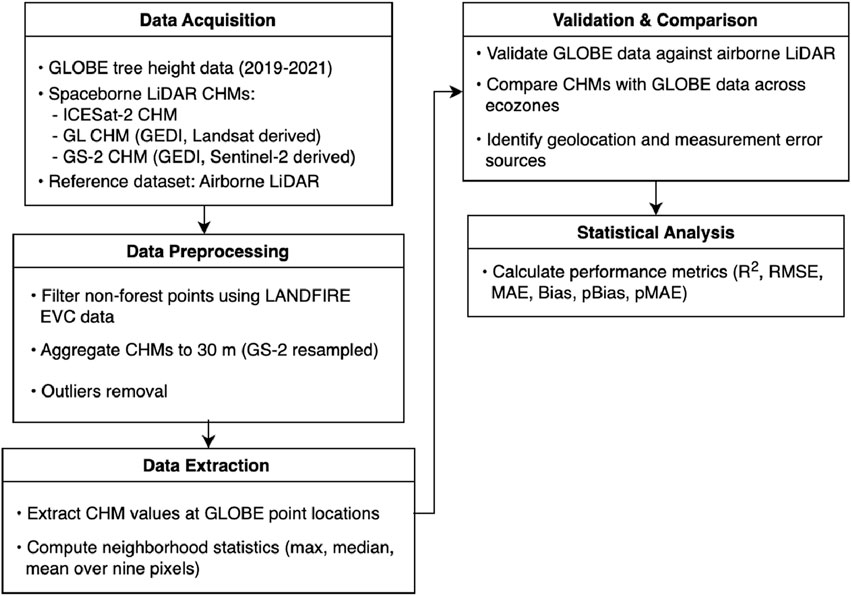
Figure 2. Flowchart of the procedures in this study.
2.3.2 Validation of spaceborne lidar-derived canopy height maps using GLOBE tree heights
To evaluate the performances of the three CHMs across the CONUS over different ecozones, we used the nine major biomes defined in the RESOLVE Ecoregions 2017 base map (Dinerstein et al., 2017) to correlate the GLOBE data with the spaceborne lidar-derived maps across the biomes (Figure 1). Then, performance metrics such as the coefficient of determination (R2) and RMSE were calculated to investigate the relationships between the citizen science data and spaceborne lidar-derived CHMs. Since the GLOBE data have geolocation errors, we computed the maximum, median, and mean values of blocks of nine pixels centered about the given pixels in the three maps for comparisons with the three CHMs and for investigating the statistical metric with the highest correlation between the GLOBE data and three CHMs.
2.3.3 CHM evaluations
We assessed the relationships between the GLOBE data and three CHMs with reference validation datasets using R2, RMSE (Willmott et al., 1985), mean bias (bias), and MAE as the performance metrics as well as the percent bias (pBias) and percent MAE (pMAE) as the relative performance metrics, as shown in Equations 1–6:
where
3 Results
3.1 Validation of GLOBE data with reference airborne lidar canopy heights
We validated GLOBE data with the reference airborne-lidar-derived canopy heights to determine the GLOBE tree height measurement accuracies. Based on our analysis, the R2 for the GLOBE data versus ALS canopy heights is 0.14 and RMSE is 10.69 m; here, the GLOBE data showed a tendency to underestimate tree heights (bias = −1.82 m, pBias = −10.26%) compared to ALS canopy heights. The MAE and pMAE of the GLOBE data were 9.08 m and 51.13%, respectively (Figure 3). The results showed that the general agreement between the GLOBE tree heights and ALS canopy heights were not high even after manual calibration (R2 = 0.14), which led to the conclusion that the GLOBE data have low general agreement with the reference ALS data.
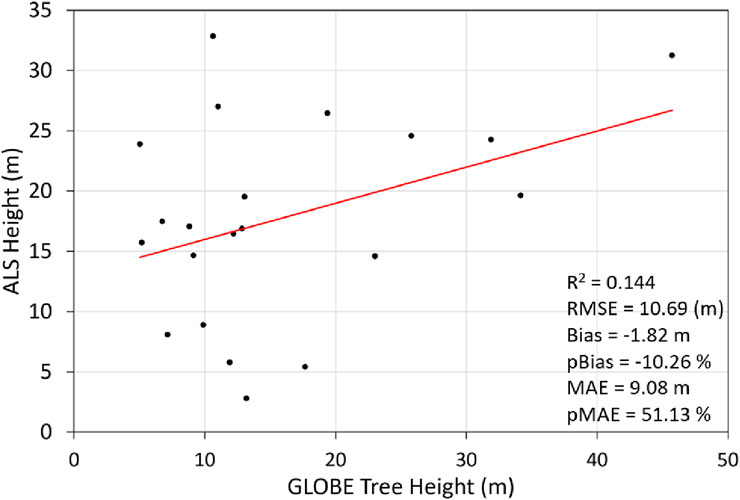
Figure 3. Validation of the GLOBE tree heights against airborne lidar data.
3.2 Validation of spaceborne lidar-derived canopy height maps with GLOBE tree heights
Figure 4 shows the distribution of the GLOBE tree height data across the CONUS for all land cover types (Figure 4a) and forests (Figure 4b) for the years 2019–2021. The descriptive statistics were computed for data from all land cover types and forests. For data from all land cover types across the CONUS, the minimum, maximum, mean, and standard deviation values of the tree heights are 0 m, 98.3 m, 15.4 m, and 9.5 m, respectively (Figure 4a). For data from forests, the minimum, maximum, mean, and standard deviation values of the tree heights are 0.01 m, 98.3 m, 19.6 m, and 11.4 m, respectively (Figure 4b). According to the Forest Inventory and Analysis definition, a tree is a woody perennial plant with a minimum height of 15 feet (4.56 m) at maturity. Moreover, the heights of most trees do not exceed 60 m, except for the trees in California. Thus, there are some outliers in the data. Therefore, a further height filtering process was implemented to ensure that only trees with heights less than 60 m were included in the analysis. The detailed filtering criteria are described in Section 2.3.1.
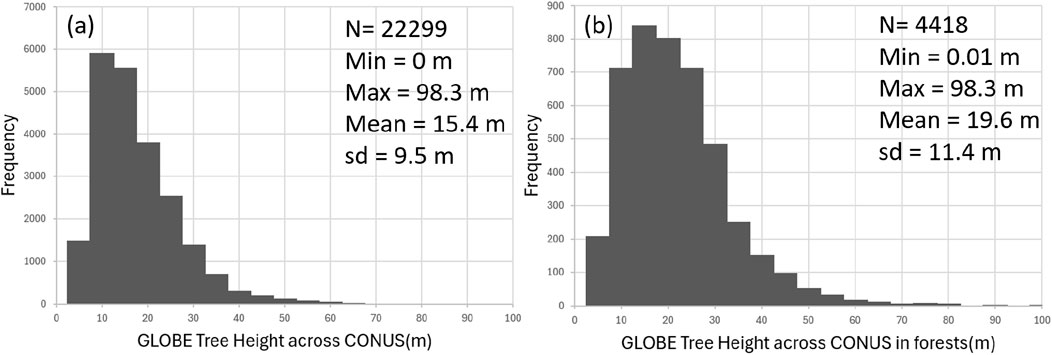
Figure 4. Distributions of the GLOBE tree height data across the contiguous United States (CONUS) for (a) all land cover types and (b) forests.
Figure 5 shows the overall performances of the three spaceborne lidar-derived CHMs for GLOBE data across the CONUS. The R2 values for the three maps are low (GL: 0.08; GS-2: 0.17; ICESat-2: 0.11), and the GS-2 CHM has the highest overall agreement with the GLOBE data. We also evaluated the performances of the three maps for the GLOBE data across biomes in the CONUS (Figures 6–8). The model performances varied across biomes (GL: R2 = 0–0.33; GS-2: R2 = 0.04–0.33; ICESat-2: R2 = 0.02–0.30). We note that temperate broadleaf and mixed forests had relatively lower R2 values while temperate grasslands, savannas, and shrublands had relatively higher R2 values across the biomes. These differences between land cover types may be attributed to scale mismatches because measuring the tallest tree over a land surface with low canopy height (e.g., grasslands) is inherently easier than that over a surface with a larger canopy height (e.g., densely forested areas). This could potentially bias the results and/or conclusions.
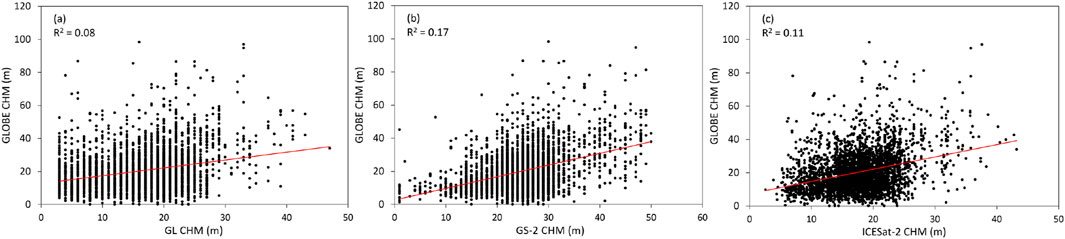
Figure 5. Overall model performances of the three spaceborne lidar-derived canopy height models (CHMs): (a) GL, (b) GS-2, and (c) ICESat-2.
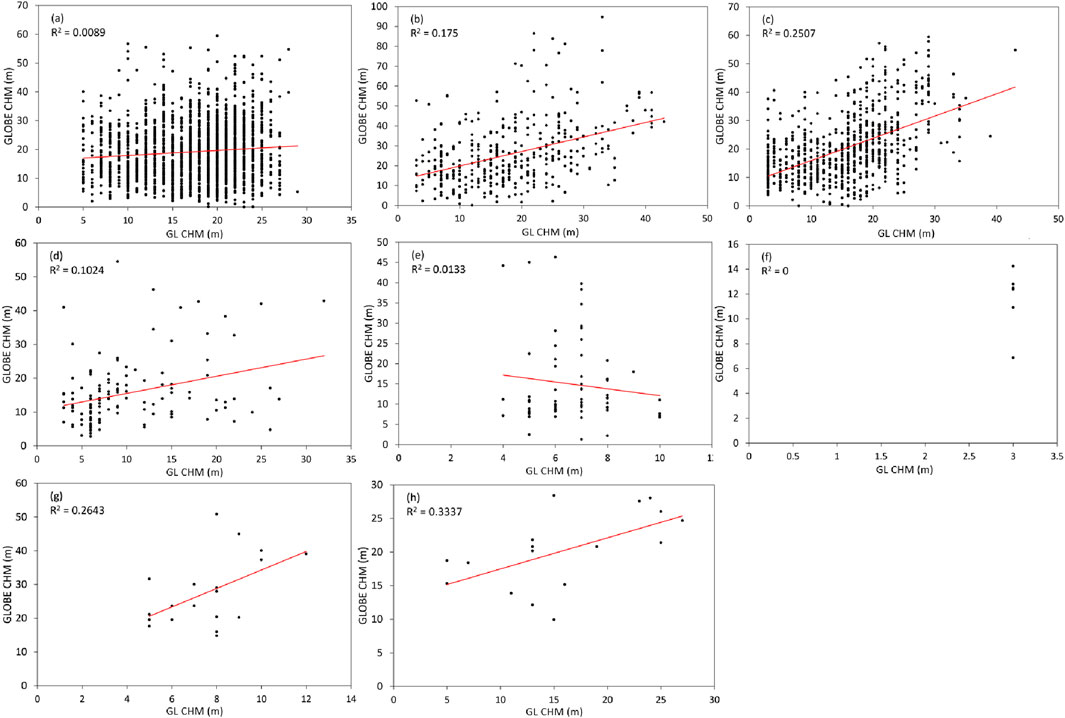
Figure 6. Validation of the GL CHM and GLOBE tree height results based on biome types: (a) temperate broadleaf and mixed forests; (b) temperate coniferous forests; (c) temperate grasslands, savannas, and shrublands; (d) Mediterranean forests, woodlands, and scrub; (e) deserts and xeric shrublands; (f) flooded grasslands and savannas; (g) tropical and subtropical coniferous forests; (h) tropical and subtropical grasslands, savannas, and shrublands.
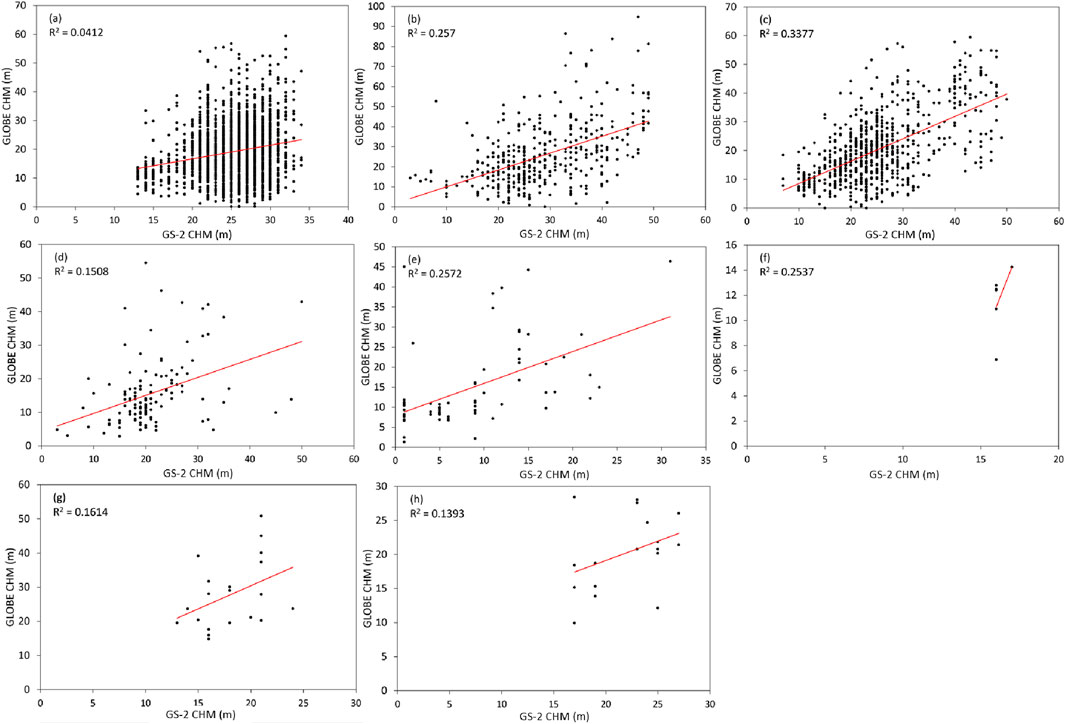
Figure 7. Validation of the GS-2 CHM and GLOBE tree height results by biome types: (a) temperate broadleaf and mixed forests; (b) temperate coniferous forests; (c) temperate grasslands, savannas, and shrublands; (d) Mediterranean forests, woodlands, and scrub; (e) deserts and xeric shrublands; (f) flooded grasslands and savannas; (g) tropical and subtropical coniferous forests; (h) tropical and subtropical grasslands, savannas, and shrublands.
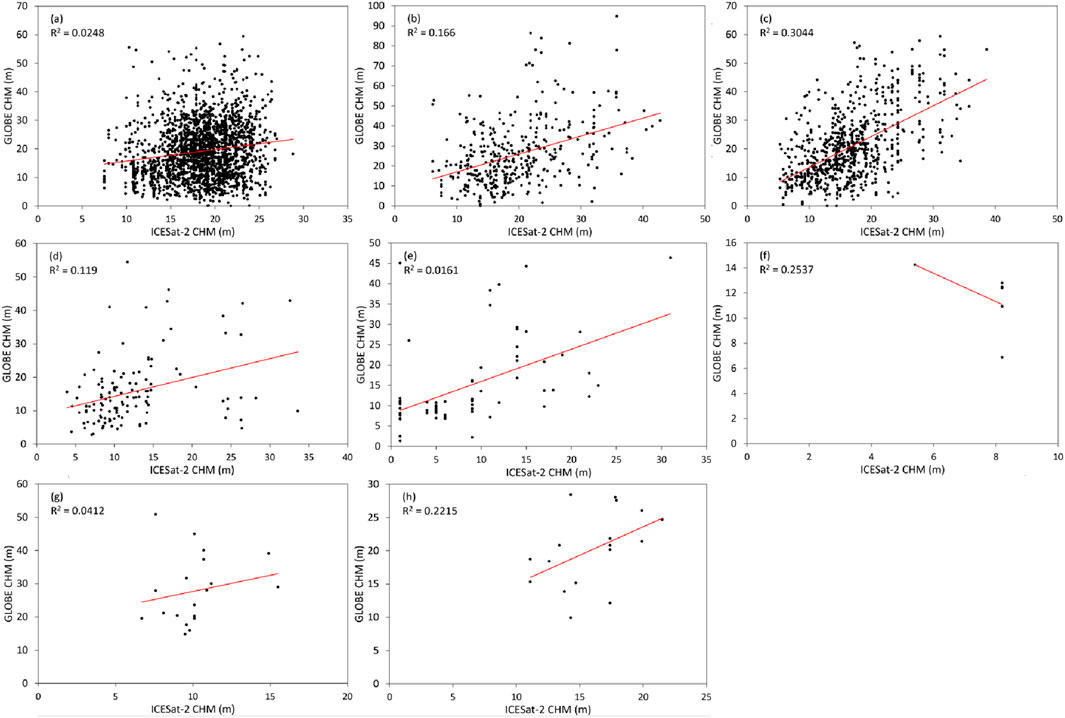
Figure 8. Validation of the ICESat-2 CHM and GLOBE tree height results by biome types: (a) temperate broadleaf and mixed forests; (b) temperate coniferous forests; (c) temperate grasslands, savannas, and shrublands; (d) Mediterranean forests, woodlands, and scrub; (e) deserts and xeric shrublands; (f) flooded grasslands and savannas; (g) tropical and subtropical coniferous forests; (h) tropical and subtropical grasslands, savannas, and shrublands.
Since there are geolocation errors in the GLOBE data, the maximum, median, and mean values of the nine pixels centered around a given pixel were computed for the three maps for comparison with the GLOBE data and for investigating the relationships between the statistical metrics and citizen science data; this allowed us to identify the metric having the highest correlation with the GLOBE data so as to improve the height validation results (Figure 9). However, our findings show that there is no statistical metric that has a significantly high R2 value for the GLOBE data among the three CHMs. Thus, the R2 values for the maximum, mean, and median heights of each canopy height product are almost similar.
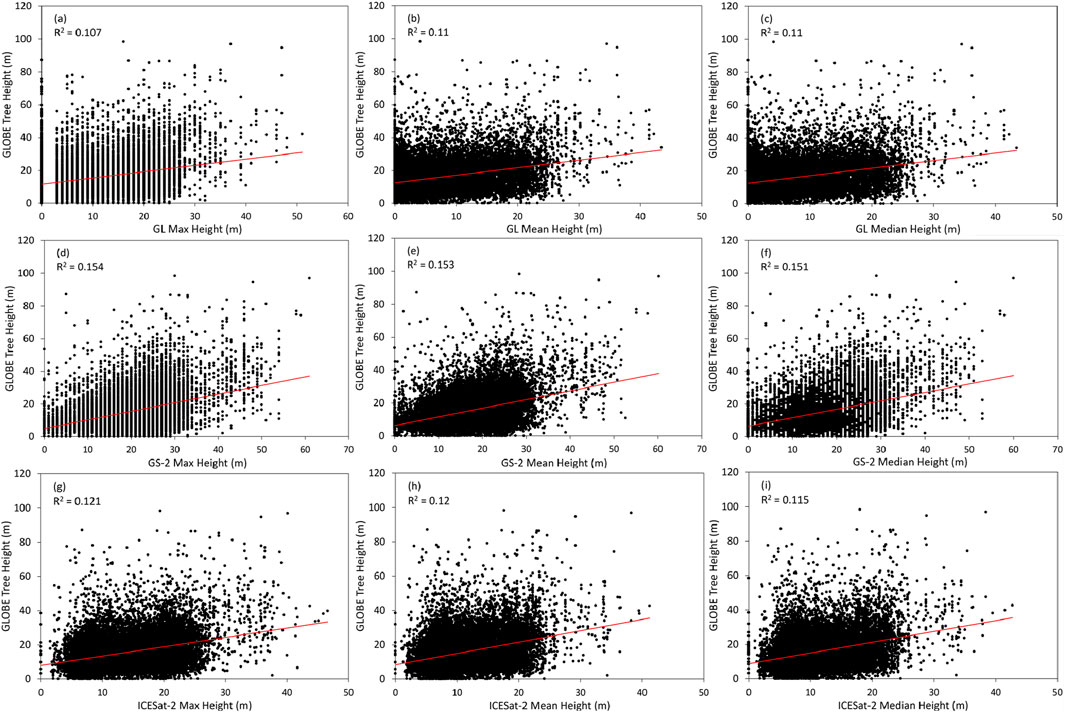
Figure 9. Relationships between the maximum (left), mean (middle), and median (right) tree heights for the nine pixels centered around a given pixel in the (a–c) GL; (d–f) GS-2; (g–i) ICESat-2 CHMs and GLOBE tree heights.
3.3 GLOBE tree height location accuracy
The GLOBE application records the geolocation accuracies of the measured trees as tree height location accuracies in meters. The tree height location accuracy is the estimated accuracy of the calculated measurement location in meters, as determined by the GPS in the measuring device. There is an option in the GO trees tool that allows an observer to use a touchscreen map to pinpoint the exact location of a tree prior to submitting its observation to the GLOBE database in the event that the device GPS cannot confirm the exact location of the observed tree. This option is most likely underutilized prior to observation submission, which could potentially lead to tree height location inaccuracies. Table 2 shows the distribution of the tree height location accuracy data, where 94% of the data are confirmed to be within 100 m of the tree height location accuracy, with the reported location accuracy ranging from 0 to 9,100 m. Since most of the data are within the location accuracy of 100 m and our goal was to select trees with high location accuracies, GLOBE data with location accuracies of 0–25 m and 0–100 m were selected (Figure 10) to validate the general agreement between the three canopy height maps and GLOBE data filtered by location accuracy. Figure 11 shows the validation results between the three lidar-derived canopy height maps and GLOBE data for location accuracies of 0–25 m. Compared to the unfiltered GLOBE data (Figure 5), the R2 values of the GL, GS-2, and ICESat-2 CHMs increased by 40%, 29%, and 6.9%, respectively (R2: GL = 0.112, GS-2 = 0.219, ICESat-2 = 0.118). Figure 12 shows the validation results between the three canopy height maps and GLOBE data for location accuracies of 0–100 m. Compared to the unfiltered GLOBE data (Figure 5), the R2 values of the GL, GS-2, and ICESat-2 CHMs increased by 10%, 4.8%, and 4.9%, respectively (R2: GL = 0.09, GS-2 = 0.18, ICESat-2 = 0.12). However, the location accuracies of the GLOBE data for 0–100 m did not improve notably from those for 0–25 m. Therefore, we suggest using data with location accuracies between 0 and 25 m for more accurate validation.
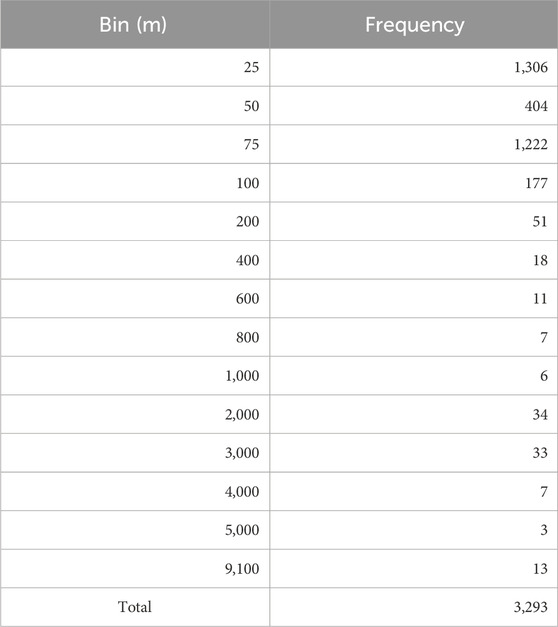
Table 2. Distribution of the tree height location accuracies (in meters).
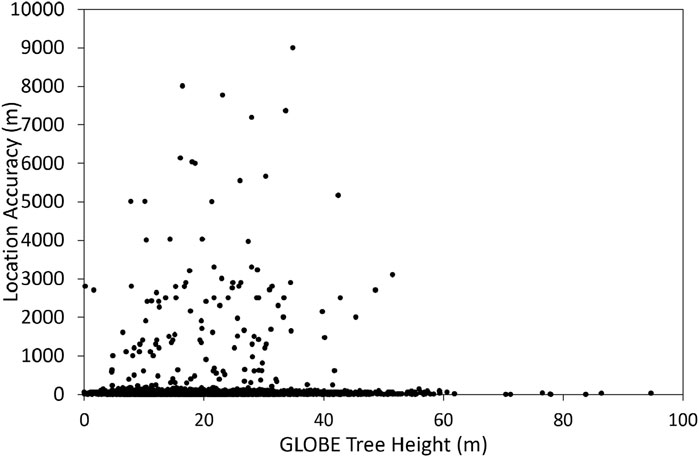
Figure 10. Scatter plot of the GLOBE tree height data with location accuracies of 0–100 m.
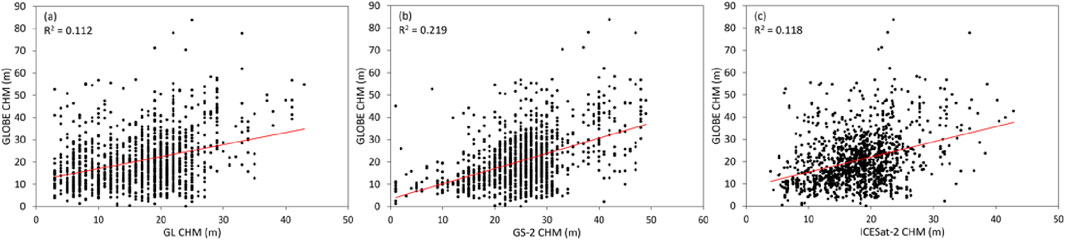
Figure 11. Validation results of the overall model performances of the three spaceborne lidar-derived CHMs for GLOBE data with location accuracies of 0–25 m: (a) GL; (b) GS-2; (c) ICESat-2.
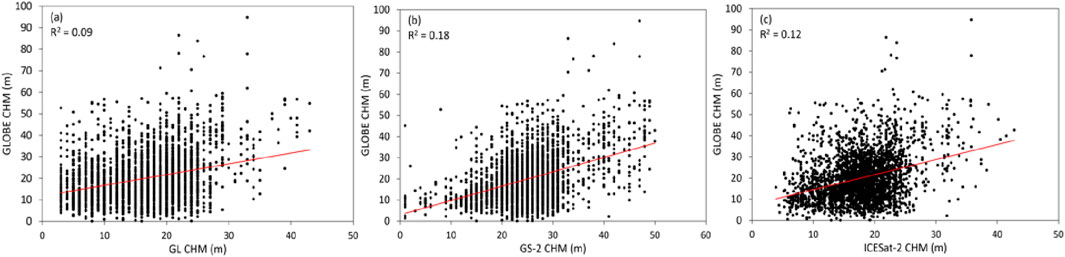
Figure 12. Validation results of the overall model performances of the three spaceborne lidar-derived CHMs for GLOBE data with location accuracies of 0–100 m: (a) GL, (b) GS-2, and (c) ICESat-2.
4 Discussion
4.1 GLOBE data geolocation errors
Enterkine et al. (2022) reported that the data location accuracy should be addressed before comparisons to ensure alignment between the GLOBE tree height and spaceborne lidar-derived data. In our study, we observed this issue when validating the GLOBE tree height and ALS data. The GLOBE data include geolocation information for each data point. However, we were unable to identify the exact tree measured by the users when there were multiple trees in the vicinity. Therefore, we performed the buffer analysis first in an attempt to identify the exact trees being measured and validate the GLOBE tree heights. We were also unable to pinpoint the trees measured by the users when there were multiple trees nearby. This uncertainty is another source of error in the data. Since the citizen scientists used different devices for the measurements, there may also be location errors caused by these different electronic devices. In addition, human measurement errors could also affect the data quality and accuracy. Given these errors, the geolocation errors could vary among different data points. To minimize such geolocation errors, Enterkine et al. (2022) recommended the following: (1) tree height observations should be avoided in locations where the treetops are within 2.5 m of one another as it may be challenging to distinguish individual trees in such settings; (2) users should prioritize measurements of prominent or easily identifiable trees, such as large isolated individuals or those that clearly stand above the surrounding canopy.
4.2 Variability in agreement across biomes
The observed differences in correlations across biome types (Figures 6–8) are likely influenced by variations in the vegetation structures, canopy complexities, and land cover heterogeneities. For example, the higher correlations observed in temperate grasslands, savannas, and shrublands may be attributed to their relatively simple and open vegetation structures, where identifying and measuring the tallest individual trees are more straightforward for citizen scientists. In contrast, densely forested biomes such as temperate broadleaf and mixed forests exhibit lower correlations, likely owing to the more complex vertical canopy structures, overlapping crowns, and potential misalignment between the ground-based point measurements and spatial averaging inherent in gridded CHMs. Among the three models evaluated herein, GS-2 generally exhibited the highest overall agreement with GLOBE data, especially after applying the location accuracy filter (0–25 m), for which the R2 was 0.22.
It is also important to acknowledge that the spaceborne lidar-derived canopy height products (ICESat-2, GL, and GS-2) are subject to their own sources of error and uncertainty. For ICESat-2, there may be errors arising from photon noise, geolocation uncertainties, terrain slope effects, and lower sensitivity of the instrument to densely vegetated areas, which can affect differentiation between the ground and canopy surface. For GEDI-based products, there may be sampling limitations due to the sparse nature of the GEDI footprint, which could introduce challenges in representing heterogeneous landscapes, particularly in regions with complex canopy structures or steep topography. Furthermore, the process of fusing GEDI data with optical imagery (Landsat or Sentinel-2) for wall-to-wall coverage can introduce additional uncertainties related to sensor resolution differences, cloud contamination, and model generalization errors in the fusion algorithms. Hence, discrepancies observed between the GLOBE data and these spaceborne products are not solely attributable to citizen science data limitations but can also reflect the inherent uncertainties of the satellite-derived CHMs themselves.
4.3 Potential of citizen science data
GLOBE data are prone to geolocation and tree height measurement errors. As noted earlier, these errors may arise from different sources, such as geolocation errors owing to the use of different cellphone devices, user measurement errors, or missing information for the true trees measured. Enterkine et al. (2022) mentioned that the stride length of the user is the main source of error when measuring the tree height. When the users are farther away from the tree, errors due to stride length would have a greater impact on the tree height estimation. Therefore, the application suggests that users measure the trees within 50 steps and validate their stride length or measure the actual distance to the tree rather than using the values estimated by the application. Considering the potential errors mentioned above, GLOBE data should be used with care when validating spaceborne lidar-derived CHMs. Furthermore, inconsistent spatial resolution between the GLOBE data and satellite-based data should be taken into account when comparing maps with different spatial resolutions.
Beyond tree height measurements, citizen science datasets such as those collected through the GLOBE Observer program hold significant potential for various other environmental and ecological applications. These include monitoring land cover changes, assessing urban heat island effects, documenting phenological events, and tracking invasive species. The broad spatial and temporal coverages provided by citizen scientists can complement professional monitoring networks. However, as with tree height data, careful attention to data quality, standardized protocols, and validation with independent reference datasets are essential to maximize the scientific value of these observations across different disciplines.
5 Conclusion
In the present work, we evaluated the accuracy of citizen science data and demonstrated the utilization of such data to validate spaceborne lidar-derived canopy height maps with different spatial resolutions. This study is a pivotal effort on using citizen science data as a proxy to validate spaceborne lidar-derived canopy height maps. Although the overall accuracy of the GLOBE data was not high compared to the ALS canopy heights (R2 = 0.14), we showcased the data filtering process and identified potential errors in the GLOBE tree height data, which can serve as precious insights for future researchers who would consider integrating GLOBE citizen science data in their research. Since there are inherent geolocation errors in the GLOBE data and these GLOBE data are mainly located in urban settings, we suggest that users of the GLOBE Observer application could measure trees in natural cover types outside of the built environment for better characterization of the average vegetation heights in multiple ecozones across the globe. We also suggest that users submit data with location accuracies between 0 and 25 m for more accurate validation results, in addition to utilizing the GO tree tool touchscreen option to increase the location accuracies of the trees observed.
Data availability statement
The original contributions presented in the study are included in the article/supplementary material, further inquiries can be directed to the corresponding author.
Author contributions
M-KL: conceptualization, methodology, investigation, validation, writing – original draft, visualization, formal analysis, and data curation. SP: writing – review and editing, supervision, project administration, resources, conceptualization, investigation, and funding acquisition. BC: writing – review and editing.
Funding
The author(s) declare that financial support was received for the research and/or publication of this article. This research was funded by NASA ICESat-2 Science Team (Grant #NNH22ZDA001N).
Conflict of interest
Author BC was employed by Global Science and Technology, Inc.
The remaining authors declare that the research was conducted in the absence of any commercial or financial relationships that could be construed as a potential conflict of interest.
Generative AI statement
The author(s) declare that no Generative AI was used in the creation of this manuscript.
Publisher’s note
All claims expressed in this article are solely those of the authors and do not necessarily represent those of their affiliated organizations, or those of the publisher, the editors and the reviewers. Any product that may be evaluated in this article, or claim that may be made by its manufacturer, is not guaranteed or endorsed by the publisher.
References
Alvites, C., O’Sullivan, H., Francini, S., Marchetti, M., Santopuoli, G., Chirici, G., et al. (2024). High-resolution canopy height mapping: integrating NASA’s global ecosystem dynamics investigation (GEDI) with multi-source remote sensing data. Remote Sens. 16 (7), 1281. doi:10.3390/rs16071281
Campbell, B. A. (2021). ICESat-2 and the trees around the GLOBE student research campaign: looking at earth's tree height, one tree at a time. Acta Astronaut. 182, 203–207. doi:10.1016/j.actaastro.2021.02.002
Dinerstein, E., Olson, D., Joshi, A., Vynne, C., Burgess, N. D., Wikramanayake, E., et al. (2017). An ecoregion-based approach to protecting half the terrestrial realm. BioScience 67 (6), 534–545. doi:10.1093/biosci/bix014
Dubayah, R., Blair, J. B., Goetz, S., Fatoyinbo, L., Hansen, M., Healey, S., et al. (2020a). The global ecosystem dynamics investigation: high-Resolution laser ranging of the Earth’s forests and topography. Sci. Remote Sens. 1, 100002. doi:10.1016/j.srs.2020.100002
Dubayah, R., Hofton, M., Blair, J., Armston, J., Tang, H., and Luthcke, S. (2020b). GEDI L2A elevation and height metrics data global footprint level V002. NASA EOSDIS Land Process. DAAC. doi:10.5067/GEDI/GEDI02_A.002
Dujardin, S., Stas, M., Van Eupen, C., Aerts, R., Hendrickx, M., Delcloo, A. W., et al. (2022). Mapping abundance distributions of allergenic tree species in urbanized landscapes: a nation-wide study for Belgium using forest inventory and citizen science data. Landsc. Urban Plan. 218, 104286. doi:10.1016/j.landurbplan.2021.104286
Enterkine, J., Campbell, B. A., Kohl, H., Glenn, N. F., Weaver, K., Overoye, D., et al. (2022). The potential of citizen science data to complement satellite and airborne lidar tree height measurements: lessons from the GLOBE program. Environ. Res. Lett. 17 (7), 075003. doi:10.1088/1748-9326/ac77a2
Lang, N., Jetz, W., Schindler, K., and Wegner, J. D. (2023). A high-resolution canopy height model of the Earth. Nat. Ecol. Evol. 7 (11), 1778–1789. doi:10.1038/s41559-023-02206-6
Liu, M., and Popescu, S. (2022). Estimation of biomass burning emissions by integrating ICESat-2, Landsat 8, and Sentinel-1 data. Remote Sens. Environ. 280, 113172. doi:10.1016/j.rse.2022.113172
Malambo, L., and Popescu, S. (2024). Mapping vegetation canopy height across the contiguous United States using ICESat-2 and ancillary datasets. Remote Sens. Environ. 309, 114226. doi:10.1016/j.rse.2024.114226
Malambo, L., Popescu, S., and Liu, M. (2022). Landsat-scale regional forest canopy height mapping using icesat-2 along-track heights: case study of eastern Texas. Remote Sens. 15 (1), 1. doi:10.3390/rs15010001
Malambo, L., and Popescu, S. C. (2021). Assessing the agreement of ICESat-2 terrain and canopy height with airborne lidar over US ecozones. Remote Sens. Environ. 266, 112711. doi:10.1016/j.rse.2021.112711
Markus, T., Neumann, T., Martino, A., Abdalati, W., Brunt, K., Csatho, B., et al. (2017). The ice, cloud, and land elevation Satellite-2 (ICESat-2): science requirements, concept, and implementation. Remote Sens. Environ. 190, 260–273. doi:10.1016/j.rse.2016.12.029
Migliavacca, M., Musavi, T., Mahecha, M. D., Nelson, J. A., Knauer, J., Baldocchi, D. D., et al. (2021). The three major axes of terrestrial ecosystem function. Nature 598 (7881), 468–472. doi:10.1038/s41586-021-03939-9
Molinier, M., López-Sánchez, C. A., Toivanen, T., Korpela, I., Corral-Rivas, J. J., Tergujeff, R., et al. (2016). Relasphone—Mobile and participative in situ forest biomass measurements supporting satellite image mapping. Remote Sens. 8 (10), 869. doi:10.3390/rs8100869
Nandy, S., Srinet, R., and Padalia, H. (2021). Mapping forest height and aboveground biomass by integrating ICESat-2, Sentinel-1 and Sentinel-2 data using random forest algorithm in northwest himalayan foothills of India. Geophys. Res. Lett. 48 (14), e2021GL093799. doi:10.1029/2021gl093799
Narine, L. L., Popescu, S. C., and Malambo, L. (2020). Using ICESat-2 to estimate and map forest aboveground biomass: a first example. Remote Sens. 12 (11), 1824. doi:10.3390/rs12111824
Oswalt, S. N., Smith, W. B., Miles, P. D., and Pugh, S. A. (2019). Forest resources of the United States, 2017. Washington, DC: U.S: General Technical Report-US Department of Agriculture, Forest Service. Forest Service.
Picotte, J. J., Dockter, D., Long, J., Tolk, B., Davidson, A., and Peterson, B. (2019). LANDFIRE remap prototype mapping effort: developing a new framework for mapping vegetation classification, change, and structure. Fire 2 (2), 35. doi:10.3390/fire2020035
Potapov, P., Li, X., Hernandez-Serna, A., Tyukavina, A., Hansen, M. C., Kommareddy, A., et al. (2021). Mapping global forest canopy height through integration of GEDI and landsat data. Remote Sens. Environ. 253, 112165. doi:10.1016/j.rse.2020.112165
Qadeer, A., Shakir, M., Wang, L., and Talha, S. M. (2024). Evaluating machine learning approaches for aboveground biomass prediction in fragmented high-elevated forests using multi-sensor satellite data. Remote Sens. Appl. Soc. Environ. 36, 101291. doi:10.1016/j.rsase.2024.101291
Roman, L. A., Scharenbroch, B. C., Östberg, J. P., Mueller, L. S., Henning, J. G., Koeser, A. K., et al. (2017). Data quality in citizen science urban tree inventories. Urban For. Urban Green. 22, 124–135. doi:10.1016/j.ufug.2017.02.001
Schlund, M., Wenzel, A., Camarretta, N., Stiegler, C., and Erasmi, S. (2023). Vegetation canopy height estimation in dynamic tropical landscapes with TanDEM-X supported by GEDI data. Methods Ecol. Evol. 14 (7), 1639–1656. doi:10.1111/2041-210x.13933
Willmott, C. J., Ackleson, S. G., Davis, R. E., Feddema, J. J., Klink, K. M., Legates, D. R., et al. (1985). Statistics for the evaluation and comparison of models. J. Geophys. Res. Oceans 90 (C5), 8995–9005. doi:10.1029/jc090ic05p08995
Keywords: citizen science, GLOBE, ICESat-2, GEDI, canopy height model, spaceborne lidar-derived maps
Citation: Lu M-K, Popescu SC and Campbell BA (2025) Use of GLOBE observer citizen science data to validate continental-scale canopy height maps derived from ICESat-2 and GEDI. Front. Environ. Sci. 13:1635707. doi: 10.3389/fenvs.2025.1635707
Received: 26 May 2025; Accepted: 07 July 2025;
Published: 29 July 2025.
Edited by:
Philemon Tsele, University of Pretoria, South AfricaReviewed by:
Laven Naidoo, University of the Witwatersrand, South AfricaMcebisi Qabaqaba, University of Pretoria, South Africa
Copyright © 2025 Lu, Popescu and Campbell. This is an open-access article distributed under the terms of the Creative Commons Attribution License (CC BY). The use, distribution or reproduction in other forums is permitted, provided the original author(s) and the copyright owner(s) are credited and that the original publication in this journal is cited, in accordance with accepted academic practice. No use, distribution or reproduction is permitted which does not comply with these terms.
*Correspondence: Mei-Kuei Lu, bWtsdUB0YW11LmVkdQ==; Sorin C. Popescu, U29yaW4uUG9wZXNjdUBhZy50YW11LmVkdQ==; Brian A. Campbell, YnJpYW4uYS5jYW1wYmVsbEBuYXNhLmdvdg==