 Caixia Ding
 Zhongfa Zhou1,2,3*
- 1School of Karst Science, Guizhou Normal University, Guiyang, China
- 2The State Key Laboratory Incubation Base for Karst Mountain Ecology Environment of Guizhou Province, Guizhou Normal University, Guiyang, China
- 3School of Geography and Environmental Science, Guizhou Normal University, Guiyang, China
Land cover change is an important cause of carbon source/sink changes in terrestrial ecosystems. Studying the relationship between land use transition and carbon sources/sinks is of great significance for optimizing regional land use planning, achieving sustainable development, and the “double carbon” goals. Land cover change significantly impacts carbon sources and sinks in terrestrial ecosystems, making the study of land use transition crucial for optimizing regional planning and achieving sustainable development and carbon neutrality goals. This research analyzes carbon effects of land use changes in Pingzhai Reservoir watershed (2010–2020) using carbon effect coefficient method, and employs PLUS model to simulate 2030 scenarios (natural development, cropland protection, economic priority). Results show net carbon emissions increased 64.92% (from 121,558.73 to 200,477.90 tons), with built-up land becoming the main carbon source (167% growth) while forests contributed over 90% of carbon sequestration. All scenarios predict rising emissions by 2030, suggesting the need to control production land expansion, accelerate agricultural innovation, and promote low-carbon development. The study applies PLUS model to karst mountain areas, quantifying land use-carbon emission relationships through scenario simulations to support ecological conservation and low-carbon strategies in fragile regions.
1 Introduction
Global warming and other environmental issues have led humanity to start paying attention to the factors that cause global warming and increased carbon emissions. Research has found that changes in Land Use/Cover (LULC) are one of the important reasons for the increase in carbon emissions (Houghton and Hackler, 2003; Houghton, 1999), and they also play a role in the process of climate change and carbon cycling (Lin et al., 2021). Current LULC research focuses on accurately identifying and tracking land cover changes to understand ecosystems and support decisions (Prasad et al., 2022). Machine learning and deep learning now boost analysis capabilities in this field (Ebenezer and Manohar, 2024; Azedou et al., 2023). Studies show LULC research is becoming more diverse (Jat Baloch et al., 2022; Iqbal et al., 2024). This trend makes studies more detailed and smart. Better land classification improves carbon source/sink estimates. Recent years have witnessed abundant research achievements both domestically and internationally regarding LULC and carbon emissions, with studies primarily focusing on the changing trends of land use-related carbon emissions (Yali et al., 2023; Tian et al., 2022; Yang and Li, 2022; Pu et al., 2023), and the influencing factors of LULC carbon emissions (Lijing et al., 2024; Chong et al., 2024; Yamei and Zhang, 2024; Yajuan et al., 2024). Methodologically, the land use carbon emission coefficient method has been widely adopted to estimate carbon emissions/sequestration based on land use types and their corresponding carbon emission/absorption characteristics (Tian et al., 2022). Pu et al. (Pu et al., 2023) applied this approach to reveal the spatiotemporal evolution patterns of land use carbon emissions across 20 Chinese urban agglomerations from 1990 to 2019, providing crucial data support for regional carbon reduction efforts. However, the impact mechanisms of land use change on carbon emissions exhibit complex regional variations globally, necessitating further exploration. Consequently, comprehensive analysis of land use carbon emissions and their driving mechanisms serves as a scientific basis for formulating regional carbon emission strategies and proves essential for achieving low-carbon development (Yang and Li, 2022).
As the world’s largest developing country, China actively addresses climate change while maintaining rapid economic growth. In 2020, the Chinese government announced its “Dual Carbon” goals: peaking carbon emissions by 2030 and achieving carbon neutrality by 2060. These ambitious targets demand enhanced carbon sequestration capacity and precise emissions control across China’s territorial spaces. While existing studies have used CA-Markov and ANN-CA models to predict land use changes and carbon storage (Yang et al., 2023; Nabikandi et al., 2024; Huang et al., 2021), these models have limitations in identifying complex driving factors and simulating fragmented land use patterns. Due to frequent human activities and complex planning and Construction, urban environmental patches usually show significant fragmentation characteristics (Xueliang et al., 2023). Moreover, current research predominantly focuses on terrestrial ecosystems (Wenwen et al., 2022; Ruei-Yuan et al., 2023; Jiahong and Ruei-Yuan, 2024; Wei et al., 2023; Rong et al., 2022), while largely neglecting the role of aquatic systems—particularly artificial reservoirs—in regional carbon cycles. This represents a critical knowledge gap that must be addressed to achieve carbon neutrality goals.
Reservoirs formed by river damming represent artificially modified ecosystems that significantly alter original land use/cover types and carbon cycling pathways. The flooding of vegetation and soils releases stored carbon as CO2 and CH4 through decomposition. Simultaneously, phytoplankton photosynthesis captures carbon, potentially turning some reservoirs into temporary carbon sinks during certain periods (Wang et al., 2021; Wen, 2023). Accurately quantifying reservoirs’ carbon source/sink effects helps clarify aquatic systems’ role in global carbon cycles and informs water management and ecological policies. As the key water source for Guizhou’s Qianzhong Water Diversion Project, Pingzhai Reservoir has dramatically altered its watershed’s land use patterns. The impoundment significantly expanded water areas, triggered land reallocation due to population relocation, and transformed surrounding farmlands and forests. While crucial for regional water supply and irrigation, these changes necessitate urgent assessment of the reservoir’s ecological impacts. Current research on Pingzhai Reservoir has primarily focused on hydrochemical characteristics and water quality monitoring (Kong et al., 2021; Wang et al., 2023; Zou et al., 2023), leaving significant gaps in carbon source/sink analysis. As a typical reservoir in karst mountainous areas, Pingzhai’s unique features—including widespread carbonate rocks, complex hydrological conditions, and intensive human activities—make it an ideal site for studying carbon dynamics in artificial reservoirs.
This study systematically evaluates the carbon source/sink effects of six LULC categories (cropland, forest land, grassland, built-up land, water bodies, and unused land) in the Pingzhai Reservoir basin. Leveraging the PLUS model’s adaptive inertia competition mechanism and multi-factor potential calculation capabilities, we simulate 2030 LULC change scenarios and associated carbon dynamics. Compared to conventional models, PLUS demonstrates superior performance in simulating fragmented LULC patterns, particularly suitable for the complex karst terrain. The results will establish a comprehensive carbon accounting framework for Pingzhai Reservoir, providing scientific support for regional spatial planning and ecological conservation, while offering new methodological insights for carbon dynamics research in similar karst reservoirs.
2 Materials and methods
2.1 Study area
The Pingzhai Reservoir basin (105°17′3″E−105°26′44″E, 26°29′33″N-26°35′38″N) is located at the junction of Nayong County, Zhijin County, Shuicheng District, and Liuzhi Special District in Guizhou Province (Figure 1). This reservoir serves as the headwater reservoir of the Guizhou Central Water Conservancy Hub and plays a vital role in water resource allocation and supply. The construction of the Pingzhai Reservoir began with damming in 2011, followed by gate closure and water storage in 2015, and it officially stabilized its water supply in 2020.
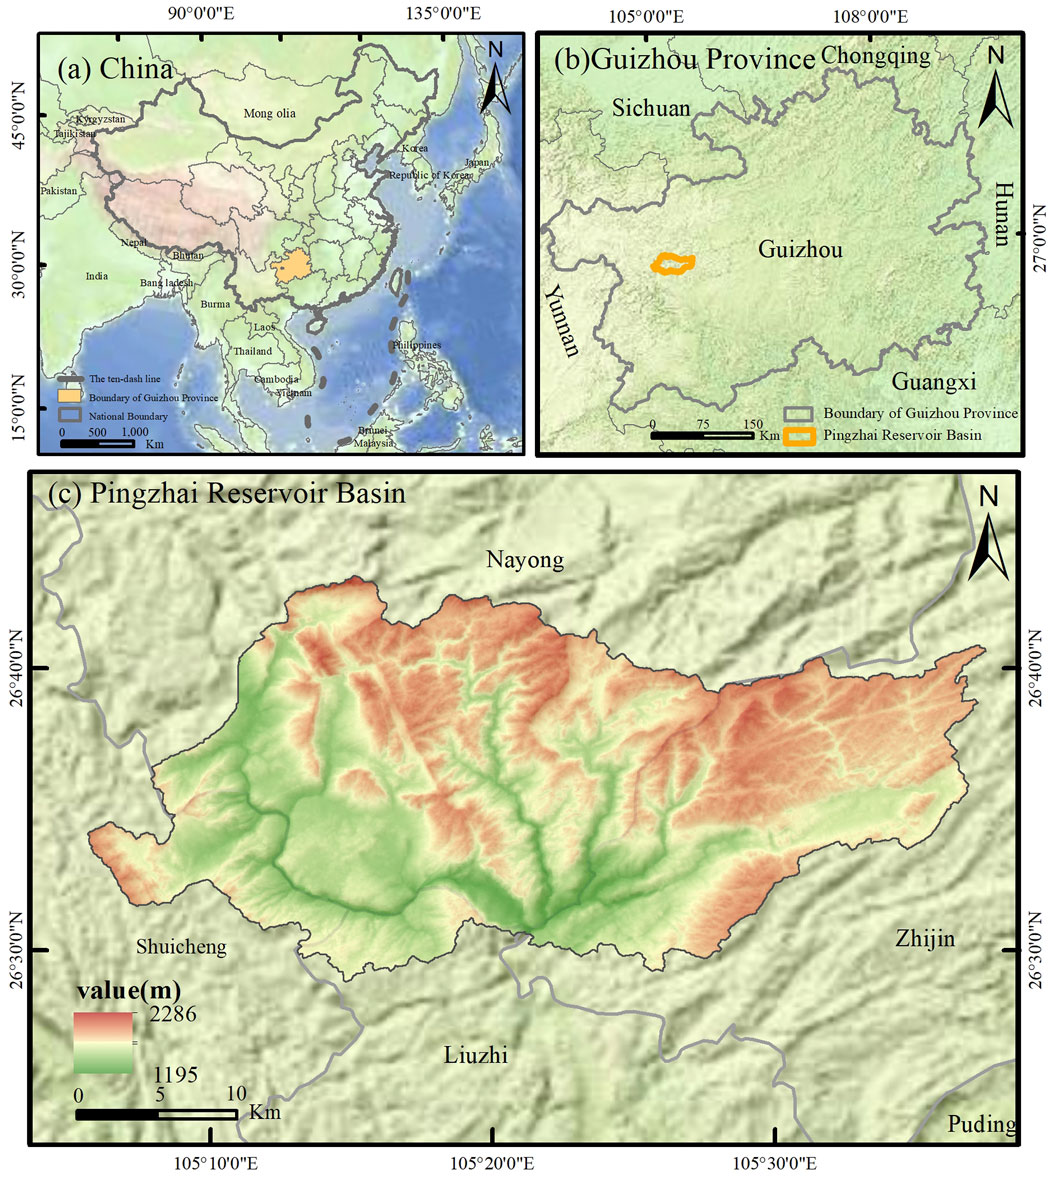
Figure 1. Location of the pingzhai reservoir. (a) China. (b) Guizhou Province. (c) Pingzhai Reservoir basin.
The Pingzhai Reservoir basin covers an area of 833.77 km2, located on the Yunnan-Guizhou karst plateau, the Pingzhai Reservoir basin features highly fragmented terrain with dense gullies. The area exhibits typical karst dual structures, characterized by extensive surface landforms including peak clusters, pinnacles, dissolution depressions, and sinkholes, along with underground features such as caves, subterranean rivers, and hidden lakes. Influenced by geological structures, the basin’s complex topography shows significant elevation variations, with higher altitudes in the eastern/northern sectors and lower elevations in the western/southern areas. In the study area, regions with a dissection depth of 200–500 m account for 40.37%, those with a depth of 500–700 m account for 42.05%, and areas above 700 m account for 17.58%. The karst topography is extensively developed in the study area, with alternating carbonate and non-carbonate rocks, covering an area of approximately 620.01 km2, which is 74.36% of the total area. The study area is located in a subtropical plateau monsoon climate zone, featuring mild temperatures with four distinct seasons: hot and rainy summers, and warm, humid winters. The resident population in the study area is about 223,400, and the total population at the end of the year is approximately 339,000. The study area is rich in mineral resources, with more than 20 types of minerals identified, such as coal, lead-zinc, marble, and limestone. Coal mines are widely distributed, including major ones like Zhangjiawan Coal Mine, Yinglong Coal Industry, Dabatian Coal Mine, and Bide Coal Mine. LULC types are divided into six categories, including crop land (CL), forest land (FL), grassland (GL), built-up land (BL), water bodies (WB), and unused land (UL). Among these, CL and FL account for more than 78.37% of the total area in the Pingzhai Reservoir basin.
2.2 Data sources
LULC Data: The ALOS (Advanced Land Observing Satellite) satellite image data from 2010 was used (http://alos-pasco.com). Multi-spectral band images with a spatial resolution of 10 m and panchromatic band images with a spatial resolution of 2.6 m were obtained. The panchromatic and multi-spectral bands were fused using the image sharpening tool in ENVI 5.3 to obtain remote sensing image data of the study area with a spatial resolution of 2.6 m. The satellite imagery data in 2015 and 2020 were sourced from the Gaofen-1 Satellite (GF-1) and the Gaofen-2 Satellite (GF-2), which can be found at the website: https://grid.cpeos.org.cn/index.htm. The spatial resolutions of GF-1 and GF-2 data were 8 m and 3.2 m, respectively. The panchromatic and multi-spectral bands were fused using the image sharpening tool in ENVI 5.3 to obtain higher resolution images with spatial resolutions of 2 m and 0.8 m, respectively. It has been verified that the precision of the processed data meets the research requirements and can be compared inter-annually without significant impact on the research results.
Natural Factor Data: The digital elevation model (DEM) data is sourced from the Geospatial Data Cloud site of the Computer Network Information Center of the Chinese Academy of Sciences (https://www.gscloud.cn), with the data from the year 2020 and a spatial resolution of 30 m. The slope data was extracted from the digital elevation data using the spatial analysis module in ArcGIS10.8 software, also with a spatial resolution of 30 m. The average annual precipitation and average annual temperature data are from the Resource and Environmental Science and Data Center of the Chinese Academy of Sciences (https://www.resdc.cn), with the data from the year 2020 and a spatial resolution of 1000 m.
Accessibility Factor Data: Road data, township locations, and hydrographic data were all sourced from the Open Street Map website (https://www.openstreetmap.org) for the year 2020. Major and secondary roads were extracted through the attribute table of the road data. In ArcGIS10.8 software, data processing was conducted to merge primary and secondary roads into major roads, and tertiary and quaternary roads into minor roads.
Socioeconomic Factor Data: Population and Gross Domestic Product (GDP) data were both sourced from the Resource and Environmental Science and Data Center of the Chinese Academy of Sciences (https://www.resdc.cn), with the data from the year 2020 and a spatial resolution of 1000 m.
2.3 Methods
2.3.1 Data interpretation
This paper uses a combination of supervised classification and visual interpretation to extract land categories from remote sensing images. Supervised classification is a method of classifying images based on established image interpretation signs and selecting the correct data parameters (Zhao et al., 2019). Visual interpretation refers to the process in which professionals analyze and identify the image features of remote sensing images, aerial photographs, or other image materials through direct observation or with the aid of simple tools, thereby determining the category, nature, scope, distribution patterns, and other related information of the corresponding ground objects (Mei, 2001).
According to the research requirements and in accordance with the National Land Use Status Classification (GB/T21010-2017), LULC types are divided into six categories: crop land, forest land, grassland, built-up land, water bodies, and unused land. To ensure classification accuracy, validation points for each land category are selected on the images and combined with GPS positioning points collected in the field for verification and correction. When the Kappa coefficient is greater than 0.7, it indicates a high classification accuracy. The overall accuracy of the LULC interpretation data in this paper, after verification, is 91.03%, with a Kappa coefficient of 0.86, which meets the research requirements.
2.3.2 LULC change analysis
The LULC transition matrix is a dynamic transformation model that describes the LULC transformation within a certain period. It can directly reflect the direction and quantity of LULC changes in the study area over time (Zhu and Li, 2003). Its model expression is shown in Equation 1:
In the formula,
Through the use of ArcGIS10.8, an overlay analysis was conducted on the current LULC data of the Pingzhai Reservoir basin. By utilizing the spatial analysis module, the LULC transition matrices for different periods of the Pingzhai Reservoir basin were calculated.
2.3.3 Carbon source/sink calculation
In this study, the carbon emissions from crop land, forest land, grassland, water bodies, and unused land are calculated using the direct carbon effect coefficient method (Meng et al., 2023), with the Equation 2 as follows:
In the formula:
Due to research limitations, the carbon emission coefficients in this study were determined through extensive literature review, incorporating the climatic characteristics and land distribution patterns of the Pingzhai Reservoir basin. The specific determination process is as follows:
Crop land emission coefficient: Crop lands exhibit dual characteristics as both carbon sources and sinks. Based on the research of Cai et al. (Caizu et al., 2005) reporting 0.504 t/ha and He Yong et al. (Yong and Jiang, 2006) reporting −0.007 t/ha, this study adopted a net emission coefficient of 0.497 t/ha for crop lands in the basin.
Forest land and grassland coefficients: Forest lands, covering approximately 40% of the basin area, primarily function as carbon sinks. Following Shi et al. (Shi et al., 2012) and Xiao et al. (Xiao et al., 2012), we applied a carbon sink coefficient of −0.581 t/ha for forest lands. For grasslands, the coefficient was set at −0.021 t/ha according to Fang et al. (Fang et al., 2007).
Water bodies coefficient: Considering both Lai‘s (Lai, 2011) national water bodie coefficient of −0.257 t/ha and Duan et al. ‘s (Duan et al., 2008) lake study result of −0.248 t/ha, we determined a coefficient of −0.253 t/ha for water bodies in the reservoir.
Unused land coefficient: For bare rocks and soils, we adopted a coefficient of −0.005 t/ha based on Liu Xiya et al. (Liu et al., 2015).
The carbon absorption coefficients (t/hm2) for crop land, forest land, grassland, water bodies, and unused land, estimated based on existing research (t/hm2), are 0.497、-0.581、-0.021、-0.253、-0.005,respectively.
The carbon emissions from built-up land are calculated using the indirect carbon effect coefficient method (Tian et al., 2021), with the Equation 3 as follows:
In the formula:
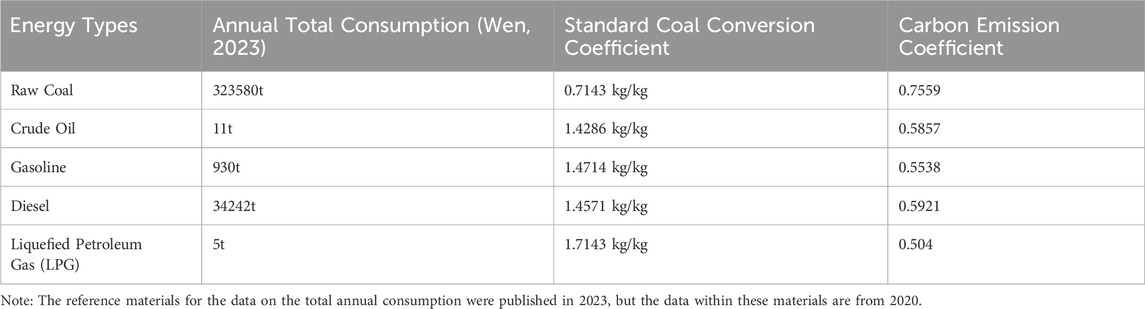
Table 1. Main fossil fuel consumption, standard coal conversion coefficients, and carbon effect coefficients in the pingzhai reservoir basin.
The total carbon emissions in the region are equal to the sum of the carbon emissions resulting from LULC type transformations and the carbon emissions from energy consumption on built-up land. The calculation Equation 4 is as follows:
2.3.4 Future LULC scenario prediction
The PLUS model is used to design three development scenarios to predict the LULC type areas for the year 2030. The carbon source/sink amounts for the Pingzhai Reservoir in 2030 are estimated using the carbon effect coefficient method.
2.3.4.1 Development scenario design
Three LULC change scenarios were systematically developed using Markov chain transition costs and constraints, incorporating China’s cropland protection policies, territorial spatial planning regulations, and rural urbanization strategies: 1) Natural Development Scenario: Simulates the spontaneous evolution of LULC spatial distribution without policy interventions or human influence. 2) Cropland Protection Scenario: Simulates maximum cropland conservation by: Reducing cropland-to-built-up land conversion probability by 50% compared to the natural scenario. Increasing grassland-to-cropland and unused land-to-cropland conversion probabilities by 10% and 50% respectively. Designating stable croplands (remaining unchanged from 2010–2020) as non-convertible areas. 3) Economic Development Scenario: Simulates prioritized economic growth through enhanced urbanization by: Increasing conversion probabilities from cropland/forest land/grassland to built-up land by 20%. Decreasing built-up land conversion probabilities to other LULC types by 40%, compared to natural development conditions. The cost matrices for the three scenarios (Du et al., 2023) are shown in Table 2.
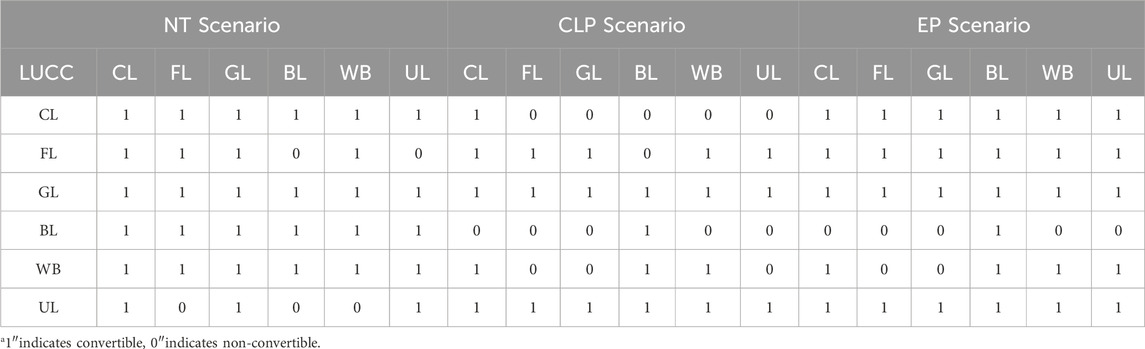
Table 2. Multi-scenario simulation cost matrix.
2.3.4.2 PLUS model
The PLUS model predicts LULC changes at the patch scale based on raster data. It proposes a rule mining framework based on the Land Expansion Analysis Strategy (LEAS) and a Cellular Automata model based on multiple Random Seeds (CA based on multiple Random Seeds, CARS). These tools are used to identify the driving factors of land expansion and landscape changes, aiming to achieve higher simulation accuracy and a more realistic landscape evolution (Li et al., 2022; Liang et al., 2021).
(1) The LEAS land expansion analysis strategy is based on two periods of LULC data. It calculates the development probability of each type of land using the Random Forest algorithm and computes the contribution rates of the selected land expansion driving factors (Yang et al., 2022), with the Equation 5 as follows:
In the formula, x is the vector of driving factors,
(2) CARS, under the constraints of the development probability of various types of LULC, generates LULC patches based on multiple random seeds and a threshold decrement mechanism (Sun et al., 2023). The calculation Equation 6 is as follows:
In the formula,
The PLUS model, which combines cellular automata with a random seed mechanism, serves as an effective spatial simulation tool for quantifying LULC drivers and simulating patch-scale dynamics under multiple scenarios (Liang et al., 2021). In the LEAS module, ten expansion driving factors were selected for the Pingzhai Reservoir basin based on local conditions and data availability (Liu and Long, 2016). These drivers were used to calculate land expansion probabilities. The resulting spatial constraints were then input into the CARS module. Through iterative calculations, the model achieved refined simulation of LULC changes, providing critical data support for multi-scenario projections (Figure 2).
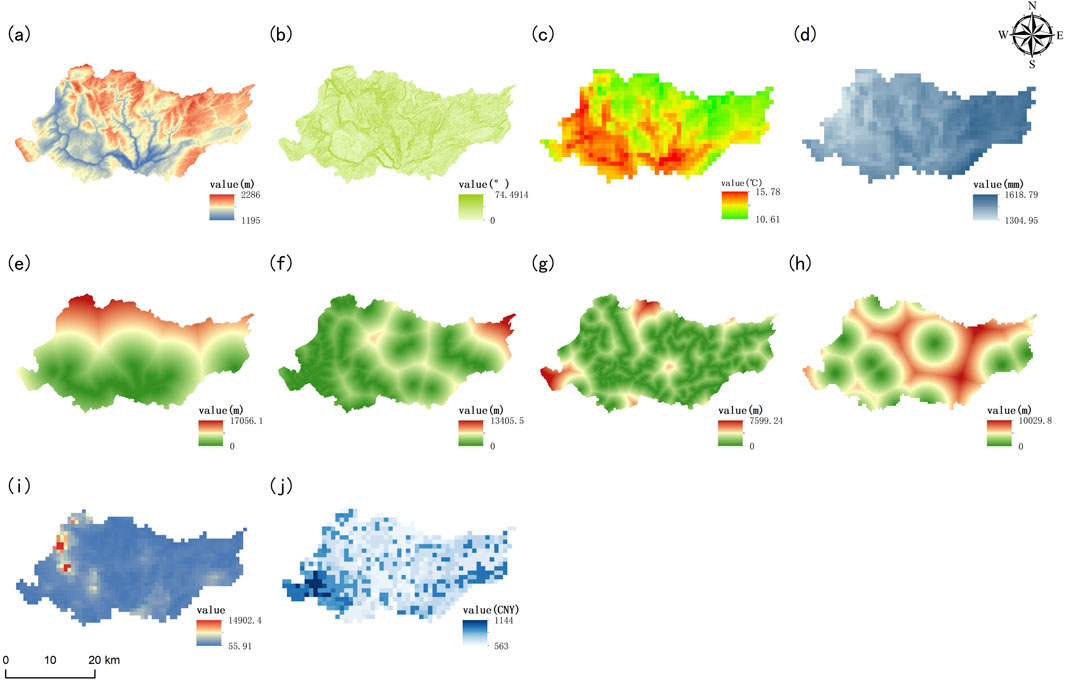
Figure 2. Driving Factors of LULC Expansion in the Pingzhai Reservoir Basin. Note: (a) DEM; (b) Slope; (c) Temperature; (d) Precipitation; (e) Distance to water; (f) Distance to main road; (g) Distance to minor road; (h) Distance to government; (i) Population; (j) GDP.
2.4 Model accuracy validation
The confusion matrix is a tabular representation where rows and columns correspond to predicted and actual classes, respectively. Four key metrics are derived from the matrix: True Positives (TP), False Positives (FP), True Negatives (TN), and False Negatives (FN)—illustrated here for cropland classification (Figure 3). These metrics provide a nuanced evaluation of model performance, surpassing simplistic accuracy measurements (Vujovic, 2021).
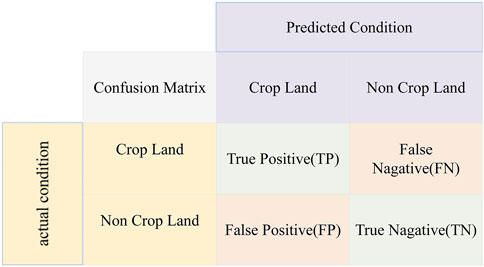
Figure 3. Confusion matrix for accuracy assessment.
Kappa coefficient and overall accuracy serve as critical metrics for evaluating the classification performance of the PLUS model. The kappa coefficient calculation Equation 7 is as follows.
The calculation methods are as follows:
Overall accuracy (
Expected agreement by chance (
The Kappa coefficient and overall accuracy serve as key metrics for evaluating the classification performance of the PLUS model, as specified in Equations 7–9 (Yang, Zhang, et al., 2023). The Kappa coefficient accurately measures the agreement between predicted and actual categories by correcting for random chance, while overall classification accuracy intuitively reflects the model’s predictive performance through the proportion of correctly classified samples. Producer’s accuracy and user’s accuracy further reveal model performance across different categories from complementary perspectives. Through systematic analysis of confusion matrix results, this approach enables precise identification of model weaknesses, thereby informing targeted model optimization and data collection strategies.
2.5 Research framework
This study employs the PLUS model to analyze land expansion dynamics in the Pingzhai Reservoir basin, utilizing LULC data (2010, 2015, 2020) and ten driving factors. Subsequently, the carbon effect coefficient method is applied to quantify carbon flux variations in this karst mountainous area based on LULC patterns and carbon coefficients. The integrated approach provides scientific support for optimizing land use planning, ecological conservation, and sustainable development strategies in karst regions. (Figure 4).
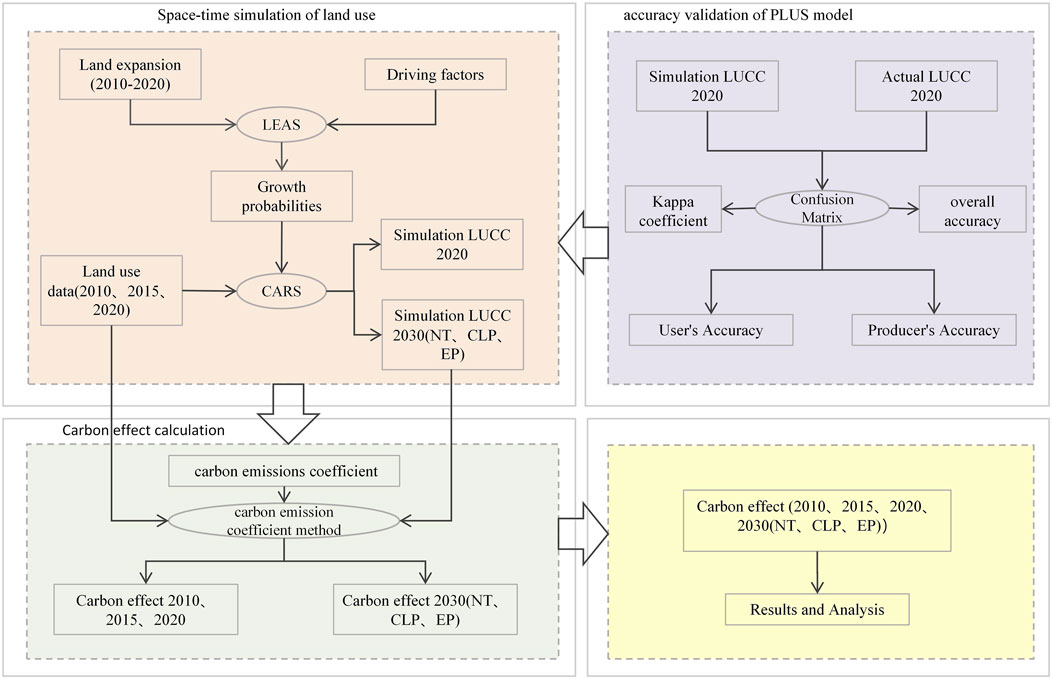
Figure 4. Data processing and methodology study flowchart. Note: LEAS and CARS are the two modules of the PLUS model.
3 Results
3.1 LULC changes and carbon source/sink effects from 2010 to 2020
3.1.1 Analysis of LULC changes
The LULC types in the Pingzhai Reservoir basin are predominantly crop land and forest land, followed by grassland, with water bodies, built-up land, and other land uses accounting for a smaller proportion. As shown in Figure 5, changes occurred among all types of LULC between 2010 and 2020.
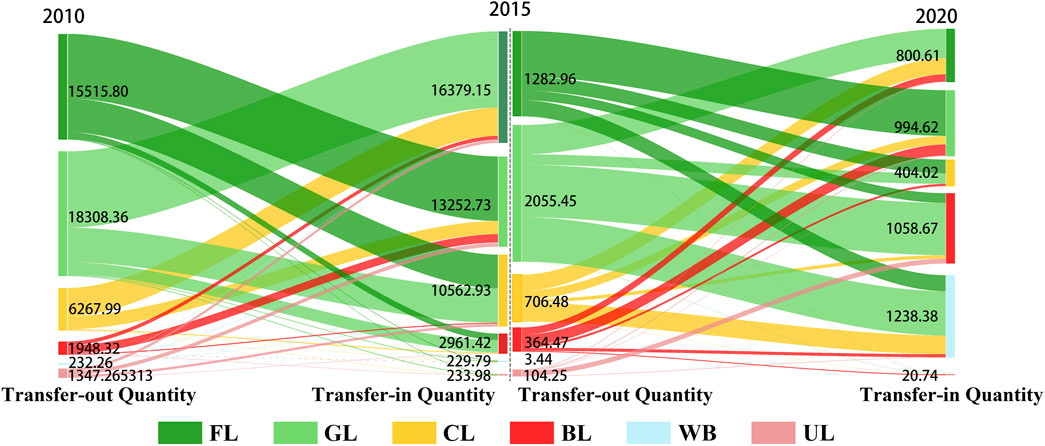
Figure 5. LULC Transition in the Pingzhai Reservoir from 2010 to 2020 (unit: hm2).
Crop land mainly shifted to forest land, grassland, and built-up land, with conversion areas of 9,353.33 h m2, 1,941.69 h m2, and 1,131.52 h m2, respectively. The phenomenon of built-up land occupying crop land is relatively prominent. This indicates that the advancement of urbanization is the main factor for the transfer of crop land to built-up land. It is also one of the main reasons for the increase in the area of built-up land.
Forest land mainly shifted to crop land, grassland, and built-up land, with transfer areas of 11,029.05 h m2, 4,064.44 h m2, and 550.24 h m2, respectively, accounting for 89.30% of the total forest land area transferred out.
Grassland mainly shifted to crop land and forest land, with transfer areas of 4,924.34 hm2 and 4,884.39 h m2, respectively, accounting for 39.20% and 38.88% of the total grassland transfer area. The study reveals bidirectional conversion between forest land and crop land, a phenomenon closely tied to Guizhou’s mountainous terrain. In these complex topographical conditions, terraced farmlands and forested areas exhibit interwoven distributions with blurred boundaries. Due to terrain constraints, local farmers frequently adjust land use practices based on field conditions and agricultural needs, leading to dynamic land transitions.
The increase in water bodies area was mainly due to the construction of new reservoirs, which occupied surrounding crop land, forest land, grassland, and some built-up land. The area of unused land continuously decreased, mainly shifting to crop land, forest land, and grassland, with transfer areas of 82.27 h m2, 40.65 h m2, and 25.23 h m2, respectively.
3.1.2 Carbon source/sink calculation results
Based on the LULC data of the Pingzhai Reservoir basin in 2010, 2015, and 2020, the carbon emissions and carbon absorption before and after the construction of the dam were calculated.
As shown in Table 3, the total carbon emissions of the Pingzhai Reservoir show an upward trend, increasing from 141,117.77 tons before the dam construction to 220,656.31 tons after the dam construction, an increase of 56.36%. The net carbon emissions of the Pingzhai Reservoir also show an upward trend, increasing from 121,558.73 tons to 200,477.90 tons, an increase of 64.92%. The main carbon sources of the Pingzhai Reservoir are crop land and built-up land, with built-up land accounting for more than 87% of the total carbon emissions.
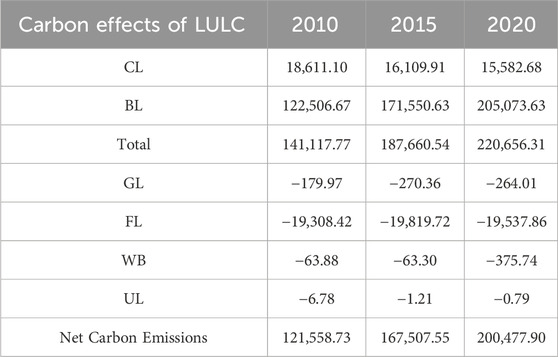
Table 3. Carbon source/sink conditions of the pingzhai reservoir from 2010 to 2020 (unit:t).
In the carbon sink LULC of the Pingzhai Reservoir basin, the main carbon sink is forest land, accounting for more than 96% of the total carbon absorption. The carbon sequestration capacity of grassland and water bodies is relatively weak, which is closely related to the LULC structure of the Pingzhai Reservoir. The differences in carbon sequestration capacity among different LULC types also have an impact. Grassland and water bodies account for about 17% of the total area, while forest land and crop land account for about 80% of the total area. In 2020, the carbon sequestration capacity of water bodies increased, mainly because the reservoir was fully stocked and officially stabilized its water supply, reaching its maximum area. After the reservoir was fully stocked, the water bodies became relatively stable, with reduced mobility, allowing phytoplankton to grow in a stable environment and microorganisms to absorb CO2 and release oxygen, thereby increasing the carbon sequestration capacity.
According to the calculation results of carbon emissions and carbon absorption of the Pingzhai Reservoir, the net carbon emissions of the region’s LULC were obtained. Comparing the 10-year calculation results of each type, as the area of crop land decreased, its carbon sink capacity also decreased. Forest land and grassland were relatively stable in carbon absorption. The area of water bodies reached its maximum in 2020, and the carbon absorption capacity increased, rising by 5.93 times compared to previous years. However, compared to forest land, crop land, and built-up land, the proportion is still small, so the carbon absorption effect is not strong. In 2020, the carbon absorption of LULC was not sufficient to offset the carbon emissions, and the net carbon emissions of LULC showed an overall upward trend, reaching the maximum in 2020.
The trend of carbon emissions from built-up land is basically consistent with the trend of net carbon emissions. This indicates that the carbon emissions from built-up land have a crucial impact on the total carbon emissions of the Pingzhai Reservoir basin. Therefore, efforts can be made to control the carbon emissions of the Pingzhai Reservoir by focusing on built-up land to achieve carbon reduction targets.
3.2 Multi-scenario simulation of LULC and carbon source/sink changes
3.2.1 Precision verification of multi-scenario simulation methods
Using land use changes from 2010–2015 as baseline data, we simulated and predicted the 2020 land use patterns. The simulation results were then compared against the actual 2020 land use map, with model accuracy evaluated through a confusion matrix-based assessment. (Table 4).
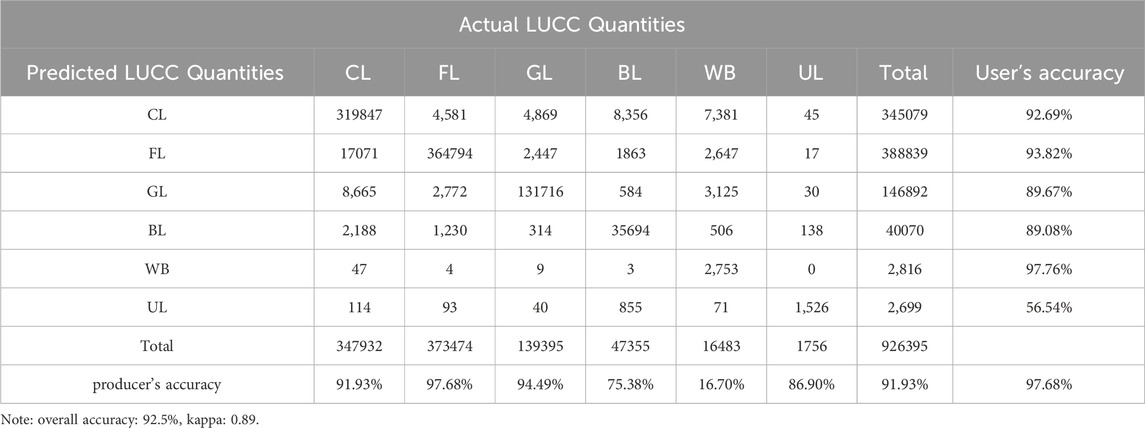
Table 4. Confusion matrix.
The model achieved an overall accuracy of 92.5%, indicating successful classification of most LULC types, with this high accuracy demonstrating its robust training and capability to effectively differentiate between actual and simulated LULC patterns. User’s accuracy exceeded 89% for all categories except unused land (whose minimal area had negligible impact on results), while producer’s accuracy surpassed 75% for all types except water bodies - this particular discrepancy resulted from artificial reservoir impoundment during 2015–2020, representing an exceptional anthropogenic intervention rather than systemic model limitations. Given that water area stabilized by 2020, using 2020 LULC data for 2030 projections would only minimally affect water bodies simulation accuracy, with no significant impact on overall findings. The Kappa statistic of 0.89 confirmed excellent model-data agreement, substantially exceeding chance-level expectations.
3.2.2 Multi-scenario simulation of LULC changes
According to Table 5 and Figure 6, compared to 2020, under the NT scenario, the areas of crop land, grassland, and unused land in the Pingzhai Reservoir basin in 2030 will decrease by 1,666.3 ha, 828.85 ha, and 12.66 ha, respectively, with the largest reduction in crop land. Forest land, built-up land, and water bodies will increase by 1,226.06 ha, 895.85 ha, and 304.75 ha, respectively, with forest land and built-up land being the main increasing land types.
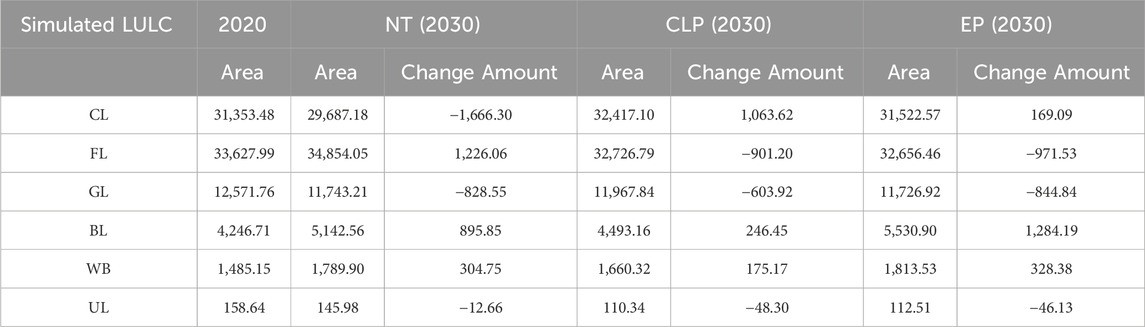
Table 5. LULC type area for 2020 and multi-scenario simulations for 2030. (unit:hm2).
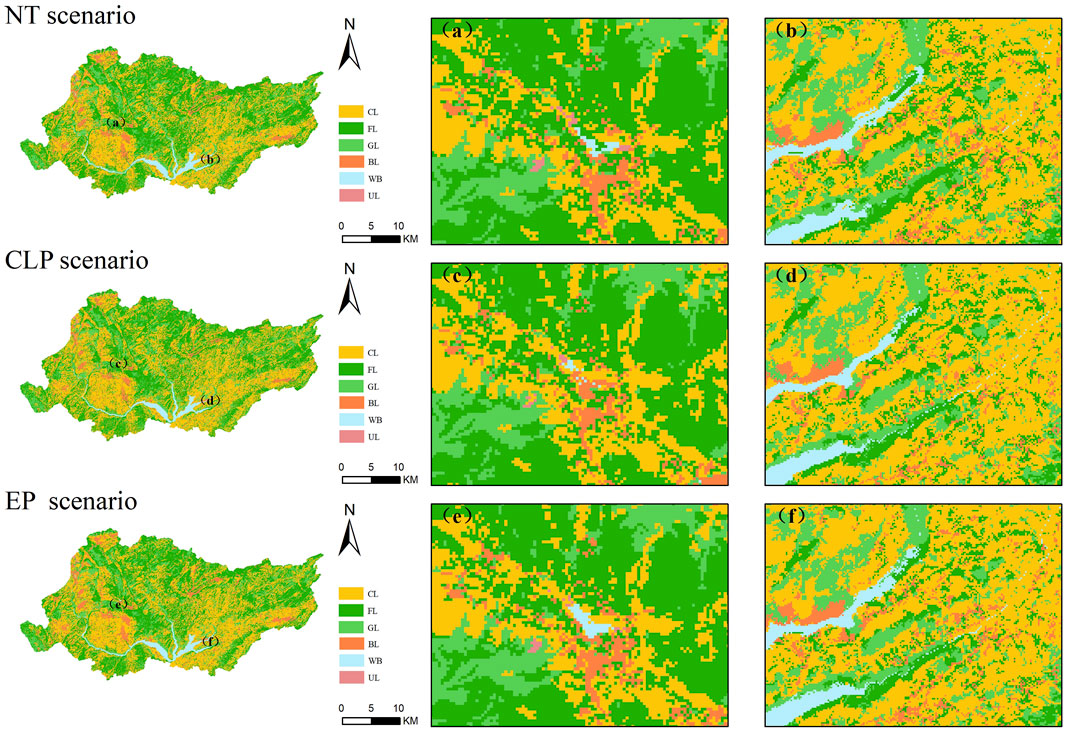
Figure 6. PLUS Model Simulation and Prediction of Multi-Scenario LULC Expansion. Note: Figures (a) and (b) show enlargement under the NT scenario. Figures (c) and (d) show enlargement under the CLP scenario. Figures (e) and (f) show enlargement under the EP scenario.
Under the CLP scenario, crop land is the main increasing land type, with an increase of 1,063.62 ha. Built-up land and water bodies areas will slightly increase, while forest land and grassland will decrease by 901.2 ha and 603.92 ha, respectively.
Under the EP scenario, the increase in built-up land is the largest, at 1,284.19 ha, with significant reductions in forest land and grassland, decreasing by 971.53 ha and 844.84 ha, respectively.
In the simulated three scenarios for 2030, compared to the actual LULC in 2020, the increase in built-up land area is the highest under EP scenario, followed by NT scenario, and then CLP scenario. The decrease in grassland area is the highest under EP, followed by NT scenario, and then CLP scenario. Crop land area increases under both CLP scenario and EP scenario but decreases under NT scenario. The decrease in crop land area from 2010 to 2020 was 19.43%. In contrast, under the NT scenario for the same prediction period (2020–2030), the decrease is 5.61%, indicating a significant reduction in the rate of decrease.
3.2.3 Multi-scenario simulation of carbon source/sink changes
In terms of carbon sources/sinks, according to Table 6, the carbon emissions in all three scenarios from 2020 to 2030 are higher than in 2020. Under the NT scenario, the net carbon emissions are 242,138.55 tons, an increase of 17.21%. Compared to the other two scenarios, the increase in built-up land is the smallest in the CLP scenario, with an increase of 246.45 ha. Under the CLP scenario, the net carbon emissions are the lowest compared to the other two scenarios, with an increase of 6.06%. Based on the carbon source/sink calculation formula and the carbon effect coefficients of each LULC type, it is evident that the amount of built-up land has a significant impact on carbon emissions. Under the EP scenario, due to the substantial increase in built-up land area, and the fact that forest land and grassland, which act as carbon sinks, decrease the most compared to the other two scenarios, the net carbon emissions in this scenario increase significantly, reaching a total of 263,074.67 tons, an increase of 23.79% compared to the net carbon emissions in 2020.
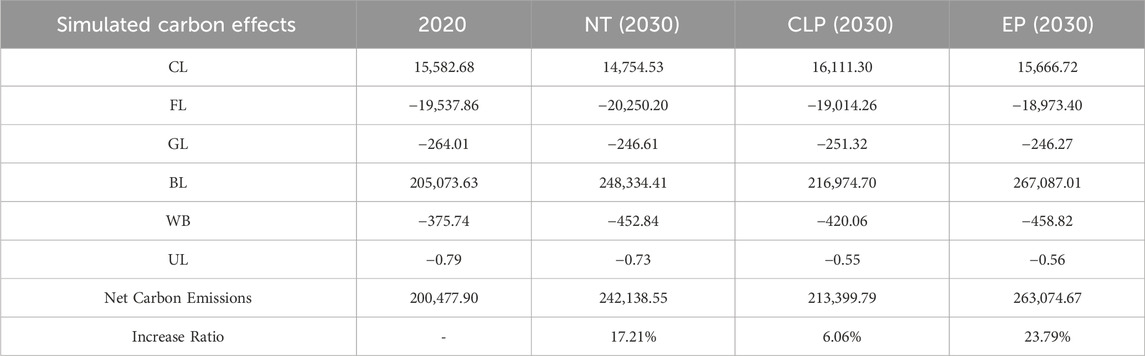
Table 6. Carbon source/sink quantities for 2020 and multi-scenario simulations for 2030 (unit:t).
4 Discussion
4.1 LULC driving factors contribution analysis
LULC changes are often influenced by both natural and various social factors. The LEAS module of the PLUS model analyzes the driving factors of LULC structure changes. This module calculates the contribution of driving factors to changes in LULC types. The higher the percentage of the contribution value of a driving factor, the greater its contribution and the stronger its driving force on LULC.
As shown in Figure 7, the DEM has the highest contribution value for the expansion of crop land, forest land, and water bodies. The topographic constraints in Pingzhai Reservoir basin, dominated by mid- and high-mountain landscapes (elevation 1182–2279 m, with 59.63% of areas having dissection depth exceeding 500 m), form fundamental constraints on LULC changes. This geomorphology influences socioeconomic activities through two pathways: 1) directly limiting human development capacity - steep terrain increases transportation construction costs; 2) indirectly altering population distribution patterns, as high-altitude areas exhibit lower population density compared to valley zones, creating a chain effect of “topography-accessibility-population” constraints. These findings align with Chen et al.'s (Chen et al., 2017) research in Guizhou-Guangxi karst mountains, demonstrating how terrain ruggedness indirectly regulates LULC changes by modulating human activity intensity.
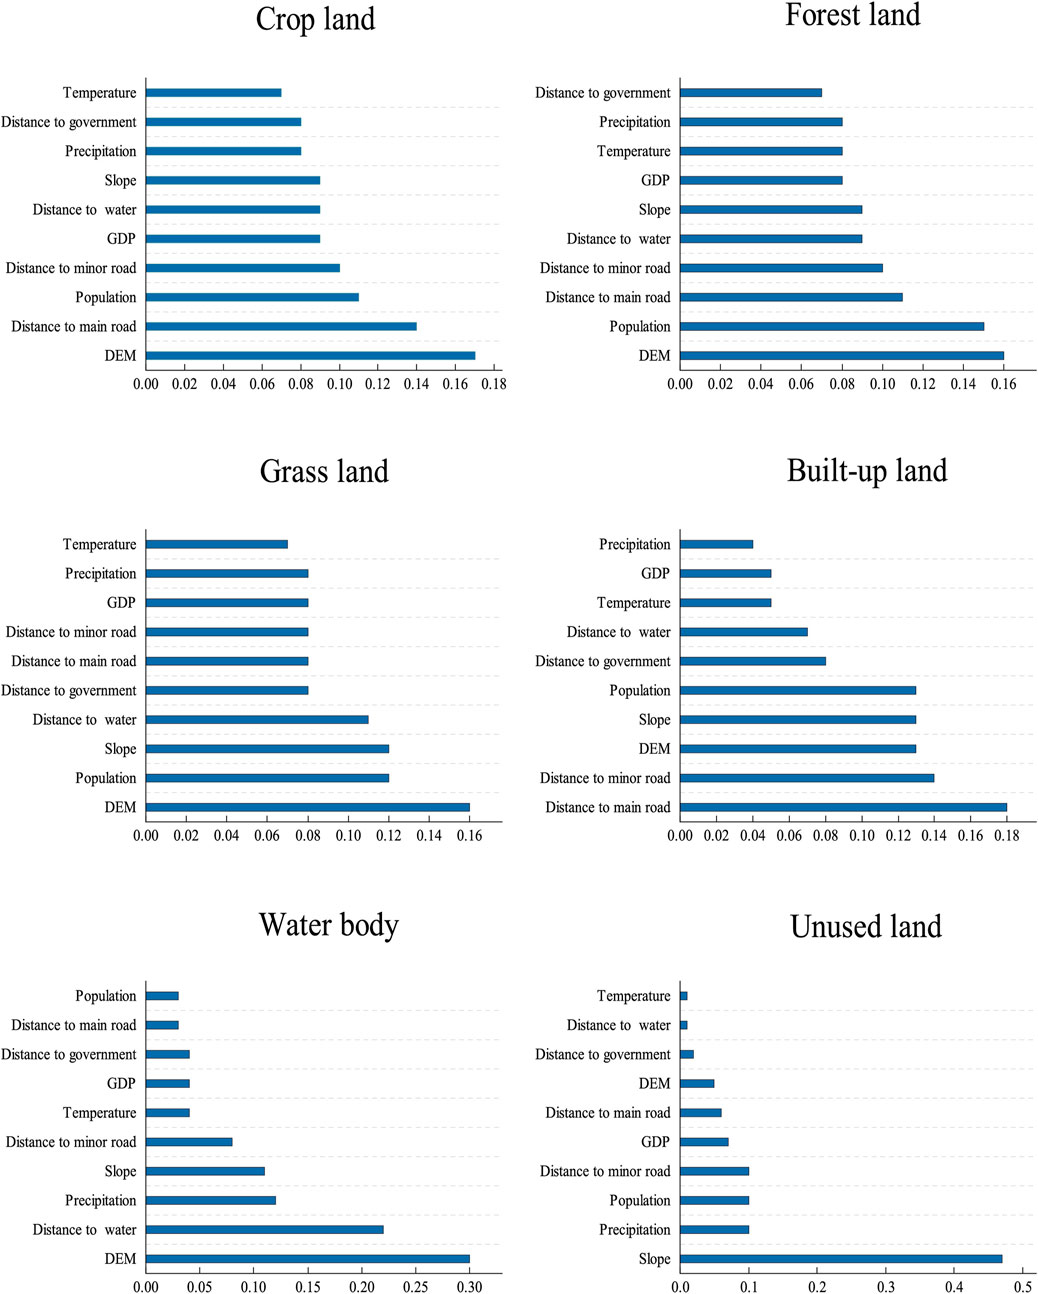
Figure 7. Contribution values of LULC change driving factors in the pingzhai reservoir basin.
Socio-economic factors play an adaptive regulatory role on the natural base. The significant impact of population density on forest and grassland expansion, with a contribution value second only to DEM, corroborates the “population pressure-ecological land encroachment” response mechanism. When population density exceeds the threshold, humans convert ecological land to meet survival needs, which is consistent with the theory proposed by Liu (Liu, 2017) that human-land conflicts drive cultivated land expansion. For transport accessibility factors, the distance from major roads has a contribution value of 0.18 to built-up land expansion, reflecting the “infrastructure-economic development” linkage effect. This finding is corroborated by the research conclusions of Lian et al.'s (Lian et al., 2021), as well as Chen (Chen, 2017), which show that road traffic drives urban expansion.
The comparison with the Wuhan plain area further highlights the differences in the regulatory role of topography. Studies in Wuhan have shown that road traffic and DEM are key factors in the expansion of built-up land and forest land (Yuan, 2022). As a typical mountainous area, the study area is restricted by topographical conditions, and the urbanization process is relatively lagging. In terms of spatial distribution,built-up land is mostly linearly arranged along major roads to reduce development costs and meet traffic convenience needs. This spatial development model results in the distance from major roads contributing more to the expansion of built-up land than DEM.
In plain terrain, land with lower elevation is often more convenient for human activities such as agricultural reclamation and built-up (Liu et al., 2020), and social and economic factors have a stronger direct driving effect. Wu et al. (Wu et al., 2022) also pointed out that social economy is an important factor affecting the expansion of built-up land. In regional ecological environment studies, the topographic relief amplitude is significantly negatively correlated with land cover change. In areas with large topographic relief, complex natural environments and inconvenient transportation restrict human activities, reduce the degree of land development and utilization, and lead to a decrease in the area of land cover transition.
In summary, the karst mountainous terrain demarcates the boundaries of land development through spatial isolation effects, while social and economic factors such as population and transportation make adaptive adjustments within these boundaries. Together, they form a dynamic equilibrium driving system.
Some driving factors show relatively low contribution values to LULC expansion. The low contribution of GDP to the expansion of cultivated land and built-up land is, on the one hand, due to the backward regional economy and single industry, and on the other hand, closely related to ecological protection policies. In recent years, China has vigorously implemented the policy of returning farmland to forest and grassland and the ecological compensation mechanism in the karst rocky desertification areas, which has restricted the disorderly reclamation of farmland and the expansion of built-up land, weakening the driving force of economic growth on land expansion. Population density has no direct correlation with the expansion of water areas, mainly regulated by water conservancy project planning and ecological protection policies. For instance, the area and boundary of the Pingzhai Reservoir, an important water resource guarantee project in the region, are determined by engineering design and policy goals such as flood control and water supply, rather than driven by population demand. Behind these low contribution value factors, the role of policies in the land use change in the ecologically fragile areas of karst mountainous regions is highlighted. They not only limit excessive human interference with the ecological background but also guide the transformation of land use towards an ecological priority direction.
4.2 Carbon emission effects of the Pingzhai Reservoir Basin
Pingzhai Reservoir basin during 2010–2020. The results revealed that built-up land served as the dominant carbon source, contributing over 92.94% of total emissions with a 1.67-fold increase, confirming the trend of urbanization and industrialization driving built-up land expansion and consequent emission growth. The net land-use carbon emissions showed consistent growth patterns with built-up land emissions. Energy intensity was identified as the decisive factor in land-use carbon emissions (You and Wu, 2010), where fossil fuel consumption in building operations and organic carbon oxidation during land conversion were primary emission sources. The transformation of natural lands to construction areas disrupts soil structure, triggering oxidative decomposition of soil organic carbon and CO2 release (de Souza Medeiros et al., 2020). Socioeconomic development, as a key driver of built-up land expansion, aligns with findings from Tian and Zhao (2024), Wu et al. (2022).
The accelerated urbanization process has led to rapid expansion of built-up areas, resulting in increased energy consumption, higher carbon emissions, and weakened carbon sequestration capacity of ecosystems (Yuan et al., 2019). To address these challenges, policy interventions play a pivotal role in controlling carbon emissions from built-up land. Measures such as land-use planning, green building standards, and land structure optimization can effectively reduce emissions and promote low-carbon development. Achieving carbon reduction goals requires integrated consideration of both land use and policy regulation during urbanization to ensure sustainable utilization of built-up areas and facilitate low-carbon city construction.
In alignment with China’s and Guizhou Province’s key policies—including the Regulations on the Protection of Basic Farmland, the 14th Five-Year Plan for Water Security, and the Guizhou Province 14th Five-Year Plan for National Economic and Social Development and Long-Range Objectives Through 2035—this study incorporates policy constraints into the PLUS model scenario design. In the scenario setting of the PLUS model, we should protect reservoirs from being occupied by other land use types, taking the reservoir area in 2020 as a constraint in the model calculations to prevent other land uses from expanding into reservoir areas, and reduce the conversion of cultivated land through cultivated land protection policies. By deeply integrating local policies with research objectives, this study significantly enhances its practical applicability for regional low-carbon planning.
Through the integrated application of the carbon effect coefficient method and PLUS model, this study calculated carbon emissions for three simulated 2030 scenarios, revealing that the cropland protection scenario yielded the lowest emissions due to its effective control over built-up land expansion. In the natural development scenario, emissions were mitigated through green building promotion and improved energy efficiency in construction areas, while the economic priority scenario required strict enforcement of ecological protection red-lines to curb disorderly built-up land expansion and enhance industrial land carbon management. The cropland protection scenario achieved optimal results by implementing low-carbon agricultural technologies like straw returning and conservation tillage to boost carbon sequestration, while simultaneously establishing ecological buffer zones around protected croplands in territorial spatial planning to balance farmland preservation with emission reduction, ultimately realizing synergistic development of food security and carbon neutrality goals. The findings demonstrate that targeted land-use policies incorporating sector-specific measures can effectively reduce emissions while accommodating development needs.
4.3 Limitation and prospects
LULC carbon emissions are primarily due to changes in land types influenced by natural factors, changes in LULC management practices by human activities, and differences in the carbon sequestration capabilities of various LULC types at different times. Although the water area in the Pingzhai Reservoir basin has shown significant dynamic changes over the past decade, it accounts for less than 2% of the total basin area, thus having a limited impact on overall carbon emissions. More importantly, the carbon source-sink processes in water bodies exhibit strong spatiotemporal heterogeneity, which not only includes seasonal carbon budget transitions, such as the seasonal carbon source/sink characteristics of reservoir water bodies identified by Wang Cui et al. (Wang et al., 2021), but also involves the coupled effects of multiple processes like phytoplankton metabolism and carbonate rock dissolution (Jiang and Zhou, 2020; Han et al., 2020). Limited by the accuracy of existing data and the research cycle, it is currently difficult to comprehensively quantify this complex process. Therefore, this study temporarily uses carbon effect coefficients similar to those of most lakes in China as substitute values. While this approach ensures the feasibility of the research, it also clearly points to a future optimization direction: improving the quantitative accuracy of the methodological model for the karst-specific hydrological environment through deepened spatiotemporal monitoring of water carbon processes.
The carbon emission accounting model draws on research data from previous scholars and refers to the IPCC “Guidelines for National Greenhouse Gas Inventories”. However, current descriptions of carbon emission characteristics of built-up land in different regions show significant heterogeneity, and universal research remains insufficient. Building a high-precision carbon effect coefficient accounting system that considers regional differences, time series, and scale effects will become the core direction of follow-up research. Although there may be deviations between the results obtained by the carbon effect coefficient method and the actual values, this method is still reliable for judging long-term evolution trends and comparing carbon emission structures among cities in the region. By analyzing the spatial-temporal differentiation characteristics of carbon emissions and coupling with policy implementation effects, it can not only reveal the policy response mechanism of carbon emissions from land use, but also provide theoretical support and technical paradigms for subsequent planning research.
5 Conclusion
A study on the LULC changes and carbon emission effects of the Pingzhai Reservoir has led to the following conclusions:
The main LULC types of the Pingzhai Reservoir are crop land and forest land, followed by grassland, with water bodies, built-up land, and other land uses accounting for a smaller proportion. Between 2010 and 2020, the LULC types that were primarily transferred out were crop land, forest land, and grassland, while the land types that were mainly transferred in were crop land and forest land.
The total carbon emissions of the Pingzhai Reservoir from 2010 to 2020 showed an overall upward trend, increasing from 141,117.77 tons to 220,656.31 tons, a rise of 56.36%. The total carbon absorption showed a decrease, with the main carbon source shifting from crop land to built-up land. The net carbon emissions increased year by year, from 121,558.73 tons in 2010 to 200,477.90 tons in 2020, a rise of 64.92%.
Predictions of LULC type changes from 2020 to 2030 using the PLUS model show that the area of built-up land continues to increase, with the most significant increase under the EP scenario. The area of forest land continues to increase under the NT scenario, but decreases under the CLP and the EP scenarios. Under the three development scenarios simulated by the PLUS model, carbon emissions increased, with the least increase under the CLP scenario and the most under the EP scenario.
Based on the research results, land use optimization contributes to the “dual carbon” goals through the mechanism of “carbon source control - carbon sink enhancement - policy synergy”. It is recommended that policymakers and planners strictly control the expansion of built-up land, focus on restricting development on steep slopes and around reservoir protection areas, and promote compact construction models. Implement arbor forest planting projects in peak-cluster depressions. Rely on PLUS model simulations to establish a carbon emission early-warning mechanism, dynamically adjust land use plans by combining remote sensing monitoring with on-site verification, and effectively promote land use optimization under the “dual carbon” goals.
Data availability statement
The original contributions presented in the study are included in the article/supplementary material, further inquiries can be directed to the corresponding author.
Author contributions
CD: Methodology, Validation, Writing – review and editing, Conceptualization, Data curation, Software, Writing – original draft, Formal Analysis. ZZ: Funding acquisition, Conceptualization, Writing – review and editing. CW: Conceptualization, Writing – review and editing. JK: Writing – review and editing. YW: Writing – review and editing. RX: Writing – review and editing.
Funding
The author(s) declare that financial support was received for the research and/or publication of this article. This study was supported financially by National Natural Science Foundation of China (42161048); Guizhou Provincial Science and Technology Plan Project - Research on the Carbon Cycle Mechanism of Karst Cave Systems (Qiankehe Jichu [2020] 1Y154); Academic New Seedling Fund Project of Guizhou Normal University (Qianshi Xinmiao [2022] No. 23).
Conflict of interest
The authors declare that the research was conducted in the absence of any commercial or financial relationships that could be construed as a potential conflict of interest.
Generative AI statement
The author(s) declare that no Generative AI was used in the creation of this manuscript.
Publisher’s note
All claims expressed in this article are solely those of the authors and do not necessarily represent those of their affiliated organizations, or those of the publisher, the editors and the reviewers. Any product that may be evaluated in this article, or claim that may be made by its manufacturer, is not guaranteed or endorsed by the publisher.
References
Azedou, A., Amine, A., Kisekka, I., Lahssini, S., Bouziani, Y., and Moukrim, S. (2023). Enhancing land cover/land use (LCLU) classification through a comparative analysis of hyperparameters optimization approaches for deep neural network (DNN). Ecol. Inf. 78, 102333. doi:10.1016/j.ecoinf.2023.102333
Cai, Z., Kang, G., Tsuruta, H., and Mosier, A. (2005). Estimate of CH_4 emissions from year-round flooded rice fields during rice growing season in China. Pedosphere 15 (1). Available online at: https://cstj.cqvip.com/Qikan/Article/Detail?id=15219373.
Chen, T.-t., Peng, L., Liu, S.-q., and Wang, Q. (2017). Land cover change in different altitudes of Guizhou-Guangxi karst mountain area, China: patterns and drivers. J. Mt. Sci. 14, 1873–1888. doi:10.1007/s11629-016-4202-1
Chen, Y. (2017). Study on the impact of road traffic on the expansion of urban and rural construction land. Cnki: Hunan Normal University, Changsha city, China.
Chong, L., Hu, S., Wu, S., Song, J., and Li, H. (2024). County-level land use carbon emissions in China: Spatiotemporal patterns and impact factors. Sustain. Cities Soc. 105, 105304. doi:10.1016/j.scs.2024.105304
de Souza Medeiros, A., Maia, S. M. F., Cândido dos Santos, T., and de Araújo Gomes, T. C. (2020). Soil carbon losses in conventional farming systems due to land-use change in the Brazilian semi-arid region. Agric. Ecosyst. and Environ. 287, 106690. doi:10.1016/j.agee.2019.106690
Du, S., Zhou, Z., Huang, D., Zhang, F., Deng, F., and Yang, Y. (2023). The response of carbon stocks to land use/cover change and a vulnerability multi-scenario analysis of the karst region in southern China based on PLUS-InVEST. Forests 14 (12), 2307. doi:10.3390/f14122307
Duan, X., Wang, X., Lu, F., and Zhiyun, O. (2008). Primary evaluation of carbon sequestration potential of wetlands in China. Acta Ecol. Sin. 28 (2), 463–469. doi:10.1016/s1872-2032(08)60025-6
Ebenezer, P. A., and Manohar, S. (2024). Land use/land cover change classification and prediction using deep learning approaches. Signal, Image Video Process. 18 (1), 223–232. doi:10.1007/s11760-023-02701-0
Fang, J., Guo, Z., Piao, S., and Chen, A. (2007). Estimation of the carbon sink of terrestrial vegetation in China from 1981 to 2000. Sci. Sin. 37 (6), 804–812. doi:10.1007/s11430-007-0049-1
Han, C., Sun, H., Yu, W., Qian, B., and Hao, Y. (2020). Spatiotemporal variations of hydrochemistry in karst dammed rivers and carbon fertilization effect of biological carbon pump: a case study of pingzhai reservoir and Lake hongfeng in Guizhou province. J. Lake Sci. 32 (6), 1683–1694. doi:10.18307/2020.0610
Houghton, R. A., and Hackler, J. L. (2003). Sources and sinks of carbon from land-use change in China. Glob. Biogeochem. Cycles 17 (2). doi:10.1029/2002gb001970
Houghton, R. A. J. T. B. (1999). The annual net flux of carbon to the atmosphere from changes in land use 1850–1990. Tellus Ser. B Chem. Phys. Meteorology 51, 298–313. doi:10.1034/j.1600-0889.1999.00013.x
Huang, S., Xi, F., Chen, Y., Gao, M., Pan, X., and Ren, C. (2021). Land use optimization and simulation of low-carbon-oriented—A case study of jinhua, China. Land 10 (10), 1020. doi:10.3390/land10101020
Iqbal, J., Amin, G., Su, C., Haroon, E., and Baloch, M. Y. J. (2024). Assessment of landcover impacts on the groundwater quality using hydrogeochemical and geospatial techniques. Environ. Sci. Pollut. Res. 31 (28), 40303–40323. doi:10.1007/s11356-023-29628-w
Jat Baloch, M. Y., Zhang, W., Shoumik, B. A. A., Nigar, A., Elhassan, A. A. M., Elshekh, A. E. A., et al. (2022). Hydrogeochemical mechanism associated with land use land cover indices using geospatial, remote sensing techniques, and. Health Risks Model 14 (24), 16768. doi:10.3390/su142416768
Jiahong, L., and Ruei-Yuan, W. (2024). Simulation analysis of spatiotemporal evolution of land use in yangchusn city using Markov-PLUS model. Int. J. Environ. Agric. Biotechnol. 9 (4), 280–294. doi:10.22161/ijeab.94.35
Jiang, Y., Zhou, Z., Xue, B., Wang, Y., Dan, Y., and Shang, M. (2020). Study of hydro-chemical characteristics and control factors in pingzhai reservoir of sancha river basin in Guizhou. Environ. Eng. 38 (02), 41–47. doi:10.13205/j.hjgc.202002005
Kong, J., Zhou, Z., and Li, Y. (2021). Study on the characteristics of nitrogen distribution in water bodies of karst Plateau reservoirs:taking pingzhai reservoir as an example. Environ. Sci. and Technol. 44 (11), 116–124. doi:10.19672/j.cnki.1003-6504.1804.21.338
Lai, Li (2011). Carbon emisson effect of land use in China. Nanjing, Jiangsu, China: Nanjing University. Master.
Li, Y., Yao, S., Jiang, H., Wang, H., Ran, Q., Gao, X., et al. (2022). Spatial-temporal evolution and prediction of carbon storage: an integrated framework based on the MOP–PLUS–InVEST model and an applied case study in hangzhou, east China. Land 11 (12), 2213. doi:10.3390/land11122213
Liang, X., Guan, Q., Clarke, K. C., Liu, S., Wang, B., and Yao, Y. (2021). Understanding the drivers of sustainable land expansion using a patch-generating land use simulation (PLUS) model: a case study in wuhan, China. Comput. Environ. Urban Syst. 85, 101569. doi:10.1016/j.compenvurbsys.2020.101569
Lian, H., He, L., and Zhang, W. (2021). Driving factors and divergency of urban construction land expansion in China: an empirical analysis based on panel data of 35 large and medium-sized cities. J. Beijing Normal Univ. (Natur. Sci.) 3, 46–57. Available online at: https://wkxb.bnu.edu.cn/EN/Y2021/V0/I3/46.
Lijing, L., Zhang, X., Lu, Y., and Xiao, H. (2024). Spatial-temporal evolution of land use carbon emissions and influencing factors in zibo, China. Front. Environ. Sci. 12. doi:10.3389/fenvs.2024.1472558
Lin, Q., Zhang, L., Qiu, B., Zhao, Y., and Wei, C. (2021). Spatiotemporal analysis of land use patterns on carbon emissions in China. Land 10 (2), 141. doi:10.3390/land10020141
Liu, J. (2017). The influencial factors and its benefits of cultivated land use based on rural residential agglomeration. Cnki: Nanjing Agriculture University, Nanjing City.
Liu, X., Yu, L., Dong, Q., Peng, D., Wu, W., Yu, Q., et al. (2020). Cropland heterogeneity changes on the Northeast China Plain in the last three decades (1980s–2010s). PeerJ 8, e9835. doi:10.7717/peerj.9835
Liu, X., Wang, Y., Song, Q., and Qi, Y. (2015). Study on carbon emissions sources in china’s urbanization process. China Population. Resources Environ. 25 (1), 61–66. doi:10.3969/j.issn.1002-2104.2015.01.009
Liu, Y., and Long, H. (2016). Land use transitions and their dynamic mechanism: the case of the huang-huai-hai plain. Acta Geogr. Sin. 26 (05), 515–530. doi:10.1007/s11442-016-1283-2
Meng, Q., Zheng, Y., Qi, L., Li, B., and Wei, H. (2023). Analysis of spatiotemporal variation and influencing factors of land-use carbon emissions in nine provinces of the yellow river basin based on the LMDI model. Land 12 (2), 437. doi:10.3390/land12020437
Nabikandi, B. V., Shahbazi, F., Ahmad, H., and Malone, B. (2024). Exploring carbon storage and sequestration as affected by land use/land cover changes toward achieving sustainable development goals. Soil Adv. 2, 100017. doi:10.1016/j.soilad.2024.100017
Prasad, P., Joseph Loveson, V., Chandra, P., and Kotha, M. (2022). Evaluation and comparison of the earth observing sensors in land cover/land use studies using machine learning algorithms. Ecol. Inf. 68, 101522. doi:10.1016/j.ecoinf.2021.101522
Pu, X., Cheng, Q., and Chen, H. (2023). Spatial–temporal dynamics of land use carbon emissions and drivers in 20 urban agglomerations in China from 1990 to 2019. Environ. Sci. Pollut. Res. 30 (49), 107854–107877. doi:10.1007/s11356-023-29477-7
Rong, T., Zhang, P., Zhu, H., Jiang, L., Li, Y., and Liu, Z. (2022). Spatial correlation evolution and prediction scenario of land use carbon emissions in China. Ecol. Inf. 71, 101802. doi:10.1016/j.ecoinf.2022.101802
Ruei-Yuan, W., Cai, H., Chen, L., and Li, T. (2023). Spatiotemporal evolution and multi-scenario prediction of carbon storage in the GBA based on PLUS–InVEST models. Sustainability 15 (10), 8421. doi:10.3390/su15108421
Shi, H., Mu, X., and Zhang, Y. (2012). Effects of different land use patterns on carbon emission in guangyuan city of Sichuan Province. Bull. Soil Water Conservation 32 (3), 101–106. doi:10.13961/j.cnki.stbctb.2012.03.020
Sun, X.-xin, Xue, J.-hui, and Dong, L.-na (2023). Spatiotemporal change and prediction of carbon storage in nanjing ecosystem based on PLUS model and InVEST model. J. Ecol. Rural Environ. 39 (1), 41–51. doi:10.19741/j.issn.1673-4831.2022.0953
Tian, M., Chen, Z., Wang, W., Chen, T., and Cui, H. (2022). Land-use carbon emissions in the yellow river basin from 2000 to 2020: spatio-temporal patterns and driving mechanisms. Int. J. Environ. Res. Public Health 19 (24), 16507. doi:10.3390/ijerph192416507
Tian, S., Wang, S., Bai, X., Luo, G., Li, Q., Yang, Y., et al. (2021). Global patterns and changes of carbon emissions from land use during 1992–2015. Environ. Sci. Ecotechnology 7, 100108. doi:10.1016/j.ese.2021.100108
Tian, Y., and Zhao, X. (2024). Simulation of construction land expansion and carbon emission response analysis of changsha-zhuzhou-xiangtan urban agglomeration based on Markov-PLUS model. Acta Ecol. Sin. 44 (01), 129–142. doi:10.20103/j.stxb.202207061924
Vujovic, Ž. Ð. (2021). Classification model evaluation metrics. Int. J. Adv. Comput. Sci. Appl. 12. doi:10.14569/ijacsa.2021.0120670
Wang, C., Zhou, Z., and Li, Y. (2021). Effects of soil and water loss on reservior carbon sink in karst watersheds. Bull. Soil Water Conservation 41 (6), 1–7. doi:10.13961/j.cnki.stbctb.2021.06.001
Wang, Y., Zhou, Z., and Kong, J. (2023). Tracing and estimation of nitrate sources based on hydrochemistry and nitrogen and oxygen isotopes in karst mountainous water:A case study of the pingzhai reservoir. China Environ. Sci. 43 (10), 5265–5276. doi:10.19674/j.cnki.issn1000-6923.20230705.001
Wei, X., Zhang, S., Luo, P., Zhang, S., Wang, H., Kong, D., et al. (2023). A multi-scenario prediction and spatiotemporal analysis of the land use and carbon storage response in Shaanxi. Remote Sens. 15 (20), 5036. doi:10.3390/rs15205036
Wen, C. (2023). Impact of land use change on carbon effect in damming river basin of karst plateau. Cnki: Guizhou Normal University.
Wenwen, T., Cui, L., Sheng, Z., and Hu, W. (2022). Multi-scenario simulation of land use carbon emissions from energy consumption in shenzhen, China. Land 11 (10), 1673. doi:10.3390/land11101673
Wu, J., Luo, J., Zhang, H., Qin, S., and Yu, M. (2022). Projections of land use change and habitat quality assessment by coupling climate change and development patterns. Sci. Total Environ. 847, 157491. doi:10.1016/j.scitotenv.2022.157491
Xiao, H., Yuan, X., and Li, B. (2012). The effects of land use changes on carbon emission C: take chongqing as an example. J. Chongqing Normal Univ. Sci. 29 (1), 38–42+115.
Xueliang, Y., Minke, X., Yunlu, Z., and Dongyun, L. (2023). Influencing mechanism of urbanization on carbon storage in urban and rural ecological spaces:a case study of beijing. J. Chin. Urban For. 21 (6), 98–105+142. doi:10.12169/zgcsly.2023.06.22.0001
Yajuan, W., Chenxi, Z., Caiyu, L., and Zeyu, C. (2024). Analysis of spatiotemporal differences and influencing factors of land use carbon emissions in Ningxia. Environ. Sci. 45 (09), 5049–5059. doi:10.13227/j.hjkx.202310111
Yali, W., Liu, Y., Wang, Z., Zhang, Y., Fang, B., Jiang, S., et al. (2023). Assessing the spatio-temporal dynamics of land use carbon emissions and multiple driving factors in the guanzhong area of Shaanxi Province. Sustainability 15, 7730. doi:10.3390/su15097730
Yamei, C., and Zhang, C. (2024). Characteristics of spatial–temporal evolution of carbon emissions from land use and analysis of influencing factors in hubao-eyu urban agglomerations, China. Sustainability 16 (17), 7565. doi:10.3390/su16177565
Yang, S., Su, H., and Zhao, G. (2022). Multi-scenario simulation of urban ecosystem service value based on PLUS model: a case study of hanzhong city. J. Arid Land Resour. Environ. 36 (10), 86–95. doi:10.13448/j.cnki.jalre.2022.255
Yang, W., Zhang, X., Ma, B., Wang, Y., Wu, Y., Yan, J., et al. (2023). An open dataset for intelligent recognition and classification of abnormal condition in longwall mining. Sci. Data 10 (1), 416. doi:10.1038/s41597-023-02322-9
Yang, Y., and Li, H. (2022). Monitoring spatiotemporal characteristics of land-use carbon emissions and their driving mechanisms in the yellow river Delta: a grid-scale analysis. Environ. Res. 214, 114151. doi:10.1016/j.envres.2022.114151
Yang, Y., Hu, W., Jia, G., Li, G., and Li, Y. (2023). Scenario simulation integrating the ANN-CA model with the InVEST model to investigate land-based carbon storage in the Dongting Lake area. J. Nanjing Forest. Univ. 47 (4), 175–184. doi:10.12302/j.issn.1000-2006.202110020
Yong, H., and Jiang, Y. (2006). Research on China's climate and terrestrial ecosystem carbon cycle. Beijing: China Meteorological Press.
You, H., and Wu, C. (2010). Carbon emission efficiency and low carbon optimization of land use: based on the perspective of energy consumption. J. Nat. Resour. 25 (11). doi:10.11849/zrzyxb.2010.11.007
Yuan, X. (2022). Study on the impact of road traffic on the expansion of urban and rural construction land. Cnki: East China University of Technology, Nanchang city, China.
Yuan, K., Gan, C., Yang, H., Liu, Y., Chen, Y., and Zhu, Q. (2019). Validation of the EKC and characteristics decomposition between construction land expansion and carbon emission: a case study of wuhan city. China Land Sci. 33 (1), 56–64. doi:10.11994/zgtdkx.20181218.145317
Zhao, H., Zhou, X., Nie, F., and Ma, Y. (2019). Remote sensing and digital image processing. Chengdu, Sichuan: Southwest Jiaotong University Press.
Zhu, H., and Li, X. (2003). Discussion on the index method of regional land use change. Acta Geogr. Sin. (5), 643–650. doi:10.11821/xb200305001
Keywords: LULC change, carbon source and sink, multi-scenario simulation, pingzhai reservoir basin, karst mountainous area
Citation: Ding C, Zhou Z, Wang C, Kong J, Wang Y and Xie R (2025) Multi-scenario simulation of LULC and carbon dynamics in karst regions using the PLUS model. Front. Environ. Sci. 13:1640766. doi: 10.3389/fenvs.2025.1640766
Received: 05 June 2025; Accepted: 08 July 2025;
Published: 29 July 2025.
Edited by:
Zhiheng Yang, Shandong University of Finance and Economics, ChinaReviewed by:
Muhammad Yousuf Jat Baloch, Shandong University, ChinaLinshen Wang, University of Jinan, China
Jianzhi Liu, Henan University, China
Copyright © 2025 Ding, Zhou, Wang, Kong, Wang and Xie. This is an open-access article distributed under the terms of the Creative Commons Attribution License (CC BY). The use, distribution or reproduction in other forums is permitted, provided the original author(s) and the copyright owner(s) are credited and that the original publication in this journal is cited, in accordance with accepted academic practice. No use, distribution or reproduction is permitted which does not comply with these terms.
*Correspondence: Zhongfa Zhou, ZmE2ODk3QGd6bnUuZWR1LmNu