 Lin Lin Zheng
 Jing Yang Zhang1
- 1Beibu Gulf University, Qinzhou, China
- 2Shandong University, Jinan, China
- 3Yunnan University, Kunming, China
With the intensification of global climate change and ecological issues, the efficiency of forest ecological product value realization (FEPVRE) has become crucial in driving the green economy transformation. This paper, based on the Super-SBM model, measures FEPVRE across 30 Chinese provinces from 2012 to 2022. It employs methods such as spatial kernel density estimation, Markov chain analysis, the Gini coefficient method, the gravity model, and Quadratic Assignment Procedure (QAP) to assess its spatial distribution and dynamics. Additionally, spatial econometric models are applied from the perspective of the digital economy to explore the driving mechanisms of digital technologies, industries, and the digital environment on FEPVRE. The findings show: (1) FEPVRE in China exhibits fluctuating trends, with a convergence pattern from east to west. (2) FEPVRE associations shift from the eastern to the central regions, with stronger associations in the southeast. (3) FEPVRE will continue differentiating into two levels, with type IV regions prone to “level-locking” and club convergence. (4) Uneven digital technology distribution worsens regional disparities, but digital industries and environments help narrow the gap. (5) Eastern and Northeastern regions have higher FEPVRE due to better digital infrastructure and policies, while Central and Western regions face challenges, resulting in negative spillovers. High-efficiency regions positively influence neighboring areas. To achieve a balanced and sustainable green economy, bridging the digital divide in underdeveloped regions and promoting digital industries is key. Improving digital infrastructure will enhance FEPVRE and support an inclusive green economy.
1 Introduction
The increasing forest ecological product value realization efficiency (FEPVRE) has expanded the value of forest ecosystem products (FEPV) beyond traditional economic dimensions, incorporating ecological, social, and cultural aspects. Forest ecosystem products refer to benefits derived from forests, such as wood, non-timber products, climate regulation, and biodiversity, while ecological products include all ecosystem services, such as water purification and carbon sequestration, provided by various ecosystems like forests and wetlands. This transformation is analyzed through ecological economics and sustainable development theories, emphasizing the importance of forest ecosystem services in promoting environmental sustainability and socio-economic development at regional and national scales (Rusanen et al., 2024). The “Opinions on High-Level Protection and Efficient Utilization of Natural Resources to Promote Ecological Product Value Realization,” released in December 2024, highlights the need to leverage the market’s role, promote resource rights marketization, and ensure reasonable returns from protecting green mountains and clear waters. The policy also explores establishing a system for balancing the natural coastline and enforcing strict ecological protection red lines. Under this policy, entities may transfer supplementary arable land indicators generated by converting non-arable land to arable land. Pilot projects will focus on converting construction land within ecological protection red lines into forest land, grassland, or wetlands, and reclaimed land may be proportionally converted into new urban construction land without expanding the development boundary. This underscores the importance of measuring FEPVRE, as it helps assess how forest ecosystem products contribute to economic, ecological, and social benefits, ensuring ecosystem protection is both sustainable and economically viable.
The policy promotes market mechanisms, such as ecological compensation and carbon markets, to enhance forest ecosystem protection. Ecological compensation incentivizes local governments and businesses to engage in restoration and sustainable land use, ensuring the value of ecosystem services is recognized and financially supported. Carbon markets link the economic value of forest ecosystem services to market incentives, promoting forest protection and restoration. Together, these instruments improve FEPVRE by providing financial support for sustainable forest management, valuing services like climate regulation and carbon sequestration, and promoting both economic viability and environmental sustainability. FEPVRE aligns with the policy’s aim to realize ecological product value by quantifying forest ecosystem services. Furthermore, it enhances social welfare, promotes public health, and carries cultural value (Lee et al., 2022; Riedl et al., 2024). Despite growing recognition of the FEPV, research on FEPVRE largely focuses on its economic dimension, often overlooking its ecological, social, and cultural impacts. This study addresses this gap by exploring how digital technologies and market mechanisms can enhance FEPVRE measurement, ensuring all dimensions are considered. FEPVRE measures how effectively forest ecosystem products—such as material supply, regulatory services, and cultural services—are transformed into economic and social benefits. Previous research has mainly focused on ecosystem service valuation and sustainable resource management, often overlooking the role of digital technologies and market mechanisms in improving FEPVRE. The “Two Mountains” theory, which stresses balancing economic development with environmental conservation, provides a new framework to understand the relationship between forest ecosystem services and socio-economic development. This theory advocates for integrating ecological health with economic growth to support green transformation for sustainable development.
Despite these contributions, there is a gap in the literature regarding the integration of digital technologies and market mechanisms into FEPVRE measurement models. This gap limits the ability to fully optimize the efficiency of forest ecosystem products. This study aims to address this by applying the Technology-Organization-Environment (TOE) framework, which combines digital technologies, industry innovations, and environmental factors to provide a more comprehensive view of FEPVRE. The TOE framework highlights the role of digital technologies in driving sustainable development, offering new opportunities to improve forest ecosystem services’ efficiency and effectiveness. Furthermore, while FEPVRE’s economic aspects have been well explored, its ecological, social, and cultural dimensions are often overlooked. To fill these gaps, this study seeks to answer the following research question: How can FEPVRE be measured, and what are the key factors influencing its spatial and temporal development across regions in China? The study aims to: (1) measure the development level of FEPVRE, (2) analyze its spatiotemporal evolution and regional disparities, and (3) identify the factors influencing FEPVRE, particularly the role of digital technology, digital industries, and the digital environment. This approach will not only address the gaps in existing research but also offer a more comprehensive framework for improving FEPVRE.
2 Literature review
Existing research primarily focuses on the economic and ecological dimensions of FEPV, particularly in areas such as monetary valuation, market-based mechanisms, and the role of forestry in sustainable development (Grum and Boncina, 2024). However, studies rarely address how digital technologies, industrial modernization, and green development initiatives influence FEPVRE across space and time. This paper incorporates ecological economics and Green Growth theories to explore pathways for improving FEPVRE, including pure technical efficiency, enhancing the value of forestry’s secondary and tertiary industries, increasing technology application, and improving human capital (Lou et al., 2024; Xu et al., 2025; Wang et al., 2023). Scientifically evaluating and realizing its comprehensive value has become a core task in promoting green development and ecological civilization. Methods for realizing the economic and social value of forest ecosystem products, such as establishing cross-regional ecological conversion mechanisms and empowering forestry through the digital economy, are also explored (Hua et al., 2024; Li and Liu, 2024; Yao and Sun, 2023; Jiang et al., 2024). While existing research mainly focuses on combining green industry chain development with the marketization of ecological products to enhance FEPVRE (Wang et al., 2022; Huang H. et al., 2024), analytical methods like cost-benefit analysis, ecosystem service evaluation, and distributed calculation are commonly used to assess FEPVRE (Yu et al., 2018; Li et al., 2023; Acharya et al., 2021). Additionally, measurement systems reflecting regional disparities in FEPVRE have been developed from perspectives such as new productive forces, digital villages, human capital, and the dual carbon goals (Chen et al., 2023; Zhang Y.-f. et al., 2023; Chen and Zhang, 2023; Su and Li, 2024). Despite this progress, there are areas for improvement: current measurement systems often rely on traditional productivity indicators, failing to fully account for the impact of emerging technologies and industrial modernization. A more refined measurement framework that integrates ecological, economic, and social dimensions is needed to better reflect FEPVRE (Wang et al., 2022; X et al., 2023).
Moreover, most studies on regional disparities focus on county or local levels, often neglecting the inter-provincial and high-density economic areas. The spatial distribution dynamics of FEPVRE, which examine how its efficiency evolves across different regions, remain underexplored. Few studies have analyzed the synergistic effects of technological, industrial, and policy factors on regional disparities in FEPVRE, particularly at larger spatial scales (Shi et al., 2021; Li et al., 2025; Zhang et al., 2023b). Furthermore, existing research seldom considers the synergistic effects of technological innovation, industrial modernization, and green productivity in driving the maximization of FEPVRE (Wang et al., 2023; Hu et al., 2023). Recent studies have introduced frameworks integrating ecological, economic, and social dimensions to improve FEPVRE measurement. Methods like Cost-Benefit Analysis, Ecosystem Service Evaluation, and Spatial Analysis (e.g., Super-SBM model, Markov chains, spatial Gini coefficient) examine FEPVRE’s spatial distribution, highlighting regional disparities and trends. QAP Methods are used to analyze how technological, industrial, and policy factors influence FEPVRE (Ythier, 2022; Schultz et al., 2012; Li et al., 2020; Reb and er, 2013; Jones et al., 2023).
Based on these insights, a multidimensional FEPVRE measurement system has been constructed, considering economic, social, and ecological impacts (Barth and Doell, 2016; Bush et al., 2024; Chang et al., 2021; Chen et al., 2022; Guo et al., 2001; Kindler, 2016; Zandebasiri et al., 2023; Yang et al., 2023; Quoc Tuan et al., 2012; Ojea et al., 2010). This system, applied to the provincial and municipal levels in China, uses complex system interactions to provide new perspectives on FEPVRE. The main innovations of this paper are as follows: First, it develops a measurement system that combines the economic, ecological, and social dimensions of FEPV, enabling a comprehensive evaluation of forest ecosystem product values at the provincial and municipal levels in China. Second, by applying spatial analysis methods such as the Super-SBM super efficiency model, Markov chains, spatial Gini coefficient, and QAP methods, this paper analyzes FEPVRE disparities within and between provinces and cities in China, revealing trends in value efficiency changes at different spatial scales. These methods collectively provide a comprehensive understanding of regional disparities and their evolution over time. Third, this study constructs a measurement framework for FEPVRE using input-output methods and incorporates the TOE (Technology, Organization, and Environment) framework, alongside Sustainable Development Goals (SDGs) theory and Green Growth models, to explore the interactions between digital technology, industry transformation, and ecological services in enhancing FEPVRE.
The contributions of this research are twofold: it introduces a multidimensional approach to FEPVRE measurement, expanding beyond traditional economic indicators to include ecological and social factors; and it broadens FEPVRE research by incorporating the role of digital technologies, industry transformation, and sustainable development, providing valuable insights for policymakers aiming to improve forest ecosystem product efficiency and promote long-term sustainability. The specific research framework is shown in Figure 1.
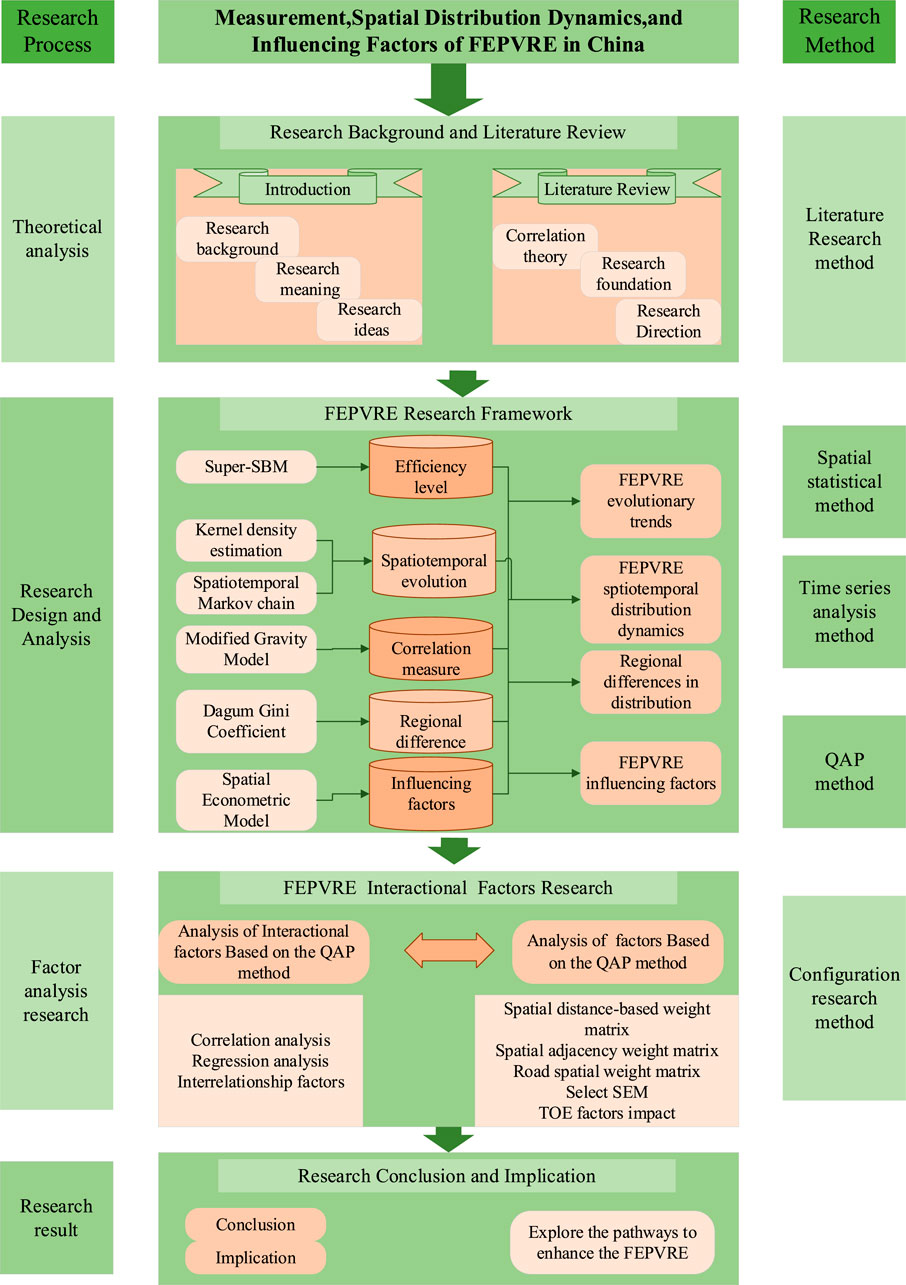
Figure 1. Framework for the study of FEPVRE.
3 Research design
3.1 Model specification
3.1.1 Super-SBM super efficiency
The Super-SBM model, proposed by Tone et al., which has its foundation in data envelopment analysis (DEA). This integration enables the effective evaluation of forest ecosystem products by considering both ecological efficiency and economic growth, ensuring a comprehensive analysis of FEPVRE (Tone, 2002; Zhang et al., 2023c). The Super-SBM model improves the identification and comparison of efficiency levels of different Decision-Making Units (DMUs) compared to traditional efficiency models. In this study, each province in China is considered a DMU, and efficiency analysis is performed using the non-oriented Super-SBM model. The FEPVRE for Chinese provinces from 2012 to 2022 is calculated using MATLAB software. The specific formula is as follows:
In Equation 1,
3.1.2 Spatiotemporal evolution
Spatial kernel density estimation (SKDE) is a valuable tool for understanding FEPVRE and regional disparities. By incorporating both spatial and temporal factors, SKDE provides a more accurate assessment of FEPVRE’s distribution, revealing trends and variations across regions over time. Unlike traditional kernel density estimation, SKDE integrates spatial and temporal factors, allowing for a better estimation of the distribution of random variables under spatiotemporal conditions (Hohl et al., 2022). The following formula illustrates the dynamic distribution of FEPV in China:
In Equation 2,
In Equation 3,
The spatiotemporal Markov chain analysis is a dynamic method for examining the transition trends of FEPVRE. It is essential for understanding the dynamics of FEPVRE and regional disparities. Building on SKDE, this approach helps identify transition trends and regional evolution in FEPVRE. By incorporating spatial lag, it effectively considers the impact of spatial effects and geographic context (Zhao et al., 2023), revealing the spatial dynamics of FEPV changes within regions. This method enables the analysis of the transition and evolution of ecological product value realization states between different provinces and cities, improving the accuracy of FEPVRE assessments for forest ecosystem products in China and deepening the understanding of spatiotemporal impacts. In this model, regional states are classified into k types, forming a k × k probability transition matrix. The element
In Equation 4, k represents the number of FEPVRE types, where k = 4.
The Markov Chain method is used because it effectively models the temporal transitions of FEPVRE states across regions, accounting for spatial dependencies and the influence of previous states. This method is particularly suited for capturing dynamic processes and transition trends over time, making it more appropriate than other methods for analyzing FEPVRE, especially in the context of regional disparities. As shown in Table 1.
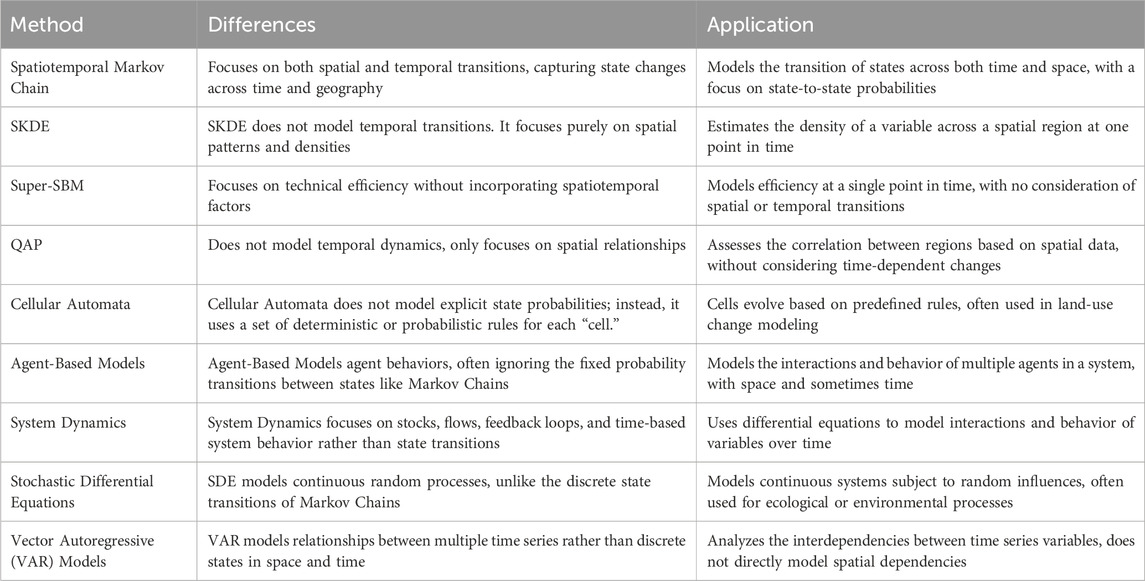
Table 1. Comparison of Markov chain method and other dynamic analysis methods.
3.1.3 Modified gravity model
The traditional gravity model has limitations due to its reliance on a single indicator and the use of symmetric parameters, often set to 1. The modified gravity model, however, better aligns with actual conditions. To enhance the understanding of FEPVRE and regional disparities, the modified gravity model provides valuable insights. Building on SKDE and spatiotemporal Markov chain analysis, it quantifies spatial interactions between provinces and cities. By considering factors such as employment in the forestry sector, forestry industry value, and economic distance, the modified gravity model offers an objective measure of the correlation between FEPVRE across regions, complementing previous analyses (Huang Y. et al., 2024). The specific formula is as follows:
In Equation 5,
3.1.4 Dagum Gini coefficient
The Dagum Gini coefficient is used to analyze regional disparities in FEPVRE in China (Huang et al., 2025). Building on methods like SKDE, spatiotemporal Markov chain analysis, and the modified gravity model, this approach quantifies FEPVRE differences across regions. By quantifying the differences between different regions, it helps to better understand the synergistic relationships within regions and across regions, as well as their impact on FEPVRE. This method is integrated with spatiotemporal Markov chain analysis and other techniques to offer a multidimensional view of FEPVRE, revealing trends in spatial efficiency and the factors driving regional disparities. This combined approach enhances our understanding of how FEPVRE evolves across different regions, providing a valuable framework for addressing disparities and promoting long-term sustainability. The specific formula is as follows:
In Equation 6,
3.1.5 QAP method
The QAP method is used to analyze the correlation and dependence of spatial data. In this study, the QAP method is employed to assess the effects of T, O, and E on regional disparities in FEPVRE. Through correlation and regression analysis, it compares paired data to reveal interactions and spatial relationships between variables. Building on methods like SKDE, Markov chain analysis, the modified gravity model, and the Dagum Gini coefficient, the QAP method analyzes the effects of multiple variables on regional disparities (Jia et al., 2024). However, while the QAP method primarily identifies relationships and dependencies between regions, spatial econometric models, such as the SAR and SEM, go further by analyzing spatial causality and dependencies. These models help us understand how neighboring regions influence each other and identify spatial spillover effects, providing quantitative insights into spatial relationships. Together, these approaches offer a comprehensive understanding of regional disparities in FEPVRE, with QAP revealing spatial patterns and econometric models analyzing causal relationships.
3.1.6 Spatial econometric model
Based on the related studies (Li et al., 2022; Junru and Mingyang, 2024), the spatial econometric model is initially specified as follows:
The spatial econometric model is used to capture the spatial dependencies in FEPVRE across different regions. In the model, FEPVRE represents the forest ecosystem product value realization efficiency, and TOE represent digital technology, digital industry, and the digital environment, respectively.
The QAP and Spatial Econometric Models both analyze spatial relationships and dependencies but differ significantly in their approach and application. The QAP method is a non-parametric technique that identifies correlations and dependencies between spatially distributed variables, focusing on detecting patterns without assuming a specific model structure. It is particularly useful for exploring interactions in complex systems, especially with networked data. In contrast, Spatial Econometric Models are parametric regression models that quantify spatial relationships by accounting for spatial dependence and lag effects. These models provide a more comprehensive understanding of spatial causality and spillover effects, revealing both direct and indirect influences between regions. As shown in Table 2.
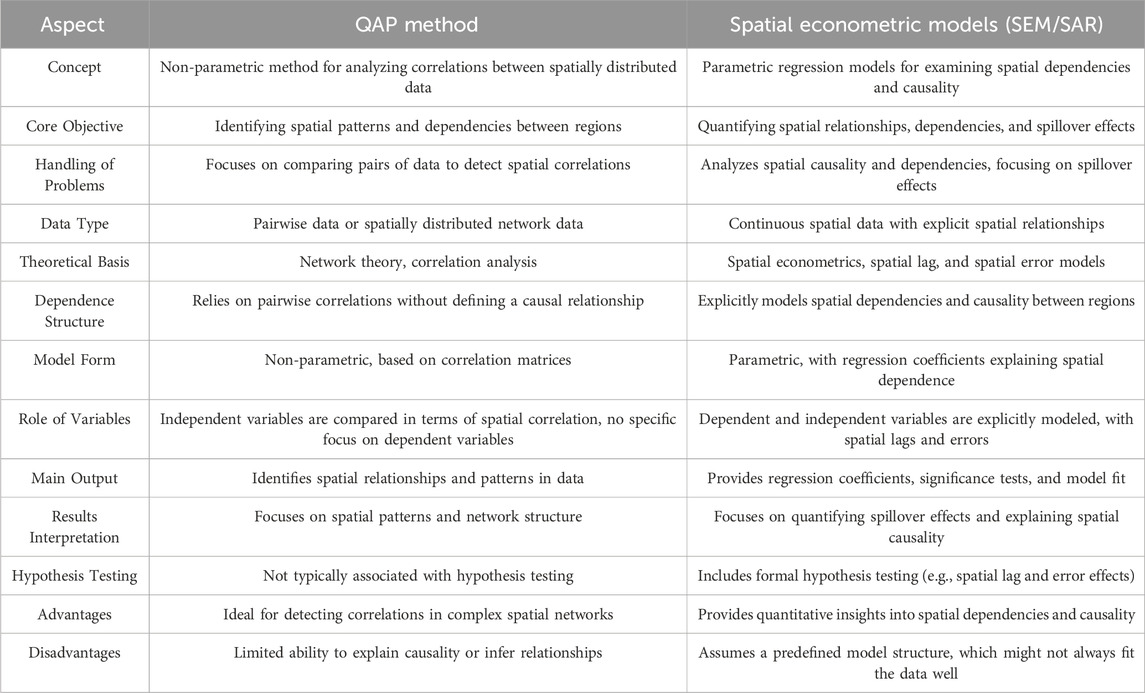
Table 2. The difference between the QAP method and spatial econometric models.
3.1.7 The entropy method
The use of the entropy method to measure the levels of digital technology, digital industry, and digital environment not only avoids the randomness and arbitrariness of subjective weighting methods but also resolves the issue of information overlap among multiple indicators. Therefore, it is considered an objective and scientific method for determining weights. Specifically, the greater the data dispersion, the smaller the information entropy, and the greater the impact and weight of the indicator on the overall evaluation. Conversely, the smaller the data dispersion, the greater the information entropy, and the lower the weight of the indicator. The specific steps and calculation formula of the entropy method are as follows.
1. Data Standardization. Since the units and value ranges of different indicators may vary, it is necessary to standardize the raw data to eliminate the impact of units. The standardization formula is as follows:
positive indicators:
negative indicators:
In the Equations 9, 10,
2. Calculating Information Entropy. Information entropy reflects the amount of information contained in an indicator. The smaller the information entropy, the greater the information content, and the higher the weight of the indicator should be. The formula for calculating information entropy is as follows:
In the Equation 11 formula,
3. Calculation of Redundancy. Redundancy is the opposite of information entropy and reflects the degree of redundancy in the indicator information. The Formula 13 for calculating redundancy is as follows:
4. Calculation of Weights. The weights of each indicator are calculated based on redundancy, and the formula is as follows:
In the Formula 14,
5. The composite evaluation index is obtained by performing a weighted sum of each decision unit’s performance across various indicators, according to the weight of each indicator, to derive a composite score. The composite evaluation index
In Formula 15,
3.1.8 The number of broadband internet access ports
In the China Statistical Yearbook, the statistics for broadband internet access ports consider various types of access methods, aggregating the port numbers of different technologies to derive a total. Generally, the calculation formula is:
In Formula 16, the port numbers for various access methods mainly include ADSL (Asymmetric Digital Subscriber Line) access ports, Fiber optic access (such as FTTH, FTTB, FTTC) ports, Wireless broadband access (such as 4G, 5G access) ports and Other broadband access technologies (such as Hybrid Fiber-Coaxial (HFC), satellite broadband, etc.). Among these, In Formula 17, the number of ADSL access ports is primarily based on the ADSL ports in the fixed telephone network. The formula for this can be expressed as:
In Formula 18, fiber optic access ports (FTTx), fiber optic access port statistics are usually subdivided into FTTH, FTTB, FTTC, and so on, with separate statistics for each type of access. The formula is:
The number of wireless broadband access ports includes wireless access based on mobile networks (such as 4G, 5G, etc.). The statistical method typically determines the number of ports based on the number of base stations, access points, and other factors related to each technology. The Formula 19 is:
3.2 FEPVRE indicator system construction
3.2.1 Dependent variable
This study measures FEPVRE using input-output methods based on scientific accuracy, comprehensiveness, and operability. The selection of input and output indicators follows a systematic process informed by prior research and expert recommendations (Xu et al., 2025). Input indicators primarily reflect the resources and investments directed towards forest ecosystems, which are essential for sustainable forest management and ecosystem service provision. For instance, Forest Material Preservation Value represents the value of timber and non-timber products, directly influencing the forest’s ability to provide materials for economic use and aligning with the Forest Product Value indicator. These resources also support other vital ecosystem services, such as Water Yield Value and Carbon Sequestration Service Value, contributing to ecological stability. The Forestry Fixed Asset Investment indicator represents capital directed towards forest infrastructure, machinery, and technological advancements, ensuring effective forest management and enhancing the quality and scale of forest products and services. It complements Forest Material Preservation Value by facilitating sustainable resource extraction and boosting productivity. The Number of People Employed in Forestry reflects human capital investment, supporting effective forest management, conservation, and sustainable utilization, while directly contributing to the Forest Recreation Value and other ecosystem services. These indicators highlight the role of human and financial resources in improving forest ecosystem outcomes and advancing the broader goals of FEPVRE. Data for input indicators, such as forest product value, water yield, and carbon sequestration, focus on the tangible and intangible benefits derived from forests, including their role in water regulation and carbon mitigation. Other indicators, like oxygen release, air purification, and soil conservation, emphasize critical ecological services like maintaining oxygen levels, improving air quality, and preventing soil erosion. Forest recreation value underscores the socio-cultural benefits provided by eco-tourism and recreational services. Additionally, forestry fixed asset investment and employment in forestry serve as key indicators for assessing the economic activities and human resources invested in forest ecosystems (Huang et al., 2025).
Output indicators evaluate the economic impact of forest ecosystems through different sectors. The forestry primary industry output represents economic contributions from timber production and harvesting, while the secondary industry output reflects the value derived from processing and transforming forest products. The tertiary industry output includes services linked to forests, such as eco-tourism and wellness services. These indicators were selected based on their relevance to forest ecosystem services and their availability in national and provincial data sources. The study uses the China Statistical Yearbook (2012–2022) and the China Forestry Statistical Yearbook to ensure comprehensive data coverage, focusing on consistent and comparable data across provinces. Based on these input and output indicators, this study constructs a measurement framework for FEPVRE that includes 12 indicators, as shown in Table 3.
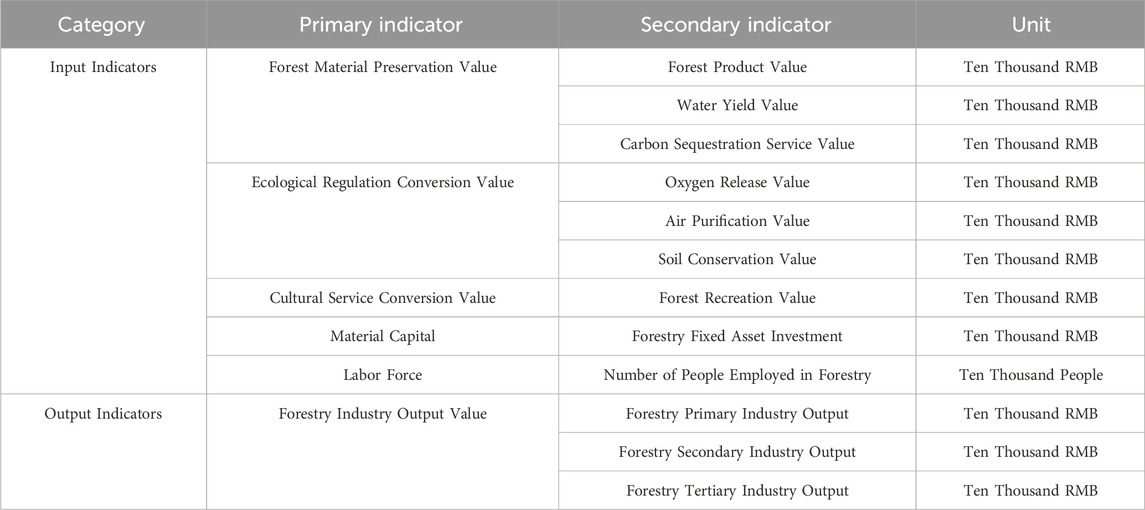
Table 3. Indicator system for measuring FEPVRE.
3.2.2 Explanatory variables
The TOE framework consists of three components: Digital Technology (T), Digital Organization (O), and Digital Environment (E). Based on research by scholars (Miao and Zhao, 2023), this framework has been widely applied in green development, particularly for analyzing how digital technologies, organizational structures, and the digital environment influence economic and ecological systems. The TOE framework is selected for analyzing factors influencing FEPVRE because it offers a comprehensive approach to assess how digital advancements drive environmental, organizational, and technological changes that impact forest ecosystem services and their value realization. The rapid growth of digital technologies and the digital economy plays a crucial role in shaping FEPVRE. By focusing on the digital economy, this study explores how innovations in digital technology, organizational structures, and the digital environment influence the utilization, conservation, and management of forest ecosystem products. This perspective provides a deeper understanding of digitalization’s role in green development, which may not be fully captured by broader ecological, economic, and social viewpoints. Analyzing FEPVRE through the digital economy lens helps assess how digital transformation impacts forest ecosystem efficiency. This approach aligns with the study’s objective of understanding the influence of digital technologies and organizational structures on FEPVRE, supporting more sustainable and efficient forest resource management. The model highlights key drivers of FEPVRE within the digital economy, addressing current and future challenges in forest ecosystem management. Therefore, the study focuses on the dimensions of digital economy—digital technology (T), digital organization (O), and digital environment (E)—and constructs a FEPVRE-driven development model, as shown in Figure 2.
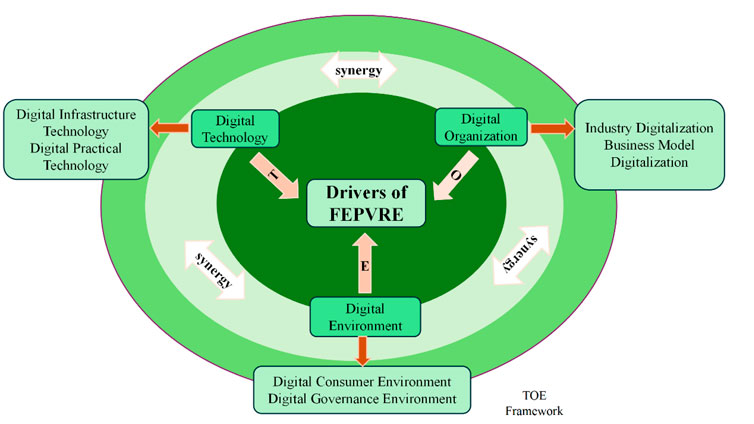
Figure 2. TOE framework for FEPVRE driven model.
Digital Technology (T). Based on the research (Xu et al., 2025), this study identifies digital infrastructure technologies and digital practice technologies as key driving factors of digital technology. Digital infrastructure indicators include long-distance optical cable line density (km/km2), number of broadband Internet access ports (per 10,000 people), and network connection addresses (per 10,000 people). Digital practice technologies include mobile phone penetration rate (%), Internet penetration rate (%), and telecom business revenue (million RMB). A composite digital technology index is calculated using the entropy method, integrating both digital infrastructure and digital practice technologies. This method assigns weights to each variable based on its contribution to the overall digital technology index, mitigating the impact of multicollinearity and ensuring each indicator contributes uniquely.
Digital Organization (O). this research focuses on digital industries and the digitalization of business models. Digital industry indicators include total telecom services, information technology service revenue (million RMB), and software revenue (million RMB). The digitalization of business models is represented by e-commerce sales volume, the proportion of e-commerce transaction activities conducted by enterprises (%), and the number of websites per 100 enterprises. A composite digital industry index is computed using the entropy method, integrating both digital industry and business model digitalization.
Digital Environment (E). Based on the research by scholars (Huang et al., 2025), this study considers the digital consumer environment and the digital government environment as key factors. The digital consumer environment includes indicators like total household consumption expenditure (million RMB) and online retail sales (million RMB), reflecting digital adoption and e-commerce activity. The digital government environment is represented by the online government service capability index (%), which measures the effectiveness of digital government platforms in delivering services to the public. A composite digital environment index is calculated using the entropy method, integrating both digital consumer behavior and government service capabilities.
While other factors, such as governance and institutional environments, could offer deeper insights, these selected indicators are directly relevant to assessing the impact of the digital landscape on FEPVRE. They connect digital technology to economic activities (digital consumer behavior) and governance (digital government services), providing a measurable understanding of how digital resources enhance forest ecosystem services.
3.2.3 Control variables
The control variables include urbanization development level, economic development level, infrastructure level, fiscal expenditure scale, and technological innovation level. These were selected based on a thorough literature review and their established influence on FEPVRE (Kaoru, 1800). Data were gathered from the China Statistical Yearbook, with criteria based on their relevance across provinces and their significance in shaping regional economic and ecological conditions. The urbanization development level is measured by the proportion of the urban population in the total permanent population. It influences the demand for forest ecosystem services, urban pressure on forest ecosystems, and resource management. The economic development level is represented by the logarithm of per capita GDP, reflecting the region’s economic growth. The infrastructure level is quantified by the ratio of road mileage to the administrative area. Well-developed infrastructure facilitates the transport of forest products, efficient delivery of ecosystem services, and the economic development of forest-dependent regions. The fiscal expenditure scale is measured by the ratio of government fiscal expenditure to GDP. The technological innovation level is represented by the product of the ratio of total agricultural machinery power to forestry industry output value and the ratio of forestry value-added. This captures technological progress in agriculture and forestry, reflecting mechanization and innovation that improves productivity and resource allocation in forest ecosystems. Total agricultural machinery power represents technological innovation in agriculture and forestry. It improves resource allocation and productivity, particularly important for forest ecological product production. Including this variable enhances the analysis accuracy by accounting for technological advancements and eliminating regional disparities.
In summary, these control variables are widely recognized for their relevance and ensure a comprehensive analysis of the factors affecting FEPVRE, resulting in a more accurate evaluation of regional disparities.
3.3 Data sources
Data for this study were sourced from publicly available statistical yearbooks, including the China Statistical Yearbook (2012–2022), China Forestry Statistical Yearbook, and China Forestry and Grassland Statistical Yearbook, covering 30 provinces in China. Tibet, Hong Kong, Macau, and Taiwan were excluded due to missing or inconsistent data, which could affect the reliability of the analysis. The selected sources were chosen based on their comprehensiveness and consistency over time, ensuring reliable and comparable data. In addition, remote sensing data were incorporated from the Resource and Environmental Science and Data Center of the Chinese Academy of Sciences and the National Meteorological Data Center, providing a more granular view of ecological changes across regions. Remote sensing data for green economy products at the provincial and municipal levels were sourced from the Resource and Environmental Science and Data Center, National Tibetan Plateau Science Data Center, National Meteorological Data Center, Geospatial Data Cloud, and the National Earth System Science Data Center. These data are crucial for studying forest ecosystem product environmental changes, ecosystem services, and resource utilization efficiency. Soil data were derived from the World Soil Database (HWSD), jointly constructed by the Food and Agriculture Organization (FAO) and the International Institute for Applied Systems Analysis (IIASA). The soil data for China, available at a 1:1,000,000 scale, cover the period from 2012 to 2022, with missing values supplemented using interpolation methods. Descriptive statistics for each variable are presented in Table 4.
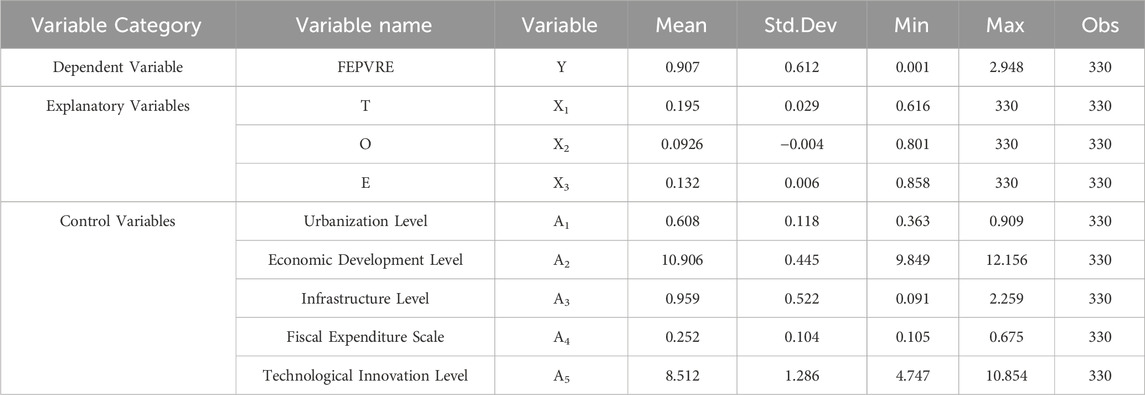
Table 4. Descriptive statistics.
4 Results
4.1 Forest ecosystem product value realization efficiency
FEPVRE serves as the basis for studying regional efficiency disparities across China. The analysis of efficiency development trends highlights the specific differences and evolution of FEPVRE in the country’s four major regions. The results indicate a fluctuating trend in FEPVRE development across regions. Significant fluctuations from 2012 to 2020 reflect the early stages of China’s green transformation and ecological civilization strategy. Policymakers should address these regional disparities, especially in the western and northeastern regions, where FEPVRE lags behind. The measurement results are presented in Table 5, and the efficiency evolution trend is shown in Figure 3.
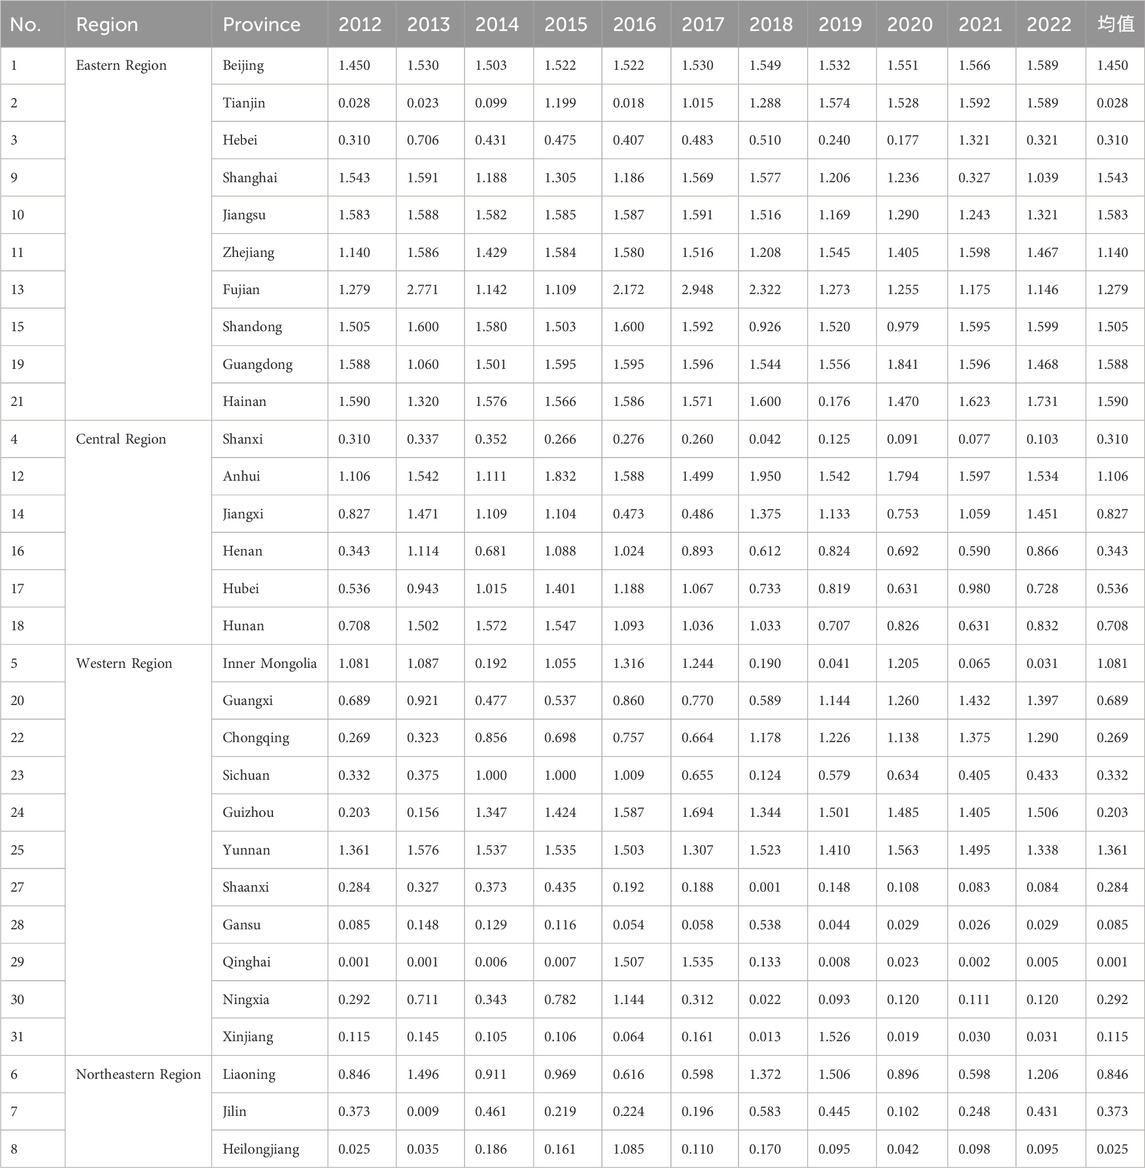
Table 5. Measurement results of FEPVRE in China.
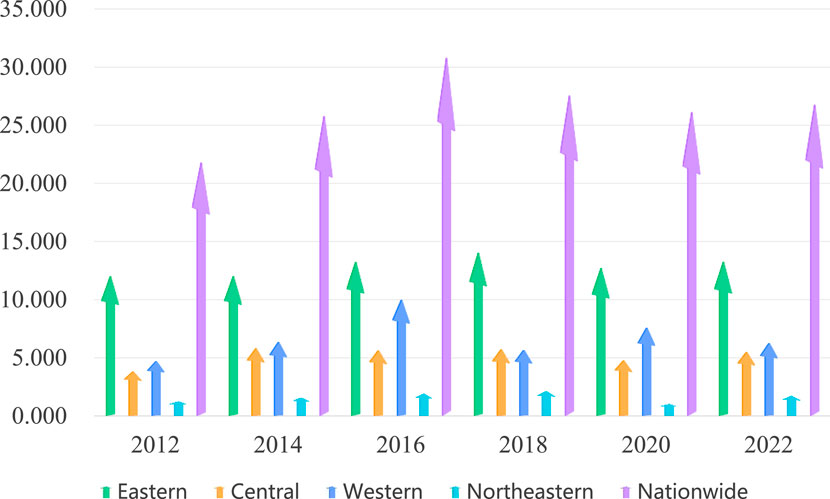
Figure 3. Evolution trend of FEPVRE in China from 2012 to 2022.
From 2012 to 2022, the national average FEPVRE showed a fluctuating trend with significant regional disparities. The Eastern region outperformed the Western and Northeastern regions due to higher investments in green technology and ecological development. Policymakers should prioritize digital infrastructure and green innovation to enhance efficiency in lagging regions, especially the Western and Northeastern areas. In 2016, the FEPVRE peaked at 30.81%, indicating highly efficient utilization of forest ecosystem products in China. However, between 2016 and 2020, a decline occurred due to pressures from China’s “dual carbon goals.” Regions heavily reliant on traditional industries faced challenges aligning with the green transformation. Policymakers should support these areas, fostering a balanced transition to a low-carbon economy with targeted policies and incentives. A noticeable convergence trend emerged, with the Western region’s FEPVRE gradually approaching that of the Central region, while the Northeastern region remained relatively low and grew slowly. The Eastern region’s higher FEPVRE values were driven by investments in ecological construction and green industry innovation. The Central region showed larger fluctuations due to challenges in economic transitions, such as significant population movements and industrialization. The Western region, particularly provinces like Guizhou, Guangxi, and Sichuan, displayed fluctuating growth linked to abundant natural resources and successful green development strategies. The Northeast region, with low FEPVRE values and minimal improvement, struggled with imbalanced resource development due to structural adjustments in industrialization.
4.2 Association of FEPVRE
Regional disparities between the East and West are the primary drivers of differences in FEPVRE across China. This study employs a modified gravity model to measure the degree of association in FEPVRE among the 30 provinces and cities, aiming to identify the intensity of regional connections. Figures 4(a-k) illustrates the FEPVRE association from 2012 to 2022. The analysis reveals that the Eastern region is closely linked with the Central region, indicating potential for inter-regional cooperation in green development. Conversely, the Western and Northeastern regions show weaker connections, presenting opportunities for enhanced regional cooperation. Policymakers could foster partnerships to improve FEPVRE in less developed regions by promoting knowledge and resource sharing. Using the natural breakpoints classification method, regions are divided into four levels based on cooperation strength. The Western region has fewer intensive connections, resulting in lower cooperation in FEPVRE compared to the Eastern and Central regions. Over time, high-level cooperation has been concentrated in the Southeastern region, with Guangdong leading the way. In contrast, the Western region lacks inter-regional cooperation or collaborative cities. The FEPVRE cooperation network in China demonstrates a “Matthew Effect,” where provinces and cities with higher cooperation intensities cluster together, reinforcing the unequal distribution of FEPVRE development.
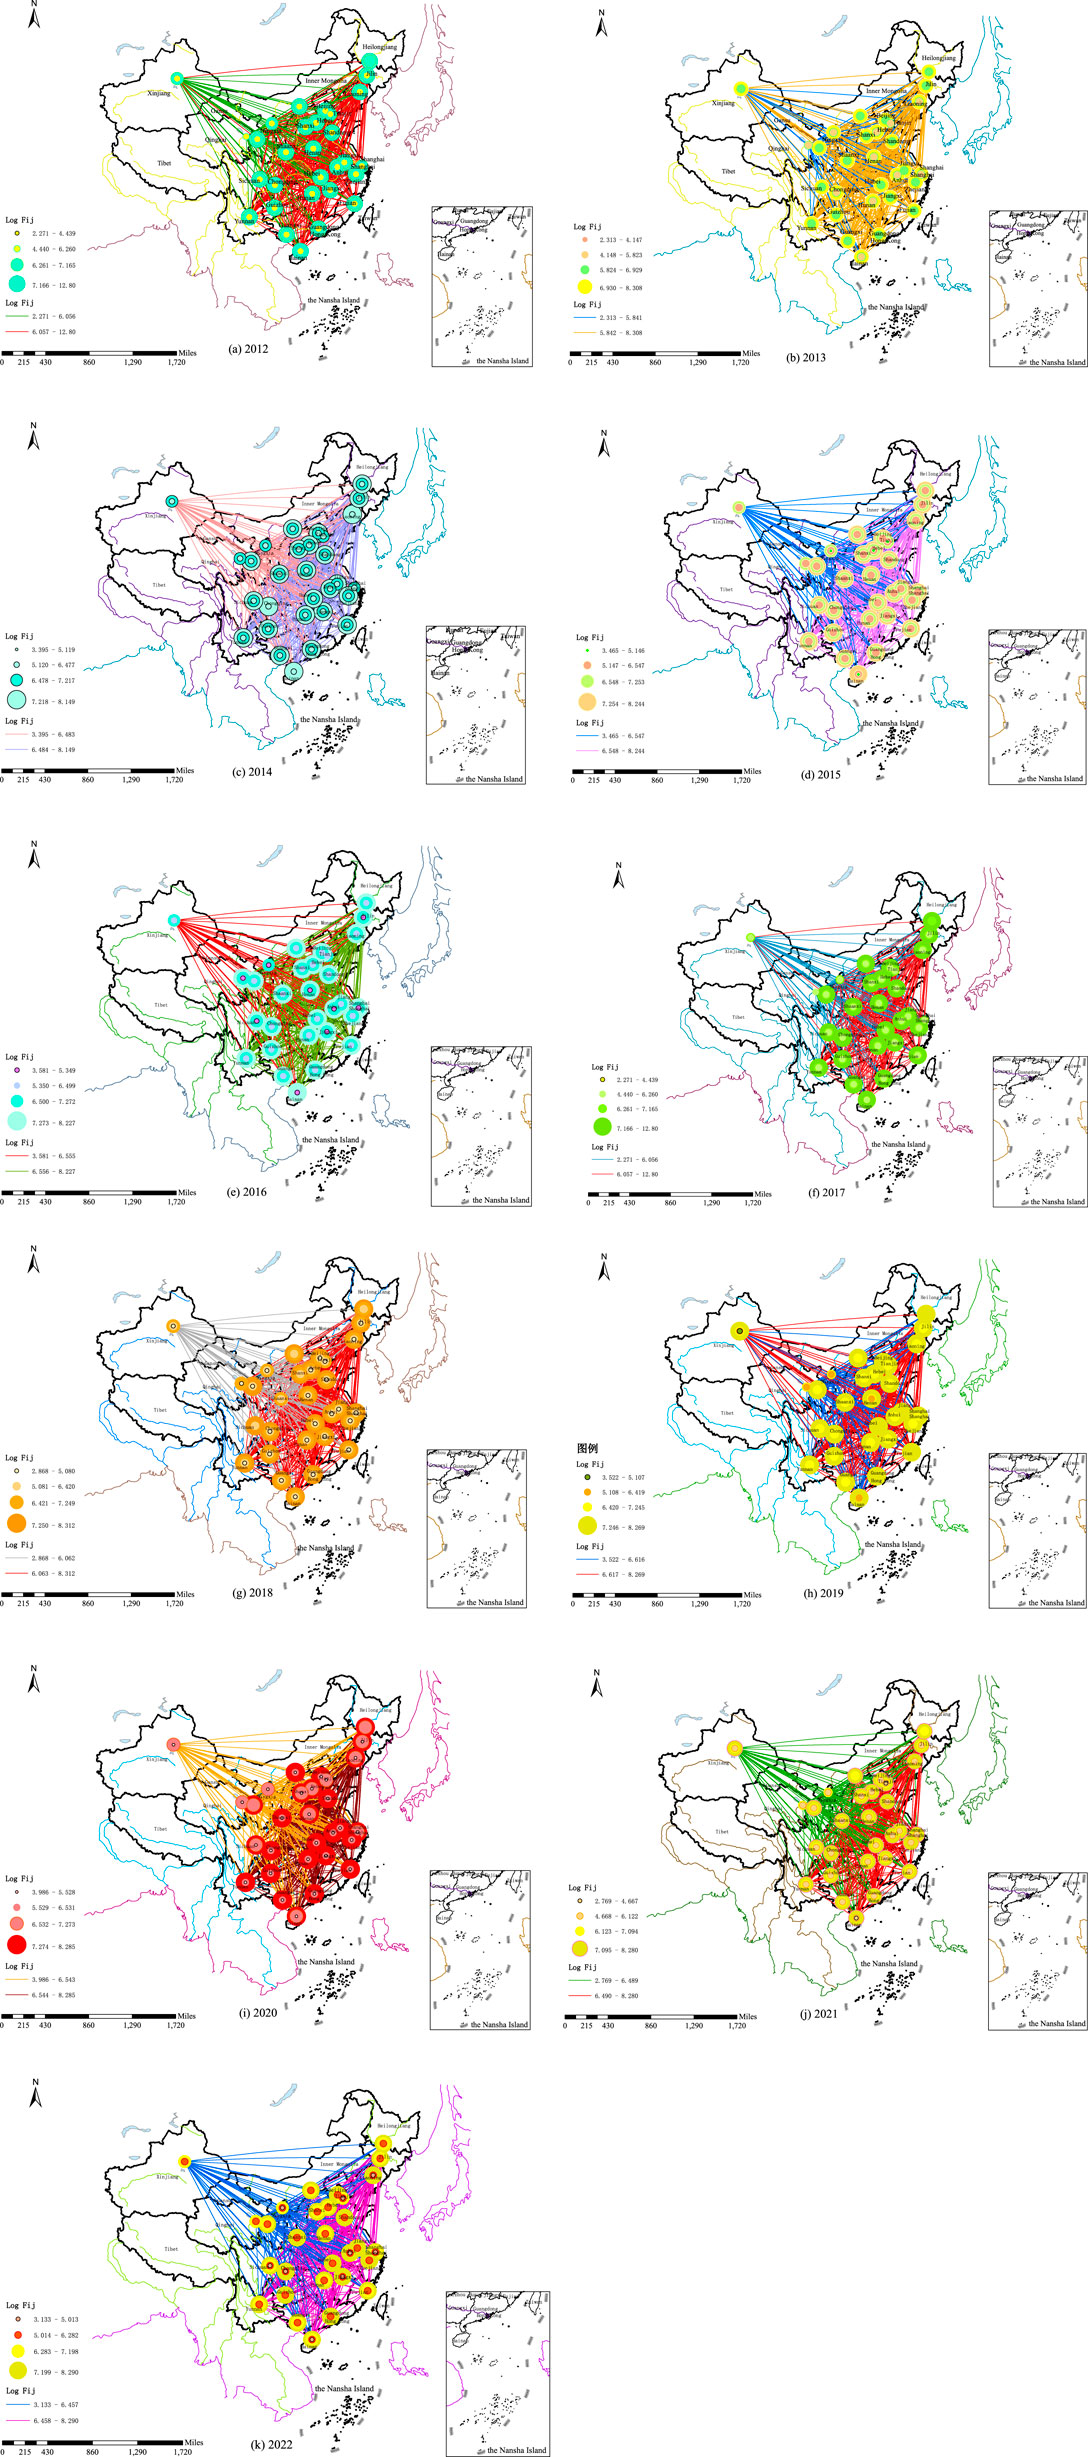
Figure 4. The image is distorted and the boundaries are unclear, which is likely related to the high-definition settings during the export process.
4.3 Spatial distribution of FEPVRE
Since the southeastern region significantly influences regional differences in FEPVRE across China, this study employs SKDE to explore the spatial distribution dynamics of FEPVRE and assess its temporal and spatial evolution. The static spatial kernel density and contour map of FEPVRE (Figures 5(a,b)) reveal that the overall efficiency values of the forest ecosystem product value realization show a rightward shift and concentration trend, with expanded coverage. This indicates an overall improvement in FEPVRE across China, with a more concentrated distribution. The performance of different provinces has become more consistent, and the range of distribution has widened. The curve polarization trend suggests a dominant peak, indicating that regional differences in FEPVRE are expected to persist and even widen during the sample period. The contour map reveals peaks aligned parallel to the y-axis, located at the upper left and lower right of the 45-degree diagonal, suggesting significant regional differences, with some provinces exhibiting relatively low FEPVRE. The spatial distribution of FEPVRE is concentrated in the Eastern and Southeastern regions, while the Western and Northeastern regions lag behind. To address these disparities, the government can invest in regional capacity building and promote technologies in lagging areas, which will help reduce spatial disparities and support more balanced green development.
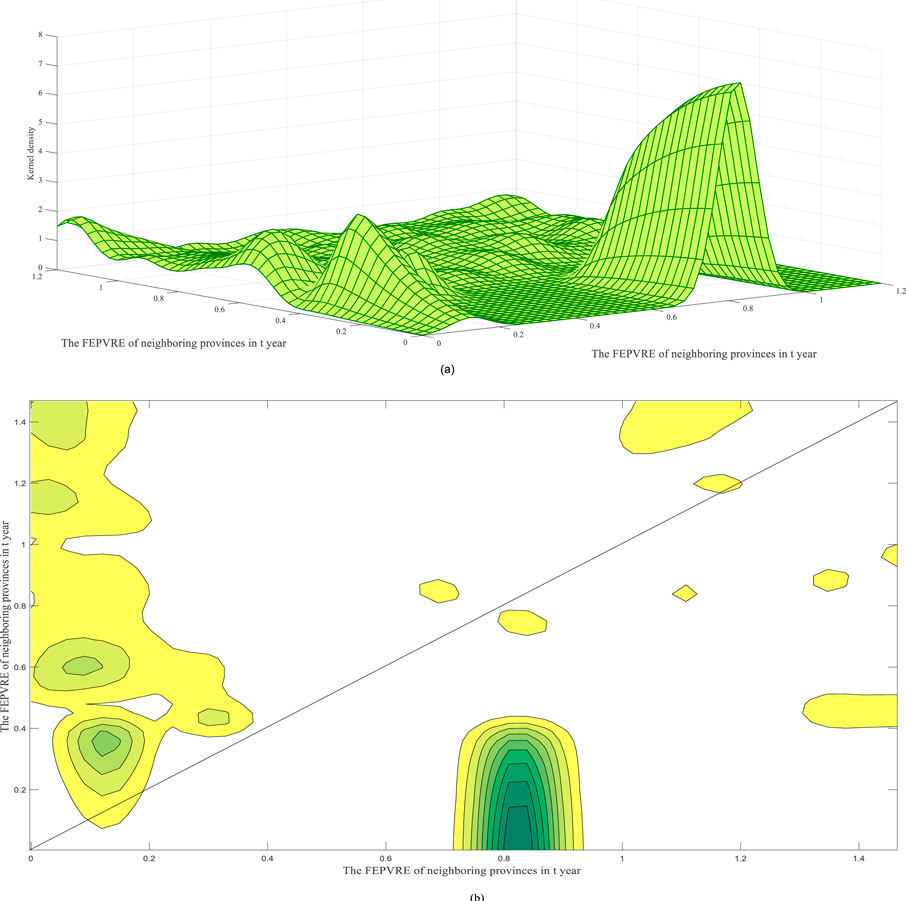
Figure 5. Spatial static kernel density and contour lines. (a) Static spatial kernal density. (b) Static spatial contour map.
From the spatial dynamic kernel density and contour map of FEPVRE across China’s four major regions (Figures 6(a-e)), it is evident that severe polarization exists in both time and space, particularly in terms of spatial spillover effects. In the Eastern region, the peaks are aligned parallel to the y-axis, with one section of the primary peak located just below the 45-degree diagonal and the other section above it. This suggests a polarization trend: after a 3-year period, some provinces experience high FEPVRE, while others show a decline, reflecting instability in the region’s development. In the Western region, the peaks are above the 45-degree diagonal, indicating a positive shift in FEPVRE, suggesting that these areas have significant potential for growth, especially during the green transformation process. In the Central region, the peaks are below the 45-degree diagonal, indicating that after 3 years, FEPVRE tends to stabilize and concentrate, with little room for further growth. This may be due to the full development of forest resources and a slower pace of green transformation. In the Northeastern region, there are two segments: one with a large peak above the 45-degree diagonal, indicating improvement in FEPVRE in some provinces after 3 years, and the other segment, a trough, lying below the diagonal, where provinces exhibit lower FEPVRE. For these provinces, strengthening ecological protection policies, promoting green development, and improving forest resource management are essential.
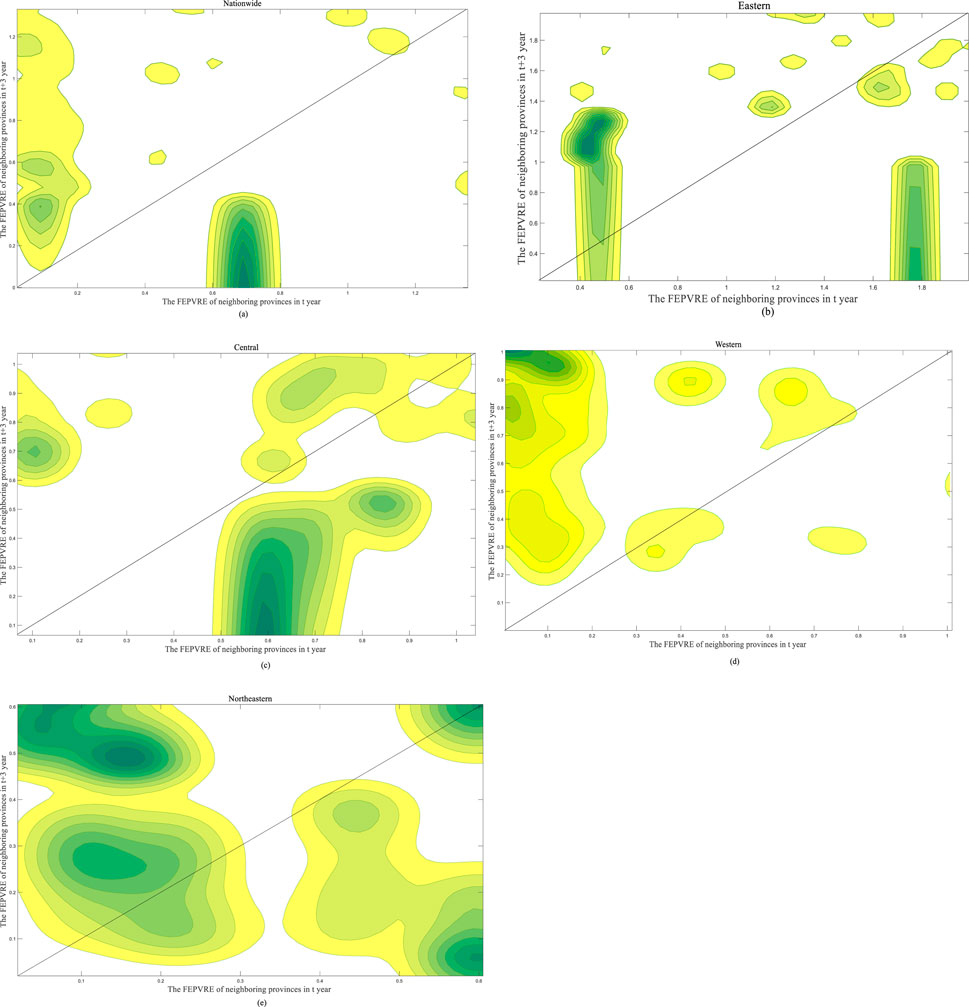
Figure 6. Spatial dynamic kernel density and contour lines of FEPVRE. (a) Static spatial contour map. (b) Eastern China dynamic spatial contour map. (c) Central China dynamic spatial contour map. (d) Western China dynamic spatial contour map. (e) Northeastern China dynamic spatial contour map.
4.4 Markov chain analysis
Due to the significant dual-level development of FEPVRE in China, Markov chain analysis is employed to analyze the dynamic transition trends of FEPVRE. The comprehensive scores during the sample period are categorized into four types: Low (I), Low-Medium (II), Medium-High (III), and High (IV). The results are presented in Table 6.
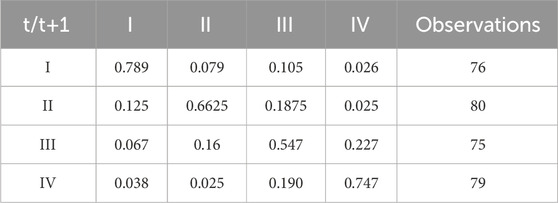
Table 6. Transition probabilities of the traditional Markov chain from 2012 to 2022.
The analysis in Table 7 reveals that FEPVRE dynamics exhibit both stability and dynamism. The values on the main diagonal are generally higher than those on the off-diagonal, with the maximum value being 0.790 and the minimum 0.547. The probability of FEPVRE remaining unchanged for most provinces is at least 55%, indicating high stability across the majority of provinces. For FEPVRE transitions, provinces in Category I (inefficient) have a transition probability of 0.789 to remain in their status, while provinces in Category IV (highly efficient) have a transition probability of 0.747, indicating strong stability in both low-efficiency and high-efficiency provinces. However, provinces in intermediate categories (II and III) face greater challenges in terms of transition. Specifically, Category I provinces (low-efficiency) have a 0.125 probability of moving up to Category II, reflecting the difficulty in improving efficiency. In contrast, Category III provinces (moderately high-efficiency) have a 0.227 probability of advancing, suggesting significant potential for improvement. These provinces are in the “sweet spot,” with the capability and potential to further enhance efficiency. Category II provinces (moderately low-efficiency) face a 0.125 probability of downgrading to Category I, highlighting the risk of significant decline. Even Category IV provinces (high-efficiency) face a 0.190 probability of transitioning downward, indicating downward pressure on even the most efficient regions.
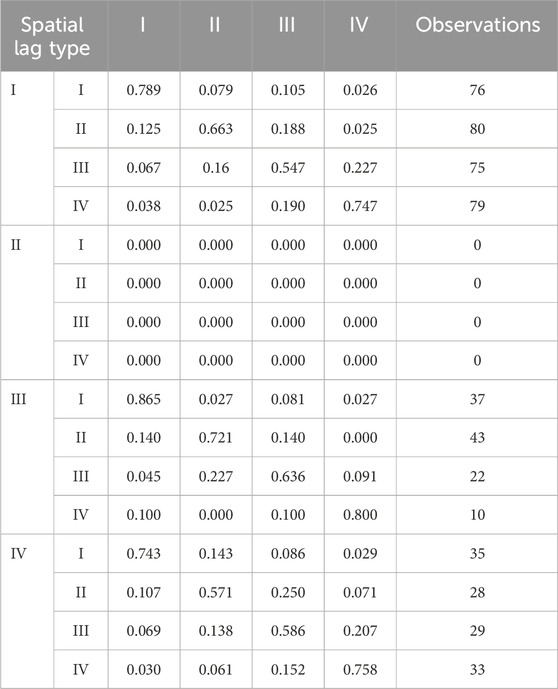
Table 7. Spatial Markov chain transition matrix (2012–2022).
The Markov chain analysis results, presented in Table 6, show that the transition probabilities for spatial lag types I and IV are 0.790 and 0.747, respectively. For spatial lag type I, the probability of maintaining the original state is significantly higher than the probabilities of upward or downward transitions. Similarly, in spatial lag type IV (high-efficiency provinces), the probability of maintaining the original state is also high, indicating the higher stability of ecological efficiency in these provinces. Both low-efficiency and high-efficiency provinces tend to maintain their existing ecological efficiency levels, especially when the efficiency gap with neighboring provinces is small or stable. In contrast, spatial lag types II and III show more instability, with most off-diagonal elements non-zero. This suggests that provinces in these types have a higher potential for transitioning to either better or worse efficiency levels. Notably, in spatial lag types III and IV, the off-diagonal elements are 0.100 and 0.250, respectively, indicating that the efficiency of these provinces is more susceptible to external shocks and the transition processes of neighboring provinces. The differences in upward and downward transition probabilities under different lag conditions are significant. In spatial lag type III, the probability of a type I province transitioning upward to type II is 0.140, while a type III province has a 0.227 probability of moving upward to type IV, highlighting the significant improvement potential for provinces in type III. Conversely, in spatial lag type IV, the probability of a type II province transitioning upward to type III is 0.250, while the downward transition probability for high-efficiency provinces in type IV is 0.190, demonstrating that high-efficiency provinces show strong resistance to decline, maintaining relatively stable efficiency. These findings indicate that ecological efficiency transitions under different lag states are strongly influenced by the current efficiency status of a province. Provinces in type II and III are at a critical point for upward transitions. If they can leverage external support, such as neighboring provinces’ experiences and technological advancements, there is potential for overcoming existing bottlenecks. On the other hand, provinces in type IV exhibit strong stability and low transition risks.
Overall, the Markov chain analysis of FEPVRE suggests that most provinces maintain their efficiency levels, but provinces in the intermediate efficiency range have significant upward mobility potential. Future research should explore the factors driving these transitions and identify the elements contributing to upward mobility. Policymakers can use these insights to support provinces with improvement potential through targeted interventions.
4.5 Regional disparity analysis
The analysis of the FEPVRE Gini coefficient (GT) from 2012 to 2022 reveals significant regional disparities across China, reflecting the dynamic interaction of political, economic, and social factors that influence forest ecosystem product value realization efficiency. The following sections provide an overview of national trends and a detailed regional analysis, comparing the development trends in the Eastern, Central, Western, and Northeastern regions. Nationally, the Gini coefficient fluctuated, starting at 0.592 in 2012 and decreasing steadily to 0.417 by 2015, signaling a narrowing of regional disparities. However, from 2015 to 2021, the coefficient rose to 0.572, indicating an increase in the regional gap. In 2022, it dropped to 0.485, reflecting some improvement, particularly in the central and western regions, due to policy interventions. In the Eastern region, the Gini coefficient continuously improved, declining from 0.217 in 2012 to 0.148 in 2022, driven by investments in green technology and infrastructure. In contrast, the Western region experienced significant fluctuations, rising from 0.494 in 2012 to 0.574 in 2022. This reflects challenges like underdeveloped infrastructure, slower economic growth, and limited technological innovation. The Central region had moderate fluctuations, with its Gini coefficient moving from 0.244 in 2012 to 0.283 in 2022, showing gradual progress despite challenges in infrastructure and industrial development. The Northeastern region exhibited large fluctuations, with the Gini coefficient peaking at 0.644 in 2013, then dropping to 0.310 in 2014, and stabilizing at 0.428 by 2022, highlighting struggles with industrial restructuring and the slow transition to green industries. In conclusion, while the Eastern region has made significant progress, other regions like the Western and Northeastern areas continue to face substantial challenges in improving FEPVRE. This underscores the need for targeted policies and investments in green technologies and infrastructure to foster more balanced and sustainable development across the country, as shown in Figure 7.
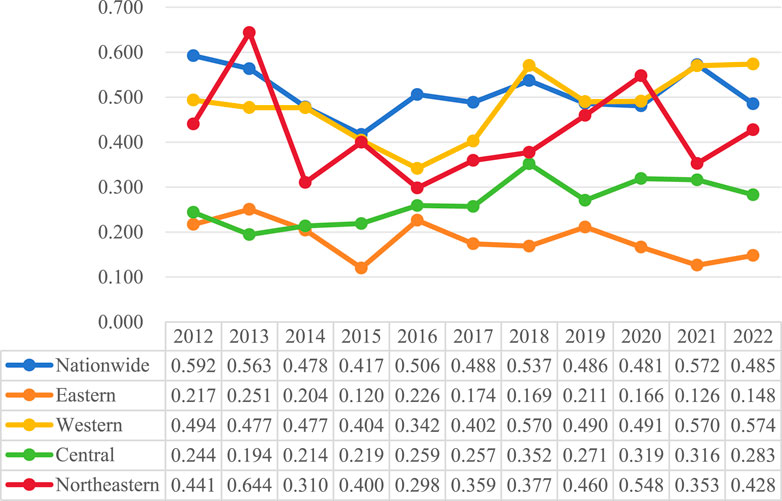
Figure 7. Total Gini of FEPVRE from 2012 to 2022.
The decomposition of the Gini coefficient for FEPVRE highlights the key sources of regional disparities. The value of Gw has remained relatively stable, starting at 0.136 in 2012, peaking at 0.138 in 2021, and decreasing to 0.120 in 2022. This suggests that regional disparities have fluctuated only slightly during the study period. The stability of Gw indicates that, despite minor changes in regional balance, the efficiency of forest ecosystem product utilization within regions has generally remained consistent. Contributing factors could include policies promoting more equitable resource distribution and improvements in ecological protection measures, although localized disparities still exist. Gnb shows a fluctuating pattern, starting at 0.394 in 2012 and gradually decreasing to 0.244 by 2022, with a peak of 0.357 in 2021. The decreasing trend of Gnb after 2020 indicates some success in efforts to reduce regional disparities in FEPVRE, particularly in improving the performance of less efficient regions. Policies supporting the digital economy, ecological development, and technological advancements have positively impacted low-efficiency regions, helping reduce the gap. However, the sharp rise in Gnb in 2021 suggests that regional disparities intensified, possibly due to uneven technological adoption or industrial development. Gt fluctuated during the period, starting at 0.0628 in 2012, rising to 0.139 in 2019, and gradually decreasing to 0.121 by 2022. Gt peaked at 0.139 in 2019, followed by a decline in 2020 and 2021. While Gt reflects disparities between high-efficiency and low-efficiency regions, its changes more directly reflect structural differences, particularly in resource distribution and technology adoption. The fluctuations in Gt highlight the gap between leading and lagging regions, while Gnb emphasizes the fundamental disparities between regions and the improvements driven by policy interventions, as shown in Figure 8.
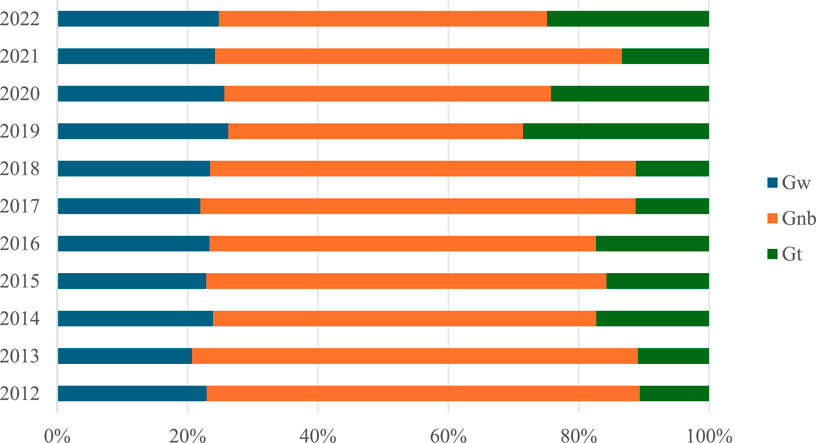
Figure 8. Source of contribution rate of Gini.
The within-group Gini changes from 2012 to 2022 (Table 8) reveal fluctuating trends in FEPVRE across China, reflecting the changing nature of internal disparities within regions at different stages. In the eastern region, the within-group Gini coefficient gradually decreased from 2012 to 2015, indicating a narrowing of internal disparities and an improvement in internal balance. However, from 2016 to 2021, the Gini coefficient began to rise, reflecting fluctuating internal disparities due to unbalanced ecological protection and resource management. The central region showed relatively stable changes in the within-group Gini but experienced a slight upward fluctuation from 2016 to 2022, suggesting that internal disparities in this region have slightly intensified. This can be attributed to uneven economic development in some provinces, widening internal disparities. The western region exhibited large fluctuations in the within-group Gini coefficient, initially decreasing and then increasing. This pattern indicates that internal differences in FEPVRE in the western region narrowed at first, but expanded after the disruptions caused by the 2019 pandemic, highlighting significant internal disparities. The northeastern region showed large fluctuations from 2012 to 2015, with a decrease and peak in 2018. This indicates intensifying internal disparities, and while the internal FEPVRE improved by 2022, it remained in a state of significant disparity, suggesting a lag in the development resources required. Overall, the Gini analysis reveals growing regional disparities in FEPVRE, with widening gaps between the Eastern, Western, and Northeastern regions. Policymakers should focus on closing these gaps through green policies, equitable investment distribution, and enhanced cross-regional collaboration to promote more balanced and sustainable development.
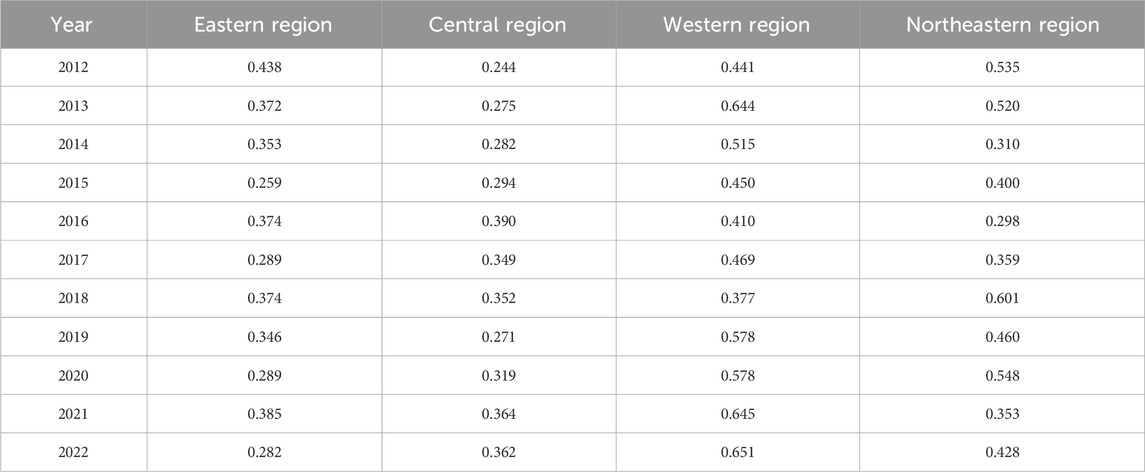
Table 8. Within-group Gini coefficient.
As inter-group differences are the primary source of regional disparities, this section analyzes the trend in inter-group Gini across regions to reflect dynamic disparities in FEPVRE in China. The results, shown in Table 9, reveal that from 2012 to 2022, the inter-group Gini between the Eastern region and the Central, Western, and Northeastern regions exhibited an overall downward trend. In contrast, the inter-group Gini between the Central and Western, Central and Northeastern, and Western and Northeastern regions showed an increasing trend, indicating significant and uneven disparities. From 2012 to 2015, the inter-group Gini between the Eastern and Central regions continued to decrease, with slight rebounds in 2016 and 2021 before decreasing again, signaling a gradual narrowing of the gap between these regions. The inter-group Gini between the Eastern and Western regions also showed a decreasing trend from 2012 to 2022, though the gap between the Central and Western regions remained larger. Meanwhile, the inter-group Gini between the Eastern and Northeastern regions was higher, reflecting greater differences in FEPVRE between these regions. However, their regional development remained more stable than that between the Eastern and Western regions. From 2013 to 2018, the inter-group Gini between the Central and Western regions showed a fluctuating downward trend, followed by a rapid increase until 2022. Despite this, the inter-group Gini between the Central and Western regions was much lower than that between the Eastern and Western regions, indicating that the Eastern region’s FEPVRE is higher than those of the Central and Western regions, with a larger gap. The inter-group Gini between the Central and Northeastern regions showed slow, fluctuating growth, while the inter-group Gini between the Western and Northeastern regions was higher, suggesting that the gap between the Central and Northeastern regions was smaller than the gap between the Western and Northeastern regions.
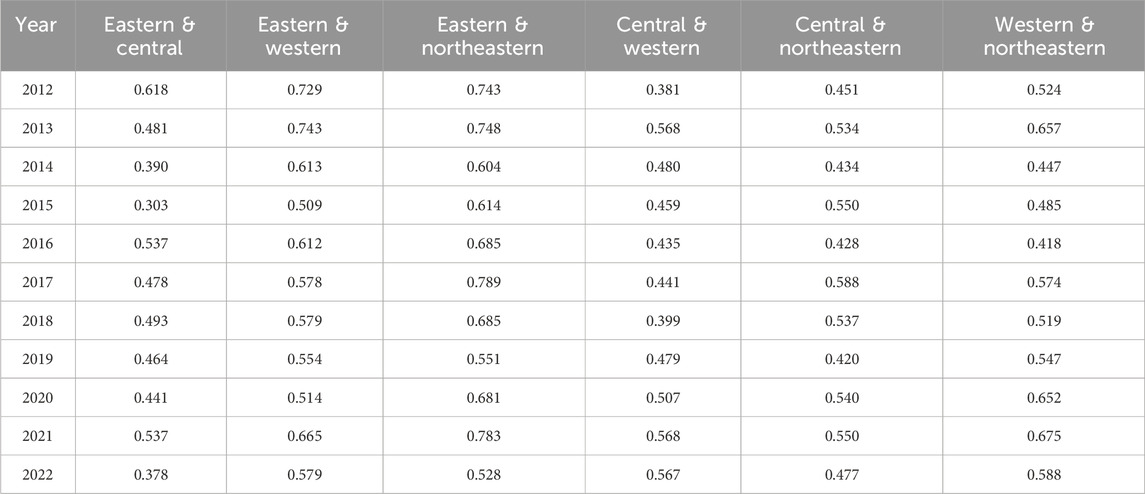
Table 9. Inter-group Gini.
4.6 QAP analysis
4.6.1 QAP correlation analysis
To explore the key factors contributing to regional differences in FEPVRE, the QAP method was applied. This method is particularly effective for examining spatial relationships and dependencies between variables, allowing for a deeper understanding of how factors such as T, O, and E contribute to regional disparities in FEPVRE. The results of the analysis are presented in Table 10. Based on the QAP correlation analysis for the entire sample period (2012–2022), the results show that the correlation coefficients between FEPVRE and T, urbanization level, economic development level, and infrastructure level are positive. In contrast, the correlation coefficients between FEPVRE and O, E, fiscal expenditure, and technological innovation level are negative, suggesting that these factors are inversely related to FEPVRE in the studied regions. Specifically, T and economic development level (with a coefficient of 0.512) show significant positive correlations with FEPVRE, indicating that technological progress and economic growth are key drivers of FEPVRE across regions. Conversely, the negative correlation between FEPVRE and O and E suggests that organizational and environmental factors, such as regional policy alignment or ecological protection practices, can hinder forest ecosystem product efficiency in some areas. Significant intercorrelations were observed among variables. For example, O, E, technological innovation, economic development, infrastructure, and fiscal expenditure are closely related, demonstrating their collective influence on regional differences in FEPVRE. Notably, infrastructure level and fiscal expenditure are strongly correlated with urbanization, implying that urban development plays a critical role in shaping the efficiency of the forest ecosystem. To address multicollinearity and ensure the reliability of the results, a QAP regression analysis was performed. This analysis helped isolate the effects of T, O, and E, providing a clearer understanding of their individual contributions to regional disparities in FEPVRE.
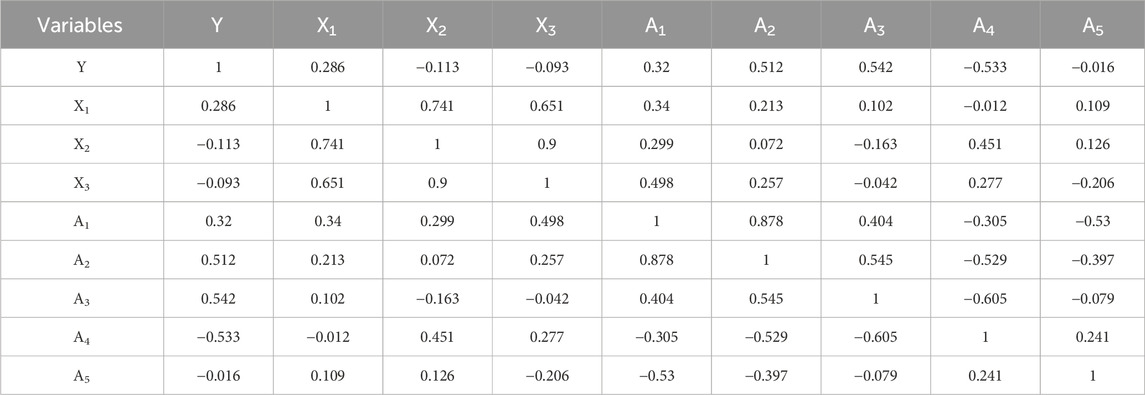
Table 10. QAP correlation results.
In summary, the QAP method is crucial for analyzing the impact of T, O, and E on regional differences in FEPVRE. It offers valuable insights into how these factors interact and influence the efficiency of forest ecosystem products. The regression analysis will further clarify the causal relationships and highlight the importance of each factor in driving FEPVRE disparities.
4.6.2 QAP regression analysis
As digital technology is a primary factor influencing the efficiency of FEPVRE, this study further examines the impact of various factors on regional disparities in FEPVRE using QAP regression analysis. The QAP method, a statistical tool used to analyze the correlation and dependencies among spatial data, is particularly suitable for understanding how T, O, and E contribute to the regional disparities in FEPVRE. By applying QAP regression, we can isolate and evaluate the effects of each of these factors on regional differences in FEPVRE. The QAP regression results for the entire sample period (2012–2022) are shown in Table 11. The standardized coefficient for T is 0.581, statistically significant at the 10% level, indicating that the imbalance in digital technology across regions contributes to the widening of regional disparities in FEPVRE. In contrast, the standardized regression coefficients for O and E are −0.157 and −0.326, respectively, both significant at the 5% level. These results suggest that regional differences in digital industry and digital environment help reduce regional disparities in FEPVRE. Specifically, the regional gap in T positively affects regional disparities in FEPVRE, highlighting the role of digital technology in enhancing efficiency. On the other hand, the regional gaps in O and E have a negative impact, implying that the current development of the digital economy in these regions has not effectively addressed the needs of FEPVRE. Factors such as structural mismatches, low levels of innovation, policy gaps, and institutional barriers contribute to this issue. Among the control variables, the standardized regression coefficient for economic development level is 0.701, significant at the 5% level, suggesting that regional disparities in economic development positively influence regional disparities in FEPVRE. Reducing the imbalance in economic development across regions is an effective way to narrow the regional disparities in FEPVRE. In terms of impact, the influence of economic development on FEPVRE is greater than that of the digital economy. From the full-sample regression results, urbanization level, fiscal expenditure scale, and technological innovation level are not statistically significant. Regarding model fit, the adjusted R2 is 0.552, passing the 1% significance level test, indicating that the selected variables can explain 55.2% of the causes of regional disparities in FEPVRE in China. The results of this study have significant practical implications for policymakers and stakeholders. Given the importance of FEPVRE for sustainable regional development, policymakers should focus on improving digital infrastructure and green technologies, particularly in regions where efficiency remains low. Additionally, targeted support, such as subsidies for green industries and improved resource management systems, could help bridge regional gaps in efficiency. Stakeholders should also invest in capacity-building programs for the Western and Northeastern regions to foster green innovation.
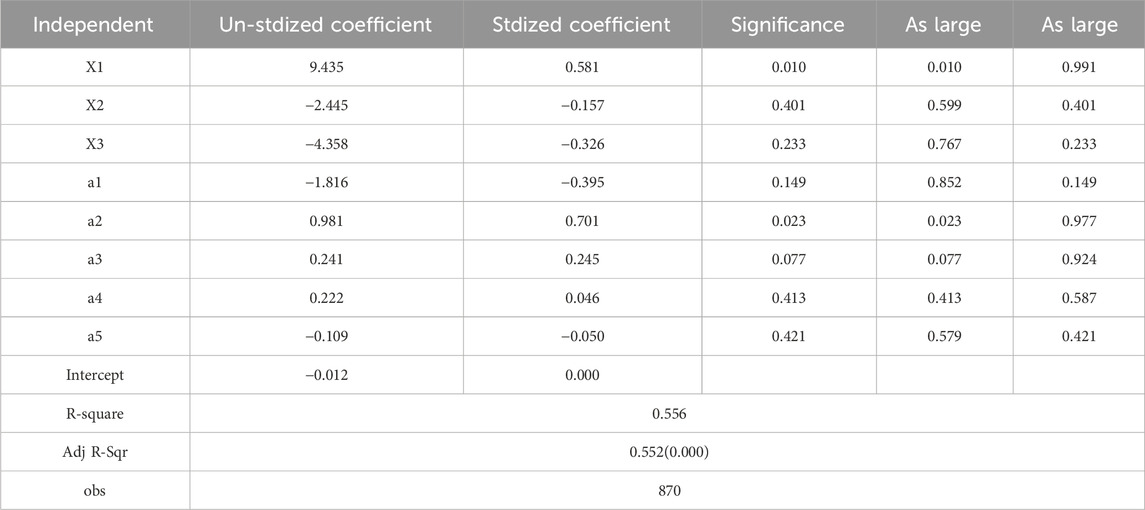
Table 11. QAP regression results.
5 Analysis of the factors influencing the FEPVRE in China
5.1 Selection of spatial econometric model
The spatial autocorrelation test was conducted using Moran’s I index, which yielded a value of 0.600, indicating a positive spatial effect. This result is statistically significant at the 1% level, suggesting that from 2012 to 2022, there is a positive spatial effect on the FEPVRE. Therefore, spatial variables are introduced for further analysis, as shown in Table 12.
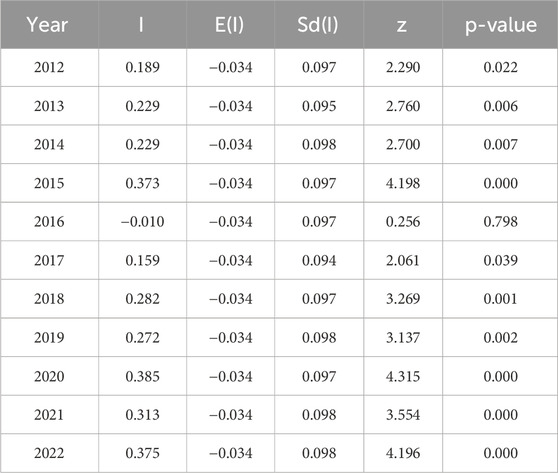
Table 12. Moran’s I index results for one-time output from 2012 to 2022.
To further investigate the influencing factors of the spatiotemporal FEPVRE in various provinces and municipalities of China, three spatial weight matrices are constructed: the spatial adjacency weight matrix, the digital finance weight matrix, and the economic geography weight matrix.
The spatial distance weight matrix is calculated using the latitude and longitude of different provinces, measuring the square of the geographical distance between provinces.
The spatial adjacency weight matrix is the reciprocal of the square of the geographical distance between the central cities of different provinces in China. This matrix is used to determine the adjacency relationship between regions. The distance between region
The digital economy spatial weight matrix, by analyzing the spatial interactions between digital economy and geographical factors on FEPVRE, helps to understand how the digital economy drives regional green transformation through spatial spillover effects. This matrix provides a quantitative tool for analyzing the mutual influences between different regions, particularly in the context of significant differences in digital economy levels, revealing the spatial disparities in green economic transformation. In turn, it supports the formulation of more targeted policies, promoting the coordinated and sustainable development of green economy across regions in China. The Digital Economy Spatial Weight Matrix
The SDM, SAR, and SEM are three commonly used spatial econometric models. For the purpose of model selection and assessing spatial dependence, spatial distance weight matrix, the spatial adjacency weight matrix and the digital economy spatial weight matrix were employed to properly assess the spatial dependence in the model selection, and the LM error and LR are performed. These tests are crucial in diagnosing whether spatial dependence exists and determining which form of dependence—error or lag—is more significant. The LM and the LR p-values for all three matrices are below the 10%, 5% and 1% significance levels, indicating the presence of spatial dependence and confirming that the models pass the significance test. In addition, Wald tests are conducted to further refine the model selection. These tests evaluate the adequacy of the selected models by testing the null hypothesis regarding the restrictions on the coefficients. The Wald test results for all three spatial weight matrices show strong significance, providing additional confirmation of the robustness of the chosen models. This combination of LM, LR, and Wald tests ensures the appropriate selection of the most suitable spatial econometric model for analyzing spatial dependence in the context of FEPVRE. As shown in Table 13.
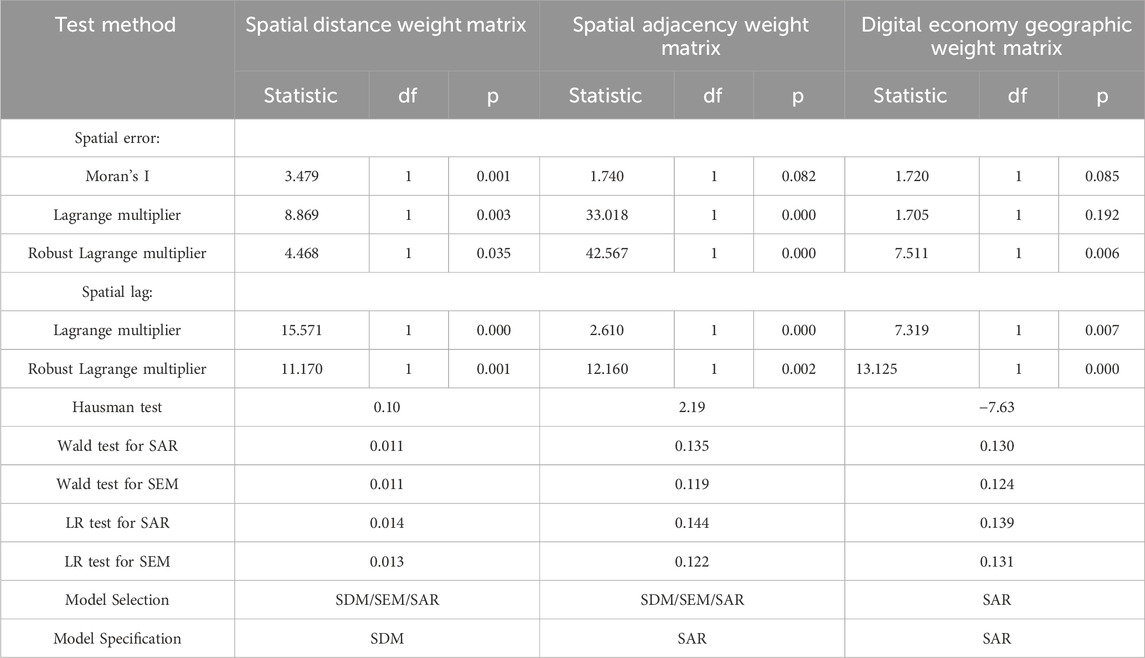
Table 13. Spatial econometric model selection.
In the robustness test of spatial effects in Table 13, both the SEM and the SAR were applied to test spatial effects under different spatial weight matrices. For the Spatial Distance Weight Matrix, both the Lagrange Multiplier (LM) test for spatial error and the LM test for spatial lag are significant at the 1% level, indicating the presence of both spatial error and spatial lag effects. This suggests that a combination of the SEM and SAR models would be appropriate. Given the presence of both effects, the SDM, which combines features of both the SEM and SAR models, is selected as the most suitable model for this matrix. Additionally, the LR test for SAR and LR test for SEM are significant at the 5% level, confirming that the SDM cannot degrade into either the SAR or SEM models. This result is consistent with the Wald test, further validating the use of the SDM for the Spatial Distance Weight Matrix. Contrast, the Spatial Adjacency Weight Matrix and the Digital Economy Geographic Weight Matrix are best modeled by the SAR, but the reasoning behind the model selection differs. For the Spatial Adjacency Weight Matrix, the LM test for spatial error is significant at the 10% level, while the LM test for spatial lag is highly significant at the 1% level. These results indicate the presence of both spatial error and spatial lag effects, making it suitable to apply both SEM and SAR. Since both models are relevant, the SDM, which combines features of both, is the best choice. However, the LR test for SAR and SEM for the Spatial Adjacency Weight Matrix are not significant at the 10% level, supporting the null hypothesis that the SDM can be simplified to either SAR or SEM. This aligns with the Wald test results, confirming that either model could be chosen. Since the LM test for SAR yields a more rational result, the SAR model is considered the most appropriate for this matrix. For the Digital Economy Geographic Weight Matrix, the LM test for the Lagrange multiplier is not significant at the 5% level (p > 0.05), while the LM test for spatial lag is highly significant at the 1% level (p < 0.01), indicating that the spatial lag effect is dominant. Therefore, the SAR model is more suitable for this matrix. Furthermore, the LR test for SAR and SEM for the Digital Economy Geographic Weight Matrix are both insignificant at the 10% level, supporting the hypothesis that the SDM can be simplified to the SAR model. This is consistent with the results from the Wald test for SAR and SEM, which also suggest that the SAR model is the most appropriate choice.
5.2 Measurement results
Using Stata 15 software, the random effects model, time fixed effects model, and double fixed effects model were estimated, incorporating the three spatial weight matrices into the spatial econometric models. The calculation results are shown in Table 14.
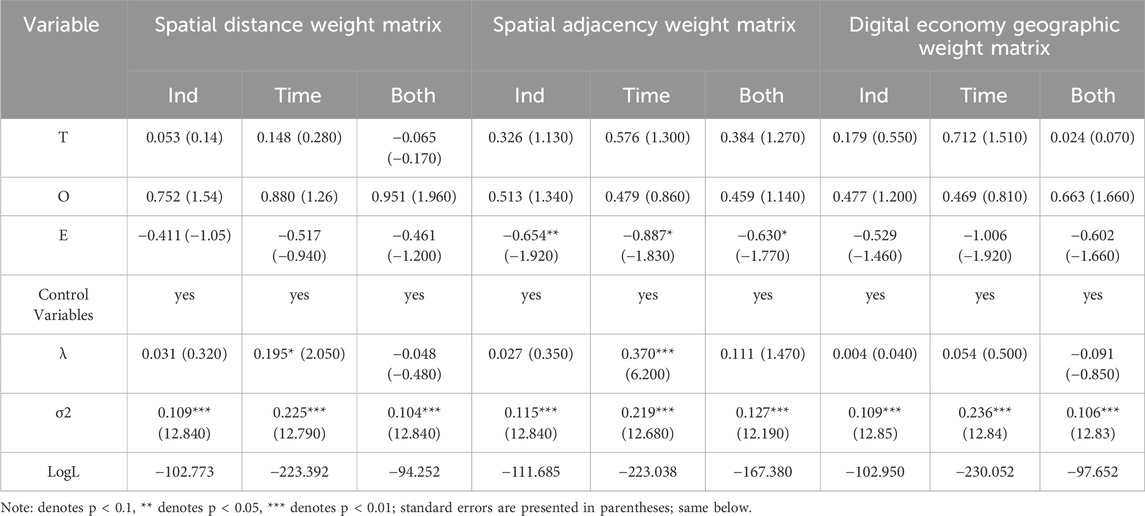
Table 14. Measurement results.
The Hausman test results confirm that the fixed effects model is the most suitable for all three spatial weight matrices—spatial distance, spatial adjacency, and digital economy geographic matrices. With a p-value of 0.000, the fixed effects model is preferred over the random effects model due to significant differences in coefficients and standard errors. The time fixed effects model is better suited for capturing temporal variations in FEPVRE, effectively controlling for time-specific factors, while the two-way fixed effects model, though capable of considering both regional and time effects, is more complex and less precise. In the Spatial Distance Weight Matrix’s double fixed effects model, the LogL is −94.252, indicating a good fit. The coefficient for λ is −0.048, statistically significant at the 5% level, and the R-squared value is 0.073, suggesting reasonable reliability for this model. The coefficients for the TOE variables show that both T and E have negative coefficients with respect to FEPVRE, indicating that digital technology and the digital environment exhibit negative spillover effects. In contrast, O has a positive coefficient of 0.951, suggesting a positive spillover effect of the digital industry on FEPVRE. This suggests that weak technology adoption and environmental adaptability hinder the benefits from technological and environmental improvements, potentially causing negative spillover effects due to the unequal distribution of digital infrastructure, technology access, and policy support. On the other hand, digital industries, especially green technology innovation, positively impact green transformation. When developed in certain regions, digital industries not only enhance local green transformation but also promote it in neighboring areas through spillover effects. Therefore, policies should focus on supporting digital industries in less efficient regions to improve overall green economic performance. The maximum LogL values for the Spatial Adjacency Weight Matrix and the Digital Economy Geographic Weight Matrix are −111.685 and −97.652, respectively, with λ values of 0.370 and −0.091, and σ2 values of 0.219 and 0.236. The p-values are significant at the 1% level, indicating that the SAR model fits the data well. In both matrices, the effects of digital technology and the digital industry on FEPVRE exhibit positive spatial spillover effects, while the impact of the digital environment shows negative spatial spillover effects. These negative effects tend to weaken over time. This suggests that digital technology and industries generate positive spillover effects on FEPVRE, driving green transformation in neighboring regions through technological diffusion and industrial chain collaboration. Conversely, the digital environment causes negative spillover effects, mainly due to the environmental burdens and resource distribution imbalances associated with digitalization. Over time, policy adjustments and technological advancements help mitigate these negative effects, promoting a more sustainable green transformation.
5.3 Heterogeneity analysis
To explore the impact of T, O, and E on FEPVRE across different regions, China’s provinces are categorized into four regions: Eastern, Central, Western, and Northeastern. The analysis reveals significant regional disparities in FEPVRE, with the Eastern region exhibiting higher efficiency levels compared to the Western and Northeastern regions. These disparities reflect the complex interaction of technological, organizational, and environmental factors, as supported by ecological economics and Green Growth theories. The calculation results show that the SDM model for the Spatial Distance Weight Matrix has relatively high LogL and R-square values for all four regions, indicating a good model fit. Similarly, the Spatial Adjacency Weight Matrix and Digital Economy Geographic Weight Matrix also show higher LogL and R-square values, suggesting a good fit for the SAR model. The spatial autoregressive coefficients are significant at the 10%、5%, and 1% levels, further validating the appropriateness of these models, as shown in Table 15.
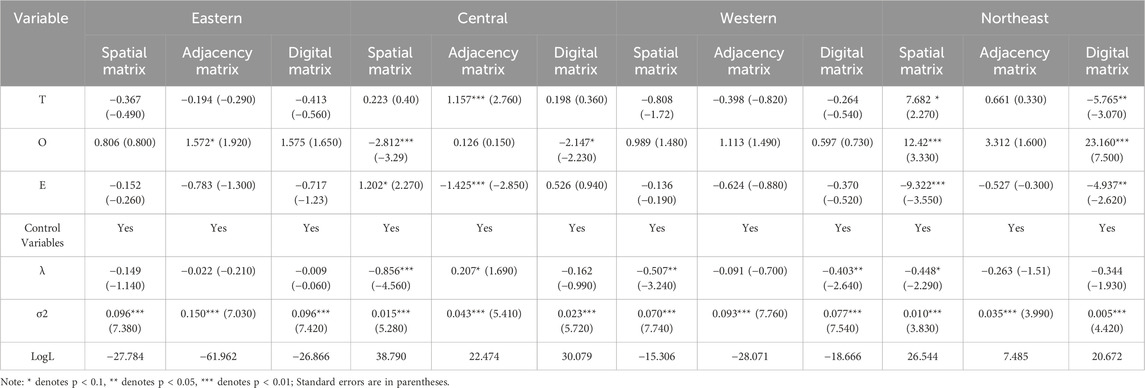
Table 15. Heterogeneity measurement results for the eastern, central, western, and northeastern regions.
In the Spatial Distance Weight Matrix, T and E exhibit negative spillover effects on FEPVRE in the Eastern and Western regions, while showing positive spillover effects in the Central and Northeastern regions. O only has a negative spillover effect in the Central region, with positive spillover effects in all other regions. The Eastern and Western regions face challenges in digital green transformation due to technology adoption gaps, inadequate infrastructure, and regional resistance, which hinder FEPVRE. In contrast, the Central and Northeastern regions benefit from better integration of digital technologies and sustainable policies, leading to positive spillover effects and stronger FEPVRE. Digital industry shows a negative spillover effect only in the Central region, possibly due to industrial overcapacity or lack of green innovation. The Central region should focus on fostering green digital innovation, while other regions can scale up digital industry growth with a sustainability focus. In the Spatial Adjacency Weight Matrix, T generates negative spillover effects on FEPVRE in the Eastern and Western regions, while generating positive spillover effects in the Central and Northeastern regions. This is primarily due to uneven technology diffusion and industrial structure differences, with lower technology adoption rates in some areas of the Eastern region, limiting the positive impacts of digital technology. In the Western region, infrastructure deficiencies and delays in technological innovation hinder effective diffusion, restricting the green transformation of surrounding areas. In contrast, O shows positive spillover effects on FEPVRE across all regions, promoting green industry development and enhancing forest ecosystem product value, particularly in the Central, Eastern, Northeastern, and Western regions. However, E produces negative spillover effects across all regions, mainly because digitalization has exacerbated resource over-exploitation and ecological pressure, especially in digital infrastructure construction. Uneven distribution of environmental resources and a lack of sustainable management have intensified environmental burdens, hindering improvements in FEPVRE.
In the Digital Economy Geographic Weight Matrix, O exhibits negative spillover effects in the Central region, while showing positive effects in other regions. Conversely, T has a positive spillover effect in the Central region but negative spillover effects in other regions. This highlights that regional disparities in digital development and green transformation are influenced by varying spillover effects. In the Central region, where digital infrastructure and technology adoption lag, negative spillovers reflect barriers such as resource inequality, technological gaps, and lack of green innovation. In contrast, the Eastern and Western regions benefit from positive spillovers, indicating better integration of digital solutions aligned with green transformation goals. The negative spillover effect of the digital environment across regions suggests challenges in leveraging environmental improvements, often hindered by insufficient ecological policies and uneven resource distribution. Therefore, regions with negative spillovers should focus on improving digital infrastructure, adopting green technologies, and implementing region-specific innovations to enhance FEPVRE.
5.4 Robustness test
To verify the reliability and stability of the conclusions regarding the impact of T, O, and E on FEPVRE, robustness tests are conducted using multiple spatial weight matrices. The LM test, Wald test, Hausman test, and LR test are employed to evaluate the stability and robustness of the spatial econometric models (Zheng et al., 2025). These tests assess whether the results remain consistent across different spatial structures and model specifications.
First, the LM and LR test results are compared using the spatial distance weight matrix, spatial adjacency weight matrix, and digital economy geographic matrix. The p-values for these tests are all below 5%、10% or 1%, confirming that the Spatial Distance Weight Matrix is best modeled by the SDM model, while the Spatial Adjacency Weight Matrix and Digital Economy Geographic Weight Matrix are best modeled by the SAR model, effectively capturing spatial dependencies in all three matrices. The LM test diagnoses spatial dependence due to error correlations, while the LR test assesses lag dependence across regions. Both tests help identify the nature of spatial relationships, thereby refining the choice of the spatial econometric model. Specifically, for the Spatial Distance Matrix, the LM test for both Spatial Error and Spatial Lag shows p-values below 1%. For the Spatial Adjacency Matrix, the LR test results for both SEM and SAR are significant at the 5% level, consistent with the Wald test conclusions, rejecting the possibility of the SDM degenerating into the SEM or SAR models. The Digital Economy Geographic Matrix shows that the LM test for Spatial Lag is significant below the 1% level, and both the LR and Wald tests support the SDM degenerating into the SAR model, further confirming the applicability of the SAR model for all regions. Although the LM test for the Spatial Adjacency Weight Matrix initially suggests the SDM model, the LR and Wald test results are not significant at the 10% level, supporting the selection of the SEM and SAR models. Next, the Hausman test is conducted to compare the fixed effects model and the random effects model. The statistics for the Spatial Distance Weight Matrix and the Spatial Adjacency Weight Matrix are positive, while the statistics for the Digital Economy Geographic Weight Matrix are negative. The prob>chi2 values for the Spatial Distance Matrix is 1.000, for the Spatial Adjacency Matrix is 0.975, and for the Digital Economy Geographic Matrix is 0.982. These results do not significantly support the null hypothesis, indicating that the random effects model is not appropriate.
6 Conclusion
Through SKDE, Markov chain analysis, and spatial Gini coefficient analysis of the FEPVRE across various provinces in China from 2012 to 2022, the following conclusions can be drawn:
1. From the perspective of super-efficiency, the average FEPVRE in China showed a fluctuating development trend between 2012 and 2022, with notable changes between 2014 and 2020. This fluctuation reflects the early stages of China’s green transition, where ecological civilization strategies influenced efficiency variations. FEPVRE peaked in 2016 but then declined due to pressures from green transformation goals, which aligns with findings from previous studies (Liu et al., 2023). Regionally, the Eastern region demonstrates higher FEPVRE, while the Western and Northeastern regions show slower growth, confirming the convergence trend observed in earlier research (Xu and Ding, 2024). Policymakers should address these regional disparities by promoting green technologies and sustainable practices, especially in the Western and Northeastern regions, to overcome transitional challenges (Zhu et al., 2025). This study contributes theoretically by integrating economic, ecological, and technological factors into the FEPVRE evaluation, highlighting the importance of considering these dimensions when analyzing regional differences in forest ecosystem product efficiency. From a policy perspective, targeted interventions in underperforming regions are essential for achieving an inclusive green transformation and ensuring sustainable development.
2. From the perspective of spatial kernel density, FEPVRE in China shows a rightward shift and concentration, indicating a growing efficiency gap between high-efficiency and low-efficiency provinces. High-efficiency provinces exert spatial spillover effects on neighboring low-efficiency provinces (Cheng and Xiong, 2024), resulting in polarization between low-efficiency (Type I) and high-efficiency (Type IV) provinces, with intermediate regions (Types II and III) showing potential for upward mobility. These findings highlight that provinces in middle-efficiency categories have significant improvement potential, especially through cross-regional cooperation and knowledge transfer, which can play a critical role in enhancing FEPVRE (Wolf et al., 2007). The theoretical contributions of this study emphasize the role of spatial spillover effects and inter-regional collaboration in improving FEPVRE. By integrating spatial dependencies with regional development strategies, this study provides a novel framework for addressing regional disparities. From a policy perspective, fostering cooperation between high- and low-efficiency provinces is crucial. Promoting knowledge transfer and resource sharing through cross-regional agreements is essential for enhancing FEPVRE and fostering more sustainable and balanced development across regions.
3. From the perspective of regional spatiotemporal development, significant disparities in FEPVRE across China highlight regional challenges, particularly the widening gap between the eastern, western, and northeastern provinces. The Gini analysis shows that the eastern region maintains relatively stable FEPVRE, while the western and northeastern regions experience larger fluctuations, especially post-2021. This reflects differences in policy, resource allocation, and industrial development speeds, consistent with previous research, which emphasizes the need for targeted policy interventions (Niu et al., 2024). To address these disparities, policymakers should prioritize promoting green industries, improving infrastructure, and encouraging digital technology adoption in the western and northeastern regions (Lu et al., 2025). Theoretical contributions from this study emphasize the importance of integrating spatiotemporal analysis with policy and technological factors to better understand FEPVRE. From a policy perspective, the findings underscore the need for strategies that narrow the efficiency gap and ensure sustainable forest management across regions. Future research should explore the long-term impacts of these disparities on the sustainability of China’s forest resources.
4. The QAP analysis results show that digital technology significantly impacts FEPVRE, with regional variations in its effect. In the Eastern region, rapid digital technology development has led to resource misallocation, as observed in previous studies. Conversely, in the Northeastern region, digital technology positively impacts FEPVRE, driven by policy-led digitalization that optimizes resource use in traditional forestry (Yu et al., 2025). While the digital industry has positive effects in the Eastern and Northeastern regions, it shows negative impacts in the Central and Western regions, where infrastructure and ecosystem development are still evolving. These results highlight the importance of strong infrastructure and technology in improving FEPVRE, especially in less-developed areas. Additionally, the negative impact of the digital environment in some regions underscores the need for careful management of digital transformation to ensure sustainable forest resource management. Theoretical contributions of this study emphasize the complex relationship between digital technologies and FEPVRE, noting that integrating digitalization with traditional forestry practices can significantly improve resource utilization, particularly in regions with adequate technological infrastructure. From a policy perspective, the study suggests promoting digital technology adoption in underdeveloped regions, especially the Central and Western regions, while addressing infrastructural gaps. This approach will help improve FEPVRE and enhance the sustainability of forest ecosystems, contributing to green growth and ecological civilization goals.
5. The spatial econometric model results reveal significant regional differences in FEPVRE. In the Eastern and Northeastern regions, better digital infrastructure and policy support lead to positive spillover effects, enhancing FEPVRE. In contrast, the Central and Western regions face challenges due to slower technology adoption and inadequate digital infrastructure, resulting in negative spillover effects on FEPVRE. This aligns with previous research, which emphasizes that regions with established digital infrastructure experience more efficient resource utilization and greater FEPVRE. T and O are crucial for driving green transformation, but their impact varies across regions. The Central and Western regions show weaker spillover effects due to underdeveloped digital infrastructure and slower technology adoption (Thida et al., 2025). While the Eastern and Northeastern regions benefit from positive spillovers, the Central region needs targeted strategies to foster green digital innovation. The negative spillover effects of the digital environment underscore the need for stronger ecological policies and balanced resource distribution. Slower technology adoption and inadequate infrastructure limit FEPVRE in these regions, as reflected in the negative impact of O on FEPVRE. Limited infrastructure in the Western region further hinders efficiency. The findings suggest that improving digital infrastructure and technology adoption, particularly in less-developed regions, is key to enhancing FEPVRE. This approach will promote regional cooperation, optimize resource use, and support green growth and ecological sustainability. Strengthening digital industries and environments will ensure more balanced and efficient forest ecosystem management.
6.1 Implications
1. There are significant disparities in FEPVRE across regions in China, particularly between the eastern and central/western regions. To promote a comprehensive regional green transformation, cross-provincial and cross-regional cooperation should be enhanced. This can be achieved through information sharing, technical support, and experience exchange. By learning from the successful experiences of more efficient regions, less efficient areas can improve their FEPVRE. In this context, leadership coaching can play a key role in fostering collaboration and enhancing team-level knowledge creation, ultimately supporting better environmental performance. Leadership coaching positively influences knowledge creation within teams, leading to improved environmental outcomes (Khan et al., 2024). By promoting such knowledge exchange, regions with lower FEPVRE can enhance their efficiency. Additionally, local regions should strengthen policy coordination between the eastern and central/western regions, increasing investment in green development technologies and financial support to accelerate the green transformation in the central and western regions. This approach will help narrow the regional disparities further.
2. Promoting the green transformation and technological innovation in low-efficiency provinces is essential for improving FEPVRE. Technological progress plays a key role in driving FEPVRE, and sectoral differences significantly impact CO2 emissions and forest resource utilization. Specifically, the manufacturing and agriculture sectors contribute substantially to emissions, while the services sector has a more positive impact on FEPVRE (Khan et al., 2020). To address these challenges, policymakers should focus on encouraging technological innovation and green energy development in low-efficiency provinces, particularly those in the western and central regions. These provinces face significant barriers in improving ecological efficiency, and thus, financial subsidies, tax incentives, and other supportive policies are necessary to promote green industries. Additionally, efforts should be made to optimize production processes, enhance resource utilization, and adopt modern technologies in ecological product production. Strengthening green technological innovation and infrastructure is crucial to boosting FEPVRE in these regions. By leveraging modern technology, improving resource efficiency, and promoting sustainable practices, low-efficiency provinces can accelerate their green transformation.
3. To improve regional differentiated green transformation strategies, national and local governments should tailor their approaches based on each province’s resource endowment, economic foundation, and technological capabilities. For high-efficiency provinces, particularly those in the eastern region, greater incentives for technological innovation and green development funds should be provided to promote advancements in ecological protection and green industries. In contrast, low-efficiency provinces in the western and central regions should receive targeted interventions that address their specific challenges. Drawing on principles of transformational leadership and green dedication, local governments in these low-efficiency regions should focus on enhancing employee and stakeholder engagement in green practices. This approach is crucial for fostering organizational commitment and improving green performance (Khan and Khan, 2022). By adopting these tailored strategies, regions can more effectively drive green transformation and narrow efficiency gaps across provinces.
4. To strengthen the incentive mechanism for the ecological products market, policymakers should refine market frameworks such as the carbon trading market, ecological compensation mechanisms, and the pricing system for green products. These adjustments will help ensure that the ecological values of forest products are accurately reflected in market prices. The Gini analysis and results from the Markov chain analysis indicate significant regional disparities in FEPVRE, which may stem from inadequate market pricing mechanisms and policy implementation gaps. Market-based incentive mechanisms should also encourage the sustainable use of forest resources and promote green investments. Future research could explore the long-term effects of these market incentives on FEPVRE and assess how such mechanisms can integrate forest products into both national and international green economy models.
5. To enhance the recognition of the green value and social cognition of forest ecological products, it is essential to raise awareness of their multidimensional value, such as carbon sequestration, ecological protection, and cultural services. Improving FEPVRE in China depends not only on technological and policy support but also on broad societal acceptance. The government can foster understanding and support for green FEPV through public education, active participation, and guidance on green consumption. Similar to consumer behavior in the hotel industry, factors like commitment, trust, and attitude significantly shape attitudes toward green products. These behaviors can greatly influence the societal recognition of ecological products. Additionally, strengthening public policy support for forest ecological products can increase public recognition of their value. By raising societal awareness of environmental sustainability, the government can drive green transformation, enhancing both the social value and economic benefits of forest ecological products.
6. The positive impact of digital technology and the negative role of digital environment misalignment on FEPVRE are crucial findings. However, further investigation into the reasons behind the negative impact of digital environment misalignment is necessary. Factors such as inadequate digital infrastructure, low digital literacy, and inefficient implementation of digital policies in certain regions may contribute to this issue. For example, regions with poor digital infrastructure may struggle to effectively use digital technologies, resulting in inefficiencies in forest ecosystem management. Additionally, a lack of digital skills and awareness can prevent local stakeholders from fully leveraging digital tools in forest resource management, exacerbating regional disparities. Misaligned digital policies that do not match local needs or capacities may also limit the effectiveness of digital technologies, reducing their potential benefits. Future research should focus on these underlying issues to provide a comprehensive understanding of the digital environment’s role in FEPVRE, guiding more targeted and effective policy interventions.
The study has limitations, such as the exclusion of factors like the institutional environment and governance performance, which could provide a more comprehensive understanding of FEPVRE. Additionally, the focus on China limits the applicability of the findings to other regions with different ecological, economic, and technological contexts. Despite these limitations, the study makes significant contributions by integrating digital technologies into the analysis of FEPVRE, particularly in low-efficiency regions, and exploring the role of regional policies. This approach differentiates it from existing studies, which often overlook digital innovation and policy aspects. By combining digital, ecological, and policy factors, the study offers a more holistic perspective. Future research should explore the role of digital technologies in improving FEPVRE, the integration of ecological protection with green economic development, and the long-term dynamics of FEPVRE, considering policy, technology, and market factors. Cross-country comparisons would further enhance FEPVRE policies in China, advancing both research and policymaking in the field.
Data availability statement
The original contributions presented in the study are included in the article/Supplementary Material, further inquiries can be directed to the corresponding authors.
Author contributions
LZ: Writing – original draft, Resources, Writing – review and editing, Investigation, Formal Analysis, Data curation, Conceptualization. JZ: Supervision, Writing – review and editing, Funding acquisition, Formal Analysis. LS: Writing – review and editing, Project administration, Methodology, Investigation, Visualization. WY: Data curation, Conceptualization, Writing – review and editing, Formal Analysis. XS: Supervision, Software, Writing – original draft, Visualization, Validation.
Funding
The author(s) declare that financial support was received for the research and/or publication of this article. This work was supported by the National Natural Science Foundation of China (Grant No. 71964018), “Research on the Factors Influencing the Financing of Big Data-Driven Information Infrastructure PPP Projects and Evaluation Methods.”
Conflict of interest
The authors declare that the research was conducted in the absence of any commercial or financial relationships that could be construed as a potential conflict of interest.
Generative AI statement
The author(s) declare that no Generative AI was used in the creation of this manuscript.
Any alternative text (alt text) provided alongside figures in this article has been generated by Frontiers with the support of artificial intelligence and reasonable efforts have been made to ensure accuracy, including review by the authors wherever possible. If you identify any issues, please contact us.
Publisher’s note
All claims expressed in this article are solely those of the authors and do not necessarily represent those of their affiliated organizations, or those of the publisher, the editors and the reviewers. Any product that may be evaluated in this article, or claim that may be made by its manufacturer, is not guaranteed or endorsed by the publisher.
Supplementary material
The Supplementary Material for this article can be found online at: https://www.frontiersin.org/articles/10.3389/fenvs.2025.1658104/full#supplementary-material
References
Acharya, R. P., Maraseni, T. N., and Cockfield, G. (2021). Estimating the willingness to pay for regulating and cultural ecosystem services from forested Siwalik landscapes: perspectives of disaggregated users. Ann. For. Sci. 78 (2), 51. doi:10.1007/s13595-021-01046-3
Barth, N.-C., and Doell, P. (2016). Assessing the ecosystem service flood protection of a riparian forest by applying a cascade approach. Ecosyst. Serv. 21, 39–52. doi:10.1016/j.ecoser.2016.07.012
Bush, G., Taye, F. A., Fleming, C., and Samndong, R. A. (2024). Evaluating the costs of primary forest conservation in the Democratic Republic of Congo, implications for policy and practice. J. Environ. Manag. 352, 119975. doi:10.1016/j.jenvman.2023.119975
Chang, Y., Zou, T., and Yoshino, K. (2021). A new public appraisal method for valuating ecosystem services: a case study in the Wuyishan area, China. J. Clean. Prod. 286, 124973. doi:10.1016/j.jclepro.2020.124973
Chen, M., and Zhang, L. (2023). The econometric analysis of voluntary environmental regulations and total factor productivity in agribusiness under digitization. Plos One 18 (9), e0291637. doi:10.1371/journal.pone.0291637
Chen, W.-J., Jan, J.-F., Chung, C.-H., and Liaw, S.-C. (2022). Resident willingness to pay for ecosystem services in hillside forests. Int. J. Environ. Res. Public Health 19 (10), 6193. doi:10.3390/ijerph19106193
Chen, Y., Hu, S., and Wu, H. (2023). The digital economy, green technology innovation, and agricultural green total factor productivity. Agriculture-Basel 13 (10), 1961. doi:10.3390/agriculture13101961
Cheng, Q., and Xiong, Y. (2024). Low-carbon sustainable development driven by new energy vehicle pilot projects in China: effects, mechanisms, and spatial spillovers. Sustain. Dev. Bradf. West Yorks. Engl. 32 (1), 979–1000. doi:10.1002/sd.2715
Grum, D. K., and Boncina, A. (2024). Integrating basic human values with forest ecosystem services: pathways to sustainable forest management. Front. Psychol. 15, 1444775. doi:10.3389/fpsyg.2024.1444775
Guo, Z. W., Xiao, X. M., Gan, Y. L., and Zheng, Y. J. (2001). Ecosystem functions, services and their values - a case study in Xingshan County of China. Ecol. Econ. 38 (1), 141–154. doi:10.1016/s0921-8009(01)00154-9
Hohl, A., Tang, W., Casas, I., Shi, X., and Delmelle, E. (2022). Detecting space-time patterns of disease risk under dynamic background population. J. Geogr. Syst. 24 (3), 389–417. doi:10.1007/s10109-022-00377-7
Hu, Y., Zhang, X., Wu, J., and Meng, Z. (2023). Understanding the efficiency and evolution of China's Green Economy: a province-level analysis. Energy and Environ. 36, 1949–1972. doi:10.1177/0958305x231204027
Hua, J., Yu, J., Song, Y., Xue, Q., and Zhou, Y. (2024). The enabling effect of digital economy on high-quality agricultural development-evidence from China. Sustainability 16 (9), 3859. doi:10.3390/su16093859
Huang, H., Xiong, K., Li, Y., Wang, Q., and Yan, J. (2024a). Green finance and value realization of forest ecological products in karst areas: a mediating-effect perspective based on the level of karst desertification. Forests 15 (12), 2189. doi:10.3390/f15122189
Huang, Y., You, D., Yu, H., Yang, C., and Mao, J. (2024b). A study on the spatial correlation network structure and its influencing factors of coupling coordination between FDI flow network and carbon transfer network in the belt and road initiative countries. Front. Environ. Sci. 12, 1393011. doi:10.3389/fenvs.2024.1393011
Huang, A., Xue, Z., Liu, Y., Lin, R., and Huang, Y. (2025). Spatial divergence of forestry green total factor productivity in China under the constraint of carbon emissions. Forests 16 (4), 625. doi:10.3390/f16040625
Jia, W., Di, Q., and Chen, X. (2024). The spatial correlation of economic institutional change in China and its impact on economic growth: a social network analysis approach. Plos One 19 (10), e0297354. doi:10.1371/journal.pone.0297354
Jiang, Y., Liao, Y., and Shen, C. (2024). Spatial impact effects of coupled coordination between forestry factor endowment and technological progress bias on forestry industry structural upgrading in China. Front. Environ. Sci. 12, 1422480. doi:10.3389/fenvs.2024.1422480
Jones, A. G., Cridge, A., Fraser, S., Holt, L., Klinger, S., McGregor, K. F., et al. (2023). Transitional forestry in New Zealand: re-evaluating the design and management of forest systems through the lens of forest purpose. Biol. Rev. Camb. Philosophical Soc. 98 (4), 1003–1015. doi:10.1111/brv.12941
Junru, H., and Mingyang, H. (2024). Analysis of spatial and temporal characteristics and evolution of green total factor productivity in agriculture in the lower Yellow River basin. Front. Sustain. Food Syst. 8, 1474813. doi:10.3389/fsufs.2024.1474813
Kaoru, T. (1800). Non-radial measures of efficiency and their applications in data envelopment analysis.
Khan, A. N., and Khan, N. A. (2022). The nexuses between transformational leadership and employee green organisational citizenship behaviour: role of environmental attitude and green dedication. Bus. Strategy Environ. 31 (3), 921–933. doi:10.1002/bse.2926
Khan, A. N., Xie, E., Raza, M. Y., Khan, N. A., and Ali, A. (2020). Sectorial study of technological progress and CO2emission: insights from a developing economy. Technol. Forecast. Soc. Change 151, 119862. doi:10.1016/j.techfore.2019.119862
Khan, N. A., Bahaudur, W., Akhtar, M., Maialeh, R., and Pravdina, N. (2024). Examining the impact of leadership coaching behavior on team-level knowledge creation and environmental performance: a social exchange theory perspective. Bus. Ethics, Environ. and Responsib., beer.12760. doi:10.1111/beer.12760
Kindler, E. (2016). A comparison of the concepts: Ecosystem services and forest functions to improve interdisciplinary exchange. For. Policy Econ. 67, 52–59. doi:10.1016/j.forpol.2016.03.011
Lee, S. H., Chu, Y. C., and Kung, P. C. (2022). Taiwan's forest from environmental protection to well-being: the relationship between ecosystem services and health promotion. Forests 13 (5), 709. doi:10.3390/f13050709
Li, Q., and Liu, Z. (2024). The spatiotemporal impact of digital economy on high-quality agricultural development: evidence from China. Sustainability 16 (7), 2814. doi:10.3390/su16072814
Li, C., Wang, Q., and Zhou, P. (2020). Evaluation and prediction of wind power utilization efficiency based on super-SBM and lstm models: a case study of 30 provinces in China. Complexity 2020 (1), 1–13. doi:10.1155/2020/8834941
Li, Z., Li, D., Yang, W., and Qi, X. (2022). The spatial-temporal evolution and spatial convergence of ecological total factor productivity in China. Energy and Environ. 33 (4), 617–639. doi:10.1177/0958305x20941141
Li, F., Wang, F., Liu, H., Huang, K., Yu, Y., and Huang, B. (2023). A comparative analysis of ecosystem service valuation methods: taking Beijing, China as a case. Ecol. Indic. 154, 110872. doi:10.1016/j.ecolind.2023.110872
Li, C., Pan, Y., Yin, W., and Lan, S. (2025). Spatial distribution and influencing factors of rural cultural ecosystem services: a case study of Fujian, China. Sci. Rep. 15 (1), 10510. doi:10.1038/s41598-025-95600-y
Liu, C., Xu, J., and Zhao, J. (2023). Regional differences and evolution trends of China's industrial green transformation. Front. Ecol. Evol. 11, 1203075. doi:10.3389/fevo.2023.1203075
Lou, J., Yang, G.-l., Song, L., and Liu, K.-d. (2024). From resources to capital: investigating the efficiency of forest ecosystem products value realization in China. Socio-Economic Plan. Sci. 96, 102052. doi:10.1016/j.seps.2024.102052
Lu, H., Wu, J., Wang, G., Song, G., Ye, J., and Yang, Y. (2025). Socialized agricultural services and cultivated land use resilience in China: evolutionary trends, impact mechanism, and policy implications. Land Degrad. and Dev. 36 (12), 4093–4105. doi:10.1002/ldr.5621
Miao, Z., and Zhao, G. (2023). Configurational paths to the green transformation of Chinese manufacturing enterprises: a TOE framework based on the fsQCA and NCA approaches. Sci. Rep. 13 (1), 19181. doi:10.1038/s41598-023-46454-9
Niu, S., Lyu, X., Gu, G., Peng, W., Wang, Y., Xue, P., et al. (2024). A framework for quantification and integration of green development of cultivated land in China: from the perspective of adaptability-vitality-resistance. Land Degrad. and Dev. 35 (5), 1938–1959. doi:10.1002/ldr.5034
Ojea, E., Nunes, P. A. L. D., and Loureiro, M. L. (2010). Mapping biodiversity indicators and assessing biodiversity values in global forests. Environ. and Resour. Econ. 47 (3), 329–347. doi:10.1007/s10640-010-9381-6
Quoc Tuan, V., Kuenzer, C., Quang Minh, V., Moder, F., and Oppelt, N. (2012). Review of valuation methods for mangrove ecosystem services. Ecol. Indic. 23, 431–446. doi:10.1016/j.ecolind.2012.04.022
Reber, B. (2013). Online social networks: a research object for computer science and social Sciences. John Wiley and Sons, Ltd.
Riedl, M., Nemec, M., and Jarsky, V. (2024). Thirty years of research on ecosystem services: the socio-economic role of forest visits and foraging in enhancing human well-being. Forests 15 (11), 1845. doi:10.3390/f15111845
Rusanen, K., Hujala, T., and Pykalainen, J. (2024). Research approaches to sustainable forest-based value creation: a literature review. For. Policy Econ. 163, 103222. doi:10.1016/j.forpol.2024.103222
Schultz, E. T., Johnston, R. J., Segerson, K., and Besedin, E. Y. (2012). Integrating ecology and economics for restoration: using ecological indicators in valuation of ecosystem services. Restor. Ecol. 20 (3), 304–310. doi:10.1111/j.1526-100x.2011.00854.x
Shi, T., Qiao, Y., and Zhou, Q. (2021). Spatiotemporal evolution and spatial relevance of urban resilience: evidence from cities of China. Growth change 52 (4), 2364–2390. doi:10.1111/grow.12554
Su, T., and Li, C. (2024). Has the digital economy boosted carbon reduction in livestock farming in China? Agriculture-Basel 14 (9), 1494. doi:10.3390/agriculture14091494
Thida, M., Thwe, K. Z., Ko Ko, T., Thuya, H., Ei Ei Naing, H., and Hlaing, H. O. W. (2025). Digital disparities in Myanmar: a case study for sustainable digitalization. Asian Polit. and policy 17 (1), e70002. doi:10.1111/aspp.70002
Tone, K. (2002). A slacks-based measure of super-efficiency in data envelopment analysis. Eur. J. Operational Res. 143 (1), 32–41. doi:10.1016/s0377-2217(01)00324-1
Wang, N., Xu, C., and Kong, F. (2022). Value realization and optimization path of forest ecological products-case study from zhejiang province, China. Int. J. Environ. Res. Public Health 19 (12), 7538. doi:10.3390/ijerph19127538
Wang, J., Liu, W., and Kong, F. (2023). Research on forest ecological product value evaluation and conversion efficiency: case study from pearl river delta, China. Land 12 (9), 1803. doi:10.3390/land12091803
Wolf, A., Söderström, M., and Söderström, M. (2007). Developing integration in a local industrial ecosystem – an explorative approach. Bus. strategy Environ. 16 (6), 442–455. doi:10.1002/bse.485
Xu, D., Wang, Y., Wu, L., and Zhang, W. (2023). Evaluation of the degree of the value realization of ecological products of the forest ecological bank in Shunchang county. Forests 14 (11), 2269. doi:10.3390/f14112269
Xu, Y., and Ding, Z. (2024). Sustainable growth unveiled: exploring the nexus of green finance and high-quality economic development in China. Front. Environ. Sci. 12, 1414365. doi:10.3389/fenvs.2024.1414365
Xu, P., Zhang, Y., Li, Q., and Sun, C. (2025). Evaluation of forest eco-efficiency: a transformation of ecological value quantity perspective. Sci. total Environ. 965, 178612. doi:10.1016/j.scitotenv.2025.178612
Yang, L., Zhang, Z., Zhang, W., Zhang, T., Meng, H., Yan, H., et al. (2023). Wetland park planning and management based on the valuation of ecosystem services: a case study of the tieling Lotus lake national wetland park (LLNWP), China. Int. J. Environ. Res. public health 20 (4), 2939. doi:10.3390/ijerph20042939
Yao, W., and Sun, Z. (2023). The impact of the digital economy on high-quality development of agriculture: a China case study. Sustainability 15 (7), 5745. doi:10.3390/su15075745
Ythier, J. M. (2022). The economics of biodiversity and ecosystem services between monetary valuation and deliberation. ISTE Ltd.
Yu, Z., Liu, X., Zhang, J., Xu, D., and Cao, S. (2018). Evaluating the net value of ecosystem services to support ecological engineering: framework and a case study of the Beijing Plains afforestation project. Ecol. Eng. 112, 148–152. doi:10.1016/j.ecoleng.2017.12.017
Yu, H., Qubi, W., and Luo, J. (2025). Digital transformation in agricultural supply chains enhances green productivity: evidence from provincial data in China. Earth's future 13 (5), e2025EF006089. doi:10.1029/2025ef006089
Zandebasiri, M., Goujani, H. J., Iranmanesh, Y., Azadi, H., Viira, A.-H., and Habibi, M. (2023). Ecosystem services valuation: a review of concepts, systems, new issues, and considerations about pollution in ecosystem services. Environ. Sci. Pollut. Res. 30 (35), 83051–83070. doi:10.1007/s11356-023-28143-2
Zhang, Y.-f., Ji, M.-x., and Zheng, X.-z. (2023a). Digital economy, agricultural technology innovation, and agricultural green total factor productivity. Sage Open 13 (3), 21582440231194388. doi:10.1177/21582440231194388
Zhang, J., Liu, C., Wang, H., Liu, X., and Qiao, Q. (2023b). Temporal–spatial dynamics of typical ecosystem services in the Chaobai River basin in the Beijing-Tianjin-Hebei urban megaregion. Front. Ecol. Evol. 11, 1201120–1202023. doi:10.3389/fevo.2023.1201120
Zhang, J., Zhang, Y., Chen, Y., Wang, J., Zhao, L., and Chen, M. (2023c). Evaluation of carbon emission efficiency in the construction industry based on the super-efficient slacks-based measure model: a case study at the provincial level in China. Buildings 13 (9), 2207. doi:10.3390/buildings13092207
Zhao, S., Shi, W., Qiao, F., Wang, C., An, Y., and Zhang, L. (2023). Temporal and spatial changes and trend predictions of forest carbon sequestration efficiency in China based on the carbon neutrality goal. Forests 14 (12), 2387. doi:10.3390/f14122387
Zheng, F., Chen, S., and Wang, X. (2025). How the impact and mechanisms of digital financial inclusion on agricultural carbon emission intensity: new evidence from a double machine learning model. Front. Environ. Sci. 13, 1549623. doi:10.3389/fenvs.2025.1549623
Keywords: forest ecosystem product value (FEPV), regional disparities, super-SBM model, value realization, digital technology, digital organization, digital environment
Citation: Zheng LL, Zhang JY, Suo L, Yu WM and Shi XT (2025) Measurement, spatial distribution dynamics, and influencing factors of forest ecological product value realization efficiency in China. Front. Environ. Sci. 13:1658104. doi: 10.3389/fenvs.2025.1658104
Received: 02 July 2025; Accepted: 05 August 2025;
Published: 08 September 2025.
Edited by:
Ram P. Sharma, Tribhuvan University, NepalReviewed by:
Naseer Abbas Khan, South Ural State University, RussiaAnsheng Huang, Fujian Agriculture and Forestry University, China
Copyright © 2025 Zheng, Zhang, Suo, Yu and Shi. This is an open-access article distributed under the terms of the Creative Commons Attribution License (CC BY). The use, distribution or reproduction in other forums is permitted, provided the original author(s) and the copyright owner(s) are credited and that the original publication in this journal is cited, in accordance with accepted academic practice. No use, distribution or reproduction is permitted which does not comply with these terms.
*Correspondence: Lin Lin Zheng, cGluZ3poZW5nMTI2QDE2My5jb20=; Lei Suo, MjIwMzAxMDExOUBzdHUuYmJndS5lZHUuY24=