 Yunhao Li
 Jia Guo2
 Mingjie Shi
- 1Xinjiang Key Laboratory of Soil and Plant Ecological Processes, Xinjiang Agricultural University, Urumqi, China
- 2College of Ecology and Environment, Xinjiang University, Urumqi, China
- 3Key Laboratory of Land Surface Pattern and Simulation, Institute of Geographic Sciences and Natural Resources Research, Chinese Academy of Sciences, Beijing, China
Vegetation in natural ecosystems plays a significant role in regulating atmospheric PM2.5 pollution; however, systematic and comprehensive research on the spatiotemporal heterogeneity of PM2.5 and its dominant driving mechanisms in Anhui Province remains limited. To address this gap, this study utilized PM2.5 concentration and fractional vegetation cover (FVC) data with a spatial resolution of 1 km and a monthly temporal resolution from 2015 to 2023, and employed multiple analytical methods, including slope trend analysis, hotspot analysis, standard deviation ellipse, and Spearman correlation analysis, to reveal the spatiotemporal characteristics of PM2.5 and its relationship with FVC across Anhui Province. The results demonstrated a consistent downward trend in annual average PM2.5 concentrations from 2015 to 2023, indicating continuous air quality improvement. Seasonal variations displayed a periodic pattern characterized by significant increases in winter and marked decreases in summer, inversely corresponding to the seasonal variation trend of FVC. Spatially, PM2.5 pollution hotspots were predominantly concentrated in northern urban areas, whereas cold spots were primarily distributed in southern mountainous regions, and the centroid of pollution shifted southwestward. Spearman correlation analysis showed a significant negative correlation between PM2.5 and FVC at the seasonal temporal scale (r = −0.80, P < 0.01). Pixel-wise correlation analysis further indicated significant negative correlations in most regions, with mountainous areas exhibiting stronger negative correlations due to higher FVC. These findings provide theoretical support for formulating region-specific air pollution control measures and ecological planning strategies in Anhui Province.
1 Introduction
Fine particulate matter (PM2.5) poses a severe threat to public health globally and has been classified by the World Health Organization (WHO) as one of the primary sources of environmental health risk (World Health Organization, 2021). Numerous international studies have demonstrated that high-level exposure to PM2.5 is significantly associated with increased risks of cardiovascular diseases, respiratory disorders, and premature mortality (Pope III and Dockery, 2006; Burnett et al., 2018).
In recent years, the role of nature-based solutions in improving air quality has received increasing attention. Vegetation, through leaf surface deposition, filtration, and adsorption processes, is recognized as an essential ecological approach to mitigate PM2.5 pollution (Nowak et al., 2013; Blum, 2017). International studies have indicated that urban greening can reduce ambient fine particulate concentrations under certain conditions. For instance, city-scale research conducted in Europe found that increasing street greenery and urban forests could reduce annual average PM2.5 exposure by approximately 5%–10% (Vos et al., 2013; Janhäll, 2015).
Nevertheless, research has also revealed that the vegetation-based mitigation effects are not universally effective, with their performance influenced by multiple factors such as spatial layout, vegetation structure, and meteorological conditions. For example, vegetation barriers situated in street canyons or enclosed transportation corridors can obstruct airflow, inhibit ventilation and dispersion, and even lead to elevated local PM2.5 concentrations (Vos et al., 2013; Janhäll, 2015). Additionally, dry deposition efficiency is subject to complex interactions among wind speed, humidity, leaf area index (LAI), and physicochemical properties of particulate matter, exhibiting significant variation across regions and seasons (Salmond et al., 2016).
In China, existing studies conducted in economically developed regions such as the Beijing–Tianjin–Hebei and Yangtze River Delta regions have identified a generally negative correlation between PM2.5 concentrations and vegetation coverage indicators (NDVI/FVC) (Jin et al., 2022; Qian et al., 2024). While these studies underscore the potential contributions of vegetation to atmospheric pollution mitigation, several limitations persist: firstly, regional coverage has been limited, focusing mainly on economically developed areas in eastern China, thus lacking comprehensive research in central and western regions; secondly, analyses have predominantly remained at the descriptive correlation level, without adequately exploring spatial heterogeneity; thirdly, the lack of long-term dynamic analyses across multiple years restricts a comprehensive understanding of the temporal evolution between pollutants and vegetation.
In addition, existing studies have paid insufficient attention to multi-temporal scale differences. Most research has focused on describing the PM2.5–vegetation relationship at either the annual or seasonal scale, while systematic comparative analyses across annual, seasonal, and monthly scales remain limited (Nowak et al., 2013; Janhäll, 2015; Salmond et al., 2016). Meanwhile, many studies have been conducted at national or regional scales, overlooking the significant spatial heterogeneity within provinces that arises from variations in topography, land use patterns, and socio-economic structures (Bai and Liu, 2024). Therefore, it is necessary to conduct multi-temporal and fine-scale analyses at the provincial level with higher spatiotemporal resolution to better reveal the dynamic interactions and ecological regulatory mechanisms between PM2.5 and vegetation coverage.
Anhui Province, located in the transition zone between the middle-lower Yangtze River and the North China Plain, features complex terrain with significant contrasts between northern plains and southern mountainous areas. As both a critical energy and industrial base, Anhui continues to face persistent atmospheric pollution pressures. The spatial heterogeneity of PM2.5 concentrations in the region is notably influenced by diverse factors, including population distribution, energy structure, industrial layouts, topographical climate, and ecological conditions (Jin et al., 2022). Although several studies have provided descriptive analyses of PM2.5 pollution in Anhui Province, systematic assessments of the dynamic relationship between the spatiotemporal evolution of PM2.5 and vegetation coverage remain limited.
This study aims to fill this research gap by utilizing high-resolution PM2.5 and fractional vegetation cover (FVC) data from 2015 to 2023. By integrating GIS-based spatial analysis, trend analysis, hotspot detection, correlation analysis, the study systematically examines the spatiotemporal variations of PM2.5 and its relationship with FVC in Anhui Province. By elucidating the spatial heterogeneity and potential ecological regulatory mechanisms between these variables, this research provides scientific support for formulating region-specific pollution control strategies and optimizing ecological spatial configurations.
2 Materials and methods
2.1 Study area
Anhui Province is located in the east-central part of China, situated in the middle and lower reaches of the Yangtze River and the Huai River. Its geographical coordinates are approximately between 114°54′-119°37′ E and 29°41′-34°38′ N (Zhao et al., 2021). The general overview of the study area is shown in Figure 1. Anhui currently administers 16 prefecture-level cities and 59 counties (including county-level cities). As of the end of 2023, the province had a permanent population of approximately 61.21 million (Yang et al., 2023).
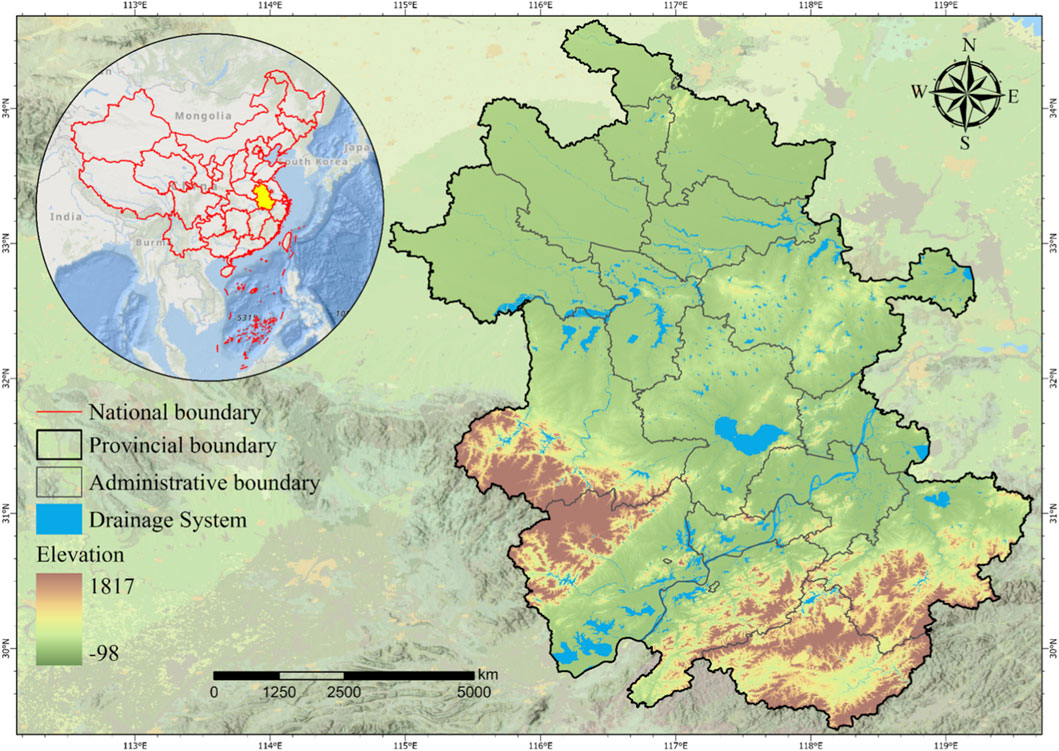
Figure 1. Location and elevation of anhui province.
Anhui borders Jiangsu and Zhejiang to the east, Hubei and Henan to the west, Jiangxi to the south, and Shandong to the north. It extends about 450 km from east to west and approximately 570 km from north to south, covering a land area of about 140,100 square kilometers, which accounts for 1.46% of China’s total area, ranking 22nd nationwide (Liu Y. et al., 2024). The province spans three major river basins: the Yangtze River, the Huai River, and the Xin’an River, and is historically known as the Jianghuai Region. The Yangtze River flows through Anhui for about 400 km, the Huai River for around 430 km, and the Xin’an River for approximately 242 km. The Yangtze and Huai Rivers run across the province from west to east, dividing it into three major natural regions: the Huaibei Plain, the Jianghuai Hills, and the Southern Anhui Mountains (Zhang et al., 2023). Chaohu Lake, located within the province, is one of China’s five largest freshwater lakes, with an area of about 800 square kilometers.
2.2 Data sources and preprocessing
The monthly gridded PM2.5 data used in this study were obtained from the National Tibetan Plateau Data Center (https://data.tpdc.ac.cn/). This dataset is generated using artificial intelligence techniques to fill the spatial gaps in the satellite-based MODIS MAIAC AOD products by integrating model data, ground-based observation data, atmospheric reanalysis data, emission inventories, and other multi-source datasets. It provides seamless surface PM2.5 concentration data across China from 2000 to 2023, with a spatial resolution of 1 km and units in µg/m3. The accuracy assessment, conducted via 10-fold cross-validation, yielded a coefficient of determination (R2) of 0.92 and a root mean square error (RMSE) of 10.76 μg/m3 (Wei et al., 2021). NDVI were derived from the MOD13A3 monthly vegetation index product released by the National Aeronautics and Space Administration (NASA) (https://www.earthdata.nasa.gov), with a spatial resolution of 1 km and a value range from −0.2 to 1 (Didan, 2021). Based on NDVI data, this study used the pixel dichotomy model to calculate the monthly FVC (Mu et al., 2024). The digital elevation model (DEM) data were obtained from the Shuttle Radar Topography Mission (SRTM), which was jointly conducted by NASA and the National Imagery and Mapping Agency (NIMA) of the U.S. Department of Defense. The data are available from (https://srtm.csi.cgiar.org/), with a spatial resolution of 30 m. Hydrological (river and stream) data were sourced from OpenStreetMap (https://www.openstreetmap.org/). Administrative boundary data were obtained from the Tianditu Service Center (https://cloudcenter.tianditu.gov.cn/). In this study, the administrative boundary of Anhui Province was used as the spatial scope and reference basis for analysis. All gridded datasets were clipped accordingly to ensure consistency during spatial analysis (Wang et al., 2021). Before conducting the data analysis, this study first used ArcGIS 10.8 to extract regional mean values at seasonal, annual, quarterly, and monthly scales from the high-resolution raster datasets. To ensure data consistency and comparability, all raster datasets were unified to the same coordinate reference system and aligned to a common grid, maintaining a uniform spatial resolution. This processing ensured the robustness of the multi-temporal analysis and prevented biases that may arise from differences in data scales.
2.3 Method
This study employed the pixel dichotomy model, Slope trend analysis, standard deviation ellipse, hotspot analysis, the Spearman correlation coefficient method, integrating remote sensing imagery and PM2.5 concentration data to systematically investigate the regional-scale vegetation coverage, spatiotemporal variations of PM2.5, and their correlations in Anhui Province (Figure 2).

Figure 2. Technical flowchart.
2.3.1 Pixel dichotomy model
FVC refers to the percentage of the vertical projected area of vegetation (including leaves, stems, and branches) on the ground relative to the total area of the statistical region. It is an important parameter for characterizing surface vegetation coverage and is also one of the key indicators for monitoring ecological and environmental changes (Chen et al., 2024). The pixel dichotomy model is a commonly used method for estimating FVC. This method assumes that each pixel contains two types of land cover: vegetation and non-vegetation, and is therefore referred to as a “dichotomy” model (Yan et al., 2021; Zhao J. et al., 2023; Li et al., 2024; Mu et al., 2024). Using this method, remote sensing data can be employed to estimate the FVC within each pixel. The calculation formula is as follows:
In the equation: FVC is the Fractional Vegetation Cover, representing the proportion of vegetation within a pixel, with a value range from 0 to 1; NDVI is the Normalized Difference Vegetation Index of the current pixel, usually calculated from remote sensing data; NDVIsoil is the NDVI value of a pure soil pixel, that is, the NDVI value when there is no vegetation cover; NDVIveg is the NDVI value of a pure vegetation pixel, that is, the NDVI value under full vegetation cover.
In this study, NDVIsoil and NDVIveg were set to 0.05 and 0.80, respectively. These parameter values were selected based on commonly used endmember ranges in fractional vegetation cover estimation and were further localized according to the soil reflectance characteristics and vegetation growth conditions in Anhui Province (Jiao et al., 2014).
2.3.2 Slope trend analysis
Slope trend analysis is a method used to assess the temporal variation trend of environmental variables such as PM2.5. Typically, the slope is calculated by performing simple linear regression using the least squares method (Guo et al., 2022; Zhao Y. et al., 2023). This method can simulate the change trend of PM2.5 in Anhui Province at the pixel level. The calculation formula is as follows:
In the equation: i represents time, PM2.5i is the observed value of PM2.5 at time i, and n is the total number of time points. If Slope >0, it indicates an increasing trend in PM2.5 concentration; if Slope<0, it indicates a decreasing trend; if Slope = 0, it indicates no significant change.
The significance of the slope was tested using the F-test method, and based on the test results, trends were classified into five categories: significantly increasing (Slope>0, P ≤ 0.01), slightly significantly increasing (Slope>0,0.01 < P ≤ 0.05), no significant change (P > 0.05), slightly significantly decreasing (Slope<0,0.01 < P ≤ 0.05), and significantly decreasing (Slope<0, P ≤ 0.01).
2.3.3 Standard deviation ellipse
The standard deviation ellipse is primarily used to analyze the directional characteristics and variation trends of the spatial distribution of geographic elements. The mean center of the ellipse represents the centroid of the spatial distribution of PM2.5; the major axis of the ellipse indicates the direction in which PM2.5 is predominantly distributed, while the minor axis represents the opposite. The greater the difference between the lengths of the major and minor axes, the stronger the directional tendency of the PM2.5 concentration (Qi et al., 2023; Wang et al., 2023). The formula for calculating the mean center is as follows:
The standard deviation calculation formulas for the x and y axes are as follows:
In the formula: (xi, yi) represent the spatial locations within the study area; wi denotes the spatial weight; (x̄, ȳ) are the coordinates of the ellipse centroid; σx is the standard deviation along the x-axis; σy is the standard deviation along the y-axis.
2.3.4 Hotspot analysis
Hotspot analysis is a spatial statistical method primarily used to detect clustering patterns in geographic data and to identify statistically significant high-value areas (hotspots) or low-value areas (cold spots) (Liu T. et al., 2024; Ghasemi et al., 2025). It is calculated based on the Getis-Ord
In the formula: xj is the attribute value at location j, Wij is the spatial weight between locations i and j,
2.3.5 Spearman correlation coefficient method
The Spearman rank correlation coefficient method is a non-parametric statistical approach that does not require the variables to follow a normal distribution nor assumes a linear relationship between variables. It is suitable for analyzing data with certain volatility and nonlinear characteristics, such as ecological and remote sensing data (Míguez and Fernández, 2023). The specific calculation formula is as follows:
In the formula: r is the Spearman rank correlation coefficient, with a value range between −1 and 1; di represents the difference between the ranks of two variables for the i-th sample; n is the total number of samples. When r approaches 1, it indicates a strong positive correlation between the variables; when r approaches −1, it indicates a strong negative correlation; when r is close to 0, it indicates a very weak or no correlation between the variables. To test the statistical significance of the correlation, the corresponding p-value is usually calculated. Statistically, P < 0.05 indicates a significant correlation, P < 0.01 indicates a highly significant correlation, P < 0.001 indicates an extremely significant correlation, and P ≥ 0.05 indicates no significant correlation.
2.3.6 Partial correlation analysis
To further distinguish the ecological regulatory effect of vegetation from the influence of atmospheric meteorological conditions, a partial correlation analysis was conducted. The partial correlation coefficient measures the degree of association between two variables while controlling for the effects of one or more additional variables. The calculation formula is as follows:
In the formula,
The value range of
3 Results and analysis
3.1 Temporal variation characteristics of PM2.5
3.1.1 Annual average variation characteristics of PM2.5
The annual average concentration trend of PM2.5 in Anhui Province is shown in Figure 3. From 2015 to 2023, the PM2.5 concentration exhibited a continuous downward trend, indicating a gradual improvement in regional air quality. Specifically, the annual average concentration of PM2.5 was 52.31 μg/m3 in 2015 and decreased to 33.26 μg/m3 by 2023, with a total reduction of 19.05 μg/m3. During this period, the largest decline occurred between 2017 and 2018, reaching 6.27 μg/m3. However, brief increases in annual average PM2.5 concentrations were observed from 2016 to 2017 and from 2022 to 2023, with increments of 1.59 μg/m3 and 0.65 μg/m3 respectively, which may be related to changes in meteorological conditions or fluctuations in pollutant emissions. It is important to note that during 2020 and 2021, the COVID-19 pandemic control measures led to a significant reduction in industrial production and transportation emissions, which may have caused a short-term abnormal decrease in the annual average PM2.5 concentration during these 2 years (Chen K. et al., 2020; Le et al., 2020). Despite these short-term increases in certain years, the overall trend remains downward, reflecting the continuous improvement of air quality in Anhui Province year by year.

Figure 3. Annual average variation trend of PM2.5 Concentration in Anhui Province. The blue solid line represents the observed annual average PM2.5 concentration, and the red dashed line represents the regression trend line.
China’s Ambient Air Quality Standards specify that the first-level standard for the annual average concentration of PM2.5 is 15 μg/m3, and the second-level standard is 35 μg/m3. Since 2021, the annual average PM2.5 concentration in Anhui Province has consistently met the second-level standard, indicating that the regional air quality has reached a relatively good level.
3.1.2 Seasonal average variation characteristics of PM2.5
Based on the Earth’s orbital position and the variation of the solar declination point, the year is astronomically divided into four seasons: spring from March to May, summer from June to August, autumn from September to November, and winter from December to February of the following year. Studies have shown that from 2015 to 2023, PM2.5 concentrations in Anhui Province exhibited significant seasonal variation characteristics, as illustrated in Figure 4. Specifically, concentrations are higher in winter and lower in summer. This seasonal variation is closely related to unfavorable meteorological conditions, increased emissions from winter heating, intensified population movement during the Spring Festival, and the burning of fireworks and firecrackers (He et al., 2002; Feng et al., 2012; Ma et al., 2016; Zhang et al., 2017).

Figure 4. Seasonal average variation trend of PM2.5 concentration in anhui province.
3.1.3 Monthly average variation characteristics of PM2.5
Figure 5 shows the monthly variation of PM2.5 concentrations in Anhui Province from 2015 to 2023. The results indicate that PM2.5 concentrations are generally highest in January and December each year, while July typically records the lowest levels. The monthly variation of PM2.5 concentrations roughly follows a “U”-shaped trend, with concentrations gradually decreasing from January to June, reaching the annual minimum in July, and then gradually increasing from August to December, exhibiting a clear cyclical pattern.

Figure 5. Monthly trend of PM2.5 concentration in anhui province.
Table 1 further presents the monthly average variation of PM2.5 concentrations in Anhui Province. From 2015 to 2017, PM2.5 pollution levels were relatively high, with monthly averages in January and December generally exceeding 70 μg/m3, and in some years (such as 2015 and 2017), December concentrations even surpassed 80 μg/m3. Even during the relatively less polluted summer months, PM2.5 concentrations remained above 26 μg/m3. Since 2019, the PM2.5 pollution situation has significantly improved. During the winters (January and December) from 2020 to 2023, PM2.5 concentrations generally remained below 70 μg/m3, with particularly low levels observed in July of 2021 and 2023, when concentrations dropped below 15 μg/m3.

Table 1. Statistical summary of monthly average PM2.5 concentrations in anhui province (μg/m3).
3.2 Spatial variation characteristics of PM2.5
3.2.1 Variation trend of PM2.5
As shown in Figure 6, between 2015 and 2023, the slope of PM2.5 concentration changes in Anhui Province ranged from −4.98 to 0.72 μg/m3, exhibiting an overall spatial downward trend and continuous improvement in regional air quality. Among these, the central area of Hefei City and the northern part of Suzhou City experienced the largest decreases in PM2.5 concentrations. Additionally, the eastern regions of Anhui Province, including Bengbu City, Chuzhou City, Ma’anshan City, and Wuhu City, also showed varying degrees of decline in PM2.5 concentrations.

Figure 6. Spatiotemporal trends and significance test of PM2.5 in anhui province from 2015 to 2023. (a) Rate of change in PM2.5 concentration. (b) Significance of PM2.5 concentration change.
In comparison, the southwestern part of Lu’an City, the northwestern part of Anqing City, Chizhou City, the southern part of Xuancheng City, and Huangshan City showed relatively smaller decreases in PM2.5 concentrations. This may be because these areas are mostly high-altitude regions with dense vegetation cover, where PM2.5 concentrations are inherently low and thus have limited room for further reduction. In fact, the vast majority of Anhui Province exhibits a decreasing trend in PM2.5 concentrations, with only small areas in the northern parts of Huainan City and Chizhou City showing no significant decline.
3.2.2 Spatial centroid variation of PM2.5
In Figure 7, panel (a) shows the spatial distribution of the PM2.5 concentration centroid in Anhui Province from 2015 to 2023. Panel (b) clearly indicates that the spatial distribution of PM2.5 in 2015 differs from other years. Combined with panel (c), it can be seen that the average center of PM2.5 in Anhui Province from 2015 to 2023 was consistently located in the northwest region of Hefei City. Between 2015 and 2017, the average center shifted northwestward by a noticeable distance, marking the largest movement during the period. Subsequently, from 2017 to 2019, the average center moved slightly northeastward. Since 2019, the average center has exhibited an overall southward movement trend, with a southwestward shift from 2019 to 2021 and a further southwestward shift from 2021 to 2023. Ultimately, over the 9 years from 2015 to 2023, the average center of PM2.5 concentration shifted generally toward the southwest.

Figure 7. Spatial centroid variation trend of PM2.5 concentration in Anhui Province from 2015 to 2023. (a) Average centroid positions for different years (denoted by cross markers) and standard deviation ellipses. (b) Local magnified map of the centroid migration path in the northwest corner. (c) Schematic diagram of centroid migration direction.
It should be noted that the southwestward shift of the PM2.5 centroid reflects the overall direction of pollution improvement across the province. The central and southern regions experienced more pronounced declines in PM2.5 concentrations, leading to the southward displacement of the centroid. In contrast, the northern region showed relatively smaller reductions due to the influence of industrial structure and seasonal heating emissions.
In Table 2, the changes in the lengths of the major and minor axes of the standard deviation ellipse are relatively small, indicating that the spatial distribution range of PM2.5 remained relatively stable without significant expansion or contraction. The rotation angle fluctuated between 151.18° and 151.62°, indicating that the spatial distribution direction of the pollutants remained consistent. Overall, the spatial distribution of PM2.5 in Anhui Province did not undergo drastic changes from 2015 to 2023, with the pollution extent and expansion trend remaining relatively stable.

Table 2. Standard deviation ellipse parameters of PM2.5 in anhui province.
3.2.3 Variation in spatial clustering of PM2.5
Using hotspot analysis within local spatial autocorrelation, the spatial clustering patterns of PM2.5 concentrations in Anhui Province for the years 2015, 2019, and 2023 were analyzed. The results are shown in Figure 8 and Table 3.

Figure 8. Spatial distribution of PM2.5 cold and hot spots in anhui province.
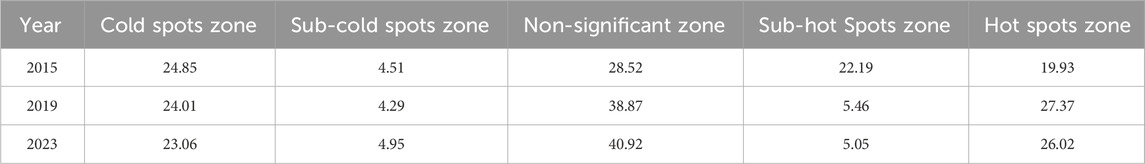
Table 3. Area proportion statistics of PM2.5 cold and hot spot zones in anhui province (%).
In 2015, the PM2.5 pollution hotspots in Anhui Province were mainly concentrated in the northern regions, specifically covering the northern parts of Fuyang City and Bozhou City, most of Huaibei City, the entire Suzhou City, and parts of Bengbu City and Hefei City center. Additionally, localized areas in Chuzhou City and Ma’anshan City also exhibited higher pollution levels. Statistics show that these high-concentration areas accounted for approximately 19.93% of the total area of the province. In contrast, the cold spot zone were located in the mountainous regions of the southern and western parts of the province, including the southwestern part of Lu’an City, the northwestern part of Anqing City, and areas such as Chizhou, Xuancheng, and Huangshan. These cold spots accounted for 24.85% of the total area of the province. These regions have relatively low PM2.5 concentrations, likely due to their complex terrain, higher vegetation coverage, and other ecological factors.
By 2019, the scope of the northern hotspots had significantly expanded, increasing by approximately 7.44% compared to 2015. The hotspots in Bengbu, Fuyang, Bozhou, and Huaian cities became more prominent, and the sub-hotspot zone gradually shifted further north, extending to regions north of Lu’an City, Hefei City, and Chuzhou City. The previously high-pollution areas in central Hefei City weakened and even disappeared. Overall, the hotspot centroid showed a trend of shifting northward. The distribution of cold spots zone remained relatively stable, still mainly concentrated in the southern and western mountainous areas, with little change in spatial pattern compared to 2015.
By 2023, the spatial pattern of PM2.5 cold and hot spots had not shown significant fluctuations compared to 2019. The northern region remained the focal point of pollution clustering, with the boundaries of the hotspots extending northwestward. The previously identified sub-hotspot zone in Chuzhou City had slightly shifted northward. Meanwhile, the mountainous areas in the southern and western parts of the province continued to have relatively low PM2.5 concentrations, indicating that the air quality in these areas has remained in a relatively good condition.
From 2015 to 2023, the spatial distribution pattern of PM2.5 in Anhui Province experienced noticeable adjustments. The central region (such as Hefei, Ma’anshan, and Chuzhou) showed a relatively larger decrease in PM2.5 concentrations, and the cold-spot areas in the southern and western mountainous regions remained spatially stable. 1n contrast, the northern region consistently served as the high-concentration cluster, with a tendency of northwestward expansion. Overall, air quality improved across the province, but the pollution pressure in the northern region remains significant. This pattern is consistent with the change in the centroid of PM2.5: the more pronounced decline in the central region resulted in a southward shift of the centroid, while concentrations in the northern key emission areas declined more slowly due to industrial structure and seasonal heating emissions, maintaining the stability of the hotspot location. Meanwhile, the northwestward extension of the hotspot boundary may be related to atmospheric dispersion conditions and regional pollutant transport during certain periods. In summary, the centroid migration, hotspot persistence, and boundary expansion collectively indicate spatial heterogeneity in emission reduction effectiveness across the province.
3.3 Correlation analysis between PM2.5 and vegetation coverage
3.3.1 Temporal variation characteristics of seasonal average PM2.5 and FVC
As shown in Figure 9, the FVC in Anhui Province from 2015 to 2023 exhibited significant seasonal fluctuations on a seasonal scale: FVC was higher in the summer and lower in the winter. In contrast, the trend of PM2.5 concentrations during the same period showed an opposite pattern, with lower concentrations in the summer and higher concentrations in the winter. A preliminary observation indicates that the time variation of the two variables demonstrates a clear complementary relationship, suggesting that there may be a certain correlation between FVC and PM2.5.

Figure 9. Seasonal trend of FVC in anhui province.
To verify the above hypothesis, considering that the seasonal variation trends of FVC and PM2.5 are relatively consistent each year, grouping the data by a single season for annual analysis may lead to unstable correlation results due to the limited sample size and inter-annual fluctuations. Therefore, to improve statistical efficiency and provide a more comprehensive reflection of the relationship between the two variables, the study integrated quarterly data from 2015 to 2023, constructing 35 sample groups for unified analysis. First, the Spearman rank correlation coefficient method was used to analyze the correlation between FVC and PM2.5. Spearman correlation analysis is a non-parametric statistical method based on ranks, which does not require assuming a linear relationship between variables. It can effectively identify monotonic correlations between variables, making it more suitable for correlation studies in ecological and environmental data.
As shown in Table 4, the correlation between seasonal average PM2.5 concentration and FVC is −0.8025, with a significance p-value of <0.01, indicating a significant negative correlation between the two variables at the seasonal scale.

Table 4. Correlation analysis between seasonal average PM2.5 and FVC.
3.3.2 Spatial distribution characteristics of seasonal average PM2.5 and FVC
As shown in Figure 10, the multi-year mean FVC from 2015 to 2023 exhibits clear seasonal spatial differences across Anhui Province. Vegetation coverage is highest and most widely distributed in summer, corresponding to the period of vigorous plant growth. In autumn, the coverage remains relatively high but begins to decline. In contrast, spring and winter show significantly lower vegetation coverage, with winter exhibiting the lowest levels due to vegetation dormancy. During winter, low-coverage areas occupy a large portion of the province, reflecting substantial seasonal variation in vegetation growth.

Figure 10. Multi-year mean seasonal vegetation coverage (FVC) in Anhui Province from 2015 to 2023.
Correspondingly, Figure 11 presents the multi-year mean seasonal distribution of PM2.5 concentrations in Anhui Province from 2015 to 2023. Overall, areas with higher concentrations are mainly concentrated in the northern part of the province, especially north of the Huai River. In contrast, the southern and southwestern regions exhibit relatively lower concentration levels, forming a distinct north-south gradient. This spatial distribution pattern may, to some extent, be influenced by various factors such as topography, wind direction, economic structure, and the distribution of pollution sources (Li et al., 2017). Studies in China have found a similar north-high, south-low trend in PM2.5 spatial distribution, which is primarily related to the region’s climate conditions, industrial emissions, and transportation activities (Lu et al., 2017).
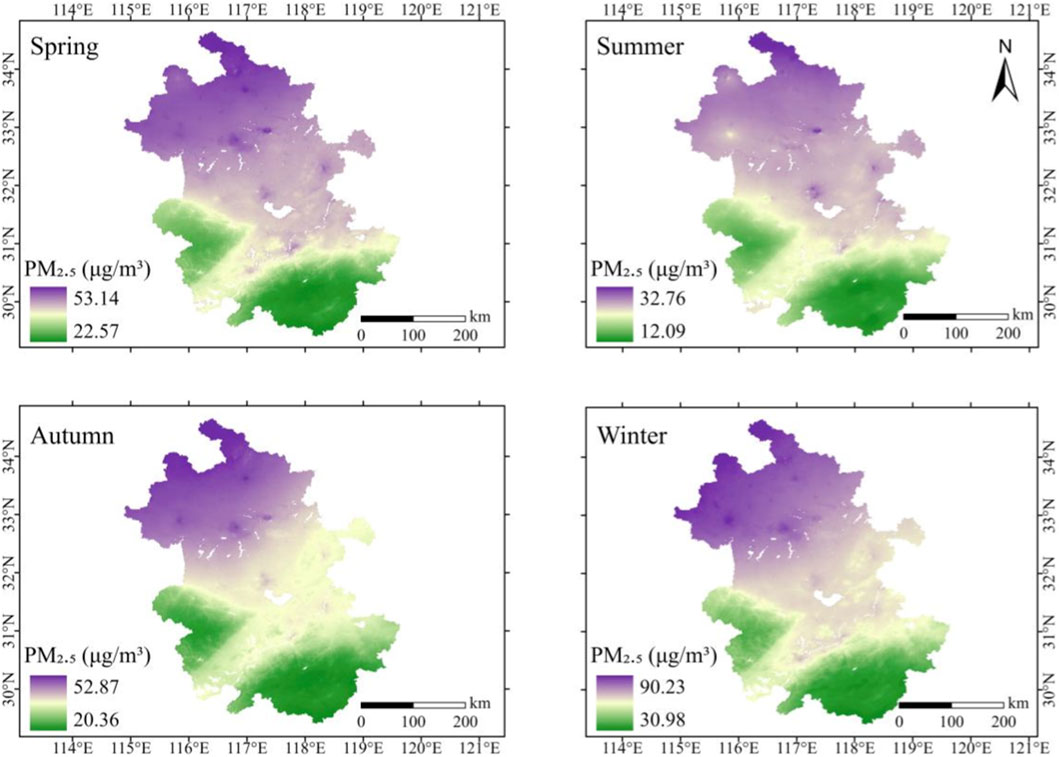
Figure 11. Multi-year mean seasonal spatial distribution of PM2.5 in Anhui Province (2015–2023).
Regarding seasonal variation, PM2.5 concentrations are at their lowest levels in summer, with the highest value being only 32.76 μg/m3, indicating better air quality. However, in winter, concentrations generally increase, with even the lowest value reaching 30.98 μg/m3. This reflects the more pronounced accumulation effect of atmospheric pollutants during the winter months, especially in the context of low temperatures and lockdown restrictions (Yin et al., 2017). Similar seasonal variations have also been validated in other studies, which indicate that winter is a critical period for the increase in PM2.5 concentrations, primarily due to the decrease in temperature, reduced precipitation, and increased heating demand (Ke et al., 2023). Overall, the seasonal variation shows a typical “low in summer, high in winter” fluctuation pattern, with PM2.5 concentrations often experiencing significant increases in winter due to heating and unfavorable meteorological conditions (Qian et al., 2024).
Spatially, FVC levels are highest in summer, and PM2.5 concentrations are lowest, while FVC levels are lowest in winter, and PM2.5 concentrations are highest. Both variables exhibit a certain “inverse variation trend” on the seasonal scale, suggesting that there may be a degree of correlation between the two variables in space.
3.3.3 Pixel-level correlation analysis of seasonal average PM2.5 and FVC
To reveal the spatial response relationship between PM2.5 and FVC, a correlation analysis model based on the quarterly PM2.5 raster data and quarterly FVC raster data from 2015 to 2023 was further constructed at the pixel-by-pixel scale. The Spearman rank correlation coefficient method was used to calculate the correlation for each pixel point across the time series, aiming to explore the spatial heterogeneity of ecological response relationships within the region. The results are shown in Figure 12.
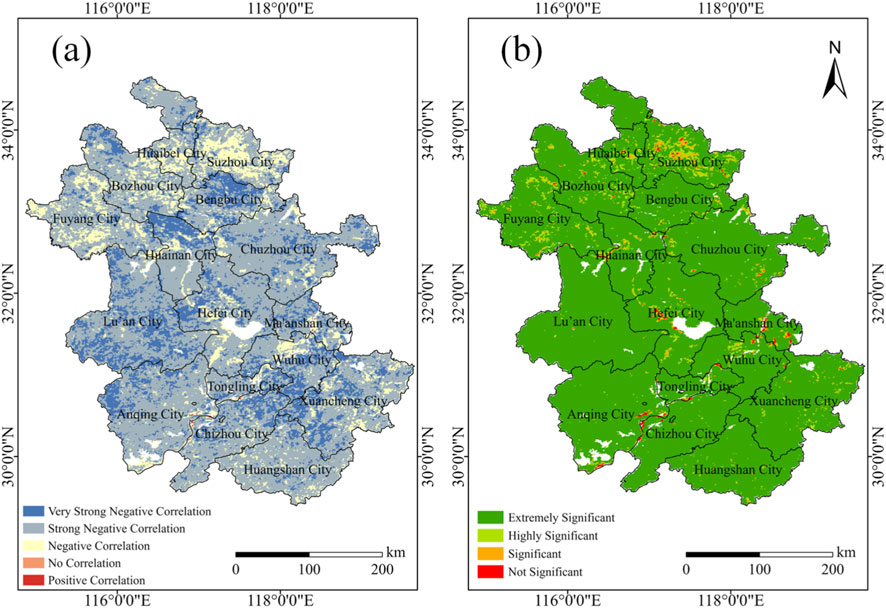
Figure 12. Pixel-level spatial correlation and significance testing of PM2.5 and FVC in anhui province. (a) Spatial distribution of pixel-level correlation between PM2.5 and FVC in anhui province. (b) Significance test of the correlation between PM2.5 and FVC in anhui province.
To further quantify the degree of correlation between variables, according to the classification standards of correlation coefficients in existing studies, the Spearman correlation coefficients are divided into seven levels. As shown in Table 5.

Table 5. Classification standards for spearman correlation coefficients.
In most regions of Anhui Province, there is a prominent negative correlation between PM2.5 concentration and FVC. This negative correlation is particularly strong in the areas around the northern part of Lu’an City, the northern part of Anqing City, the northern part of Huaian City, the central part of Bengbu City, and the border regions of Wuhu, Tongling, Chizhou, Huangshan, and Xuancheng. In these areas, the negative correlation often reaches the level of “strong negative correlation” or even “very strong negative correlation.” These regions are mostly located in mountainous areas with good ecological conditions and high vegetation coverage. In these locations, changes in PM2.5 concentrations are more likely to trigger ecological responses in the vegetation system, exhibiting higher sensitivity.
From the perspective of spatial distribution concentration, urban clusters in northern Anhui, such as Fuyang, Bozhou, Huaibei, and Suzhou, also show a relatively prominent negative correlation. However, their intensity is generally lower than that in the southern mountainous areas. Additionally, some urban regions in the central and southern parts, such as Hefei, Wuhu, and Huangshan, also display discontinuous negative correlation pixels. This may be related to factors such as regional greening levels, topographical differences, or local pollution source interference. Relatively speaking, regions exhibiting little to no significant correlation or a positive correlation are quite limited, mainly concentrated around the boundary between Anqing and Chizhou near the Yangtze River Basin. The topography, water bodies, or human activities in this area may influence the stability of the relationship between PM2.5 and FVC.
From an overall spatial pattern analysis, the trend of “stronger in the south, weaker in the north; stronger in the mountains, weaker in urban areas” is quite evident. In the southern and southwestern mountainous areas, the negative correlation between FVC and PM2.5 is stronger, while in the northern urban and industrially concentrated regions, this relationship is relatively weaker. This distribution characteristic confirms a basic observation: regions with denser vegetation cover and more complete ecosystems are more sensitive to changes in atmospheric particulate concentrations. Conversely, in areas with high levels of urbanization and heavily compressed ecological spaces, their ability to regulate pollution is more limited. This spatial difference reflects the ecological system’s response threshold to pollutant factors and suggests that regional governance should pay more attention to the functional role and protection of ecologically sensitive areas.
After further accounting for the influence of major meteorological conditions (including precipitation, air temperature, relative humidity, and wind speed), a partial correlation analysis was conducted between seasonal PM2.5 concentrations and FVC (Table 6). The results show that although the negative correlation between the two variables is weakened, it remains statistically significant. This indicates that atmospheric dispersion capacity and emission intensity are the primary factors driving the spatiotemporal variations of PM2.5, while vegetation plays a supportive and context-dependent regulatory role. The ecological mitigation effect of vegetation is more pronounced in areas with better ecological conditions and higher vegetation coverage, whereas it is relatively limited in regions with higher levels of urbanization or stronger emission pressures. This finding further confirms the spatial pattern of “stronger correlation in the south than in the north and stronger in mountainous than urban areas,” and underscores the need to coordinate source emission reduction with ecological space optimization in regional air quality management.

Table 6. Partial correlation between seasonal PM2.5 and FVC after controlling for meteorological factors.
4 Discussion
4.1 Spatiotemporal variation characteristics and driving factors of PM2.5 in Anhui Province
On a temporal scale, the annual average concentration of PM2.5 in Anhui Province exhibited a declining trend from 2015 to 2023, decreasing from 52.31 μg/m3 to 33.26 μg/m3, representing an overall reduction of 19.05 μg/m3. This overall improvement reflects the effectiveness of national and local air pollution control policies implemented in recent years, including coal substitution, industrial restructuring, promotion of clean energy for heating, and upgraded vehicle emission standards (Zhang et al., 2019; Geng et al., 2024).
It is noteworthy that during 2020 and 2021, influenced by COVID-19 pandemic control measures, industrial production and transportation activities across the country decreased significantly, causing abnormal reductions in PM2.5 emissions. This phenomenon has been documented in multiple regions across China (Giani et al., 2020; He et al., 2020). Therefore, caution should be exercised when evaluating the long-term effectiveness of governance measures, accounting carefully for the impacts of these special years.
Regarding seasonal characteristics, PM2.5 concentrations in Anhui Province showed a clear seasonal pattern, characterized by high levels in winter and low levels in summer. The winter peaks of pollution are closely associated with increased coal burning for heating, meteorological conditions that lead to temperature inversions, and diminished atmospheric dispersion capabilities, in addition to short-term extreme peaks induced by fireworks during the Spring Festival (Feng et al., 2016; Chen et al., 2017). Conversely, summer conditions, characterized by higher temperature, humidity, and stronger convective activities, favor vertical dispersion and wet deposition of pollutants. Additionally, summer represents the peak vegetation growth period, enhancing dry deposition and adsorption, thus effectively reducing PM2.5 concentrations. This seasonal pattern aligns not only with findings in the current study area but also corroborates similar research conducted in other regions of China (Yang et al., 2017; Chen Z. et al., 2020).
On a spatial scale, Anhui Province exhibited a pronounced spatial heterogeneity, with high concentrations of PM2.5 predominantly in the northern plains, such as Huaibei, Suzhou, Fuyang, and Bengbu. These areas have historically served as pollution hotspots, primarily due to high population density, a coal-intensive energy structure, industries with heavy pollution emissions, and intensive transportation activities (Zheng et al., 2018). By contrast, the southern and southwestern mountainous areas, including Huangshan, Chizhou, and Xuancheng, possess complex terrain, high forest coverage, intact ecosystems, and lower pollution emission intensity, resulting in stronger natural adsorption and deposition capabilities, thus forming PM2.5 cold-spot regions (Huang et al., 2018). Furthermore, the study found a general southwestward shift in the spatial centroid of PM2.5 distribution from 2015 to 2023. This indicates incremental effectiveness of governance measures in eastern and northern industrially dense areas, yet it also highlights the necessity to address potential regional governance disparities and avoid spatial displacement of pollution emissions.
4.2 Correlation between PM2.5 and fractional vegetation cover (FVC) and its ecological regulation role
This study found that from 2015 to 2023, PM2.5 concentrations in Anhui Province exhibited a significant negative correlation with FVC (Spearman r = −0.80, P < 0.01), indicating that increased vegetation coverage helps reduce PM2.5 levels. This negative correlation reflects vegetation’s biophysical mechanisms for particulate matter removal through leaf area, canopy structure, and related deposition, filtration, and adsorption processes. Moreover, this effect shows a nonlinear intensification under conditions of high FVC, consistent with the ecological understanding of a “threshold effect” (Nowak et al., 2013; Blum, 2017).
However, it should be emphasized that this correlation does not imply a straightforward causal relationship, as it is influenced by multiple potential confounding factors, including meteorological conditions (wind speed, humidity, boundary-layer height), seasonal variations in pollution emission sources, and energy consumption structure. For instance, vegetation is sparse in winter, accompanied by increased coal combustion emissions for heating and poor atmospheric dispersion conditions. In contrast, summer is characterized not only by vigorous vegetation growth but also by precipitation and strong convective conditions that enhance pollutant dispersion and deposition (Sun et al., 2018; Chen Z. et al., 2020). This complexity is also why Spearman rank correlation analysis was adopted in this study—to account for nonlinear and non-normally distributed data—but it should still be acknowledged that interactions among meteorological factors and human activities cannot be entirely excluded (Huang et al., 2015).
Furthermore, other studies have indicated that under certain conditions, such as street canyons or poorly designed urban greenery layouts, vegetation can obstruct airflow and contribute to local pollutant accumulation (Vos et al., 2013). Therefore, the efficacy of vegetation in mitigating air pollution is context-dependent, requiring optimization that considers regional pollution characteristics, urban morphology, climate conditions, and vegetation structure.
It is noteworthy that the mitigating effect of vegetation on PM2.5 is more pronounced in mountainous regions. Mountain areas generally possess higher vegetation coverage and more complex vertical canopy structures, which provide greater leaf-surface roughness and interception capacity for particulate matter (Nowak et al., 2013; Linden et al., 2023). In addition, the rugged topography enhances vertical air mixing and dispersion, reducing the accumulation of pollutants near the surface (Song and Shao, 2023). Local microclimatic conditions, such as elevated surface roughness, higher humidity, and more variable wind fields, also contribute to more efficient particulate deposition (Hicks et al., 2016). Therefore, compared with plain areas, vegetation in mountainous regions exhibits a relatively stronger ecological regulating effect on PM2.5 concentrations (Janhäll, 2015).
4.3 Policy implications and future research directions
This study reveals an overall declining trend in PM2.5 concentrations in Anhui Province from 2015 to 2023, marked by pronounced seasonal fluctuations and a complex nonlinear negative correlation with FVC. These findings provide valuable references for formulating more scientific and precise regional air pollution control measures and ecological planning.
Firstly, despite significant overall improvements in air quality, the northern plain areas remain persistent pollution hotspots, and while the centroid of pollution has gradually shifted southwestward, significant spatial disparities still exist. Therefore, differentiated regional governance should continue, particularly through implementing stricter pollution source controls, optimizing energy structures, and promoting cleaner production practices in northern urban clusters. Given the prominent seasonal variation characterized by high concentrations in winter and low concentrations in summer, special attention should also be paid to emissions management during heating periods by promoting cleaner heating solutions and mitigating pollution accumulation in non-heating seasons (Song et al., 2023).
Secondly, the negative correlation between FVC and PM2.5 concentrations was found to be particularly strong in regions with high vegetation coverage, indicating that scientifically enhancing urban and regional greening, optimizing the spatial layout of green spaces, and improving ecological connectivity can contribute to reducing PM2.5 levels. This finding aligns with previous domestic and international research highlighting the beneficial roles of urban forests and ecological greenbelts (Nowak et al., 2006; Blum, 2017). However, it must be recognized that vegetation alone is not a universal solution for PM2.5 mitigation, as its effectiveness is influenced by spatial configuration, vegetation types, meteorological conditions, and the broader pollution context, and can even have adverse effects under certain conditions (Vos et al., 2013; Abhijith et al., 2017). Therefore, efforts toward ecological spatial optimization must be coordinated closely with pollution source reduction, energy transition strategies, and traffic management.
Furthermore, although this research employs monthly gridded PM2.5 data derived from satellite-based inversion integrated with artificial intelligence methods, covering a wide spatial area, limitations remain. These include the absence of independent verification with ground-based observations, lack of explicit control for meteorological variables such as wet deposition and wind conditions, and insufficient temporal resolution to capture intraday or extreme pollution events and their interactions with vegetation. Future studies should incorporate high-temporal-resolution ground monitoring data, meteorological models, emission inventories, and land-use datasets to thoroughly explore vegetation-PM2.5 interactions across multiple scales and mechanisms. This will provide more robust scientific foundations for developing locally appropriate ecological planning and air pollution control policies.
5 Conclusion
This study systematically analyzed the spatiotemporal variations of PM2.5 concentrations and their correlation with FVC in Anhui Province, based on high-resolution grid data from 2015 to 2023. The results indicate that the annual average PM2.5 concentration in Anhui Province has shown a continuous decline, exhibiting significant seasonal characteristics, namely “higher in winter and lower in summer.” Additionally, the spatial distribution follows a “higher in the north, lower in the south” pattern, with northern urban agglomerations remaining key areas for pollution control. Time-series analysis reveals a significant negative correlation between PM2.5 concentrations and FVC, particularly in areas with high vegetation coverage, where the mitigation effect of vegetation is more pronounced. Spatial analysis shows that the southern and southwestern mountainous regions of Anhui, characterized by high forest coverage and relatively intact ecosystems, exhibit stronger particle adsorption and deposition capabilities, forming an important ecological barrier. While vegetation in Anhui Province demonstrates significant ecological potential for mitigating air pollution, this effect is neither linear nor universally applicable, being influenced by multiple factors such as meteorological conditions, topography, the distribution of pollution sources, and green-space layout. Therefore, while promoting the development of green infrastructure, Anhui should adopt a comprehensive governance strategy that prioritizes source emission reductions and complements ecological regulation. Green-space planning and urban design should be optimized based on the characteristics of different regions to achieve a synergistic effect between continuous air quality improvement and the construction of ecological civilization. In summary, this study establishes a multi-temporal analytical framework based on high-resolution PM2.5 and FVC datasets from 2015 to 2023, systematically revealing their coupled relationship and spatial heterogeneity from a long-term dynamic perspective. This work addresses the limitations of previous studies that primarily focused on short time periods or single temporal scales. The findings provide quantitative evidence for understanding the regionally differentiated regulatory effects of vegetation on air pollution mitigation. Moreover, the results offer scientific support for implementing tiered and region-specific air pollution control strategies and optimizing ecological spatial configurations in Anhui Province and similar regions, thereby contributing to the promotion of green and high-quality regional development.
Data availability statement
The raw data supporting the conclusions of this article will be made available by the authors, without undue reservation.
Author contributions
YL: Conceptualization, Data curation, Investigation, Methodology, Writing – original draft, Writing – review and editing. JG: Data curation, Formal Analysis, Methodology, Writing – original draft. CH: Data curation, Investigation, Software, Writing – original draft. XW: Data curation, Investigation, Software, Writing – original draft. MS: Funding acquisition, Project administration, Resources, Supervision, Validation, Visualization, Writing – review and editing.
Funding
The author(s) declared that financial support was received for this work and/or its publication. This research was supported by the Natural Science Foundation of Xinjiang Uygur Autonomous Region. Also was financially supported by the National Key Research and Development Program of China (No. 2023YFD1901503-2), the Major Science and Technology Special Projects in the Xianjiang Uygur Autonomous Region, China (No. 2023A02002), and the Xinjiang Talent System Construction - Cotton Industry System.
Acknowledgements
The authors would like to extend special thanks to Associate Professor Zhang Li for her guidance and revisions throughout this study. Her invaluable advice and assistance during the entire research process were greatly appreciated.
Conflict of interest
The author(s) declared that this work was conducted in the absence of any commercial or financial relationships that could be construed as a potential conflict of interest.
Generative AI statement
The author(s) declared that generative AI was not used in the creation of this manuscript.
Any alternative text (alt text) provided alongside figures in this article has been generated by Frontiers with the support of artificial intelligence and reasonable efforts have been made to ensure accuracy, including review by the authors wherever possible. If you identify any issues, please contact us.
Publisher’s note
All claims expressed in this article are solely those of the authors and do not necessarily represent those of their affiliated organizations, or those of the publisher, the editors and the reviewers. Any product that may be evaluated in this article, or claim that may be made by its manufacturer, is not guaranteed or endorsed by the publisher.
References
Abhijith, K., Kumar, P., Gallagher, J., Mcnabola, A., Baldauf, R., Pilla, F., et al. (2017). Air pollution abatement performances of green infrastructure in open road and built-up street canyon environments–A review. Atmos. Environment 162, 71–86. doi:10.1016/j.atmosenv.2017.05.014
Bai, Y., and Liu, M. (2024). Multi-scale spatiotemporal trends and corresponding disparities of PM2. 5 exposure in China. Environ. Pollut. 340, 122857. doi:10.1016/j.envpol.2023.122857
Blum, J. (2017). “Contribution of ecosystem services to air quality and climate change mitigation policies: the case of urban forests in Barcelona, Spain,” in Urban forests (Apple Academic Press), 21–54.
Burnett, R., Chen, H., Szyszkowicz, M., Fann, N., Hubbell, B., Pope Iii, C. A., et al. (2018). Global estimates of mortality associated with long-term exposure to outdoor fine particulate matter. Proc. Natl. Acad. Sci. 115, 9592–9597. doi:10.1073/pnas.1803222115
Chen, R., Yin, P., Meng, X., Liu, C., Wang, L., Xu, X., et al. (2017). Fine particulate air pollution and daily mortality. A nationwide analysis in 272 Chinese cities. Am. Journal Respiratory Critical Care Medicine 196, 73–81. doi:10.1164/rccm.201609-1862OC
Chen, K., Wang, M., Huang, C., Kinney, P. L., and Anastas, P. T. (2020a). Air pollution reduction and mortality benefit during the COVID-19 outbreak in China. Lancet Planet. Health 4, e210–e212. doi:10.1016/S2542-5196(20)30107-8
Chen, Z., Chen, D., Zhao, C., Kwan, M.-P., Cai, J., Zhuang, Y., et al. (2020b). Influence of meteorological conditions on PM2. 5 concentrations across China: a review of methodology and mechanism. Environ. International 139, 105558. doi:10.1016/j.envint.2020.105558
Chen, M., Xue, Y., Xue, Y., Peng, J., Guo, J., and Liang, H. (2024). Assessing the effects of climate and human activity on vegetation change in northern China. Environ. Res. 247, 118233. doi:10.1016/j.envres.2024.118233
Didan, K. (2021). MODIS/Terra vegetation indices monthly L3 global 1km SIN grid V061. NASA EOSDIS Land Process. Distrib. Act. Arch. Cent. (DAAC) Data Set, MOD13A13. 061. doi:10.5067/MODIS/MOD13A3.061
Feng, J., Sun, P., Hu, X., Zhao, W., Wu, M., and Fu, J. (2012). The chemical composition and sources of PM2. 5 during the 2009 Chinese new Year's holiday in Shanghai. Atmos. Res. 118, 435–444. doi:10.1016/j.atmosres.2012.08.012
Feng, J., Yu, H., Su, X., Liu, S., Li, Y., Pan, Y., et al. (2016). Chemical composition and source apportionment of PM2. 5 during Chinese spring festival at Xinxiang, a heavily polluted city in north China: fireworks and health risks. Atmos. Res. 182, 176–188. doi:10.1016/j.atmosres.2016.07.028
Geng, G., Liu, Y., Liu, Y., Liu, S., Cheng, J., Yan, L., et al. (2024). Efficacy of China’s clean air actions to tackle PM2. 5 pollution between 2013 and 2020. Nat. Geosci. 17, 987–994. doi:10.1038/s41561-024-01540-z
Ghasemi, K., Al-Zubaidi, A. M. J., Qelichi, M. M., and Dolatkhahi, K. (2025). Understanding urban sprawl in baqubah, Iraq: a study of influential factors. J. Urban Manag. 14, 787–812. doi:10.1016/j.jum.2025.01.013
Giani, P., Castruccio, S., Anav, A., Howard, D., Hu, W., and Crippa, P. (2020). Short-term and long-term health impacts of air pollution reductions from COVID-19 lockdowns in China and Europe: a modelling study. Lancet Planet. Health 4, e474–e482. doi:10.1016/S2542-5196(20)30224-2
Guo, F., Tang, M., Wang, X., Yu, Z., Wei, F., Zhang, X., et al. (2022). Characteristics, sources, and health risks of trace metals in PM2. 5. Atmos. Environ. 289, 119314. doi:10.1016/j.atmosenv.2022.119314
He, K., Huo, H., and Zhang, Q. (2002). Urban air pollution in China: current status, characteristics, and progress. Annu. Review Energy Environment 27, 397–431. doi:10.1146/annurev.energy.27.122001.083421
He, G., Pan, Y., and Tanaka, T. (2020). The short-term impacts of COVID-19 lockdown on urban air pollution in China. Nat. Sustainability 3, 1005–1011. doi:10.1038/s41893-020-0581-y
Hicks, B. B., Saylor, R. D., and Baker, B. D. (2016). Dry deposition of particles to canopies—A look back and the road forward. J. Geophys. Res. Atmos. 121 (14), 691–707. doi:10.1002/2015jd024742
Huang, F., Li, X., Wang, C., Xu, Q., Wang, W., Luo, Y., et al. (2015). PM2. 5 spatiotemporal variations and the relationship with meteorological factors during 2013-2014 in Beijing, China. PloS One 10, e0141642. doi:10.1371/journal.pone.0141642
Huang, Y., Yan, Q., and Zhang, C. (2018). Spatial–temporal distribution characteristics of PM 2.5 in China in 2016. J. Geovisualization Spatial Analysis 2, 1–18. doi:10.1007/s41651-018-0019-5
Janhäll, S. (2015). Review on urban vegetation and particle air pollution–deposition and dispersion. Atmos. Environment 105, 130–137. doi:10.1016/j.atmosenv.2015.01.052
Jiao, Q., Zhang, B., Liu, L., Li, Z., Yue, Y., and Hu, Y. (2014). Assessment of spatio-temporal variations in vegetation recovery after the Wenchuan earthquake using landsat data. Nat. Hazards 70, 1309–1326. doi:10.1007/s11069-013-0875-8
Jin, J., Liu, S., Wang, L., Wu, S., and Zhao, W. (2022). Fractional vegetation cover and spatiotemporal variations of PM2. 5 concentrations in the beijing-tianjin-hebei region of China. Atmosphere 13, 1850. doi:10.3390/atmos13111850
Ke, Y., Wang, H., Wu, Z., Liu, S., Zhao, T., and Yin, Y. (2023). Quantifying the pollution characteristics of chemical components in PM2. 5 in the north China plain, China: spatiotemporal variation and health risk. Atmos. Environ. 307, 119860. doi:10.1016/j.atmosenv.2023.119860
Le, T., Wang, Y., Liu, L., Yang, J., Yung, Y. L., Li, G., et al. (2020). Unexpected air pollution with marked emission reductions during the COVID-19 outbreak in China. Science 369, 702–706. doi:10.1126/science.abb7431
Li, T., Shen, H., Yuan, Q., Zhang, X., and Zhang, L. (2017). Estimating ground-level PM2. 5 by fusing satellite and station observations: a geo-intelligent deep learning approach. Geophys. Res. Lett. 44 (11), 911–993. doi:10.1002/2017gl075710
Li, X., Liu, Y., and Wang, L. (2024). Change in fractional vegetation cover and its prediction during the growing season based on machine learning in southwest China. Remote Sens. 16, 3623. doi:10.3390/rs16193623
Linden, J., Gustafsson, M., Uddling, J., Watne, Å., and Pleijel, H. (2023). Air pollution removal through deposition on urban vegetation: the importance of vegetation characteristics. Urban For. and Urban Green. 81, 127843. doi:10.1016/j.ufug.2023.127843
Liu, T., Ahmad, I., Dar, M. A., Zelenakova, M., Gebrie, L. M., Kifle, T., et al. (2024a). Identification of hotspots and cold-spots of groundwater potential using spatial statistics. J. Hydrology Regional Stud. 56, 101977. doi:10.1016/j.ejrh.2024.101977
Liu, Y., Liu, C., Wang, L., Chen, X., Qiao, H., Zhang, Y., et al. (2024b). Investigating the impact of climatic and environmental factors on HFRS prevalence in Anhui province, China, using satellite and reanalysis data. Front. Public Health 12, 1447501. doi:10.3389/fpubh.2024.1447501
Lu, D., Xu, J., Yang, D., and Zhao, J. (2017). Spatio-temporal variation and influence factors of PM2. 5 concentrations in China from 1998 to 2014. Atmos. Pollut. Res. 8, 1151–1159. doi:10.1016/j.apr.2017.05.005
Ma, Z., Hu, X., Sayer, A. M., Levy, R., Zhang, Q., Xue, Y., et al. (2016). Satellite-based spatiotemporal trends in PM2. 5 concentrations: china, 2004–2013. Environ. Health Perspectives 124, 184–192. doi:10.1289/ehp.1409481
Míguez, C., and Fernández, C. (2023). Evaluating the combined use of the NDVI and high-density lidar data to assess the natural regeneration of P. pinaster after a high-severity fire in NW Spain. Remote Sens. 15, 1634. doi:10.3390/rs15061634
Mu, X., Yang, Y., Xu, H., Guo, Y., Lai, Y., Mcvicar, T. R., et al. (2024). Improvement of NDVI mixture model for fractional vegetation cover estimation with consideration of shaded vegetation and soil components. Remote Sens. Environ. 314, 114409. doi:10.1016/j.rse.2024.114409
Nowak, D. J., Crane, D. E., and Stevens, J. C. (2006). Air pollution removal by urban trees and shrubs in the United States. Urban Forestry and Urban Greening 4, 115–123. doi:10.1016/j.ufug.2006.01.007
Nowak, D. J., Hirabayashi, S., Bodine, A., and Hoehn, R. (2013). Modeled PM2. 5 removal by trees in ten US cities and associated health effects. Environ. Pollution 178, 395–402. doi:10.1016/j.envpol.2013.03.050
Pope Iii, C. A., and Dockery, D. W. (2006). Health effects of fine particulate air pollution: lines that connect. J. Air and Waste Management Association 56, 709–742. doi:10.1080/10473289.2006.10464485
Qi, G., Wei, W., Wang, Z., Wang, Z., and Wei, L. (2023). The spatial-temporal evolution mechanism of PM2. 5 concentration based on China's climate zoning. J. Environmental Management 325, 116671. doi:10.1016/j.jenvman.2022.116671
Qian, Z., Li, L., Lin, X., Sun, R., and Chen, Y. (2024). Spatial and temporal variation of PM2. 5 and the influence of vegetation in the yangtze river Delta region. Atmos. Pollut. Res. 15, 102266. doi:10.1016/j.apr.2024.102266
Salmond, J. A., Tadaki, M., Vardoulakis, S., Arbuthnott, K., Coutts, A., Demuzere, M., et al. (2016). Health and climate related ecosystem services provided by street trees in the urban environment. Environ. Health 15, S36. doi:10.1186/s12940-016-0103-6
Song, Y., and Shao, M. (2023). Impacts of complex terrain features on local wind field and PM2. 5 concentration. Atmosphere 14, 761. doi:10.3390/atmos14050761
Song, C., Liu, B., Cheng, K., Cole, M. A., Dai, Q., Elliott, R. J., et al. (2023). Attribution of air quality benefits to clean winter heating policies in China: combining machine learning with causal inference. Environ. Science and Technology 57, 17707–17717. doi:10.1021/acs.est.2c06800
Sun, W., Shao, M., Granier, C., Liu, Y., Ye, C., and Zheng, J. (2018). Long-term trends of anthropogenic SO2, NOx, CO, and NMVOCs emissions in China. Earth's Future 6, 1112–1133. doi:10.1029/2018ef000822
Vos, P. E., Maiheu, B., Vankerkom, J., and Janssen, S. (2013). Improving local air quality in cities: to tree or not to tree? Environ. Pollution 183, 113–122. doi:10.1016/j.envpol.2012.10.021
Wang, S., Xu, L., Zhuang, Q., and He, N. (2021). Investigating the spatio-temporal variability of soil organic carbon stocks in different ecosystems of China. Sci. Total Environ. 758, 143644. doi:10.1016/j.scitotenv.2020.143644
Wang, H., Zhang, M., Niu, J., and Zheng, X. (2023). Spatiotemporal characteristic analysis of PM2. 5 in central China and modeling of driving factors based on MGWR: a case study of Henan Province. Front. Public Health 11, 1295468. doi:10.3389/fpubh.2023.1295468
Wei, J., Li, Z., Lyapustin, A., Sun, L., Peng, Y., Xue, W., et al. (2021). Reconstructing 1-km-resolution high-quality PM2. 5 data records from 2000 to 2018 in China: spatiotemporal variations and policy implications. Remote Sens. Environ. 252, 112136. doi:10.1016/j.rse.2020.112136
World Health Organization (2021). WHO global air quality guidelines: particulate matter (PM2. 5 and PM10), ozone, nitrogen dioxide, sulfur dioxide and carbon monoxide. World Health Organization.
Xu, H., Wang, H., Croot, P., Liu, J., Li, Y., Beiyuan, J., et al. (2025). Investigation of spatially varying relationships between cadmium accumulation and potential controlling factors in the topsoil of island of Ireland based on spatial machine learning approaches. Environ. Res. 275, 121466. doi:10.1016/j.envres.2025.121466
Yan, K., Gao, S., Chi, H., Qi, J., Song, W., Tong, Y., et al. (2021). Evaluation of the vegetation-index-based dimidiate pixel model for fractional vegetation cover estimation. IEEE Trans. Geoscience Remote Sens. 60, 1–14. doi:10.1109/tgrs.2020.3048493
Yang, Q., Yuan, Q., Li, T., Shen, H., and Zhang, L. (2017). The relationships between PM2. 5 and meteorological factors in China: seasonal and regional variations. Int. Journal Environmental Research Public Health 14, 1510. doi:10.3390/ijerph14121510
Yang, Z., Hong, Y., Zhai, G., Wang, S., Zhao, M., Liu, C., et al. (2023). Spatial coupling of population and economic densities and the effect of topography in Anhui province, China, at a grid scale. Land 12, 2128. doi:10.3390/land12122128
Yin, Z., Wang, H., and Chen, H. (2017). Understanding severe winter haze events in the north China plain in 2014: roles of climate anomalies. Atmos. Chem. Phys. 17, 1641–1651. doi:10.5194/acp-17-1641-2017
Zhang, J., Yang, L., Chen, J., Mellouki, A., Jiang, P., Gao, Y., et al. (2017). Influence of fireworks displays on the chemical characteristics of PM2. 5 in rural and suburban areas in central and east China. Sci. Total Environ. 578, 476–484. doi:10.1016/j.scitotenv.2016.10.212
Zhang, Q., Zheng, Y., Tong, D., Shao, M., Wang, S., Zhang, Y., et al. (2019). Drivers of improved PM2.5 air quality in China from 2013 to 2017, Proceedings of the National Academy of Sciences 116, 24463–24469. doi:10.1073/pnas.1907956116
Zhang, G., Roslan, S. N. A., Quan, L., and Yuan, P. (2023). Simulation of spatiotemporal patterns of habitat quality and driving mechanism in Anhui province, China. Front. Environ. Sci. 11, 1145626. doi:10.3389/fenvs.2023.1145626
Zhao, M.-S., Qiu, S.-Q., Wang, S.-H., Li, D.-C., and Zhang, G.-L. (2021). Spatial-temporal change of soil organic carbon in Anhui province of east China. Geoderma Reg. 26, e00415. doi:10.1016/j.geodrs.2021.e00415
Zhao, J., Li, J., Liu, Q., Xu, B., Mu, X., and Dong, Y. (2023a). Generation of a 16 m/10-day fractional vegetation cover product over China based on Chinese GaoFen-1 observations: method and validation. Int. J. Digital Earth 16, 4229–4246. doi:10.1080/17538947.2023.2264815
Zhao, Y., Li, B., Ni, J., Liu, L., Niu, X., Liu, J., et al. (2023b). Global spatial and temporal patterns of fine particulate concentrations and exposure risk assessment in the context of SDG indicator 11.6. 2. Ecol. Indic. 155, 111031. doi:10.1016/j.ecolind.2023.111031
Keywords: PM2.5, spatiotemporal evolution, Anhui Province, fractional vegetation cover, correlation analysis
Citation: Li Y, Guo J, Han C, Wang X and Shi M (2025) Spatiotemporal trends and ecological disparities of PM2.5 and vegetation coverage in Anhui Province. Front. Environ. Sci. 13:1717796. doi: 10.3389/fenvs.2025.1717796
Received: 03 October 2025; Accepted: 29 November 2025;
Published: 18 December 2025.
Edited by:
Bhogendra Mishra, Consiglio Nazionale delle Ricerche, ItalyCopyright © 2025 Li, Guo, Han, Wang and Shi. This is an open-access article distributed under the terms of the Creative Commons Attribution License (CC BY). The use, distribution or reproduction in other forums is permitted, provided the original author(s) and the copyright owner(s) are credited and that the original publication in this journal is cited, in accordance with accepted academic practice. No use, distribution or reproduction is permitted which does not comply with these terms.
*Correspondence: Mingjie Shi, c21qQHhqYXUuZWR1LmNu