 Jian Zhai
- Shanghai Publishing and Printing College, Shanghai, China
Introduction: The printing industry in China, with an annual output value of ¥1.43 trillion, is a significant source of volatile organic compound (VOC) emissions, which are key precursors to ozone formation. However, a comprehensive national-scale assessment linking VOC emissions to ozone formation potential (OFP) across major industrial zones has been lacking.
Methods: This study conducted a meta-analysis of VOC emissions and their OFP from China's printing industry, encompassing data from 14 major cities across three key regions: the Pearl River Delta, Yangtze River Delta, and Bohai Rim. The analysis integrated data on VOC speciation, concentrations, and pollution control technologies through a systematic review and harmonization of existing literature and industry data.
Results: Oxygenated Volatile Organic Compounds (OVOCs) dominated the emission profiles, accounting for 44.6%–81.1% of total VOC emissions. Isopropanol and ethyl acetate were identified as the predominant species, contributing 28.7% ± 5.3% and 24.1% ± 4.8% of total VOCs, respectively. Significant regional variations were observed, strongly linked to differences in ink types and printing processes. OFP values exhibited a wide range from 78.5 to 643.5 mg m−3, with Changsha exhibiting the highest OFP, attributable to its prevalent use of gravure printing. Evaluation of pollution control technologies revealed widespread inefficiency, with 68% of enterprises relying on granular activated carbon (GAC), which typically achieves 40%–75% removal efficiency. In contrast, regenerative thermal oxidizers (RTOs) demonstrated superior performance, exceeding 90% efficiency.
Discussion: The findings highlight substantial regional disparities in emission profiles and OFP, driven by varying industrial practices and regulatory environments. The prevalence of inefficient control technologies like GAC underscores a critical gap in current pollution mitigation efforts. To effectively address VOC emissions and ozone formation, we recommend: (a) mandating the use of water-based inks in high-emission processes such as gravure and flexible packaging printing; (b) upgrading to advanced treatment technologies with >80% collection efficiency; and (c) implementing real-time VOC monitoring systems. This study provides a scientific basis for formulating targeted, region-specific VOC control strategies within China's crucial printing industry.

GRAPHICAL ABSTRACT |
1 Introduction
Since implementing the Action Plan for the Prevention and Control of Air Pollution (APCP) and other mitigation strategies in 2013, China has witnessed a significant decline in air pollutant emissions and a substantial improvement in overall air quality (Yan et al., 2020). However, the proportion of days with moderate or high air pollution levels where ozone (O3) is the primary pollutant has been increasing, which has become a growing concern (Wang JD. et al., 2018). Volatile organic compounds (VOCs) are key precursors to the formation of O3, fine particulate matter (PM2.5), and secondary organic aerosols (SOA) (Carter, 1994; Volkamer et al., 2006; Wu and Xie, 2017; 2018; Chen et al., 2020; Lewis et al., 2020). Controlling VOC emissions is therefore essential to mitigate O3 and SOA pollution in China.
The printing industry significantly contributes to regional economic growth and livelihoods (Lin et al., 2018). With a total output value of ¥1.43 trillion in 2022, China’s printing industry is the largest globally (National Press and Publication Administration, 2023). This industry has developed three major clusters: the Pearl River Delta (centered in Guangdong Province), the Yangtze River Delta (centered on Shanghai, Jiangsu, Zhejiang, and Anhui Province), and the Bohai Rim region (centered on Beijing, Tianjin, and Hebei Province). The printing industry is a major source of industrial VOC emissions in China, accounting for 9.56% of the national total (Liang XM. et al., 2023). This proportion is second only to the industrial coating sector, which contributes approximately 27% (Liang et al., 2017; 2020a; 2020b). Printing and compounding operations use organic materials—such as inks, adhesives, and thinners—that emit significant quantities of VOCs (Song et al., 2022; Zhao et al., 2021; Wu et al., 2020; Zhang et al., 2020). In 2020, VOC emissions from China’s printing sector reached 861 Gg (Liang XM. et al., 2023). Gravure printing and packaging were the two largest sources, accounting for 52.0% and 28.7% of total emissions, respectively, followed by lithographic printing (11.3%). Letterpress and perforated printing contributed minimally, at 5.0% and 3.0%, respectively (Liang XM. et al., 2023). Given its significant contribution, the printing industry remains a key sector targeted by the Chinese government for VOC emission reduction. Numerous standard guidelines and control policies have recently been issued to promote comprehensive rectification within the industry (Ministry of Ecology and Environment (MEE), 2020a, 2020b, 2021, 2022). Notable examples include the Emission Standard of Air Pollutants for the Printing Industry (GB 41616–2022) and the Technical Guidelines for Feasible Technologies for Pollution Prevention and Control in the Printing Industry (HJ 1089–2020).
A deeper understanding of VOC emission characteristics from the printing industry is crucial for designing effective control strategies and achieving long-term air quality improvements in China.
Although recent studies have started to characterize VOCs from this sector, they have primarily focused on specific regions such as Guangdong Province, Zhejiang Province, and the Beijing-Tianjin-Hebei area (Cai and Cai, 2013; Wang JN. et al., 2018; Liu et al., 2019). A comprehensive national-scale assessment, however, is still lacking, particularly one that links emission profiles to ozone formation potential (OFP) across major industrial zones.
This study addresses this gap by conducting a meta-analysis of VOC emissions and OFP across 14 major cities within China’s three primary industrial regions, integrating data on raw materials (e.g., solvent-based versus water-based inks), processes (gravure, lithographic, and letterpress), control technologies, and local regulatory environments. Our integrated analysis revealed that Oxygenated Volatile Organic Compounds (OVOCs) are the dominant emission class (44.6%–81.1%), a substantial fraction that has been underreported previously. Isopropanol and ethyl acetate were identified as key species driving both total VOC emissions and ozone formation potential (OFP), which ranged from 78.5 to 643.5 mg m-3. Moving beyond previous studies focused on emission inventories, our work establishes clear links between specific VOC species and their industrial sources, such as isopropanol (from binder thinners) and ethyl acetate (from solvent-based inks). Furthermore, we quantified ozone-forming reactivity using updated maximum incremental reactivity (MIR) scales (Carter, 2010; Zhang et al., 2021), thereby establishing a mechanistic framework for targeted pollution control. This study provides the first nationwide assessment of VOC emissions and OFP from China’s printing industry, covering 14 cities across three major industrial regions.
2 Methods and data
2.1 Study area and city selection
This study selected major cities and industrial agglomerations with significant printing industries as representative case studies. The study locations included Beijing, Tianjin, Tangshan, Xingtai, Shanghai, Nanjing, Guangzhou, Shenzhen, Chengdu, Changsha, Zhengzhou, Luohe, Wuhan, Jinan, and the Harbin-Changchun urban agglomeration (Shang, 2023).
2.2 Data sources
The VOC emission characteristics of printing enterprises in the studied cities were compiled through an extensive review of the extant literature (Tian et al., 2017; Zhou et al., 2018; Xie et al., 2018; Fang et al., 2019; Feng et al., 2020; Bao et al., 2020; Qi et al., 2020; Zhao et al., 2021; Qi et al., 2021; Song, 2021; Huang et al., 2022; Li et al., 2023; Du et al., 2024; Wu et al., 2023) and data from industry associations, including the Printing Technology Association of China (https://www.cnprint.org.cn/) and the Printing and Printing Equipment Industries Association of China (http://www.chinaprint.org.cn/). These literature and association data formed the sole basis for the emission profiles and OFP calculations presented herein.
2.3 Data integration and analysis methodology
As this study is exclusively based on secondary data sources (Section 2.2), the methodology focused on the systematic retrieval, critical evaluation, and harmonization of the compiled literature and association data. The analytical process consisted of the following steps:
Data Extraction: VOC speciation profiles, concentration data, and exhaust treatment efficiency values were systematically extracted from each source into a standardized database. Key parameters recorded included sampling location, printing process type, ink type (solvent-based versus water-based), and reported control technologies.
Quality Screening: Extracted data were screened for consistency and reliability. Studies that did not explicitly detail their sampling or analytical methods (e.g., following recognized protocols like US EPA Methods TO-15 or HJ 644-2013) were assigned a lower weighting in subsequent analyses to minimize bias from non-standardized measurements.
Data Harmonization: To reconcile reporting discrepancies across studies (e.g., different VOC species lists, units), all concentration data were converted to a standard unit (μg m-3). VOC species were reclassified into consistent chemical categories (e.g., alkanes, OVOCs, aromatics).
Weighted Averaging: Representative emission profiles for each city and process type were generated by calculating a weighted average of the extracted data. The weighting was based on the reported sample size of each source study and the operational scale of the facilities it characterized, ensuring that larger, more representative studies contributed more significantly to the integrated profile.
Uncertainty Estimation: The variability in the compiled data (e.g., standard deviation or range reported across studies for a given city/process) was used to estimate uncertainty for the integrated emission profiles. This uncertainty was propagated to the OFP calculations using a Monte Carlo simulation approach (1000 iterations), incorporating both concentration uncertainties and variability in MIR coefficients where available. The resulting OFP uncertainties typically ranged from 15% to 35% across different cities and VOC species.
The OFP for these integrated VOC profiles was then calculated using the MIR method, as detailed in Section 2.4. This rigorous and transparent data synthesis protocol ensured the derivation of robust, national-scale insights from the available published data.
The total number of samples integrated from the literature and industry sources across all cities was approximately ∼200 enterprise-level samples, which formed the basis for the weighted averaging and uncertainty estimation.
2.4 Estimation of the ozone formation potential
OFP is a key metric for assessing the contribution of VOCs to secondary pollution, specifically O3 and SOA. The MIR scale was employed because it is the most widely recognized method for evaluating the O3-forming potential of VOCs under conditions conducive to O3 production (i.e., NOx-rich environments). This method was particularly appropriate for our study as China’s major urban areas, including all cities in our analysis, typically experience NOx-rich conditions during ozone episodes, as documented in recent atmospheric chemistry studies (Zhang et al., 2021). While alternative methods like Photochemical Ozone Creation Potential (POCP) exist, the MIR approach provides better alignment with China’s specific atmospheric conditions and enables direct comparison with previous domestic studies. Furthermore, MIR values are specifically derived to represent ozone formation potential under high-NOx conditions, which are prevalent in Chinese urban areas during ozone pollution events. This makes it suitable for regulatory purposes and enables direct comparison with previous studies (Carter, 2010; Zhang et al., 2021). The OFP of individual VOC species from various printing processes was evaluated using the MIR method (Carter, 2010). The OFP for species i was calculated using Equation 1:
where OFPi is the O3 formation potential of species i (mg m-3), Ci is the mass concentration of species i (μg m-3), and MIRi is the maximum incremental reactivity coefficient for species i (g O3 per g VOC), obtained from Carter (2010) and Zhang et al. (2021).
3 Results and discussions
3.1 Characteristics of VOCs emitted from the printing industry in different cities
As shown in Figure 1, OVOCs constituted the largest proportion of VOC emissions across most cities, ranging from 44.6% in Beijing to 81.1% in Tianjin. This significant variation is largely attributable to regional differences in ink usage—specifically, the predominant use of solvent-based inks in Tianjin compared to water-based inks in Beijing. Alkanes, aromatic hydrocarbons, and halogenated hydrocarbons comprised the remaining fractions. OVOCs contributed substantially to total VOC emissions in Tianjin (81.1%), Changsha (79.0%), Shanghai (67.7%), Luohe (60.9%), Xingtai (52.7%), Nanjing (47.7%), and Beijing (44.6%). In contrast, the Harbin-Changchun agglomeration, Guangzhou, and Tangshan showed relatively lower OVOC shares.
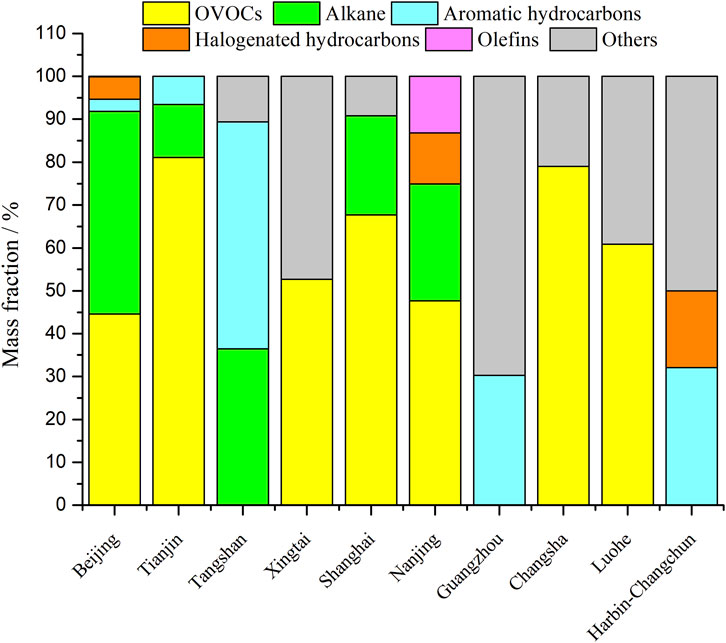
Figure 1. Comparison of VOC emission characteristics from the printing industry across different cities.
Notably, our analysis revealed systematic differences in VOC speciation between large-scale enterprises and small-to-medium enterprises (SMEs). SMEs tended to exhibit higher proportions of oxygenated VOCs (OVOCs), particularly isopropanol (increased by ∼15–25% compared to large enterprises), likely due to their continued reliance on traditional alcohol-based inks and less efficient emission control systems. In contrast, large enterprises showed faster adoption of water-based inks and more balanced VOC profiles, which aligns with their greater capital capacity for technology upgrades and stricter compliance with environmental regulations.
Multiple factors influence VOC emissions in the printing industry, including: environmental policies, raw material types (e.g., solvent-based versus water-based inks), production processes (e.g., compounding), and end-of-pipe control technologies. China’s printing industry has gradually substituted solvent-based inks with water-based alternatives in recent years, significantly transforming emission profiles. Based on our temporal analysis of the compiled data, this transition has been most pronounced since 2018, with accelerated adoption in the Yangtze River Delta and Pearl River Delta regions (reaching ∼60% water-based ink penetration by 2022), while northern industrial clusters like the Bohai Rim have shown slower transition rates (∼35% penetration by 2022) due to different regulatory timelines, industrial structures, and economic factors. This shift has resulted in emissions consisting mainly of OVOCs and alkanes, with a concurrent substantial reduction in aromatic hydrocarbons.
The five most abundant VOC species by emission concentration were ethanol, xylene, acetone, ethyl acetate, and isopropanol (Figure 2). Isopropanol originates mainly from binder thinners, while ethyl acetate is predominantly associated with solvent-based inks (Wang Q. et al., 2018; Zhang et al., 2020; Liang X. et al., 2023). Xylene primarily originates from diluents in solvent-based inks (Wang JD. et al., 2018), whereas acetone is emitted from both solvent-based inks and related products (Wei et al., 2022). Ethanol, commonly used as a thinner and essential raw material, is utilized in various manufacturing processes within the printing industry (You et al., 2023). The widespread use of alcohol-soluble inks likely explains the observed elevated concentrations of OVOCs.
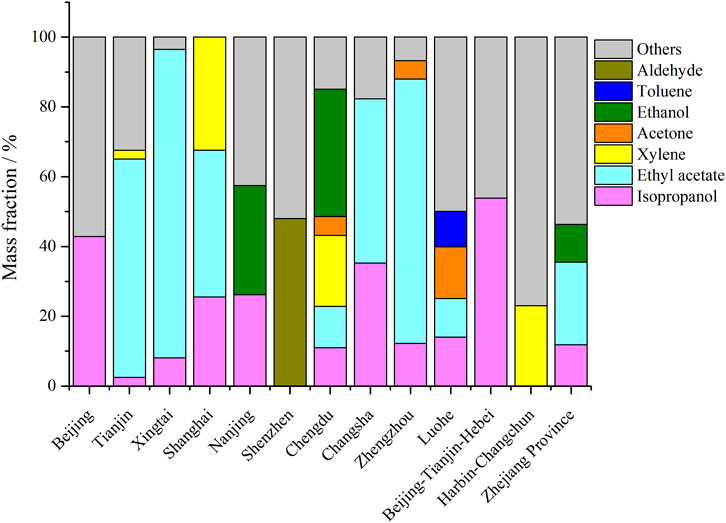
Figure 2. Major VOC species emitted by the printing industry across different cities.
3.2 Comparison of exhaust treatment techniques in various cities
Table 1 summarizes the end-of-pipe VOC treatment technologies adopted by the printing industry in the surveyed cities. Overall, exhaust gas collection efficiency remains suboptimal (generally ranges from 40% to 75%), indicating substantial potential for improvement. Some enterprises discharge exhaust gas directly without treatment. Although high-efficiency combustion technologies (e.g., regenerative thermal oxidizers, RTO) are available, granular activated carbon (GAC) adsorption and low-temperature plasma remain the most commonly employed technologies due to their lower capital costs, despite their relatively lower treatment efficiencies. Furthermore, although improved management practices show considerable potential for reducing VOC emissions, such measures have not been widely or effectively implemented (Table 1).
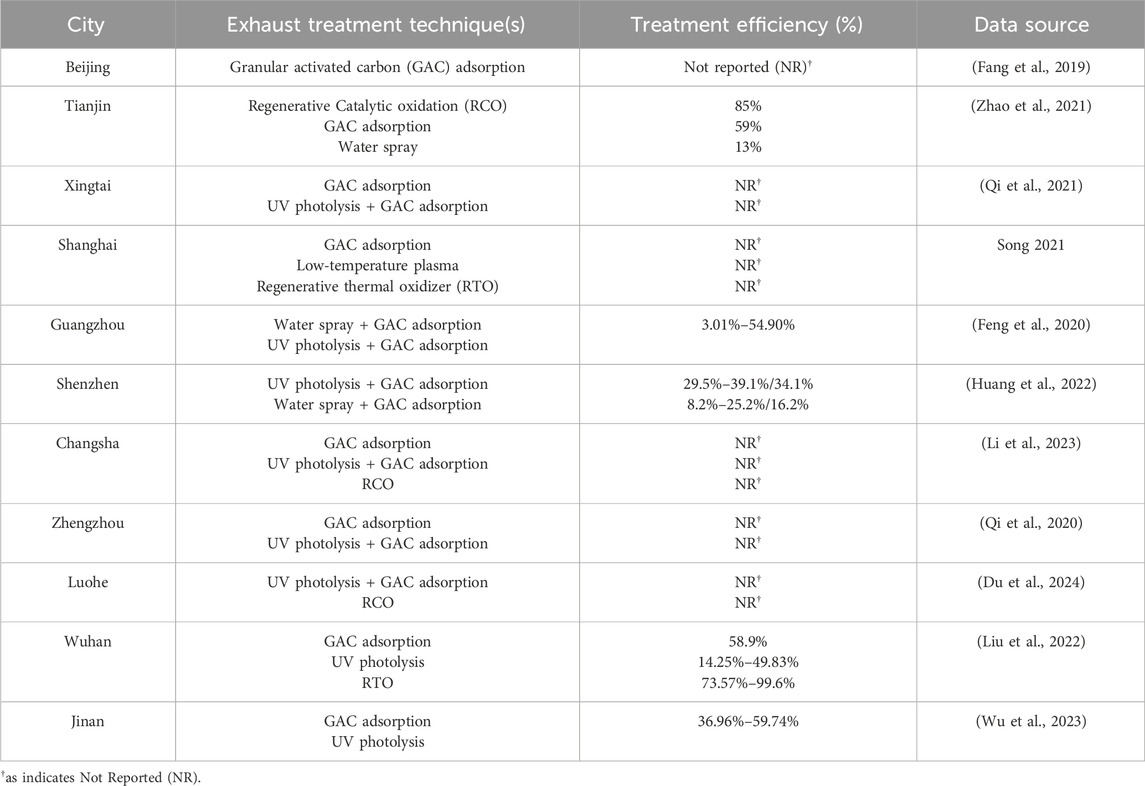
Table 1. Summary of exhaust treatment techniques and their efficiencies in the printing industry across surveyed cities.
For cities where treatment efficiency was reported as “Not Reported (NR)” in Table 1, this primarily reflects limitations in the original source studies, which often documented technology deployment without quantitative performance verification. Based on our integrated analysis of similar technologies across other cities and industry benchmarks, we estimate that GAC adsorption systems typically achieve 40%–75% efficiency, while combined systems (e.g., UV photolysis + GAC) range from 30% to 60%, depending on operational conditions, maintenance practices, and inlet concentrations. The widespread occurrence of unreported efficiency data highlights a critical data gap in current environmental management practices and underscores the need for standardized monitoring and reporting protocols.
A cross-city analysis revealed a discernible correlation between the stringency of local environmental regulations and the adoption of high-efficiency control technologies. Regions with early and stringent VOC control policies, particularly within the Beijing-Tianjin-Hebei cluster, demonstrated a higher penetration of advanced treatment technologies such as Regenerative Thermal Oxidizers (RTOs) and Regenerative Catalytic Oxidizers (RCOs). For instance, policy-driven initiatives in this region have been associated with an approximately 40% higher adoption rate of these high-efficiency systems compared to regions where regulatory enforcement was less consistent. This pattern underscores the critical role of robust and well-enforced policy frameworks in accelerating technological upgrades within the industry.
3.3 Comparison of OFP in various cities
Figure 3 shows the ozone formation potential (OFP) of VOCs emitted by the printing sector in the key Chinese cities included in this study. The OFP values exhibited a wide range of 78.5–643.5 mg m-3. Changsha showed the highest OFP (643.5 mg m-3), followed by the Beijing-Tianjin-Hebei region (505.5 mg m-3), Xingtai (160.0 mg m-3), Guangzhou (111.1 mg m-3), Zhengzhou (109.4 mg m-3), and Chengdu (78.5 mg m-3), respectively. OVOCs were the predominant contributors to total OFP, with isopropanol and ethyl acetate identified as the key species driving O3 formation. Both emission and OFP data identified isopropanol and ethyl acetate as the two most significant VOC species from the printing sector in the major Chinese cities studied. Therefore, implementing stricter control measures for these key species is essential.
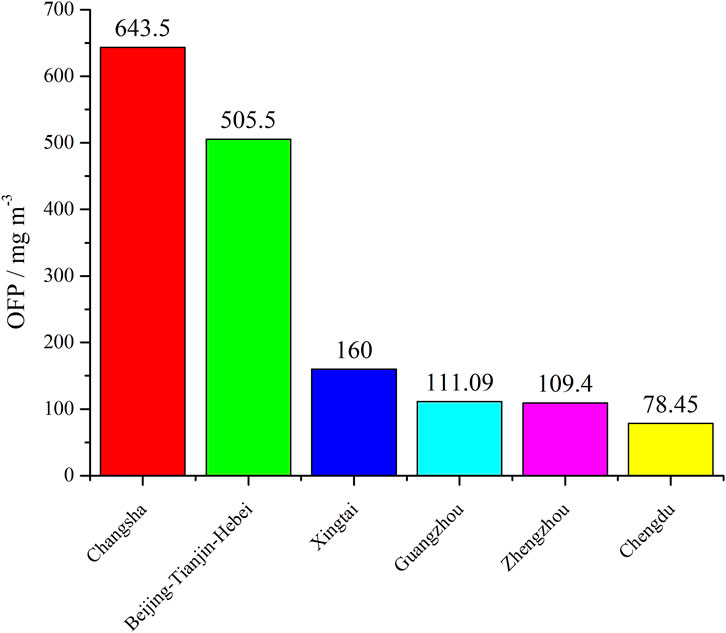
Figure 3. Comparison of total OFP of VOCs from the printing industry across different cities.
4 Conclusion
4.1 Limitations of the study
This study offers a valuable nationwide assessment; however, several limitations should be noted to properly contextualize the findings.
First, and most fundamentally, this analysis relies exclusively on secondary data sources. The accuracy and representativeness of our integrated profiles are contingent upon the methodological consistency and quality of the original source studies. Potential publication biases and heterogeneity in sampling and analytical methods across different studies may introduce uncertainties that are difficult to quantify fully.
Second, although the sampling strategy encompassed major industrial clusters, it was limited to 14 key cities. Consequently, the results may not fully represent the numerous small and medium-sized enterprises (SMEs) in smaller cities or rural areas that may use different technologies and exhibit varying regulatory compliance levels.
Third, sampling was conducted only during standard operational periods. Emissions from non-routine activities (e.g., startup, shutdown, or maintenance) were not captured, potentially leading to underestimation of total annual emissions.
Fourth, data on control technology efficiencies were primarily obtained from literature sources. These values may not accurately reflect real-world long-term performance across all facilities due to factors including operational maintenance, system aging, and specific operational conditions.
Finally, OFP calculations relied on the MIR method. Although this is a standard and widely adopted approach, it is based on specific chemical mechanisms and environmental conditions (i.e., NOx-rich environments) that may vary spatially and temporally across China.
4.2 Conclusions and policy implications
This study provides the first integrated nationwide analysis of VOC emission characteristics and ozone formation potential (OFP) from China’s printing industry, encompassing major regional hubs.
1. Dominance of OVOCs and Key Species: We identified a significant shift in emission profiles, where OVOCs became the predominant component (44.6%–81.1%), largely due to the replacement of aromatic-rich solvent-based inks with water-based and alcohol-soluble alternatives. Isopropanol and ethyl acetate were the two dominant OVOC species. More importantly, VOCs from these alternatives possess higher chemical reactivity and undergo oxidation more readily, making them key drivers of both total mass emissions and OFP. This trend necessitates a policy reorientation from controlling aromatic hydrocarbons to targeting these highly reactive OVOCs, particularly isopropanol and ethyl acetate.
2. Significant Regional Variability: Emission profiles and OFP values showed substantial intercity variations, primarily due to regional differences in: raw materials (e.g., predominant use of solvent-based inks in Tianjin versus water-based inks in Beijing), printing processes (e.g., high-OFP gravure printing in Changsha), and stringency of local regulatory enforcement. This underscores the need for region-specific control strategies rather than uniform national policies.
3. Technological Gaps in Pollution Control: Significant technological gaps exist in end-of-pipe treatment. Most enterprises relied on less efficient technologies like GAC adsorption (typical efficiency: 40%–75%), often paired with suboptimal collection systems (<80% efficiency). In contrast, RTOs demonstrated superior performance with efficiencies exceeding 90%. However, China’s Double-Carbon Policy, combined with high investment and operational costs, has significantly hindered the widespread adoption of this technology. This highlights the urgent need for technological upgrades in the industry.
4. Integrated Policy Recommendations: We propose an integrated strategy to mitigate the printing industry’s environmental impact:
Source Control: Mandate water-based inks and low-VOC formulations for high-emission processes such as gravure and packaging printing.
End-of-Pipe Enhancement: Enforce stricter emission standards and promote advanced treatment technologies through subsidies or incentives, requiring integration with high-efficiency collection systems (>80%).
Monitoring and Enforcement: Establish real-time VOC monitoring networks in industrial clusters to ensure compliance and enable data-driven policy improvements.
This analysis establishes a scientific basis for developing effective and targeted VOC control strategies for China’s crucial printing industry. The methodology and policy framework developed here emphasize source-specific emission profiling, technology assessment, and regionally differentiated management. This approach offers a transferable model for other developing countries facing similar challenges in balancing industrial growth with atmospheric environmental protection. These findings highlight the importance of integrating detailed sectoral studies into national and regional air quality management plans, achieving co-benefits for climate, health, and economic sustainability.
Data availability statement
The original contributions presented in the study are included in the article/Supplementary Material, further inquiries can be directed to the corresponding author.
Author contributions
JZ: Resources, Conceptualization, Formal Analysis, Writing – original draft, Project administration, Software, Funding acquisition, Methodology, Validation, Data curation, Investigation, Writing – review and editing.
Funding
The authors declare that financial support was received for the research and/or publication of this article. The Natural Science Foundation of Gansu Province of China [22JR5RE1041] (cross-regional collaborative project); Initial Scientific Research Fund for High-level Talents at Shanghai Publishing and Printing College [2024RCKY27]; Open Fund of the Key Laboratory of Intelligent and Green Flexographic Printing [2024ZDSYS005].
Acknowledgements
The funders had no role in the study design, data collection and analysis, decision to publish, or manuscript preparation.
Conflict of interest
The author declares that the research was conducted in the absence of any commercial or financial relationships that could be construed as a potential conflict of interest.
Generative AI statement
The authors declare that no Generative AI was used in the creation of this manuscript.
Any alternative text (alt text) provided alongside figures in this article has been generated by Frontiers with the support of artificial intelligence and reasonable efforts have been made to ensure accuracy, including review by the authors wherever possible. If you identify any issues, please contact us.
Publisher’s note
All claims expressed in this article are solely those of the authors and do not necessarily represent those of their affiliated organizations, or those of the publisher, the editors and the reviewers. Any product that may be evaluated in this article, or claim that may be made by its manufacturer, is not guaranteed or endorsed by the publisher.
Supplementary material
The Supplementary Material for this article can be found online at: https://www.frontiersin.org/articles/10.3389/fenvs.2025.1726541/full#supplementary-material
References
Bao, Y. S., Wang, B., Deng, Y., and Zhou, Z. H. (2020). Source profiles and ozone formation potential of VOCs emitted from typical industries using organic solvents in chengdu. Acta Scien Circum 40 (1), 76–82. doi:10.13671/j.hjkxxb.2019.0300
Cai, Z. P., and Cai, H. H. (2013). Study on characteristics of VOCs emission from printing industry. Environ. Sci. Manage 38 (8), 166–172.
Carter, W. P. L. (1994). Development of ozone reactivity scales for volatile organic compounds. J. Air Waste Manage Assoc. 44 (7), 881–899. doi:10.1080/1073161x.1994.10467290
Carter, W. P. L. (2010). Development of a condensed SAPRC–07 chemical mechanism. Atmos. Environ. 44 (40), 5336–5345. doi:10.1016/j.atmosenv.2010.01.024
Chen, S., Wang, H., Lu, K., Zeng, L., Hu, M., and Zhang, Y. (2020). The trend of surface ozone in beijing from 2013 to 2019: indications of the persisting strong atmospheric oxidation capacity. Atmos. Environ. 242, 117801. doi:10.1016/j.atmosenv.2020.117801
Du, Y. B., Wu, L. P., Niu, D. W., Leng, H. B., Xue, S., Zhang, N., et al. (2024). Source profiles and impact of volatile organic compounds in typical industries in luohe City. Environ. Sci. 45 (8), 4484–4492. doi:10.13227/j.hjkx.202308177
Fang, L., Liu, W. W., Chen, D. N., Li, G. H., Wang, D., Shao, X., et al. (2019). Source profiles of volatile organic compounds (VOCs) from typical solvent based industries in beijing. Environ. Sci. 40 (10), 4395–4403. doi:10.13227/j.hjkx.201901128
Feng, Y., Liu, R. Y., Liu, L. L., Lu, S. W., Huang, H. M., Fan, L. Y., et al. (2020). VOCs emission characteristics, environmental impact and health risk assessment of typical printing enterprises in guangzhou. China Enviro Sci. 40 (9), 3791–3800. doi:10.19674/j.cnki.issn1000-6923.2020.0424
Huang, J. L., Qiu, X. Y., Cheng, Y. J., and Wu, J. H. (2022). Emission characteristics, treatment status and mitigation countermeasures of volatile organic compounds from typical solvent sources in shenzhen city. J. Environ. Eng. Technol. 12 (5), 1609–1617. doi:10.12153/j.issn.1674-991X.20210292
Lewis, A. C., Hopkins, J. R., Carslaw, D. C., Hamilton, J. F., Nelson, B. S., Stewart, G., et al. (2020). An increasing role for solvent emissions and implications for future measurements of volatile organic compounds. Philos. Trans. Ser. A Math. Phys. Eng. Sci. 378 (2183), 20190328. doi:10.1098/rsta.2019.0328
Li, Q. Y., Li, S., Wang, L., Xu, B., You, X. Y., Dai, C. H., et al. (2023). Source profile of organized volatile organic compounds from automobile manufacturing and packaging and printing enterprises in Changsha. Environ. Pollut. Contr 45 (8), 1132–1137. doi:10.15985/j.cnki.1001-3865.2023.08.015
Liang, X. M., Chen, X. F., Zhang, J. N., Shi, T. L., Sun, X. B., Fan, L. Y., et al. (2017). Reactivity–based industrial volatile organic compounds emission inventory and its implications for ozone control strategies in China. Atmos. Environ. 162, 115–126. doi:10.1016/j.atmosenv.2017.04.036
Liang, X. M., Sun, X. B., Xu, J. T., Ye, D. Q., and Chen, L. G. (2020a). Industrial Volatile organic compounds (VOCs) emission inventory in China. Environ. Sci. 41 (11), 4767–4775. doi:10.13227/j.hjkx.202004163
Liang, X. M., Sun, X., Xu, J., and Ye, D. Q. (2020b). Improved emissions inventory and VOCs speciation for industrial OFP estimation in China. Sci. Total Environ. 745, 140838. doi:10.1016/j.scitotenv.2020.140838
Liang, X. M., Wu, P. Z., Chen, L. G., Liu, M., Lu, Q., Zhu, L. H., et al. (2023a). Emission trends and reduction potential of VOCs from printing industry in China. Environ. Sci. 44 (11), 5915–5923. doi:10.13227/j.hjkx.202212099
Liang, X., Chen, L., Liu, M., Lu, H., Lu, Q., Gao, B., et al. (2023b). Improved emission factors and speciation to characterize VOC emissions in the printing industry in China. Sci. Total Environ. 866, 161295. doi:10.1016/j.scitotenv.2022.161295
Lin, Z., Huang, Z., and Chen, Y. (2018). Research progress of atmospheric volatile organic compounds-A case study of printing Industry. Meteorol. Environ. Res. 9 (4), 94–99.
Liu, W. W., Fang, L., Guo, X. R., Nie, L., and Wang, M. Y. (2019). Emission characteristics and ozone Formation potential of VOCs in printing enterprises in beijing–tianjin–hebei. Environ. Sci. 40 (9), 3942–3948. doi:10.13227/j.hjkx.201901043
Liu, H., Huang, Y., Zhou, J. R., Qiu, P. P., and Duan, Y. X. (2022). Measurement and analysis of VOC treatment efficiency in key industries in Wuhan. J. Gre Sci. Technol. 24 (08), 214–218. doi:10.16663/j.cnki.lskj.2022.08.045
National Press and Publication Administration. (2023). 2023 China printing industry innovation development conference.
Qi, Y. J., Ni, J. W., Zhao, D. X., Yang, Y., Han, L. Y., and Li, B. W. (2020). Emission characteristics and risk assessment of volatile organic compounds from typical factories in Zhengzhou. Environ. Sci. 41 (7), 3056–3065. doi:10.13227/j.hjkx.201911106
Qi, Y. J., Ni, J. W., Zhao, D. X., Zhang, N., Ji, T. T., and Gong, S. L. (2021). Emission characteristics of volatile organic compounds (VOCs) from typical industrial sectors in Xingtai city. Res. Environ. Sci. 34 (10), 2339–2349. doi:10.13198/j.issn.1001-6929.2021.06.23
Shang, Y. J. (2023). Source analysis and emission assessment of atmospheric volatile organic compounds in harbin–changchun urban agglomerations. Beijing: University of Chinese Academy of Sciences.
Song, M. L. (2021). VOCs emission characteristics of typical printing companies and comprehensive benefit evaluation of control technology. Shanghai: East China University of Science and Technology.
Song, M. L., Tang, W. T., Zhang, W., Song, J., Shen, X. B., and Xiu, G. L. (2022). Determination of fugitive emission characteristics of volatile organic compounds in printing process. Environ. Pollut. Control 44 (2), 225–229. doi:10.15985/j.cnki.1001-3865.2022.02.014
Tian, L., Wei, W., Cheng, S. Y., Li, G. H., and Wang, G. (2017). Source profiles and ozone formation potential of volatile organic compounds from the use of solvents in typical industry. J. Saf. Environ. 17 (1), 314–320. doi:10.13637/j.issn.1009-6094.2017.01.060
Volkamer, R., Jimenez, J. L., San Martini, F., Dzepina, K., Zhang, Q., Salcedo, D., et al. (2006). Secondary organic aerosol formation from anthropogenic air pollution: rapid and higher than expected. Geophys Res. Lett. 33 (17). doi:10.1029/2006gl026899
Wang, J. D., Lü, J. Z., Li, W. J., Gu, Z. Y., and Miao, X. P. (2018a). Pollution characteristics and emission coefficients of volatile organic compounds from the packaging and printing industry in Zhejiang province. Environ. Sci. 39 (8), 3552–3556. doi:10.13227/j.hjkx.201711187
Wang, J. N., Lei, Y., and Ning, M. (2018b). Chinese model for improving air quality: an assessment of action plan of air pollution prevention and control. Environ. Prot. 46 (2), 7–11. doi:10.14026/j.cnki.0253-9705.2018.02.001
Wang, Q., Li, S., Dong, M., Li, W., Gao, X., Ye, R., et al. (2018c). VOCs emission characteristics and priority control analysis based on VOCs emission inventories and ozone formation potentials in Zhoushan. Atmos. Environ. 182, 234–241. doi:10.1016/j.atmosenv.2018.03.034
Wei, X. Z., Zhao, Y. H., Zhao, B., and Wang, X. (2022). Emission characteristics of VOCs from the typical printing industry and control performance by pollution prevention facilities. Energy Environ. Prot. 36 (4), 91–98.
Wu, R., and Xie, S. (2017). Spatial distribution of ozone formation in China derived from emissions of speciated volatile organic compounds. Environ. Sci. Technol. 51 (5), 2574–2583. doi:10.1021/acs.est.6b03634
Wu, R., and Xie, S. (2018). Spatial distribution of secondary organic aerosol formation potential in China derived from speciated anthropogenic volatile organic compound emissions. Environ. Sci. Technol. 52 (15), 8146–8156. doi:10.1021/acs.est.8b01269
Wu, K. Y., Duan, M., Zhou, J. B., Zhou, Z. H., Tan, Q. W., Song, D. L., et al. (2020). Sources profiles of anthropogenic volatile organic compounds from typical solvent used in Chengdu, China. J. Environ. Eng. 146 (7), 05020006. doi:10.1061/(asce)ee.1943-7870.0001739
Wu, W. L., Shan, C. Y., Zhao, J. L., and Cui, Y. N. (2023). Analysis of VOCs emission characteristics and emission reduction potential of typical industries in Jinan, China. Environ. Sci. 44 (11), 5924–5932. doi:10.13227/j.hjkx.202212035
Xie, Y. S., Zhent, X. M., and Liu, C. L. (2018). Source profiles and ozone Formation potental of volatile organic compounds from printing industry in Nanjing. Environ. Sci. Technol. 31 (5), 64–67.
Yan, G., Xue, W. B., Lei, Y., Ning, M., Wu, W. L., and Liu, W. (2020). Situation and control measures of ozone pollution in China. Environ. Prot. 48 (15), 15–19. doi:10.14026/j.cnki.0253-9705.2020.15.003
You, G. Y., Liu, H. F., Sun, R., Jin, Z. X., Li, J., Zhou, X. L., et al. (2023). Characterizing VOCs emissions of five packaging and printing enterprises in China and the emission reduction potential of this industry. J. Clean. Prod. 420, 138445. doi:10.1016/j.jclepro.2023.138445
Zhang, Y., Li, C., Yan, Q., Han, S., Zhao, Q., Yang, L., et al. (2020). Typical industrial sector–based volatile organic compounds source profiles and ozone formation potentials in Zhengzhou, China. Atmos. Pollut. Res. 11 (5), 841–850. doi:10.1016/j.apr.2020.01.012
Zhang, Y., Xue, L., Carter, W. P. L., Pei, C., Chen, T., Mu, J., et al. (2021). Development of ozone reactivity scales for volatile organic compounds in a Chinese megacity. Atmos. Chem. Phys. 21 (14), 11053–11068. doi:10.5194/acp-21-11053-2021
Zhao, J. R., Yao, X. L., Sun, M., Xu, Y., Wang, S., Cao, D. X., et al. (2021). Emission characteristics of volatile organic compounds from typical solvent use industries in Tianjin. Environ. Pollut. Control 43 (5), 539–545. doi:10.15985/j.cnki.1001-3865.2021.05.002
Keywords: printing industry, VOC emissions, ozone formation potential (OFP), emission control, regulatory policy, China
Citation: Zhai J (2025) A nationwide assessment of VOC emissions and ozone formation potential from China’s printing industry: a meta-analysis. Front. Environ. Sci. 13:1726541. doi: 10.3389/fenvs.2025.1726541
Received: 16 October 2025; Accepted: 12 November 2025;
Published: 02 December 2025.
Edited by:
Pu Xia, University of Saskatchewan, CanadaReviewed by:
Haifeng Wen, University of Shanghai for Science and Technology, ChinaJun Shi, Tongji University, China
Copyright © 2025 Zhai. This is an open-access article distributed under the terms of the Creative Commons Attribution License (CC BY). The use, distribution or reproduction in other forums is permitted, provided the original author(s) and the copyright owner(s) are credited and that the original publication in this journal is cited, in accordance with accepted academic practice. No use, distribution or reproduction is permitted which does not comply with these terms.
*Correspondence: Jian Zhai, NTc0ODA3Njc4QHFxLmNvbQ==