Abstract
The Antarctic Peninsula is warming rapidly, with more frequent extreme temperature and precipitation events, reduced sea ice, glacier retreat, ice shelf collapse, and ecological shifts. Here, we review its behaviour under present-day climate, and low (SSP 1–2.6), medium-high (SSP 3–7.0) and very high (SSP 5–8.5) future emissions scenarios, corresponding to global temperature increases of 1.8 °C, 3.6 °C and 4.4 °C by 2100. Higher emissions will bring more days above 0 °C, increased liquid precipitation, ocean warming, and more intense extreme weather events such as ocean heat waves and atmospheric rivers. Surface melt on ice shelves will increase, depleting firn air content and promoting meltwater ponding. Under the highest emission scenario, collapse of the Larsen C and Wilkins ice shelves is likely by 2100 CE, and loss of sea ice and ice shelves around the Peninsula will exacerbate the current trends of land-ice mass loss. Collapse of George VI Ice Shelf by 2300 under SSP 5–8.5 would substantially increase sea level contributions. Under this very high emissions scenario, sea level contributions from the Peninsula could reach 7.5 ± 14.1 mm by 2100 CE and 116.3 ± 66.9 mm by 2300 CE. Conversely, under the lower emissions scenarios, the Antarctic Peninsula’s sea ice remains similar to present, and land ice is predicted to undergo only minor grounding line recession and thinning. Changes in sea surface temperatures and the change from snow to rain will impact marine and terrestrial biota, altering species richness and enhancing colonisation by non-native species. Ranges of key species such as krill and salps are likely to contract to the south, impacting their marine vertebrate predators. These changing conditions will also influence Antarctic Peninsula research, fisheries, tourism, infrastructure and logistics. The future of the Peninsula depends on the choices made today. Limiting temperatures to below 2 °C, and as close as possible to 1.5 °C (by following the SSP 1–1.9 or 1–2.6 scenarios), combined with effective governance, will result in increased resilience and relatively modest changes. Any higher emissions scenarios will damage pristine systems, cause sustained, irreversible ice loss on human timescales, and spread to Antarctic regions beyond the Peninsula.
Introduction
The Antarctic Peninsula and fringing ocean form a small percentage of Antarctica (Figure 1) but gain a disproportionately large amount of attention from fisheries, tourism and scientific research. Its marine and terrestrial climates are also atypical of the rest of Antarctica and, while past changes have been exceptionally rapid, its future trajectory will critically depend on interactions among oceanic, atmospheric, and cryospheric signals, affecting sea level, sea ice, circulation, and ecosystems. Geographically, these impacts can spread beyond the Peninsula region, through oceanic and atmospheric connections and circulation changes. They have significant implications for science, operations and policy. With declining sea ice, the Peninsula will be able to support longer operating seasons and this, in turn, will stress-test ship-based access and logistical support (UK Government, 2025). National science and environmental protection and management programmes will likewise need to anticipate and adapt to a rapidly changing operational environment.
FIGURE 1

Main map: The Antarctic Peninsula, showing locations named in the text. The extent of the Antarctic Peninsula is defined by the northern, eastern and western Peninsula drainage basins from IMBIE (Rignot et al., 2011). Topography and bathymetry from Bedmap 3 (Pritchard et al., 2025), with rock outcrops and coastlines from the Antarctic Digital Database (Antarctic Digital Database, High Resolution Coastline vector Polygons of Antarctic coastline, v. 7.10). Ice shelves denoted by hatching. Fronts of the Antarctic Circumpolar Current (ACC) after Orsi et al. (1995). The Antarctic Circumpolar Current is defined by the Subantarctic Front to the north and the Southern Antarctic Circumpolar Current (SACCF) to the south. Inset shows the broader fronts associated with the Antarctic Circumpolar Current (after Orsi et al., 1995).
The behaviour and evolution of the Antarctic Peninsula, and the impacts of these changes, will occur over different time scales and at different rates depending largely on the emissions scenarios that play out over the coming years and decades. Its component systems will respond at different rates, for example, with atmosphere and sea ice responding rapidly, and land ice (grounded freshwater ice, excluding floating ice) responding more slowly. Siegert et al. (2019) explained how the Antarctic Peninsula would be affected by a low emissions future, with a global increase in temperature of 1.5 °C above pre-industrial levels. Here, we advance that work by concisely reviewing the current and projected future behaviour of the Antarctic Peninsula system to the year 2100 CE and beyond under different three global warming scenarios: a sustainable pathway, resulting in a low-emissions future (SSP 1–2.6), a pathway characterised by regional rivalry and resurging nationalism, resulting in a mid-to high-emissions future (SSP 3–7.0), and a pathway driven by aggressive fossil-fuel development with ineffective control policy, resulting in a very high emissions future (SSP 5–8.5) (Riahi et al., 2017). We compile data from multiple sources, including new analysis of observational data, archived CMIP6 and ISMIP6 (Eyring et al., 2016; Seroussi et al., 2020) model outputs across specific SSPs, and the published literature. Choices made this decade will determine which trajectory is followed, and will have long-term and likely irreversible (on human timescales) impacts in one of the fastest warming regions of the planet.
Study region: the Antarctic Peninsula
The Antarctic Peninsula is a spine of Alpine-style mountains with glaciers mostly terminating in the ocean, in seasonal or landfast sea ice, or in ice shelves (Figures 1, 2), arcing north from the continent towards the Drake Passage. The mainland Peninsula reaches 63°S in its northernmost sector and continues as a predominantly undersea chain through the Scotia Arc, including the heavily glacierised archipelagos of the South Shetland and South Orkney Islands, the volcanic South Sandwich Islands, and the sub-Antarctic island of South Georgia (Figure 1). The Peninsula separates the Weddell Sea in the east, from the Bellingshausen Sea around the southwestern Peninsula and Alexander Island. The 1300 km long Peninsula is bounded by Cape Adams adjacent to the Ronne Ice Shelf at 75°S in the south-easternmost sector, and the southerly margin of the George VI drainage basin in the west (Downie and Fretwell, 2007; Rignot et al., 2011; IMBIE; Figure 1). It is up to 70 km wide in Graham Land, increasing to >300 km wide south of Alexander Island in Palmer Land, and has mountains reaching >2000 m above sea level. The northern, western, and eastern drainage basins of the mainland Peninsula (Figure 1) together cover 231,847 km2 and are almost entirely (98.6%) ice-covered (Table 1). In total, the Antarctic Peninsula glaciers contain 131 ± 8 × 10³ km3 of grounded land ice, equating to 0.27 ± 0.02 m sea level equivalent (Morlighem et al., 2020). Much of the land ice, only a few hundred metres thick (Shahateet et al., 2025; Pritchard et al., 2025), is grounded above sea level, except near the glacier termini. The exception is the Bellingshausen Sea area in the southern Peninsula, where ice is grounded below sea level. Around the Peninsula, floating land-fast sea ice (e.g., Figure 2A) and ice shelves help to buttress the glaciers and inhibit calving (Christie et al., 2022).
FIGURE 2
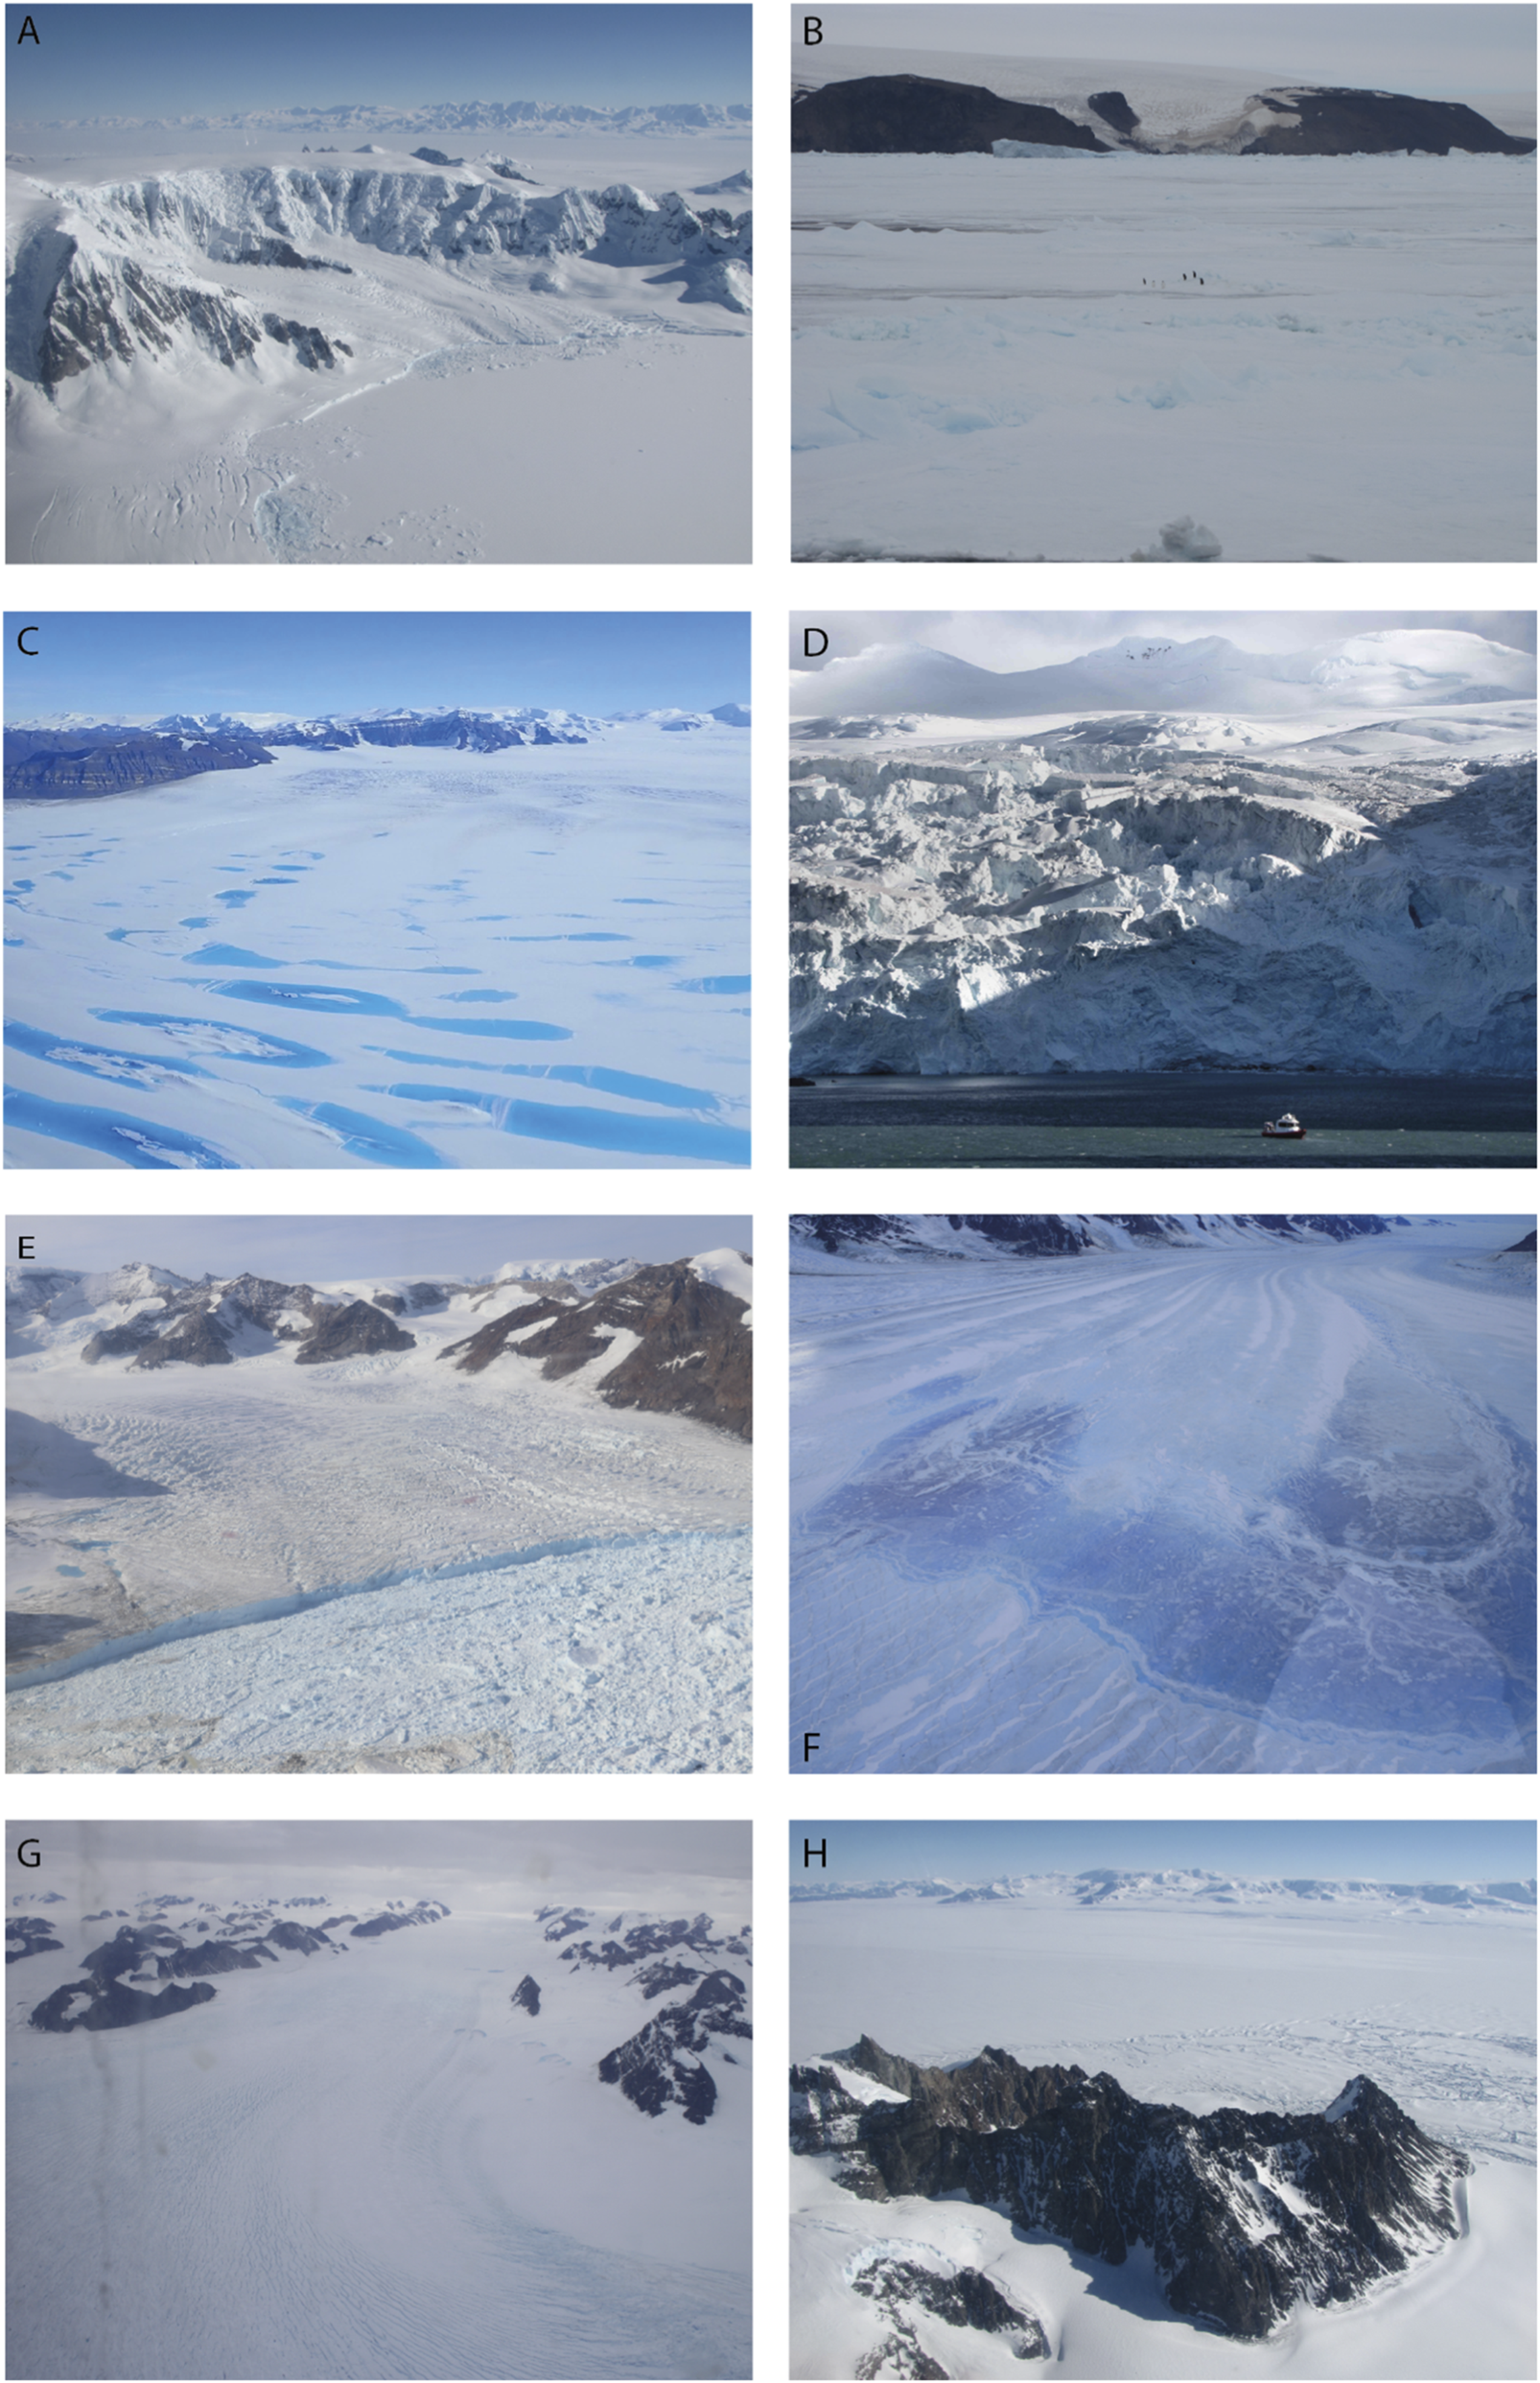
Examples of different parts of the Antarctic Peninsula land ice, sea ice and ice shelves. (A) Landfast sea ice in front of a small cirque glacier, Antarctic Peninsula, November 2012. Credit: Bethan Davies. (B) Sea ice, Fridtjof Sound, northern Antarctic Peninsula, January 2012. Credit: Bethan Davies. (C) Supraglacial lakes during a high melt season on George VI Ice Shelf, January 2020. Credit: Thomas Simons. (D) Marine terminating glacier, grounded, Point Wild, Elephant Island, Antarctic Peninsula, January 2012. Credit: Bethan Davies. (E) Greatly retreated Hektoria Glacier, 26th February 2024, with small surface ponds to the left (south). Credit: Ted Scambos. (F) Large supraglacial lake, refreezing, on central Crane Glacier looking downstream, 17th April 2013. Credit: Ted Scambos. (G) Flask Glacier, looking upstream from SCAR inlet, 3 February 2016. Credit: Ted Scambos. (H) Alexander Island (foreground), George VI Ice Shelf (central) and the Antarctic Peninsula mainland (distance), November 2012. Credit: Bethan Davies.
TABLE 1
| Place | Total area (km2) | Ice-free area (km2) | % Ice covered |
|---|---|---|---|
| Main Peninsula, IMBIE drainage basins (north, west, east) | 231,847 | 3,347 | 98.6 |
| All Peninsula Islands (including Alexander Island) | 79,613 | 6172 | 92.2 |
| South Shetlands archipelago, including Elephant Island | 3,450 | 369 | 89.3 |
| South Orkneys archipelago | 551 | 91 | 83.5 |
| Total areas | |||
| Antarctic Peninsula (including archipelagos, islands and mainland) | 315,461 | 9,979 | 96.8 |
| Antarctic Peninsula ice shelves | 112,057 | 0 | 100.0 |
Total area and ice-free area of different elements of the Antarctic Peninsula region. Calculations of area, % ice cover and ice volume use the coastline and rock cover from the Antarctic Digital Database (Antarctic Digital Database v7.10, 12 November 2024), and ice divides and drainage basins from Rignot et al. (2011).
The largest of the Peninsula ice shelves are the Larsen C and George VI ice shelves, on the eastern and western Peninsula respectively (Figures 1, 2). Surrounding the mainland Peninsula are several large islands, including Alexander Island, Adelaide Island and James Ross Island, which together are 92.2% ice covered. North of the mainland Antarctic Peninsula are the archipelagoes of the South Shetland and South Orkney Islands (Table 1), the former separated from the mainland northern Peninsula by the Bransfield Strait (Figure 1). The South Shetland and South Orkney islands have slightly less ice cover than the mainland (Table 1).
The climate of the Peninsula depends strongly on the Antarctic Circumpolar Current (ACC), which flows through the narrow (800 km) Drake Passage separating it from southern South America (Orsi et al., 1995; Meredith et al., 2017; Figure 1). This brings a warmer climate to the western Peninsula, and a cooler, continental climate with more sea ice to the eastern Peninsula (Downie and Fretwell, 2007). The main driver of the ACC is the strong belt of westerly winds, associated with the passage of cyclones, that dominate the circulation around Antarctica. These relatively warm and moist winds further contribute to the warm and wet conditions of the western side of the Peninsula, but are often not strong enough to pass over the high mountain barrier of the Peninsula and influence its eastern side, further accentuating the different climates between its west and east sides (Orr et al., 2004; Orr et al., 2008). The position and strength of these winds are strongly reflected in the polarity of the Southern Annular Mode (SAM), which is the principal mode of atmospheric variability in the extratropical Southern Hemisphere, reflecting the zonal-pressure differences between Antarctica and the southern mid-latitudes (Marshall, 2003). A positive SAM generally corresponds to stronger, poleward-shifted westerlies, resulting in enhanced amounts of warm, moist air and associated orographic precipitation along the western side of the Peninsula (Orr et al., 2004), as well as reduced amounts of sea ice (Meredith and King, 2005). Recent positive trends in the SAM, especially pronounced in austral summer and autumn, have been linked to greenhouse gas increases and especially ozone depletion (Fogt and Marshall, 2020).
Future global warming scenarios
Scenarios are tools that allow analysts to explore internally consistent projections of a set of societal evolutions (Meinshausen et al., 2020). They are the result of ‘what-if’ exercises and can be used to explore the implications of policy decisions on greenhouse gas emissions, or alternatively, the consequences of delayed or failed action. In the context of this review, we consider three scenarios, which are referred to by their scientific labels of SSP 1–2.6 (low emissions), SSP 3–7.0 (medium-high emissions), and SSP 5–8.5 (very high emissions). These scenarios are derived from the shared socioeconomic pathway (SSP) literature (O’Neill et al., 2017; Riahi et al., 2017). Their labels indicate the overarching socioeconomic development on which the scenarios were based as captured in the underlying SSP narratives. The SSP narratives are numbered from SSP1 to SSP5, with SSP1 representing an inclusive, environmentally conscious world in which inequalities are reduced, SSP2 a ‘middle of the road’ future, SSP3 a world with resurging nationalism, protectionism and increasing inequalities, and SSP5 a socioeconomic future with high economic growth but strong dependence on fossil fuels and technology. The second part of the SSP label denotes the scenario’s associated level of radiative forcing (in W/m2) by the year 2100 CE, which reflects the degree of climate mitigation achieved under that pathway.
SSP 1–2.6 is a scenario that describes limiting warming over the course of the 21st century to 2 °C above preindustrial (Riahi et al., 2017), with radiative forcing reaching around +2.6 W/m2 at 2100 CE. Lower SSP-based scenarios have been developed that explore limiting warming to 1.5 °C by the end of the century, but all of them have a substantial probability that 1.5 °C will be exceeded (Rogelj et al., 2018). The best estimate for global warming under SSP 1–2.6 for the 2 decades 2081–2100 is 1.8 °C (very likely range 1.3 °C–2.4 °C) relative to the preindustrial level (1850–1900 CE) (IPCC, 2021) (Table 2).
TABLE 2
| Scenario | 2021–2040 CE | 2081–2100 CE | ||
|---|---|---|---|---|
| Best estimate | Very likely (>90%) range | Best estimate | Very likely (>90%) range | |
| SSP 1–2.6 | 1.5 | 1.2–1.8 | 1.8 | 1.3–2.4 |
| SSP 3–7.0 | 1.5 | 1.2–1.8 | 3.6 | 2.8–4.6 |
| SSP 5–8.5 | 1.6 | 1.3–1.9 | 4.4 | 3.3–5.7 |
Global mean temperature changes under SSP-based scenarios taken from the Summary for Policymakers of the Working Group 1 Contribution to the IPCC Sixth Assessment Report (IPCC, 2021). All values in °C relative to preindustrial levels (1850–1900 CE).
SSP 3–7.0 and SSP 5–8.5 are both baseline scenarios that assume no new climate actions will be implemented beyond those that were in place in 2010. For SSP 3–7.0, the best estimate for global mean temperatures is 3.6 °C (2.8 °C–4.6 °C very likely range) relative to the preindustrial level, with radiative forcing reaching around +7.0 W/m2 at 2100. For SSP 5–8.5, the best estimate for global mean temperature change is 4.4 °C (3.3 °C–5.7 °C very likely range) relative to the preindustrial level (IPCC, 2021) (Table 2), with radiative forcing reaching +8.5 W/m2 at 2100 CE.
In contrast to these scenarios, based on current policies the United Nations Environment Programme (2025) projects a 66% change that warming is kept below 2.8 °C (range 2.1 °C–3.9 °C) this century. We are on track to surpass 1.5 °C of warming above pre-industrial temperatures within the next decade, and current policies have a 0% chance of remaining below 1.5 °C. The same report’s most optimistic case, in which all current pledges and long-term net-zero targets are achieved, projects a 66% change that warming is kept to 1.9 °C (range 1.8 °C–2.3 °C) (Rogelj et al., 2024).
Below, we summarise the state-of-the-art of knowledge and observations ofglacier of the former Larsen B Ice the Antarctic Peninsula today, and predictions under these different global warming scenarios, and consider implications for operations and management.
Changes in the Antarctic Peninsula today and under three different futures
Atmosphere
Atmospheric conditions and temperatures are a first order control on environmental systems across the Peninsula, impacting cryospheric processes and ecosystem environments (Carrasco et al., 2021). The Antarctic Peninsula has been warming since at least the 1950s, when most regional instrumental records began (e.g., Turner et al., 2020). However, an earlier starting record, at Orcadas Station in the South Orkney Islands, demonstrates a warming beginning in the 1930s (Zitto et al., 2015), while a proxy temperature record from an ice core from James Ross Island suggests a sustained warming began ∼600 years ago (Mulvaney et al., 2012). Based on a quality controlled meteorological dataset of monthly and hourly data from year-around stations (http://legacy.bas.ac.uk/met/READER/; Turner et al., 2004; Carrasco et al., 2021), Vernadsky Station, on the west coast of the mainland Peninsula has seen the largest warming, by 0.45 °C ± 0.19 °C per decade (or 3.26 °C ± 1.40 °C over 73 years) during 1951–2024, with the temperature increase in winter twice this rate, predominantly driven by sea ice loss in the Bellingshausen Sea (Turner et al., 2020).
The warming at meteorological stations in the north-east Peninsula is smaller, but nevertheless still significant: for example, Esperanza Station warmed by 0.31 °C ± 0.11 °C per decade between 1946 and 2024 CE (or 2.43 °C ± 0.83 °C over 78 years), and this area has also seen a marked increase in extreme temperatures, as discussed later. A shorter-term cooling trend was also evident in the Peninsula region from 1999 to 2016 CE, particularly in austral summer, consistent with the region’s large natural variability and the influence of the tropics (Turner et al., 2016).
Some of the warming has been due to a positive trend in the SAM during summer, in response to the Antarctic ozone hole, which began to develop from the mid-20th century onwards (Thompson and Solomon, 2002; Polvani et al., 2011). This caused summer westerlies to strengthen over the Peninsula, resulting in increased maritime air on the western side, and contributing to the warming trend here (Orr et al., 2004). The strengthened winds also resulted in increased deflection of the flow over the Peninsula and the enhanced transport of relatively warm air masses to its eastern side, which is further enhanced by the formation of warm foehn winds (Marshall et al., 2006; Orr et al., 2008). The recent warming has coincided with marked increases in regional precipitation on the windward side of the Peninsula (e.g., Goodwin et al., 2016; Medley and Thomas, 2019).
The rapid Antarctic Peninsula warming described above can be compared with the globally averaged warming of 1.34 °C–1.41 °C for the years 2014–2025 relative to 1850–1900 CE (World Meteorological Organisation, 2025). Globally, the average trend since the late 1970s has been 0.2 °C per decade (The Copernicus Programme, 2025), indicating that the warming of the Antarctic Peninsula is occurring at a faster rate than the global average, particularly on the northern Antarctic Peninsula and Scotia Arc archipelagos.
Alongside this background of multi-decadal period of warming, the Antarctic Peninsula currently experiences extreme warm-temperature events that can last for a few days and cause surface melting of snow and ice (Orr et al., 2023), which have been linked to atmospheric rivers and localised foehn-induced warming, especially when they occur in combination (King et al., 2017a; King et al., 2017b; Gorodetskaya et al., 2023; Lu et al., 2023; Bozkurt et al., 2024; Gilbert et al., 2025). This warming has been accompanied by reduced sea ice extent (Gilbert and Holmes, 2024), increased surface melt (Gorodetskaya et al., 2023) and increased upwelling of warm mid-depth currents such as Circumpolar Deep Water. Antarctica, like other regions of the world, is now subject to extreme climate and weather alongside global heating and disruption to natural systems (Siegert et al., 2023).
To explore future climate, we calculate the multi-model mean of an ensemble of CMIP6 models (listed in Supplementary Table S1) to provide projections of atmospheric variables over the Peninsula (delineated in Supplementary Figure S1). Relative to 1850–1900 CE (to be in line with IPCC projections), this multi-model mean projects global near-surface (2-m height) temperature increases of 1.99 °C, 4.07 °C and 4.84 °C for the period 2081–2100 CE under SSP 1–2.6, SSP 3–7.0 and SSP 5–8.5, respectively. These values are not directly comparable with the IPCC best estimates given in Table 2 which are based on both model and observational evidence but do fall well within the very likely range.
The same multi-model mean projects a Peninsula near-surface temperature change of +2.3 °C, +5.2 °C and +6.1 °C for each scenario respectively for the decade 2090–2099 CE compared with pre-industrial (Table 4), showing enhanced warming across the Peninsula compared with the global mean. This is due to a series of feedbacks that amplify global warming, including changes in albedo, sea ice, and large scale circulation. These circulation changes bring mid-latitude air masses towards the Peninsula, and increase the regional foehn effect, warming the eastern Peninsula.
Comparing the end of the 21st Century (decade 2090–2099 CE) with the present period (2015–2024 CE), this multi-model mean predicts an annual mean increase in near-surface temperature over the Antarctic Peninsula domain that varies from 0.55 °C in SSP 1–2.6 °C–4.23 °C in SSP 5–8.5 (Tables 3, 4). The largest seasonal warming is in winter and the smallest in spring or summer, depending on the SSP. This would result in a longer summer melt season. Daily minimum near-surface temperature increases generally surpass those for daily maximum, with the difference exceeding 1 °C in spring and summer in SSP 5–8.5. The annual number of days across the Peninsula with mean temperatures greater than 0 °C increases in all season-SSP combinations other than spring-SSP 1–2.6. This annual count increases from 19.7 to 47.6 days in SSP 5–8.5, with, unsurprisingly, the largest proportional change in summer: under SSP 5–8.5 the proportion more than doubles from 13.8% to 30.5%.
TABLE 3
| a) | |||||
|---|---|---|---|---|---|
| Season | Variable | Present (2015–24) | Future change (2015–2024 compared with 2090–99) | ||
| SSP mean | SSP 1–2.6 | SSP 3–7.0 | SP 5–8.5 | ||
| Annual data | Daily near-surface temperature (°C) | −13.74 | +0.55 | +3.40 | +4.23 |
| Daily maximum temperature (°C) | −10.63 | +0.48 | +3.06 | +3.85 | |
| Daily minimum temperature (°C) | −17.14 | +0.51 | +3.88 | +4.82 | |
| Days greater than 0 °C | 19.68 | +1.55 | +18.99 | +28.40 | |
| Total precipitation (mm/day) | 1.91 | +0.03 | +0.44 | +0.55 | |
| Snow-fraction (%) | 83.31 | +1.06 | −3.65 | −5.29 | |
| b) | |||||
|---|---|---|---|---|---|
| Season | Variable | Present (2015–24) | Future change (2015–2024 compared with 2090–99) | ||
| SSP mean | SSP 1–2.6 | SSP 3–7.0 | SSP 5–8.5 | ||
| Autumn (March - April - May) data | Daily near-surface temperature (°C) | −14.19 | +0.85 | +3.96 | +5.09 |
| Daily maximum temperature (°C) | −11.17 | +0.75 | +3.76 | +4.73 | |
| Daily minimum temperature (°C) | −17.51 | +0.66 | +4.58 | +5.67 | |
| Days greater than 0 °C | 4.96 | +0.63 | +6.08 | +8.96 | |
| Total precipitation (mm/day) | 1.91 | +0.14 | +0.61 | +0.77 | |
| Snow-fraction (%) | 78.93 | −0.46 | −4.87 | −7.70 | |
| c) | |||||
|---|---|---|---|---|---|
| Season | Variable | Present (2015–24) | Future change (2015–2024 compared with 2090–99) | ||
| SSP mean | SSP 1–2.6 | SSP 3–7.0 | SSP 5–8.5 | ||
| Winter (June - July - August) data | Daily near-surface temperature (°C) | −20.96 | +0.64 | +4.39 | +5.36 |
| Daily maximum temperature (°C) | −17.24 | +0.64 | +4.14 | +4.94 | |
| Daily minimum temperature (°C) | −24.92 | +0.72 | +4.82 | +5.79 | |
| Days greater than 0 °C | 0.36 | +0.12 | +0.96 | +1.71 | |
| Total precipitation (mm/day) | 1.83 | +0.06 | +0.52 | +0.61 | |
| Snow-fraction (%) | 78.50 | +0.84 | +1.18 | +1.80 | |
| d) | |||||
|---|---|---|---|---|---|
| Season | Variable | Present (2015–24) | Future change (2015–2024 compared with 2090–99) | ||
| SSP mean | SSP 1–2.6 | SSP 3–7.0 | SSP 5–8.5 | ||
| Spring (September - October - November) data | Daily near-surface temperature (°C) | −14.54 | +0.25 | +2.83 | +3.42 |
| Daily maximum temperature (°C) | −10.95 | +0.19 | +2.36 | +3.13 | |
| Daily minimum temperature (°C) | −18.40 | +0.22 | +3.27 | +4.19 | |
| Days greater than 0 °C | 1.28 | −0.06 | +1.50 | +2.59 | |
| Total precipitation (mm/day) | 1.90 | −0.04 | +0.32 | +0.35 | |
| Snow-fraction (%) | 80.85 | +0.10 | +0.48 | +0.93 | |
| e) | |||||
|---|---|---|---|---|---|
| Season | Variable | Present (2015–24) | Future change (2015–2024 compared with 2090–99) | ||
| SSP mean | SSP 1–2.6 | SSP 3–7.0 | SSP 5–8.5 | ||
| Summer (December- January - February) data | Daily near-surface temperature (°C) | −5.28 | +0.42 | +2.44 | +3.03 |
| Daily maximum temperature (°C) | −3.16 | +0.33 | +2.00 | +2.56 | |
| Daily minimum temperature (°C) | −7.74 | +0.40 | +2.87 | +3.58 | |
| Days greater than 0 °C | 12.44 | +0.76 | +10.50 | +15.01 | |
| Total precipitation (mm/day) | 1.69 | −0.06 | +0.31 | +0.44 | |
| Snow-fraction (%) | 75.63 | +0.39 | −10.20 | −14.09 | |
CMIP6 multi-model mean projections for the Antarctic Peninsula.
Changes in selected key meteorological variables from the present period (2015–2024 CE) compared to the end of the 21st Century (2090–2099 CE) in three SSP scenarios for: (a) annual, (b) autumn, (c) winter, (d) spring, and (e) summer. Values are calculated as the mean from the 19 CMIP6 models listed in Supplementary Table S1 across the Antarctic Peninsula mask shown in Supplementary Figure S1. As the historical CMIP6 runs ended in 2014, the present values are calculated as the mean of the three SSP scenarios (SSPs 1–2.6, 3–7.0, 5–8.5) while future changes are calculated from the individual SSPs.
TABLE 4
| Component | Details | SSP 1–2.6 | SSP 3–7.0 | SSP 5–8.5 |
|---|---|---|---|---|
| Global mean values | CMIP6 multi-model mean global near-surface temperature for the decade 2090–2099 CE. Values given as relative to preindustrial (1850–1900 CE)a | +1.97 °C relative to pre-industrial | +4.25 °C relative to pre-industrial | +5.11 °C relative to pre-industrial |
| Atmosphere | CMIP6 multi-model mean Antarctic Peninsula near-surface temperature for the decade 2090–2099 CE. Values given as relative to preindustrial (1850–1900 CE) | +2.28 °C relative to pre-industrial | +5.22 °C relative to pre-industrial | +6.10 °C relative to pre-industrial |
| CMIP6 multi-model mean Antarctic Peninsula near-surface temperature for the decade 2090–2099 CE. Values given as relative to present-day (2015–2024 CE) | +0.55 °C relative to present-day | +3.40 °C relative to present-day | +4.23 °C relative to present-day | |
| CMIP6 multi-model mean Antarctic Peninsula total precipitation (mm) for the decade 2090–2099 CE. Values given as relative to present-day (2015–2024 CE) | +0.03 mm/day relative to present-day | +0.44 mm/day relative to present-day | +0.55 mm/day relative to present-day | |
| CMIP6 multi-model mean Antarctic Peninsula snow fraction (%) for the decade 2090–2099 CE. Values given as relative to present-day (2015–2024 CE) | +1.06% relative to present-day | −3.65% relative to present-day | −5.29% relative to present-day | |
| Ocean | Absolute sea surface temperatures (CMIP6 forecasts) (Tonelli et al., 2021) | ∼0.3 °C | ∼0.7 °C | ∼1.6 °C |
| Upwelling and flow of Circumpolar Deep Water (CDW) | Pulses of warm water onto continental shelf | Increased upwelling of warm waters, more consistent flow onto the continental shelf; more intensive oceanographic warming | Increased upwelling of warm waters, more consistent flow onto the continental shelf | |
| Sea ice | CMIP6 multi-model mean for sea ice concentration, Antarctic Peninsula, for the decade 2090–2099 CE. Values given as relative to the present day (2020–2029 CE) | Seasonal reductions, 2090s versus 2020s DJF: −1.54% MAM: −1.70% JJA: −1.69% SON: −0.61% | Moderate changes in sea ice, particularly in the Weddell Sea in winter (June, July, August) Seasonal reductions, 2090s versus 2020s DJF: −9.97% MAM: −13.31% JJA: −13.45% SON: −8.67% | Largest winter reductions in the Bellingshausen Sea, largest summer reductions in Weddell Sea Seasonal reductions, 2090s versus 2020s DJF: −13.06% MAM: −16.73% JJA: −19.32% SON: −12.61% |
| Ice shelves | Surface melting, firn air content (FAC) depletion leading to hydrofracturing risk | Minimal FAC change; only Wilkins expected to see a >10% FAC decrease | | 2500–6500 Gt of cumulative surface melt across all Antarctic Peninsula ice shelves by 2100 Lowest FAC on Wilkins, Larsen C, George VI. Stange the only Peninsula ice shelf with >10 m FAC. Collapse of Larsen C and Wilkins likely by 2100 (not George VI due to compressive flow) Increased basal melting of ice shelves due to increased Circumpolar Deep Water incursion |
| Land ice | Ungrounding and tidewater glacier recession | Largely sustained in current formation. Limited ungrounding and ice loss | Loss of firn air content on glaciers, likely sustained in current formation until 2100 but increased ungrounding over longer timescales | Grounding line retreat, and terminus flotation, increasing significantly over longer timescales. Increased snowfall but also increased surface melt and runoff. Increased change of marine ice sheet instability in the Bellingshausen sector over multiple centuries |
| ISMIP6 multi-model mean land-ice sea-level contributions for the Antarctic Peninsula (Seroussi et al., 2024), relative to present day (2015 CE) | Low emissions scenario, relative to 2015 CE −7.75 ± 11.75 mm by 2100 −19.70 ± 35.45 mm by 2300 Growth of land ice under the low emissions scenario | | Very high emissions scenario, ice shelf collapse on, relative to 2015 CE +7.54 ± 14.13 mm by 2100 +116.32 ± 66.87 mm by 2300 Very high emissions scenario, ice shelf collapse off, relative to 2015 CE −2.90 ± 13.37 mm by 2100 +71.10 ± 80.92 mm by 2300 Significant loss of land ice. Ungrounding of ice in the Bellingshausen Sea, significant thinning in the George VI sector and Palmer Land | |
| Extreme events | High surface temperatures and liquid precipitation associated with atmospheric rivers, ocean heat waves | Continued occurrence of extreme events likely | Increased severity and frequency of extreme events | Greatly increased severity and frequency of extreme events |
| Marine ecosystems | Species richness and range | Uncertain; likely similar to present | | Increases in phytoplankton around the Peninsula Increased species richness east of the Peninsula, decreased richness west of the Peninsula Increased storminess enhances species colonisation Krill and salps range contracts to the south |
| Terrestrial and freshwater ecosystems | Biodiversity and biogeography | Many native species likely to ‘benefit’ if considered in isolation - increased habitat area, reduced limiting stresses, increased populations, biomass and local range. Potential negative impacts from invasive non-native species, some already present, but a pool of others capable of establishing, likely with human assistance. Assisted movement of true Antarctic species into different Antarctic biogeographic regions where they currently do not occur | Upper thermal physiological limits of native species increasingly likely to be experienced (both by extreme events and the general warming magnitude), damaging impacts at population scale, including local extinction events Coalescence of ice-free areas after ice recession may lead to genetic homogenisation Increased rate of non-native establishment and negative impacts of biological invasions, while some native species may be able to contribute to development of habitat types not currently present | Further expansion of the preceding effects. Increasingly limited distribution or even extinction of some Antarctic-specialist species |
Impacts of different warming scenarios on the Antarctic Peninsula to 2100 CE.
CMIP6 air temperature anomalies for the Antarctic Peninsula compared with pre-industrial values are not directly comparable with the IPCC “best estimate”, which are based on a larger ensemble of models and have observational constraints applied, but this multi-model mean for global changes is in line with IPCC, global temperature anomaly estimates.
Antarctic Peninsula precipitation increases with SSP severity, with decreases only projected in spring and summer in SSP 1–2.6. Annual precipitation increases by ∼29%, from 1.91 mm day- 1 -2.46 mm/day in SSP 5–8.5, with the largest seasonal change in autumn. Projected change in annual mean precipitation scales approximately in line with a Clausius–Clapeyron thermodynamic benchmark using α = 0.07 K−1 (≈7% per K) as in Dalaiden et al. (2020), except for SSP1-2.6 where the change is well below this scaling, indicating dynamic or humidity changes could be important. Note that unlike Dalaiden et al. (2020) we analyse precipitation rather than net accumulation.
There is marked seasonal variation in the sign of changes in the snow precipitation percentage. Increases are projected in winter and spring for every SSP with the converse in autumn. In summer, there are decreases in SSP 3–7.0 and SSP 5–8.5, with the latter demonstrating a reduction from ∼76% to ∼62%, signifying that more than a third of precipitation will fall as rain. Supplementary Figure S2 shows the spatial pattern of precipitation change from the multimodel mean for each of the three emissions scenarios considered. Precipitation change exhibits an east-west pattern, which becomes even more pronounced under higher emissions. The majority of the precipitation change is projected to occur over ocean regions just west of the main Peninsula.
Increased greenhouse gases under the higher emissions scenarios are associated with a positive trend in the SAM, with strengthened and poleward-shifted westerlies over the Peninsula. However, some of these circulation changes are likely to be cancelled or offset if the anticipated recovery of the ozone hole by the end of the current century takes place, which is expected to reverse the positive SAM trend associated with the ozone hole (Son et al., 2010).
Extreme events
Extreme events can disrupt ecosystems, lead to extensive surface melt, and impact sea ice, driving step-changes in multiple systems (Siegert et al., 2023). For example, ice-shelf collapse can have long-lasting significant impacts on land ice, and extreme sea ice minima can stress the marine environment, impact climate through changes in ocean albedo, influence glacier calving, and lead to self-perpetuating processes as ocean heat uptake increases (Abram et al., 2025).
Evidence from multiple realms point to increasing intensity and frequency of extreme events, which have the potential to adversely affect wider systems across the Peninsula. The highest temperature recorded on the Antarctic mainland occurred in February 2020 near the northern tip of the Antarctic Peninsula, at 18.6 °C (González-Herrero et al., 2022). In this same 2019/2020 austral summer, George VI Ice Shelf, southwest Antarctic Peninsula, experienced a 32-year record high surface melt and ponding event (Banwell et al., 2021) (Figure 2C). In February 2022, the Antarctic Peninsula again underwent record surface melt during an extreme warm event, associated with an atmospheric river (Gorodetskaya et al., 2023). Warming of this kind, if occurring in high summer, has the unprecedented ability to melt snow and ice in regions not observed to melt previously.
Atmospheric rivers can transport vast amounts of moisture from mid- and subtropical latitudes to Antarctica (Clem et al., 2022). These long (>2000 km) and narrow (<1000 km) bands travel through the troposphere and are associated with extreme precipitation events. When they intersect mountainous topography, they can produce intense windward precipitation and cloud formation, with strong foehn warming on the leeward side (Turner et al., 2021; Wille et al., 2025). The Peninsula has a trend of increasing occurrence of atmospheric rivers (+0.89 atmospheric rivers per decade) from 1979 to 2022. Atmospheric rivers are associated with most extreme melt events in West Antarctica and the Antarctic Peninsula (Wille et al., 2025).
The ocean is also subject to warming events, resulting in the repeated breaking of minimum sea-ice records since 2017 (Doddridge et al., 2025; World Meteorological Organisation, 2025). The years 2022–2024 saw the three lowest Antarctic sea ice extents in the satellite era (World Meteorological Organisation, 2025). Extreme sea ice lows like these can negatively impact Antarctic fauna such as emperor penguins that rely on sea ice for breeding (e.g., Fretwell et al., 2023). Marine heat waves are intensifying in frequency and magnitude, a trend that will continue in the Southern Ocean under future projected warming (Gurumoorthi and Luis, 2025). A marine heat wave was recorded in early January 2020 in the Drake Passage, with sea surface temperature anomalies of +3 °C (Rigual-Hernández et al., 2025). These marine heat waves can lead to substantial impacts on ecosystems and sea ice. Marine heat waves are projected to increase in frequency and become more intense under climate warming scenarios, with the trend more intense at higher warming levels (Frölicher et al., 2018).
The multi-model mean from CMIP5 simulations under RCP 4.5 and RCP 8.5 from 15 global climate models (GCMs) provide projections for Antarctic heat waves. Heat waves (three or more consecutive summer days with very high temperatures) are expected to become more frequent and last longer in the coming century (Feron et al., 2021). Under RCP4.5, the number of heat waves is projected to double by 2070–2099 CE compared with 1961–1990 CE in West Antarctica. This could result in ∼15 days per season by 2070–2099 under RCP 4.5 and 25 days under RCP 8.5, rising from 5 days per season in 1961–1990 CE (Feron et al., 2021). Temperature anomalies of 6 °C under RCP 4.5 °C and 8 °C under RCP 8.5 could result in increased surface melt on the Antarctic Peninsula.
Extreme weather under a higher emissions scenario could also include more frequent rain events (Vignon et al., 2021). Atmospheric rivers are projected to increase in frequency globally as a result of increased moisture availability (Wille et al., 2025), though when the mean increase integrated water vapour is accounted for, atmospheric river frequencies are comparable to the present day, with a small increase in precipitation (Maclennan et al., 2025). Atmospheric rivers can accelerate glacier mass loss by washing or melting snow from glaciers and land surfaces. More frequent and more intense rainfall events generally coincide with positive surface temperatures, which will become more frequent on the Peninsula in the summer under all scenarios, but particularly under SSP 5–8.5 (Table 3e).
Increasing extreme events are likely to have a large impact on Antarctic Peninsula systems, including through accelerating frontal ablation from glaciers (Gorodetskaya et al., 2023). Increasing surface melt on ice shelves has the potential to destabilise them by infiltrating into the firn and refreezing, reducing the firn air content (Dunmire et al., 2024). This promotes meltwater pond formation on impermeable ice surfaces. In turn, meltwater ponds (e.g., Figures 2C,F) melting downwards through the ice can reduce the structural integrity of these huge floating ice slabs by inducing hydrofracture (Scambos et al., 2009). Marine heat waves and sea ice minima can impact Antarctic fauna such as emperor penguins (Fretwell et al., 2023).
Southern Ocean
The Southern Ocean plays an important role in regulating Earth’s climate, absorbing heat and carbon dioxide (Brown et al., 2019; Williams et al., 2023). The area around the western Antarctic Peninsula is warming rapidly, particularly at intermediate depths (200–1000 m). Sea surface temperatures of the Bellingshausen Sea warmed by > 1 °C from 1955 to 1994 (Meredith and King, 2005). This trend has continued, with a warming trend on the western Antarctic Peninsula continental shelf from 1993 to 2021 below 100 m depth (Davison et al., 2024). Increased wind strength and Antarctic Circumpolar Current transport is driving increased upwelling of the relatively warm Circumpolar Deep Water ocean current onto the continental shelf in the Bellingshausen Sea (Dinniman et al., 2012; Davison et al., 2024; Moffat and Meredith, 2018; Cai et al., 2023), bringing increased heat fluxes onto the continental shelf.
The increased flow of Circumpolar Deep Water onto the continental shelf on the western Antarctic Peninsula has contributed to the rapid recession of tidewater glaciers (Cook et al., 2016; Davison et al., 2024; Wallis et al., 2023). At Cadman Glacier, south of Anvers Island (65.6°S), rapid grounding line retreat has been linked to significant warm temperature anomalies from 50 to 500 m water depth from 2017 onwards (Wallis et al., 2023), related to increased incursion of Circumpolar Deep Water.
CMIP6 projections for Southern Ocean sea surface temperatures suggest that warming trends are likely under all future climate scenarios. The multi-model mean sea surface temperature change is ∼0.3 °C for SSP1-2.6 (Table 4). Increases in the northwestern Antarctic Peninsula are unlikely before 2080 CE, and not before 2100 in the northwestern Weddell Sea (Tonelli et al., 2021). Critically, the low emissions scenarios are associated only with pulses of warm water onto the continental shelf in the Weddell Sea (Teske et al., 2024).
The higher emissions scenarios will drive continued poleward intensification of atmospheric and oceanic circulation (Cai et al., 2023), impacting glaciers, sea ice, ice shelves and biodiversity across the western Antarctic Peninsula. For SSP 3–7.0, the approximate sea surface temperature change is ∼0.7 °C. For SSP 5–8.5, the mean sea surface temperature increase in the Southern Ocean is ∼1.6 °C (Table 4). For both SSPs 3–7.0 and 5–8.5, the timing of the emergence of the anthropogenic climate signal is earlier. The northwestern Antarctic Peninsula will warm more intensively and rapidly in these scenarios, as the Antarctic Circumpolar Current will drive warmer waters closer to the continent (Tonelli et al., 2021). Under these higher emissions scenarios, pulses of warm water onto the continental shelf in the Weddell Sea are replaced with continuous warm water flow (Hellmer et al., 2012; Naughten et al., 2021; Teske et al., 2024), which would negatively impact tidewater glaciers and ice shelves on the eastern Antarctic Peninsula. Marine heat waves will increase in frequency and severity in the Southern Ocean, placing additional stress on biological and cryospheric systems (Gurumoorthi and Luis, 2025).
Sea ice
Sea ice is a crucial component of the Antarctic cryosphere, acting as a climate amplifier through changing albedo (Riihelä et al., 2021), influencing ocean heat uptake (Brown et al., 2019), and impacting multiple glacier, oceanic and ecological systems (Abram et al., 2025). Its importance is recognised by the World Meteorological Organisation as a headline Global Climate Indicator, key to describing the changing climate (Trewin et al., 2021).
Antarctic sea ice (Figure 2) has responded more variably to warming than that in the Arctic. Instead of showing broad decreases over the satellite data record, Antarctic sea ice has exhibited both positive and negative trends depending on season, region, and time-period (e.g., Parkinson and Cavalieri, 2012; Matear et al., 2015; Doddridge et al., 2025). Regional dependency in these changes is partly explained by the interaction between stratospheric ozone depletion and rising greenhouse gas emissions. While these forcings can exert competing effects in East Antarctica (e.g., Marshall et al., 2014; Polvani et al., 2011), they act additively over the Antarctic Peninsula, strengthening westerly winds and contributing to the pronounced changes observed in this sector (Thompson et al., 2011; Turner et al., 2016). Consequently, sea ice patterns around the Antarctic Peninsula show distinct variability, with the Bellingshausen Sea just to the west (Figure 1) experiencing large declines in winter sea ice cover and overall duration since the late 1970s. In contrast, to its east, the Weddell Sea saw relatively stable or even slightly increasing sea ice cover until 2015. However, since 2015, the Weddell Sea has begun to experience more frequent periods of low sea ice cover, with conditions in this region in February 2023 contributing approximately 33% of the overall record low sea ice extent anomaly that year (Jena et al., 2024). Since 2023, sea ice conditions have remained lower than average, leading to some studies suggesting Antarctic sea ice has entered a new state (Purich and Doddridge, 2023; Abram et al., 2025). However, as in the Arctic (England et al., 2025), these changes could also be attributed to natural variability. Further loss of Antarctic sea ice risks self-perpetuating processes as sea ice thins and ocean heat uptake increases, potentially leading to irreversible future declines (Abram et al., 2025). The recent extreme sea ice lows are challenging for the skill of current climate models to accurately predict future sea ice trends and abrupt changes (Abram et al., 2025; Holmes et al., 2024; Diamond et al., 2024).
While there have been opposing sea ice trends around the Antarctic Peninsula, archived CMIP6 model projections (Figure 3) suggest continued reductions in both sea ice area and duration. Around the Antarctic Peninsula, this trend is particularly pronounced, with models projecting greater reductions in sea ice cover compared to other parts of Antarctica. Under the SSP 1–2.6 emission scenario the changes are, however, modest, with overall seasonal reductions in sea ice concentration of between 1% and 2%, largest in winter (Figure 3; Table 4). However, given the current sea ice minima, this may be an underestimate. Under the SSP 3–7.0 scenario, summer sea ice reductions of 10% are predicted, with winter reductions of 13%. Under the SSP 5–8.5 emission scenario, winter reductions increase to 20% (as averaged for all sea ice areas shown), with summer reductions of around 12% (Table 5). However, these predicted changes show strong regional dependence, with large winter and spring reductions in sea ice concentration in the Bellingshausen Sea, while the largest reductions in the Weddell Sea occur in summer and autumn (Figure 3; Table 5).
FIGURE 3
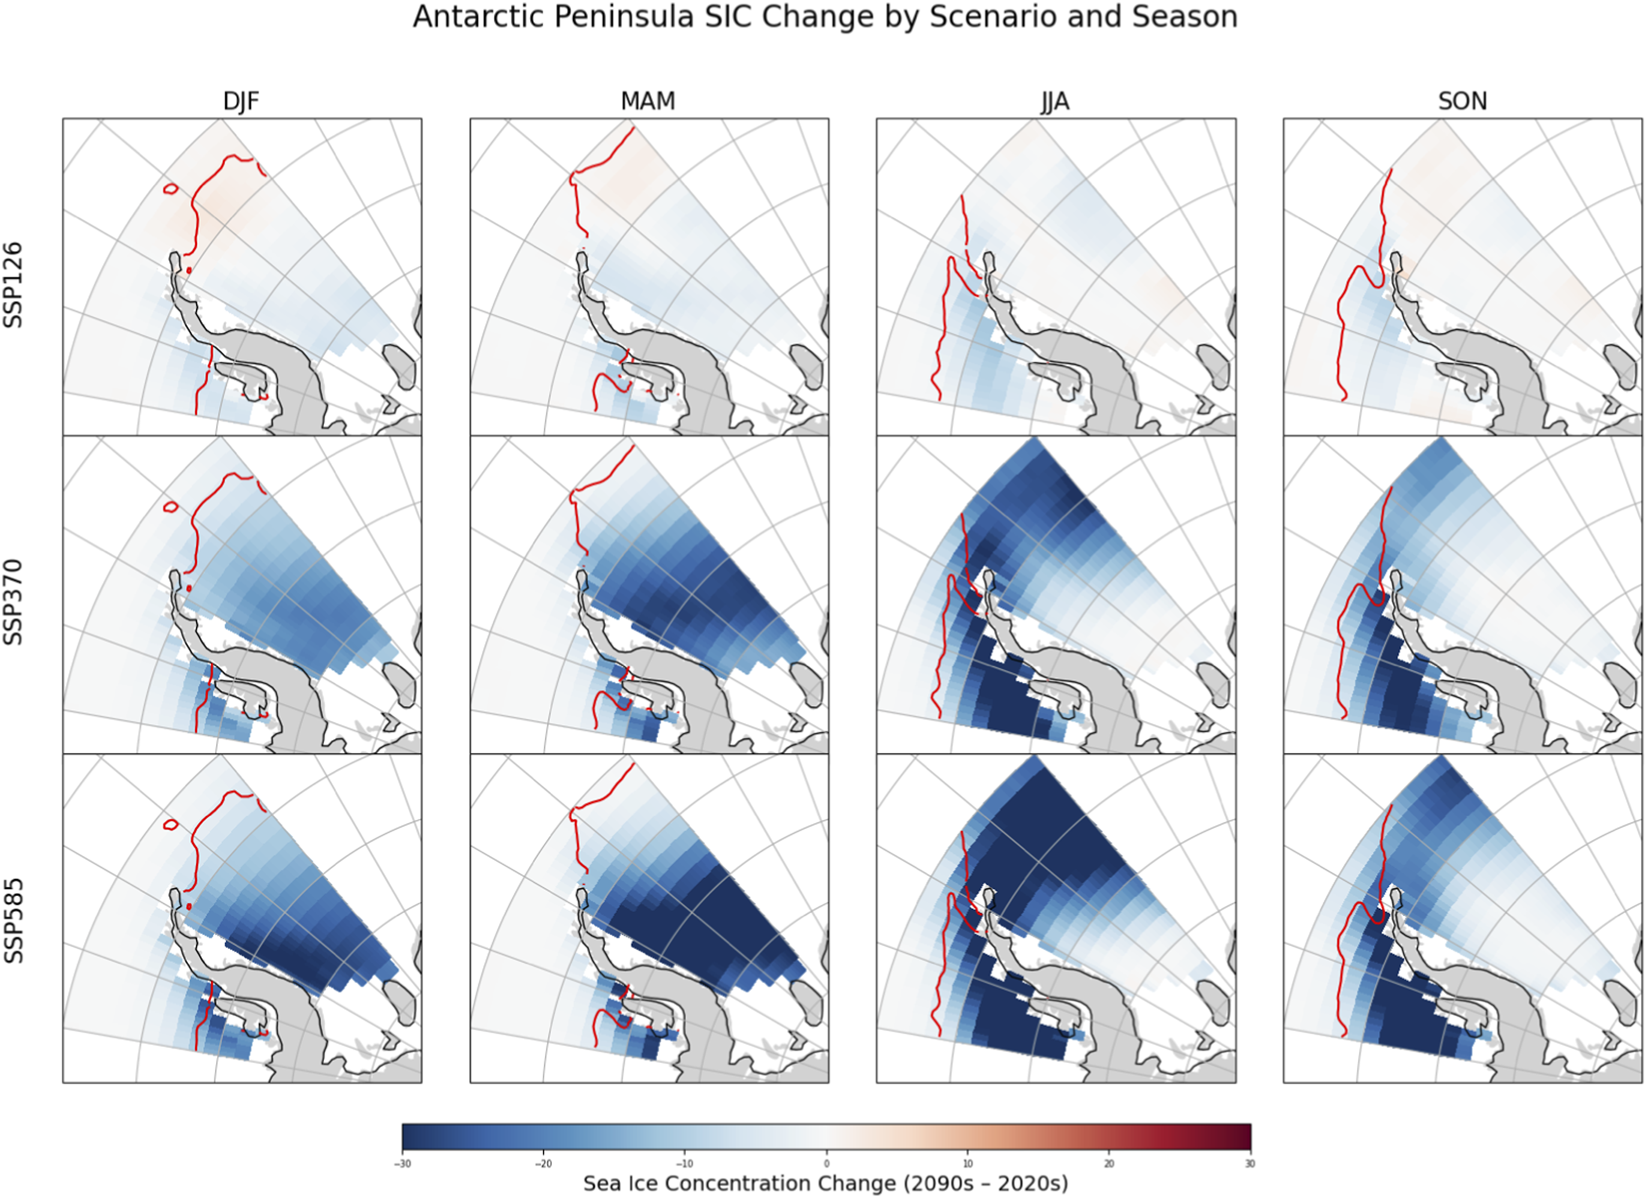
Differences in sea ice concentration for the Antarctic Peninsula, comparing the years 2020–2029 and 2090–2099 CE under three different SSPs from CMIP6 model experiments for the months of December January February (DJF), March April May (MAM), JJA (June July August), and SON (September October November). Sea ice margin in the year 2024 is shown (red line). Further details in Table 5, Supplementary Table S2; Supplementary Figures S3–S5.
TABLE 5
| Scenario | Summer (DJF) | Autumn (MAM) | Winter (JJA) | Spring (SON) |
|---|---|---|---|---|
| Bellingshausen sea (70° - 50°W) | ||||
| SSP 1–2.6 | −1.70% | −2.04% | −2.11% | −0.99% |
| SSP 3–7.0 | −8.61% | −11.34% | −13.60% | −10.67% |
| SSP 5–8.5 | −11.82% | −14.40% | −18.18% | −14.59% |
| Weddell Sea (50° - 0°W) | ||||
| SSP 1–2.6 | −1.25% | −1.06% | −0.90% | 0.10% |
| SSP 3–7.0 | −12.51% | −16.98% | −13.18% | −4.95% |
| SSP 5–8.5 | −15.36% | −21.09% | −21.44% | −8.93% |
| Whole Peninsula | ||||
| SSP 1–2.6 | −1.54% | −1.70% | −1.69% | −0.61% |
| SSP 3–7.0 | −9.97% | −13.31% | −13.45% | −8.67% |
| SSP 5–8.5 | −13.06% | −16.73% | −19.32% | −12.61% |
Seasonal reductions in sea ice around the Antarctic Peninsula (2090s versus 2020s).
DJF, December January February; MAM, March April May; JJA, June July August; SON, September October November.
Summers with extreme low Antarctic sea-ice cover impact glacier calving, change the formation rate of Antarctic Intermediate Water, affecting heat and carbon uptake, and change the timing and size of surface phytoplankton blooms. These changes to ocean conditions, both at the surface and at depth, impact marine ecosystems and food chains, placing stress on marine mammals, birds and other fauna. Significant decreases in sea ice extent will likely provide positive feedback to the polar amplification of climate change, as the lower albedo of open ocean water results in increased ocean warming (Lenton and Armstrong, 2023).
Ice shelves
Ice shelves (e.g., Figure 2H; Figure 4) fringe ∼75% of Antarctica’s coastline and regulate ice-sheet stability by buttressing the flow of inland ice (Furst et al., 2016). Recent oceanic and atmospheric warming have together driven considerable ice shelf melt and retreat (Cook et al., 2016; Rignot et al., 2019), and collapse events since 1995 (Cook and Vaughan, 2010). Ice-shelf collapses have resulted from multiple factors, primarily increased basal melting that drives long-term thinning (Glasser and Scambos, 2008; Etourneau et al., 2019), especially once ice shelves recede beyond key structural thresholds such as basal pinning points (Doake et al., 1998; Gilbert and Kittel, 2021) (Figure 4). Regional atmospheric and oceanic warming has contributed to ice shelf thinning and collapse, driving increased surface melt, ponding and subsequent hydrofracturing (van den Broeke, 2005; Banwell et al., 2013; 2024; Robel and Banwell, 2019). Changing sea ice concentrations have also played a role (Christie et al., 2022). Rapid ice shelf collapses have been followed by abrupt glacier acceleration and thinning, due to a loss of buttressing (De Rydt et al., 2015; Gudmundsson et al., 2019; Scambos et al., 2014; Parsons et al., 2024) (Figure 4). The most substantial grounding line retreat on the Peninsula was recorded at Hektoria Glacier, a tributary glacier of the former Larsen B Ice Shelf (Figure 1,Figure 2E). Hektoria receded 16.3 ± 0.5 km from 1996 to 2020 CE following that shelf’s collapse in 2002 (Wallis et al., 2024).
FIGURE 4
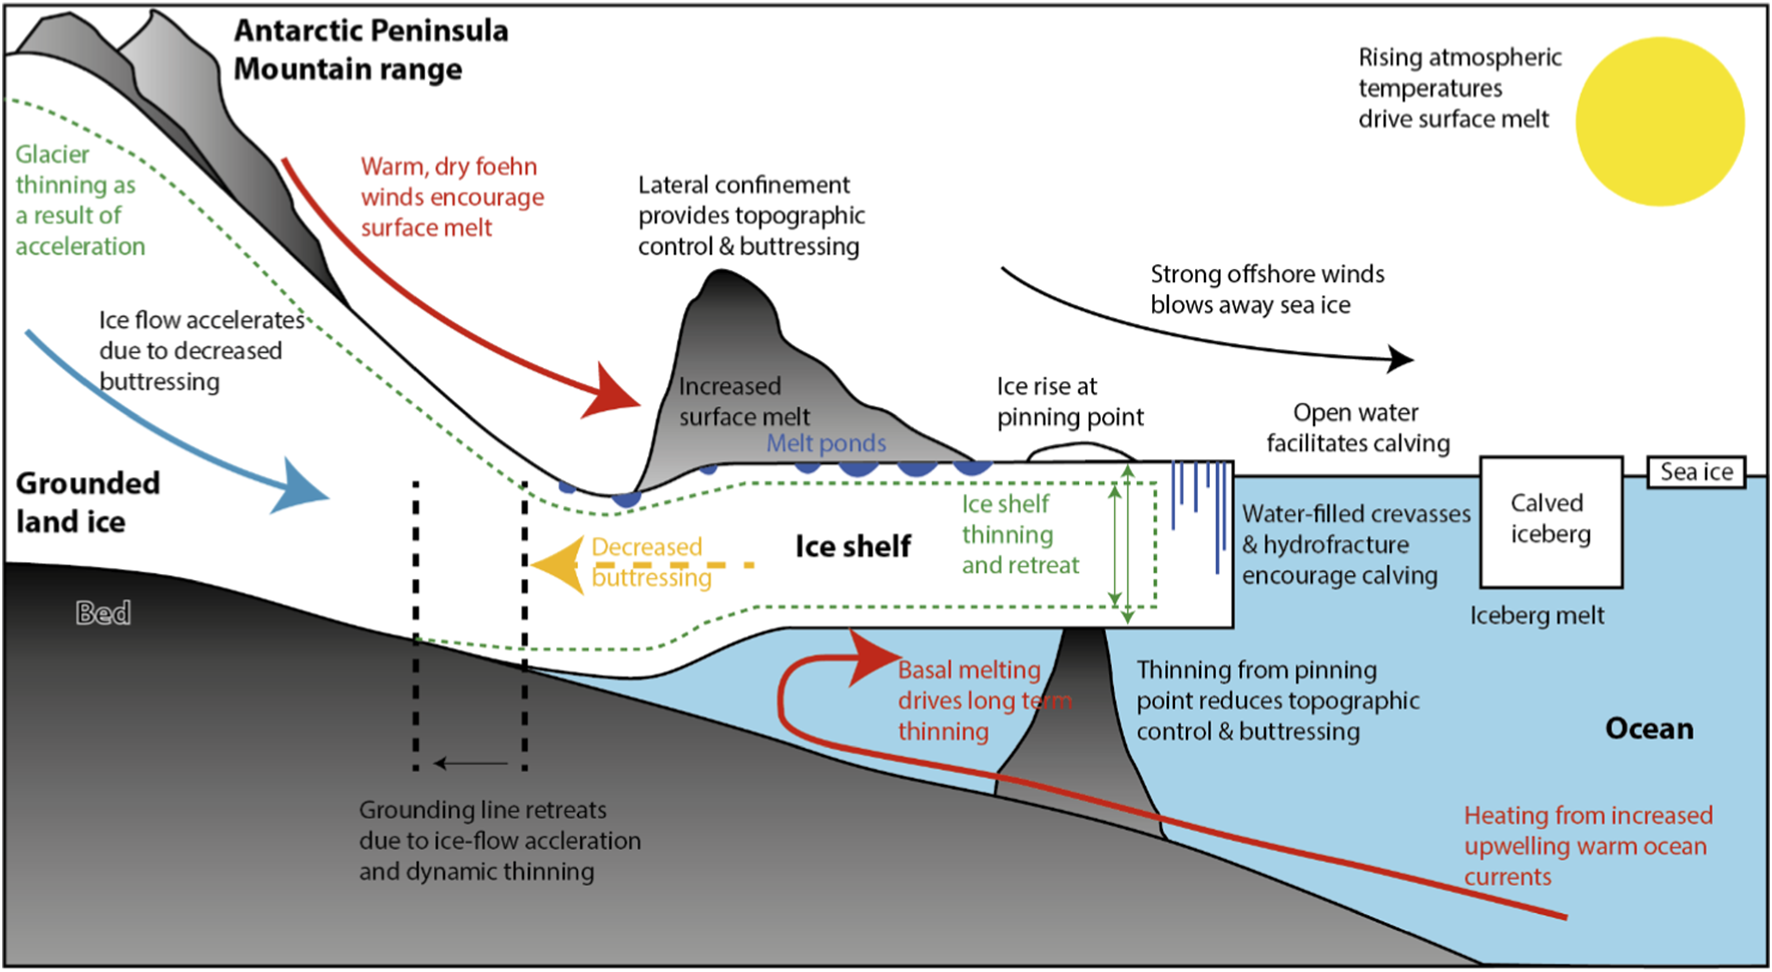
Schematic showing the various processes operating on Antarctic Peninsula ice shelves.
Currently, basal melting accounts for most ice shelf mass loss (Garbe et al., 2023; Davison et al., 2023). However, relative to surface melting, basal melting is less understood and more difficult to predict under future warmer climates (Fricker et al., 2025), because it is influenced by cavity geometry, basal channels and crevasses, influent subglacial meltwater, and warm seawater intrusions, all of which are difficult to simulate. In general, projected increases in ocean warming will increase ice shelf basal melting and hence thinning. Ocean warming does not necessarily lead to more ice shelf calving, and Coulon et al. (2024) show relatively unchanged calving fluxes for many Antarctic sectors, despite significant increases in basal melt and surface runoff for RCP 8.5. Coupled ocean-sea ice modelling indicates that basal melting driven by warm water intrusion, notably that of Circumpolar Deep Water, increases to 2140 CE under all emissions scenarios, but is particularly sensitive under high warming scenarios (Kusahara et al., 2023). Based on projections from the UK Earth System Model (UKESM1), the Ross Gyre may expand into the Amundsen and Bellingshausen seas, bringing ∼1 °C warming due to increased Circumpolar Deep Water transport (Gómez-Valdivia et al., 2023).
Although ice shelf surface melt is currently lower than basal melt at most ice shelves (e.g., Smith et al., 2020; Garbe et al., 2023), it is projected to increase non-linearly with future atmospheric warming (Trusel et al., 2015; Kittel et al., 2022). This is particularly the case above 0 °C (Banwell et al., 2023; Orr et al., 2023), largely driven by a positive melt–albedo feedback from surface ponding and slush (Dell et al., 2024). Additionally, a substantial near-surface layer of densified snow, or firn, on most Antarctic ice shelves (Dunmire et al., 2024) buffers against instability by storing surface meltwater (Holland et al., 2011; Kuipers Munneke et al., 2014). Under increased surface melt rates, this porous layer saturates and refreezes (Hubbard et al., 2016), depleting its firn air content (FAC), enabling meltwater to pond on the now impermeable ice (e.g., Figure 2E) and increasing the likelihood of hydrofracture and collapse (Lai et al., 2020; Jourdain et al., 2025).
Peninsula-wide FAC projections range from minimal change under a low-emissions scenario, with only Wilkins Ice Shelf expected to see a >10% decrease, to substantial depletion under a high-emissions scenario (Dunmire et al., 2024) (Table 4). Under the highest emission scenario, Kittel et al. (2022) projected 2500–6500 Gt of cumulative surface melt across all Peninsula ice shelves by 2100, with the greatest increase (>2000 mm w.e. yr−1) expected in the northern and western Peninsula, including George VI Ice Shelf (Garbe et al., 2023). Under this very high emissions case, only Stange Ice Shelf retains >10 m of FAC, with FAC of Scar Inlet, Wilkins and Larsen C ice shelves amongst the lowest across Antarctica. Future intense atmospheric rivers could further destabilise these ice shelves (Wille et al., 2022).
Gilbert and Kittel (2021) projected extensive surface runoff, indicative of substantial FAC reductions, on Wilkins, George VI, and Larsen C ice shelves at 2 °C and 4 °C global mean warming above preindustrial temperatures, thresholds that approximately align with SSP 1–2.6 and SSP 5–8.5, respectively (cf. Tables 1, 2). Of these three ice shelves, several studies suggest that Larsen C and Wilkins ice shelves are likely to collapse by 2100 CE under very high emissions (Bell et al., 2018; Van Wessem et al., 2023; Dunmire et al., 2024), partly driven by their projected increased hydrofracture potential (Jourdain et al., 2025). Conversely, George VI Ice Shelf’s compressive flow regime makes it relatively resistant to hydrofracture (Lai et al., 2020; Gilbert and Kittel, 2021; Jourdain et al., 2025) despite exceptionally high present-day surface melt rates and pond density (Banwell et al., 2021; Banwell et al., 2024).
While the physical processes driving ice shelf collapse are poorly represented in numerical models, projections that include collapse result in substantially higher ice mass loss (Fricker et al., 2025; Seroussi et al., 2024; Edwards et al., 2021). Using an ensemble of 16 models, Seroussi et al. (2024) concluded that collapse would, on average, result in 1.1 m higher sea level from the Antarctic Ice Sheet by 2300 under a high emission scenario, with the Peninsula notably being amongst the most sensitive regions of Antarctica, already responding by 2100 CE. Predicting this future stability is further complicated by ice shelf 3D structural complexity, including stratification, foliation and fractures inherited from feeder glaciers (e.g., Miles et al., 2025), and subsequent stratification, rifts, suture zones and englacial and basal marine ice formed near and downstream of the grounding zone (e.g., Glasser et al., 2009; Miles et al., 2025).
Land ice
Melting and recession of grounded land ice in the Antarctic Peninsula contributes to global sea level rise (Otosaka et al., 2023). Peninsula outlet glacier recession will increase habitat connectivity and make new ecological habitats available for colonisation, impacting terrestrial fauna, and ocean freshening and changes in sedimentological load impacts marine ecosystems (Griffiths et al., 2024). Land ice on the Peninsula influences wider ocean circulation (Meredith et al., 2013) and impacts regional albedo. Antarctic Peninsula land ice is also a sentinel for climate change, due to its rapid thinning and recession.
Otosaka et al. (2023) reported an average annual mass loss of 13 ± 5 Gt yr-1 across the Peninsula for 1992–2020, rising to 21 ± 12 Gt yr-1 from 2017 to 2020 CE. The mass losses in the earlier part of the 2000s were largely associated with ice shelf collapse and glacier acceleration, and from 2012 to 2016 were partially offset by an extreme snowfall event in 2016. Since 2016, mass loss has increased (Otosaka et al., 2023), driven by sustained retreat of marine-terminating glaciers (Hanna et al., 2024). This was forced by oceanographic processes, including ocean warming and disintegrating landfast sea ice in embayments in front of former Larsen B Ice Shelf areas, which removes buttressing and results in rapid glacier terminus recession (Ochwat et al., 2024; Loebel et al., 2025). Furthermore, grounded glaciers across the Peninsula are accelerating (Boxall et al., 2022; 2024; Wallis et al., 2023; Davison et al., 2024). Seasonal glacier acceleration across the Peninsula has been attributed to a mixture of ocean and atmospheric drivers (Fricker et al., 2025). This includes enhanced basal lubrication following increased surface melt (Boxall et al., 2024), warmer oceans (Cook et al., 2016; Davison et al., 2024) and reduced sea ice (Rott et al., 2020). These Peninsula outlet glaciers, terminating in narrow fjords directly into the ocean, are analogous to the outlet glaciers of the Greenland Ice Sheet, and processes long observed in Greenland are increasingly observed in the Antarctic Peninsula (Mottram et al., 2025).
Constraining future land ice changes on the Antarctic Peninsula is challenging, as there remain severe limitations in the predictive capability of ice sheet models (cf. Bamber et al., 2019). The current state of the art models and circum-Antarctic ISMIP6 multi-model ensembles (Nowicki et al., 2020; Seroussi et al., 2020; Seroussi et al., 2024; Figure 5) are hindered over the Peninsula, since these continent-wide simulations are challenged by the (often poorly observed) complex topography and low spatial resolution relative to ice thickness and valley width in this region. Very few studies have investigated in detail the mass balance sensitivities of Peninsula glaciers. It is, therefore, challenging to quantify with any degree of confidence the key drivers of ice mass loss and gain under different climate scenarios. This results in large uncertainty in the future behaviour of land ice on the Antarctic Peninsula, with a large spread of projections (Seroussi et al., 2024; Table 3) that are largely independent of scenario until well after 2100 CE. Major differences between projections only tend to emerge after 2150 CE (e.g., Lowry et al., 2021).
FIGURE 5
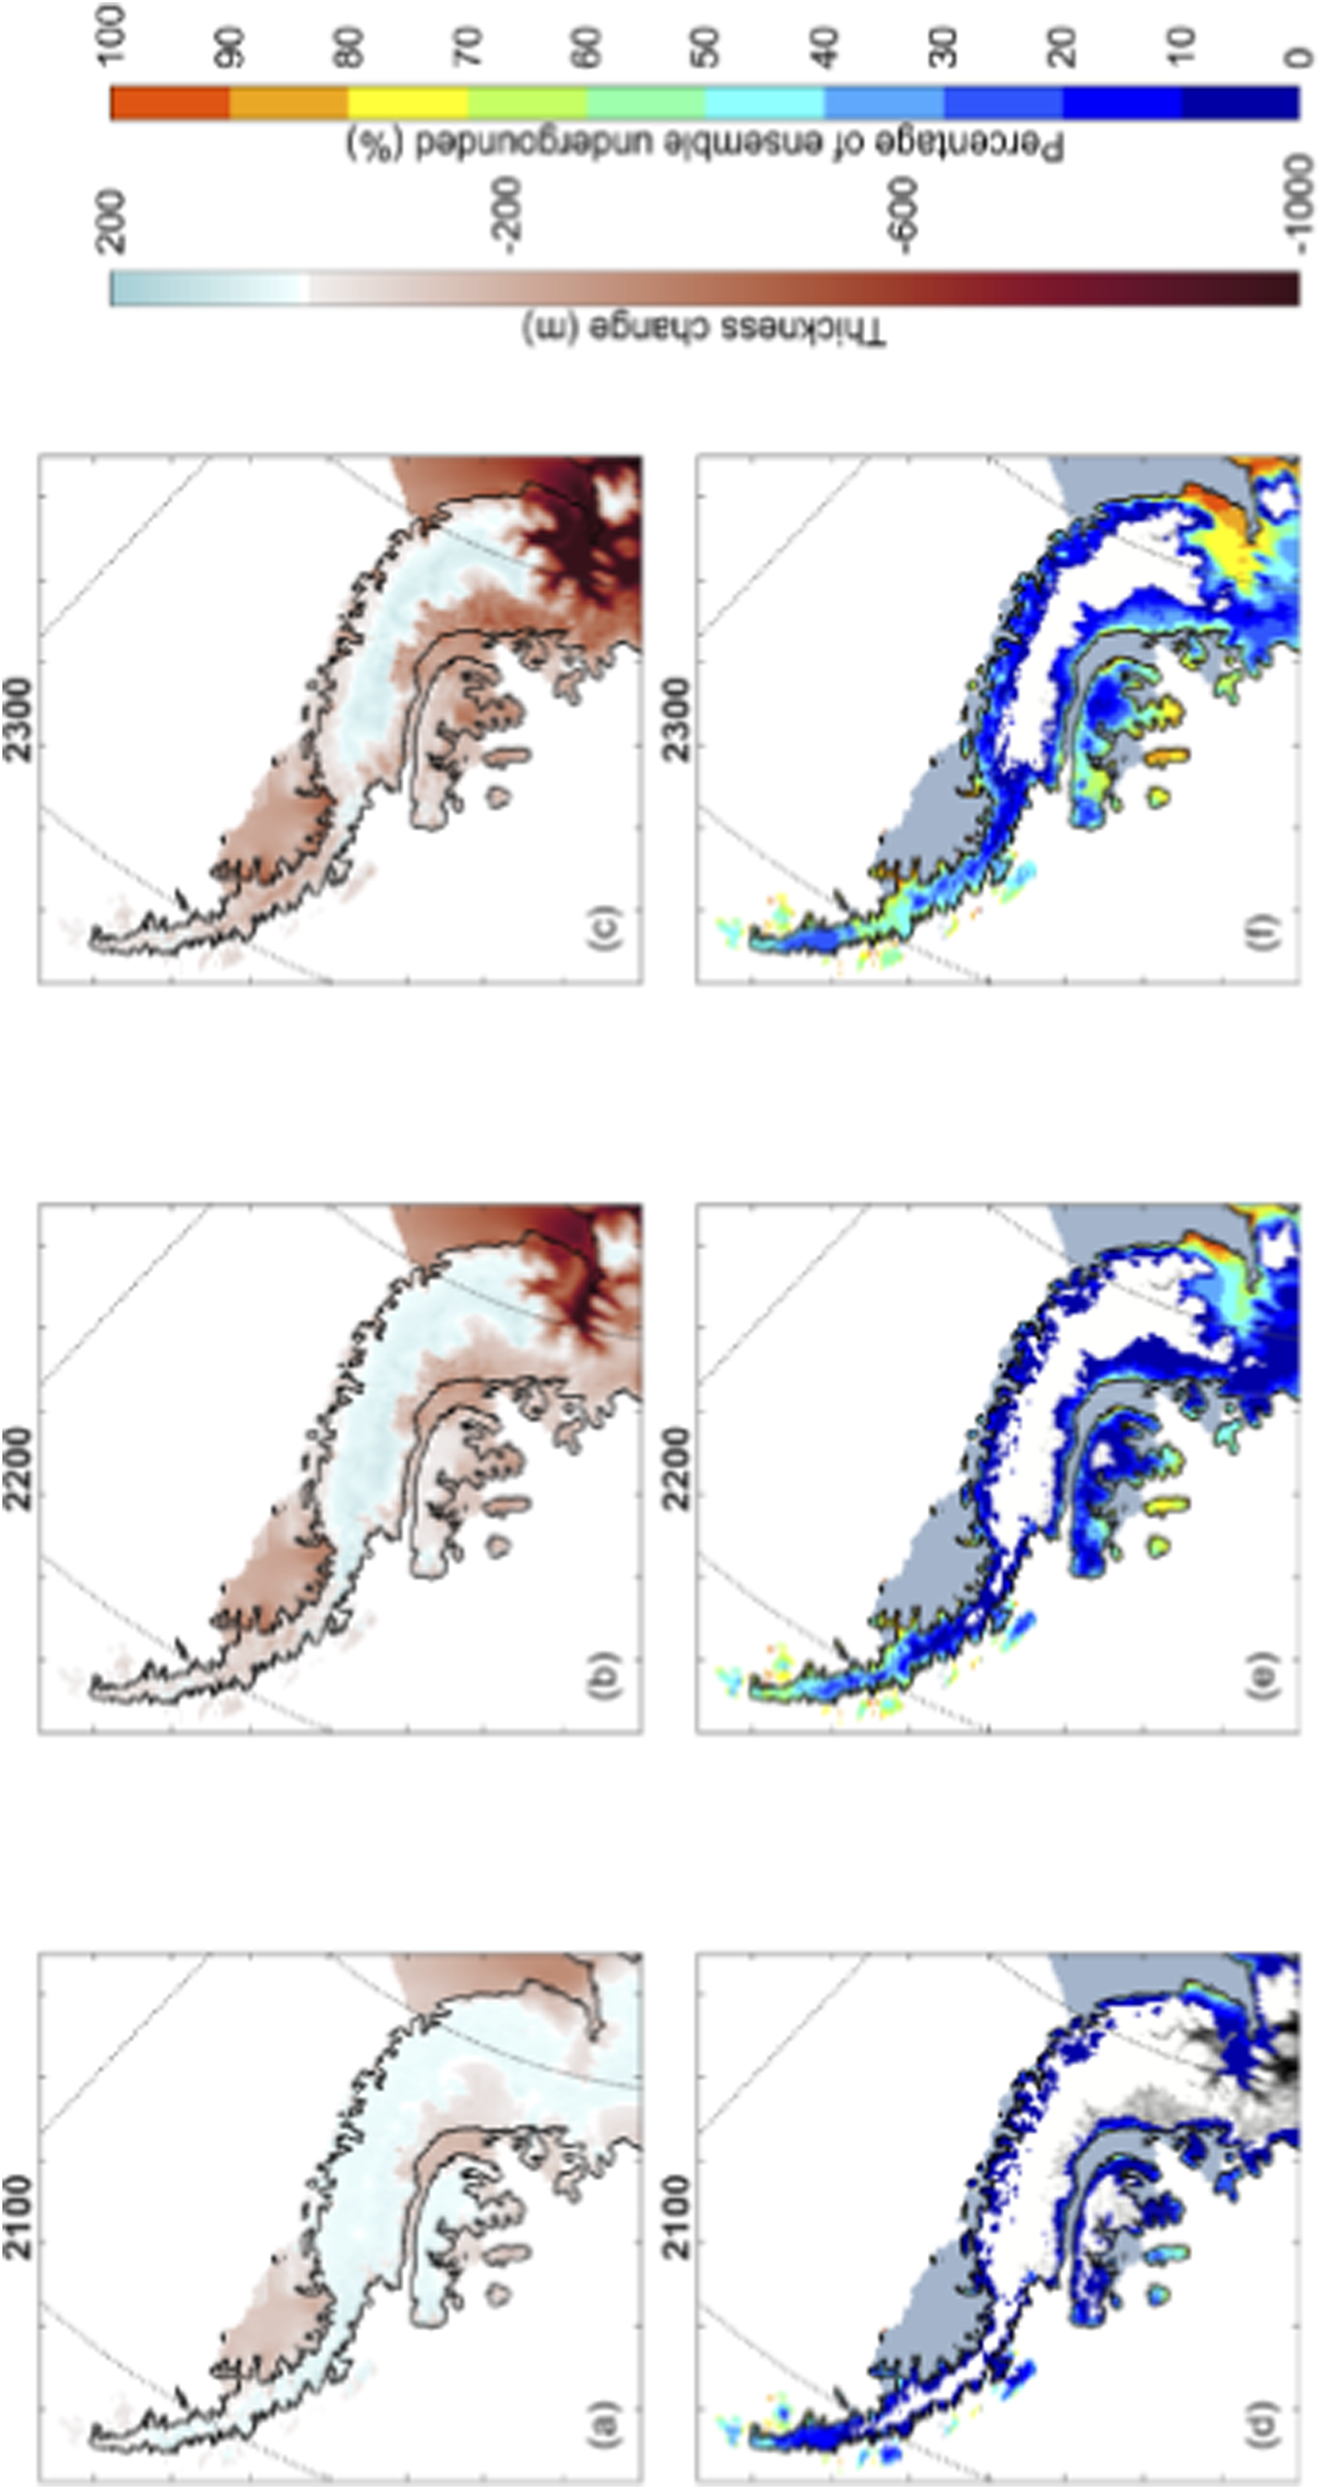
Average thickness change (a–c, top row) and percentage of the ensemble experiencing grounding line retreat (d–f, bottom row) from all ISMIP6 models for the high emission (RCP 8.5/SSP 8.5) scenarios for the Antarctic Peninsula, at 2100 (a,d), 2200 (b,e), and 2300 (c,f) CE.
Under lower emissions scenarios, it is likely that current trends will continue, with some mass loss potentially offset by increased snowfall (e.g., Golledge et al., 2015; Pattyn et al., 2018; O'Neill et al., 2025). A mid to high-range scenario could result in increased runoff, decreased firn air content, and increased surface meltwater (which is already seen on land ice in the northern Peninsula, e.g., Figure 2F). This could potentially impact the basal hydrology of Peninsula glaciers, exacerbating current trends (e.g., Boxall et al., 2024).
Grounding line retreat and further ice shelf collapse is increasingly likely under SSP 5–8.5 (Table 4). Key areas of land-ice vulnerability include glaciers feeding George VI Ice Shelf and those within the Bellingshausen Sea sector (Seroussi et al., 2024; O'Neill et al., 2025); both are regions where grounded glaciers are currently accelerating (e.g., Boxall et al., 2024), and where substantial land ice loss under a higher emissions scenario could result in glacier ungrounding (Figure 5). Loss of Larsen C Ice Shelf, likely by 2100 CE under a very high emissions scenario (Dunmire et al., 2024), could result in increased grounding line discharge (Mitcham et al., 2022) and grounding line retreat in parts of the eastern Peninsula. Due to cold temperatures and the relatively low height of the Peninsula’s bedrock above sea level, even under the most extreme scenarios, glaciers will likely keep a marine-terminating front under all scenarios for multiple centuries (Figure 5). Loss of ice shelves and sea ice would likely exacerbate current trends by decreasing buttressing and increasing calving from marine terminating glaciers.
There is wide uncertainty in sea level contributions from the Antarctic Peninsula. Under a lower emissions scenario, the ISMIP6 multi-model ensemble mean predicts growth of land ice, with a limited sea level contribution: −7.8 ± 11.8 mm by 2100 CE and −19.7 ± 35.5 mm by 2300 CE (Table 3; Supplementary Table S3; Figure 6). Alternatively, under a very high emissions scenario where ice shelf collapses occur, total sea level contributions could reach 7.5 ± 14.1 mm by 2100 CE and 116.3 ± 66.9 mm by 2300 CE (Table 4). This indicates that very high emissions scenarios, in synergy with decreased sea ice and ice shelf collapse, would substantially impact the Antarctic Peninsula, with extensive grounded glacier recession and considerable new exposure of bare rock and ground (Seroussi et al., 2024).
FIGURE 6
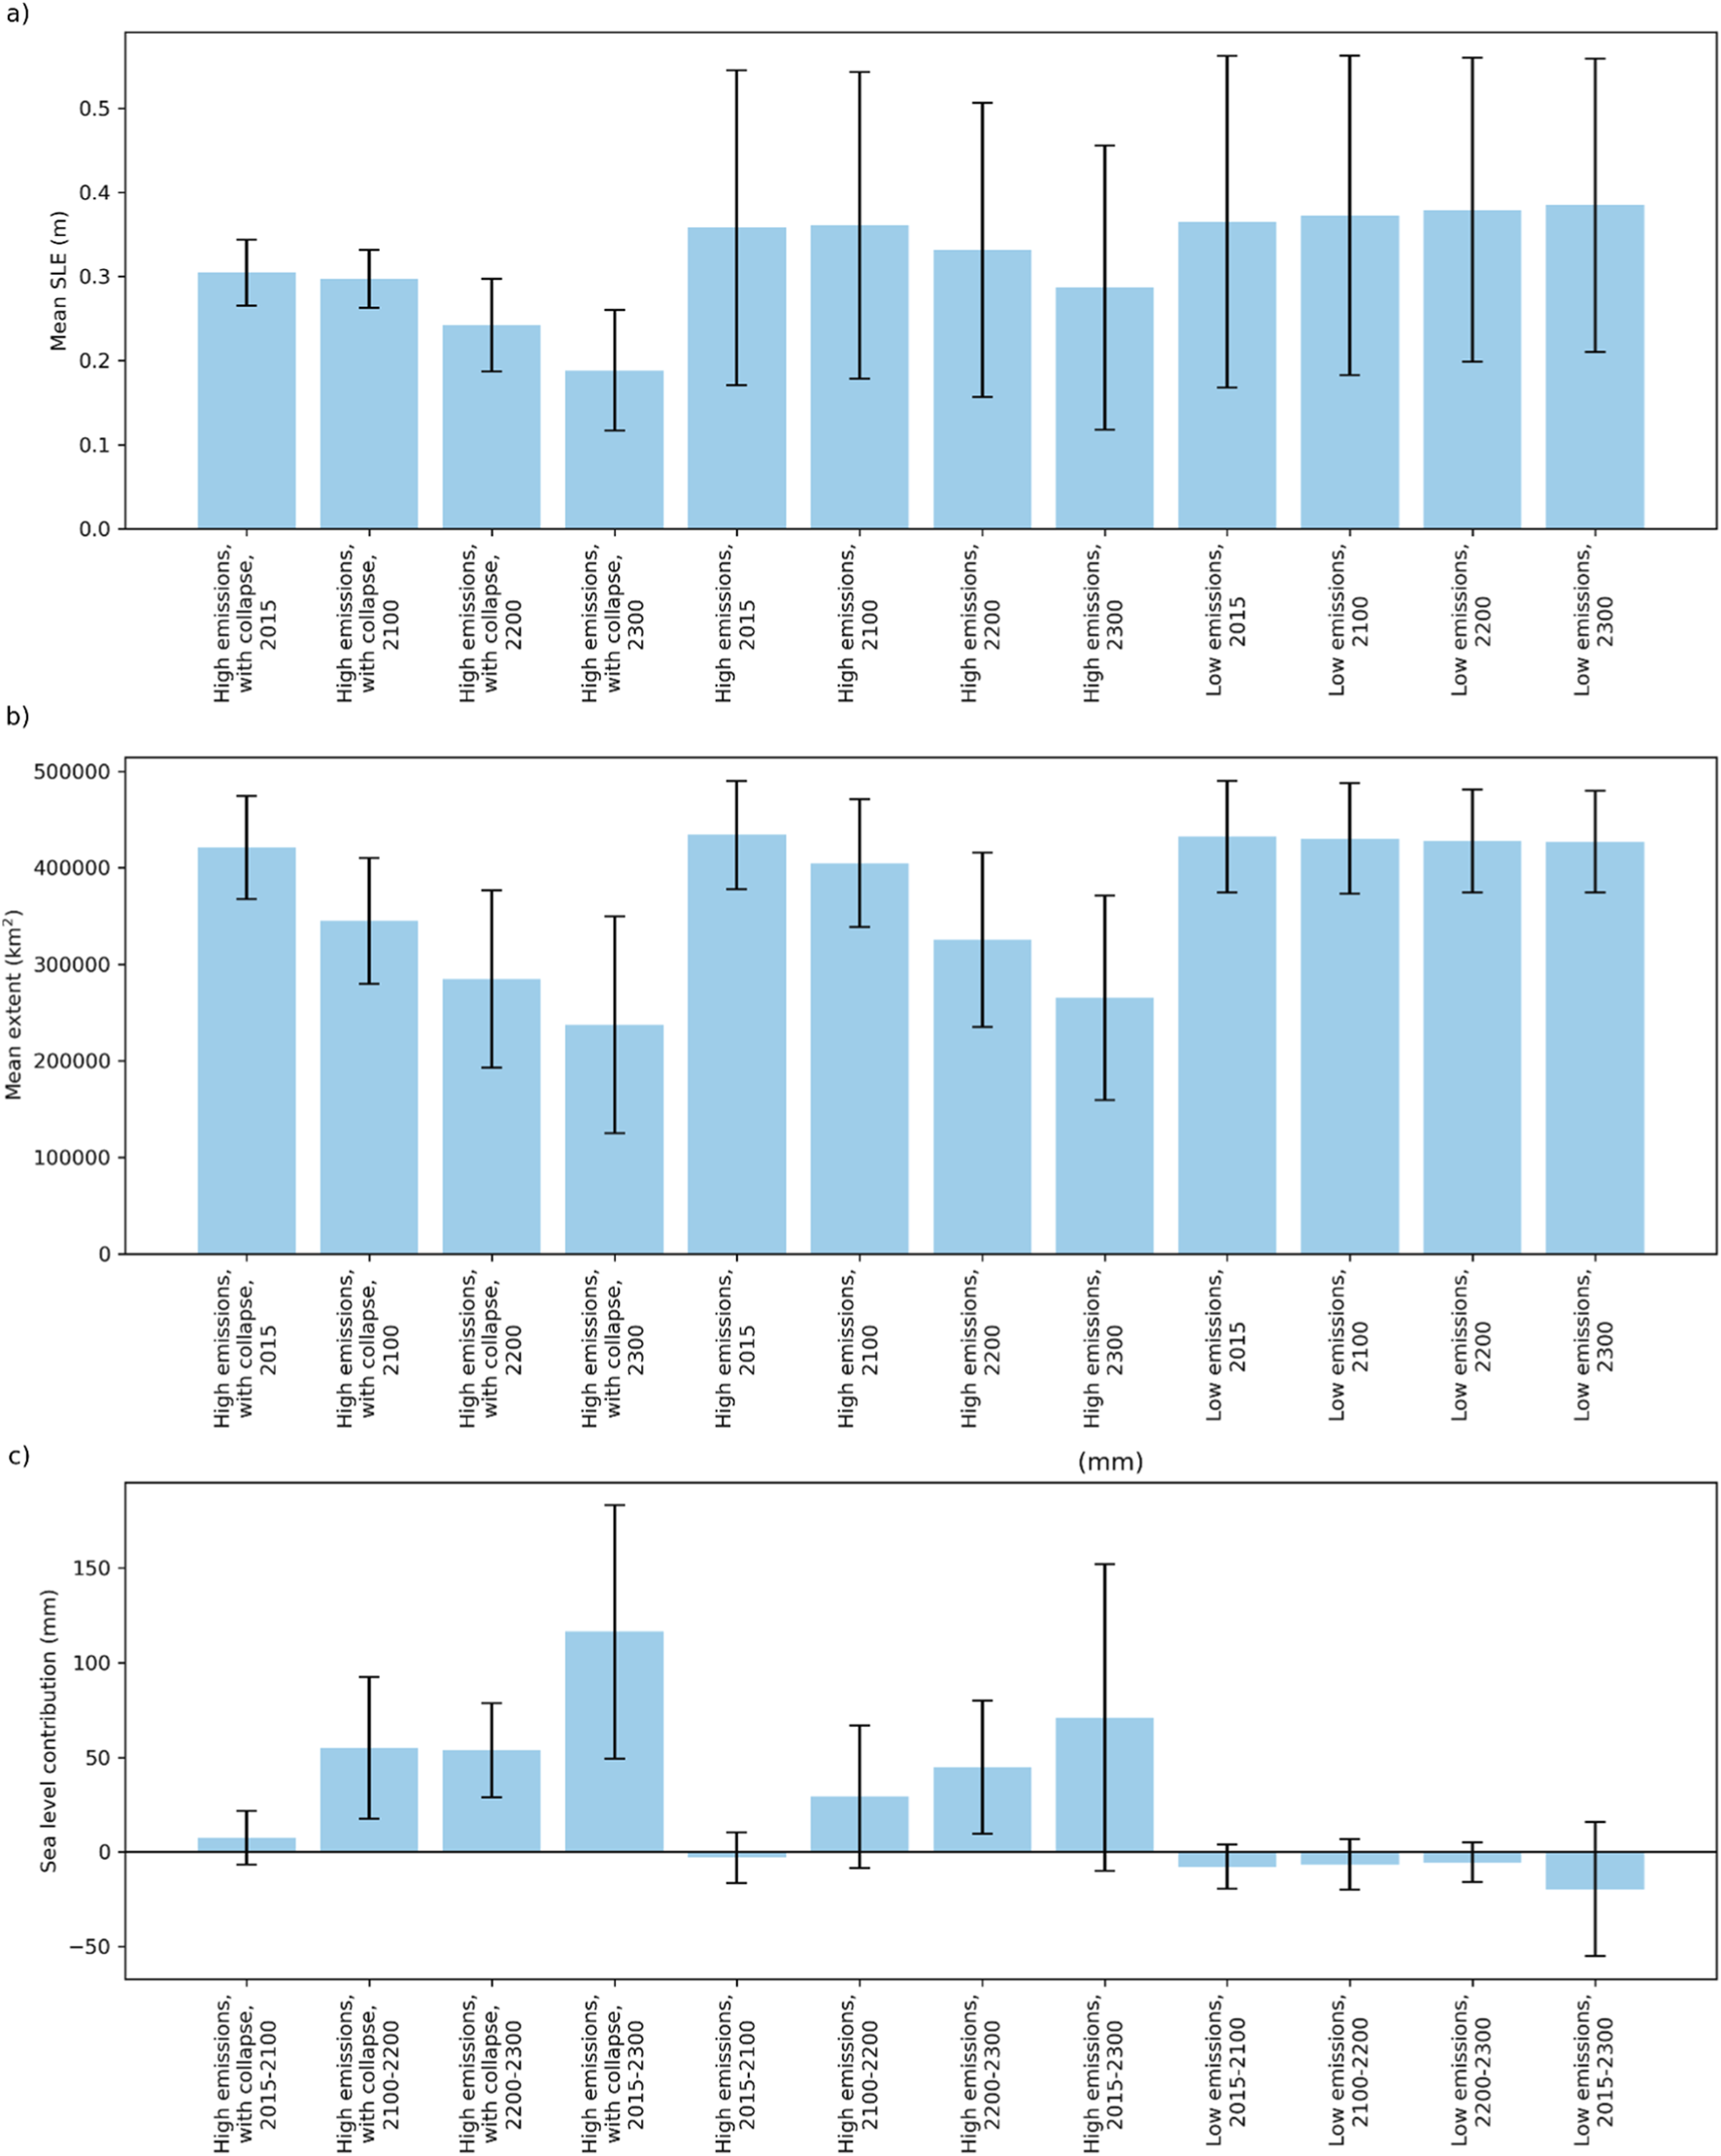
ISMIP6 multi-model projections for the Antarctic Peninsula region. (a) Ensemble means and standard deviations of ice volume above flotation (sea level equivalent in m) under very high emissions with ice shelf collapse, very high emissions without ice shelf collapse, and low emissions scenarios, for the years 2015, 2100, 2200 and 2300 CE. (b) As (a) but for mean ice extent (km2). (c) Sea level contributions (mm) for each scenario and timestep, calculated as the mean differences and the standard deviation of the differences. Data from Seroussi et al. (2024). See Supplementary Tables S3, S4 for more information.
Marine ecosystems
Key physical-chemical drivers of change within marine ecosystems around the Antarctic Peninsula include warming atmospheric and oceanic temperatures, declines in ice, aragonite undersaturation and increasing extreme events such as storms and marine heatwaves (Schofield et al., 2024; Griffiths et al., 2024). For example, the retreat of glacier fronts in the western Antarctic Peninsula has resulted in a change from an ascidian-dominated fauna to a mixed fauna, driven by increased sedimentation rates (Sahade et al., 2015). These stressors impact on biota both directly (for instance, increasing adverse weather and flooding of penguin nest sites; Cimino et al., 2014) and indirectly, via changing light and nutrient supply which impact on the phytoplankton supply to the base of the food web (Hayward et al., 2025; Atkinson et al., 2025).
These impacts are frequently modelled or speculated upon, but the detail of projections in marine ecosystems is highly uncertain for two reasons. First, uncertainties in modelling future Antarctic Peninsula climate and sea ice propagate the uncertainties in food web dynamics (Ding et al., 2025). Second, species show variable degrees of resilience to change. Some species show a very limited ability to cope with even a 1 °C increase in water temperature, while others can tolerate greater increases (Peck, 2018; Clark et al., 2019). For instance, some species appear to have shifted their range southwards in response to warming (e.g., Pakhomov et al., 2002), while others have not (Tarling et al., 2018) or their shifts are decoupled from the pace of warming (Atkinson et al., 2022). However, there is considerable uncertainty due to experimental regimes that do not closely relate to the real world or the key life stages of marine fauna, and a broad lack of studies involving either multiple variables or multiple interacting species (Suckling et al., 2015; Peck, 2018; Morley et al., 2019).
Notwithstanding these caveats, CMIP6 projections under a very high emissions scenario project increases in phytoplankton around the Antarctic Peninsula (Fisher, 2024), with warming seabed temperatures projected to increase species richness east of the Antarctic Peninsula and decrease it to its west (Griffiths et al., 2017). Increased storminess in combination with warming is projected to enhance colonisation by currently non-native species such as those associated with drifting kelp rafts and floating plastic debris from further north, as well as from species commonly found in biofouling communities on ships (Barnes and Fraser, 2003; Fraser et al., 2018; McCarthy et al., 2019; Avila et al., 2020). At the same time, ranges of key pelagic species such as krill (Euphausia superba) and salps are projected to contract to the south (Chen et al., 2025), with the Antarctic continent and fringing shelves acting as a physical barrier to constrict available living space. Krill, which provide an important food source for whales, seals, and penguins, are dependent on winter sea ice as a nursery for their young. Range-expanding taxa and non-indigenous, invasive, species could become established in the west Antarctic Peninsula if factors that currently inhibit them (such as sea ice scour) are removed (Griffiths et al., 2024). Increased ice-free coastline due to loss of land ice in the Antarctic Peninsula could provide new habitats for colonisation by intertidal and shallow subtidal communities (ibid.).
The mechanisms by which invertebrates and their vertebrate predators respond to warming will reflect both their contrasting degrees of stenothermy and their trophic position. The more stenothermic invertebrates may need only modest degrees of warming to push them beyond their thermal limits, albeit with recent work describing a wide range of thermal sensitivity (Clark et al., 2019; Morley et al., 2024). Long-term (multi-year) field deployments of heated and non-heated benthic settlement plates have demonstrated variable influences on growth of different species and on interspecific competition (Ashton et al., 2017; Barnes et al., 2021), illustrating the multiple levels of complexity involved in predicting outcomes.
The warm-blooded predators, by contrast, are expected to be more resistant to these water temperature changes, but more sensitive to direct climate factors such as flooding of breeding colonies or reduction of sea ice substrate, coupled to indirect effects of climate mediated through changes in their prey (see Schofield et al., 2024). This interplay makes it challenging to project the futures of the suite of iconic species including penguins, albatrosses, seals, and whales, that vary both in their prey specialism and in their requirement for sea ice. Thus, for instance, a partial replacement of an ice- and krill dependent penguin species (Adélie penguin) with the non-ice-dependent gentoo penguin on the western Antarctic Peninsula (Herman et al., 2020), but whether this will continue depends also on the trajectory of krill, a major food source for these species, and the relative resistance of the species to variations in its supply. Finally, the 2022 CE sea ice record low in the Bellingshausen Sea region resulted in the regional breeding failure of emperor penguin colonies (Fretwell et al., 2023). It is therefore likely that changes in sea ice will negatively impact these iconic faunas, and sea ice loss could result in reduced survival capacity of some Antarctic species that depend on it (Abram et al., 2025).
Terrestrial ecosystems
Due to its warmer climate, the ice-free ground of the maritime Antarctic biological region, which includes the western Antarctic Peninsula, its offshore islands and the Scotia Arc archipelagos, is biologically richer and more diverse than the rest of the continent (Convey and Biersma, 2024). There are no resident terrestrial vertebrates other than the snowy sheathbill, a scavenging migratory bird species closely associated with marine vertebrate aggregations on land. The terrestrial fauna therefore consists entirely of invertebrates and is dominated by the microarthropod groups of mites and springtails and microinvertebrate groups of nematodes, tardigrades, and rotifers. Many of these are now known to be endemic to Antarctica, and often to specific smaller regions within the continent, and illustrate the long history of evolution in isolation and regionalisation of Antarctica’s terrestrial fauna (Convey et al., 2020).
Antarctic vegetation is dominated by lichens and mosses, the former similarly showing considerable levels of endemism (Øvstedal and Smith, 2001), while there is now also increasing evidence of microbial group endemism in Antarctica (e.g., diatoms, Verleyen et al., 2021). Thus, Antarctic terrestrial ecosystems are of considerable conservation importance in terms of the values recognised in the United Nations’ Convention on Biodiversity. The Peninsula region currently contains 32 Antarctic Specially Protected Areas (with further proposals in the process of assessment), of which three are entirely marine, with 16 on the Antarctic Peninsula, 13 on the South Shetland Islands and three on the South Orkney Islands (see https://www.ats.aq/devphBackEnd/StatusReport/pdf?lang=e). These are designated under the formal processes defined in the Protocol on Environmental Protection to the Antarctic Treaty, although it is recognised that the current area protection system in Antarctica is inadequate and unrepresentative (Coetzee et al., 2017) as well as having very little resilience in the face of climate change (Hughes et al., 2021).
Antarctic Peninsula terrestrial ecosystems face three primary contemporary challenges or threats, these being climate change (primarily related to warming and changes in precipitation form or amount), the anthropogenic introduction of non-native invasive species and the direct impacts of the expanding human footprint (e.g., station and facility construction, increased visitor numbers and visit locations, physical damage by vehicles and footfall) as a result of competition for use of the very limited total ice-free area available (Convey and Peck, 2019; Hughes et al., 2020; Hughes et al., 2025; Lee et al., 2022). If considered in isolation, many Antarctic terrestrial and freshwater species are likely to ‘benefit’ from current levels of warming (Convey, 2011) through the relaxation of developmental constraints imposed by low temperature and lack of liquid water availability, increases in the length and cumulative thermal energy receipt (‘day degrees’) of the summer biologically active season, and in the extent of available ice-free habitat. However, recent studies have highlighted that both microbial and invertebrate species may already be at increased risk of reaching their upper thermal limits, with increasingly frequent and more intense extreme climatic events (Misiak et al., 2020; Bahrndorff et al., 2025).
There is widespread expectation that vegetation extent will expand as a result of warming and increased water availability. However, this has only been explicitly demonstrated at local scales at two locations in the Peninsula region over the last 60 years, for the two native flowering plants (Parnikoza et al., 2009; Cannone et al., 2022) and a single functional group of bank-forming mosses (Cannone et al., 2017). Warming is predicted to lead to an important change in reproductive strategy in some members of Antarctica’s dominant vegetation type, mosses, where currently the contribution of sexual reproduction (inherently creating increased genetic diversity) and the production of highly dispersive spores is generally limited compared to lower latitudes (Smith and Convey, 2002). A recent study on King George Island provides one of the first instances of observation of this change in the regionally widely distributed moss, Sanionia uncinata (De Vargas et al., 2024). Similarly, in the mid-1990s it was suggested that the frequency of successful seed maturation in the native grass, Deschampsia antarctica, had already increased, supporting the local expansion of populations of the species (Convey, 1996), although no more recent studies monitoring this appear to be available.
The potential for remote sensing approaches to assess Antarctic vegetation extent has recently led to the first attempt to provide a vegetation map of the entire continent (Walshaw et al., 2024), which it is accepted will develop further in future. However, recent claims based on satellite data alone since the mid-1980s (Roland et al., 2024) have proved contentious, claiming greater than an order of magnitude (x14) increase in extent over the entire Antarctic Peninsula and South Shetland Islands, claims which lack biological realism (Colesie et al., 2025). The latter authors conclude that, at present, any overall vegetation expansion in this region (referred to as ‘greening’ in the publication and media reports, although this term has been taken from the Arctic literature, where it precisely refers to a different process in detail) is, at most, a tiny fraction of that claimed and, at present, may not even be demonstrable.
The change in precipitation from snow to predominantly rain in an extending proportion of the summer, while directly promoting biological activity, also brings risks of flooding or washing out of terrestrial ecosystems (comparable to the negative impacts of flooding on penguin rookeries noted above). It can also accelerate snow loss from glacial surfaces, changing the extent and timing of availability of habitat for snow algae, which are important Peninsula primary producers (Gray et al., 2021). As significant rainfall events extend later into the autumn and earlier in the spring period, the phenomenon of ‘rain-on-snow’ events, previously not considered in Antarctic biological research, becomes an increasingly likely expectation. In the High Arctic (e.g., Svalbard), these events have become increasingly frequent during the winter months, resulting in the formation of thick and impermeable ice layers either within the snow pack or on the ground surface (Pedersen et al., 2022). These events have wide ranging deleterious consequences, including direct damage to or loss of vegetation and contained invertebrate fauna through ice encasement, anoxia in underlying substrates, and restricted access to winter forage for grazing vertebrates. Although the latter is not pertinent to the Antarctic Peninsula region, most of these consequences are likely to apply and provide a new and unquantified threat to the region’s terrestrial ecosystems.
A recent continental North American study has identified a related issue with potential Antarctic relevance: Thompson et al. (2025) highlight the negative consequences for insects of the loss of the ‘subniveum’, a thermally buffered habitat between the surface snow layer and the underlying ground, which some species rely on for survival overwinter. This sub-snow habitat certainly exists in Antarctica and is documented to promote microbial activity in the spring shoulder season as melt commences (Cockell et al., 2002). Its loss, which could result from various reasons including winter thaws, rain-on-snow events or failure to form due to changed distribution or timing of snow accumulation in the early stages of winter (see Coulson et al. (2023) for an example from High Arctic Svalbard), exposes the soil surface habitat and its contained invertebrates to much more extreme and variable temperatures than in snow-buffered habitats, in some cases breaching their thermal tolerance limits.
The entire maritime Antarctic is an important region for breeding penguins and other seabirds, as well as seals. While these are considered under marine ecosystems above, they provide an important mechanism of transfer of marine-derived nutrients to terrestrial ecosystems, where they are recognised as a key driver leading to “hotspots” of terrestrial diversity; thus, future changes in distribution or numbers of these marine species are expected to have knock-on consequences for neighbouring terrestrial ecosystems and their biodiversity (Bokhorst et al., 2019; Convey and Biersma, 2024).
Implications for operations
The overwhelming majority of Antarctic tourism activities and most krill fishing occur in the Peninsula region, alongside scientific activities undertaken by at least 19 countries involving 44 research facilities (COMNAP, 2017; Senigaglia et al., 2025). These activities are already being impacted by extreme events (Gorodetskaya et al., 2023). With increasing geopolitical interest, Antarctic infrastructure development is likely to expand further, and permanent human settlements may develop to serve existing and emerging industries (Chown et al., 2012; Lee et al., 2022; Liggett et al., 2017; Hemmings and Koivurova, 2023; Siegert et al., 2025). Climate change will increasingly impact built infrastructure, including research stations, ice and rock airstrips, wharves and historic sites (Brooks et al., 2019). Increasing fractions of precipitation falling as rain (cf. Tables 3, 4) challenge Antarctic clothing and tents, which are not designed to be waterproof, and refreezing rain impacts airstrips. Extreme sea ice lows can result in the loss of stable landfast ice, impeding Antarctic operations (Doddridge et al., 2025). Coastal erosion, ice recession and changes in sea level, surface runoff and sea ice extent/thickness may necessitate changes in infrastructure location (COMNAP, 2025). Increasing temperatures, permafrost melt, rainfall and extreme weather events will drive changes in infrastructure design (Siegert et al., 2023). Sea ice decline will facilitate ship access to new areas, possibly accelerating the increase in human footprint and environmental impacts including maritime incidents (Tin et al., 2009; Steiner et al., 2021).
On southern Alexander Island and George VI Ice Shelf, increasing surface melt, also initiating earlier in the season, has compromised operational ability to access and maintain long-term year-round biological microclimate monitoring stations that were installed at Mars Oasis in the late 1990s. These represent one of very few such year-round data records in the Peninsula region (Convey et al., 2018), but the Mars Oasis site has not been successfully accessed since 2018 CE. Conversely, glacier recession may expose increased bare ground suitable for colonisation by terrestrial biota, which, when combined with a maturing Antarctic tourism market and anticipated growth of tourist landings in the next decade (cf. Liggett et al., 2017), may lead to a greater probability of non-native species introduction.
Research stations have long been recognised as a clear way of demonstrating “effective presence” in Antarctica and, alongside its accessibility and increasing fishing pressure, the Antarctic Peninsula region will remain a geopolitical hotspot (Vidal, 2023). Some nations are likely to invest further in the region, with base upgrades and fleet development, both for scientific and presence purposes. Others may seek to generate income by sub-letting space at their bases to newer members of the Treaty, or by developing infrastructure to support commercial tourism. Following the temporary hiatus caused by the global COVID-19 pandemic, Antarctic tourism has resumed an exponentially increasing trajectory. Furthermore, the waters around the Peninsula are attracting increasing krill fishing (Kawaguchi et al., 2024). Whatever climate change scenarios are considered, it is likely that the Antarctic Treaty and associated legal instruments, including the CAMLR Convention, will be placed under further stress.
Discussion and conclusion
The future of the Antarctic Peninsula depends strongly on choices made today. Already, changes are occurring rapidly in the region, including a warming climate, increasingly frequent extreme warm events, increased precipitation and change in form, increased surface melt, reduced sea ice extent, ice-shelf collapse, and glaciers that are accelerating, thinning and retreating. Mass loss from the Peninsula is increasing, despite increasing snowfall, with sustained retreat of marine-terminating glaciers. The Peninsula is warming faster than the global average, and has already surpassed 1.5 °C of warming since preindustrial temperatures. There is scope for abrupt change across a range of systems (Abram et al., 2025), which challenges endemic species, can facilitate potentially irreversible change on human timescales, and impedes adaptation in polar logistics. Across all scenarios, but especially in the higher emissions scenarios, the feedbacks and synergies between different aspects of the system will act to amplify the response to climate change, contributing to irreversibility and hampering adaptation and mitigation.
The current record of Antarctic extreme events marks what the world at <1.5 °C of warming is already delivering, especially in the polar regions impacted by polar amplification. Policies and commitments as of 2025 are only enough for a 66% likelihood of keeping warming below 2.8 °C (range 1.9 °C–3.3 °C) over this century, and the likelihood of remaining below 1.5 °C of warming is 0% (United Nations Environment Programme, 2025). As the world edges toward 2 °C–3 °C within this century and beyond, we can expect extreme event intensity and frequency to further increase, building environmental stresses in ways not experienced in the observational record. The damage to pristine systems would likely be severe and perhaps irreversible. Limiting that damage to the levels we have already experienced is possible, however, by restricting global warming to the 1.5 °C level, as set out in the Paris Climate Agreement in 2015, even though we are already almost at that point.
Across the system, lower-emissions scenarios such as SSP 1–2.6 result in modest changes in sea ice, ice shelves, and land ice (Table 4; Figure 7). Combined with effective Antarctic governance, this pathway would result in increased resilience in the Antarctic Peninsula region. ISMIP6 models predict a small mass gain on the Peninsula under the low emission scenario (Figure 2), driven by increased snowfall (Seroussi et al., 2024). However, these ensemble means have a wide range and high uncertainty over the Peninsula, and it is unlikely that the current trends of mass loss would be reversed, especially since the CMIP6 model projections (Table 4) predict only a very modest increase in precipitation over the Peninsula. Over the longer term, it is likely that even these low-emission scenarios would result in significant sea-level contributions from ice sheets (Stokes et al., 2025). This scenario would see the Peninsula largely remaining recognisable compared with today, with only modest changes in sea ice, minimal decreases in firn air content on ice shelves leading to limited risk of hydrofracturing (Table 4) and limited extreme events. Operations in the region should account for increased extreme events and increased probability of extreme warm events and increased precipitation falling as rain.
FIGURE 7
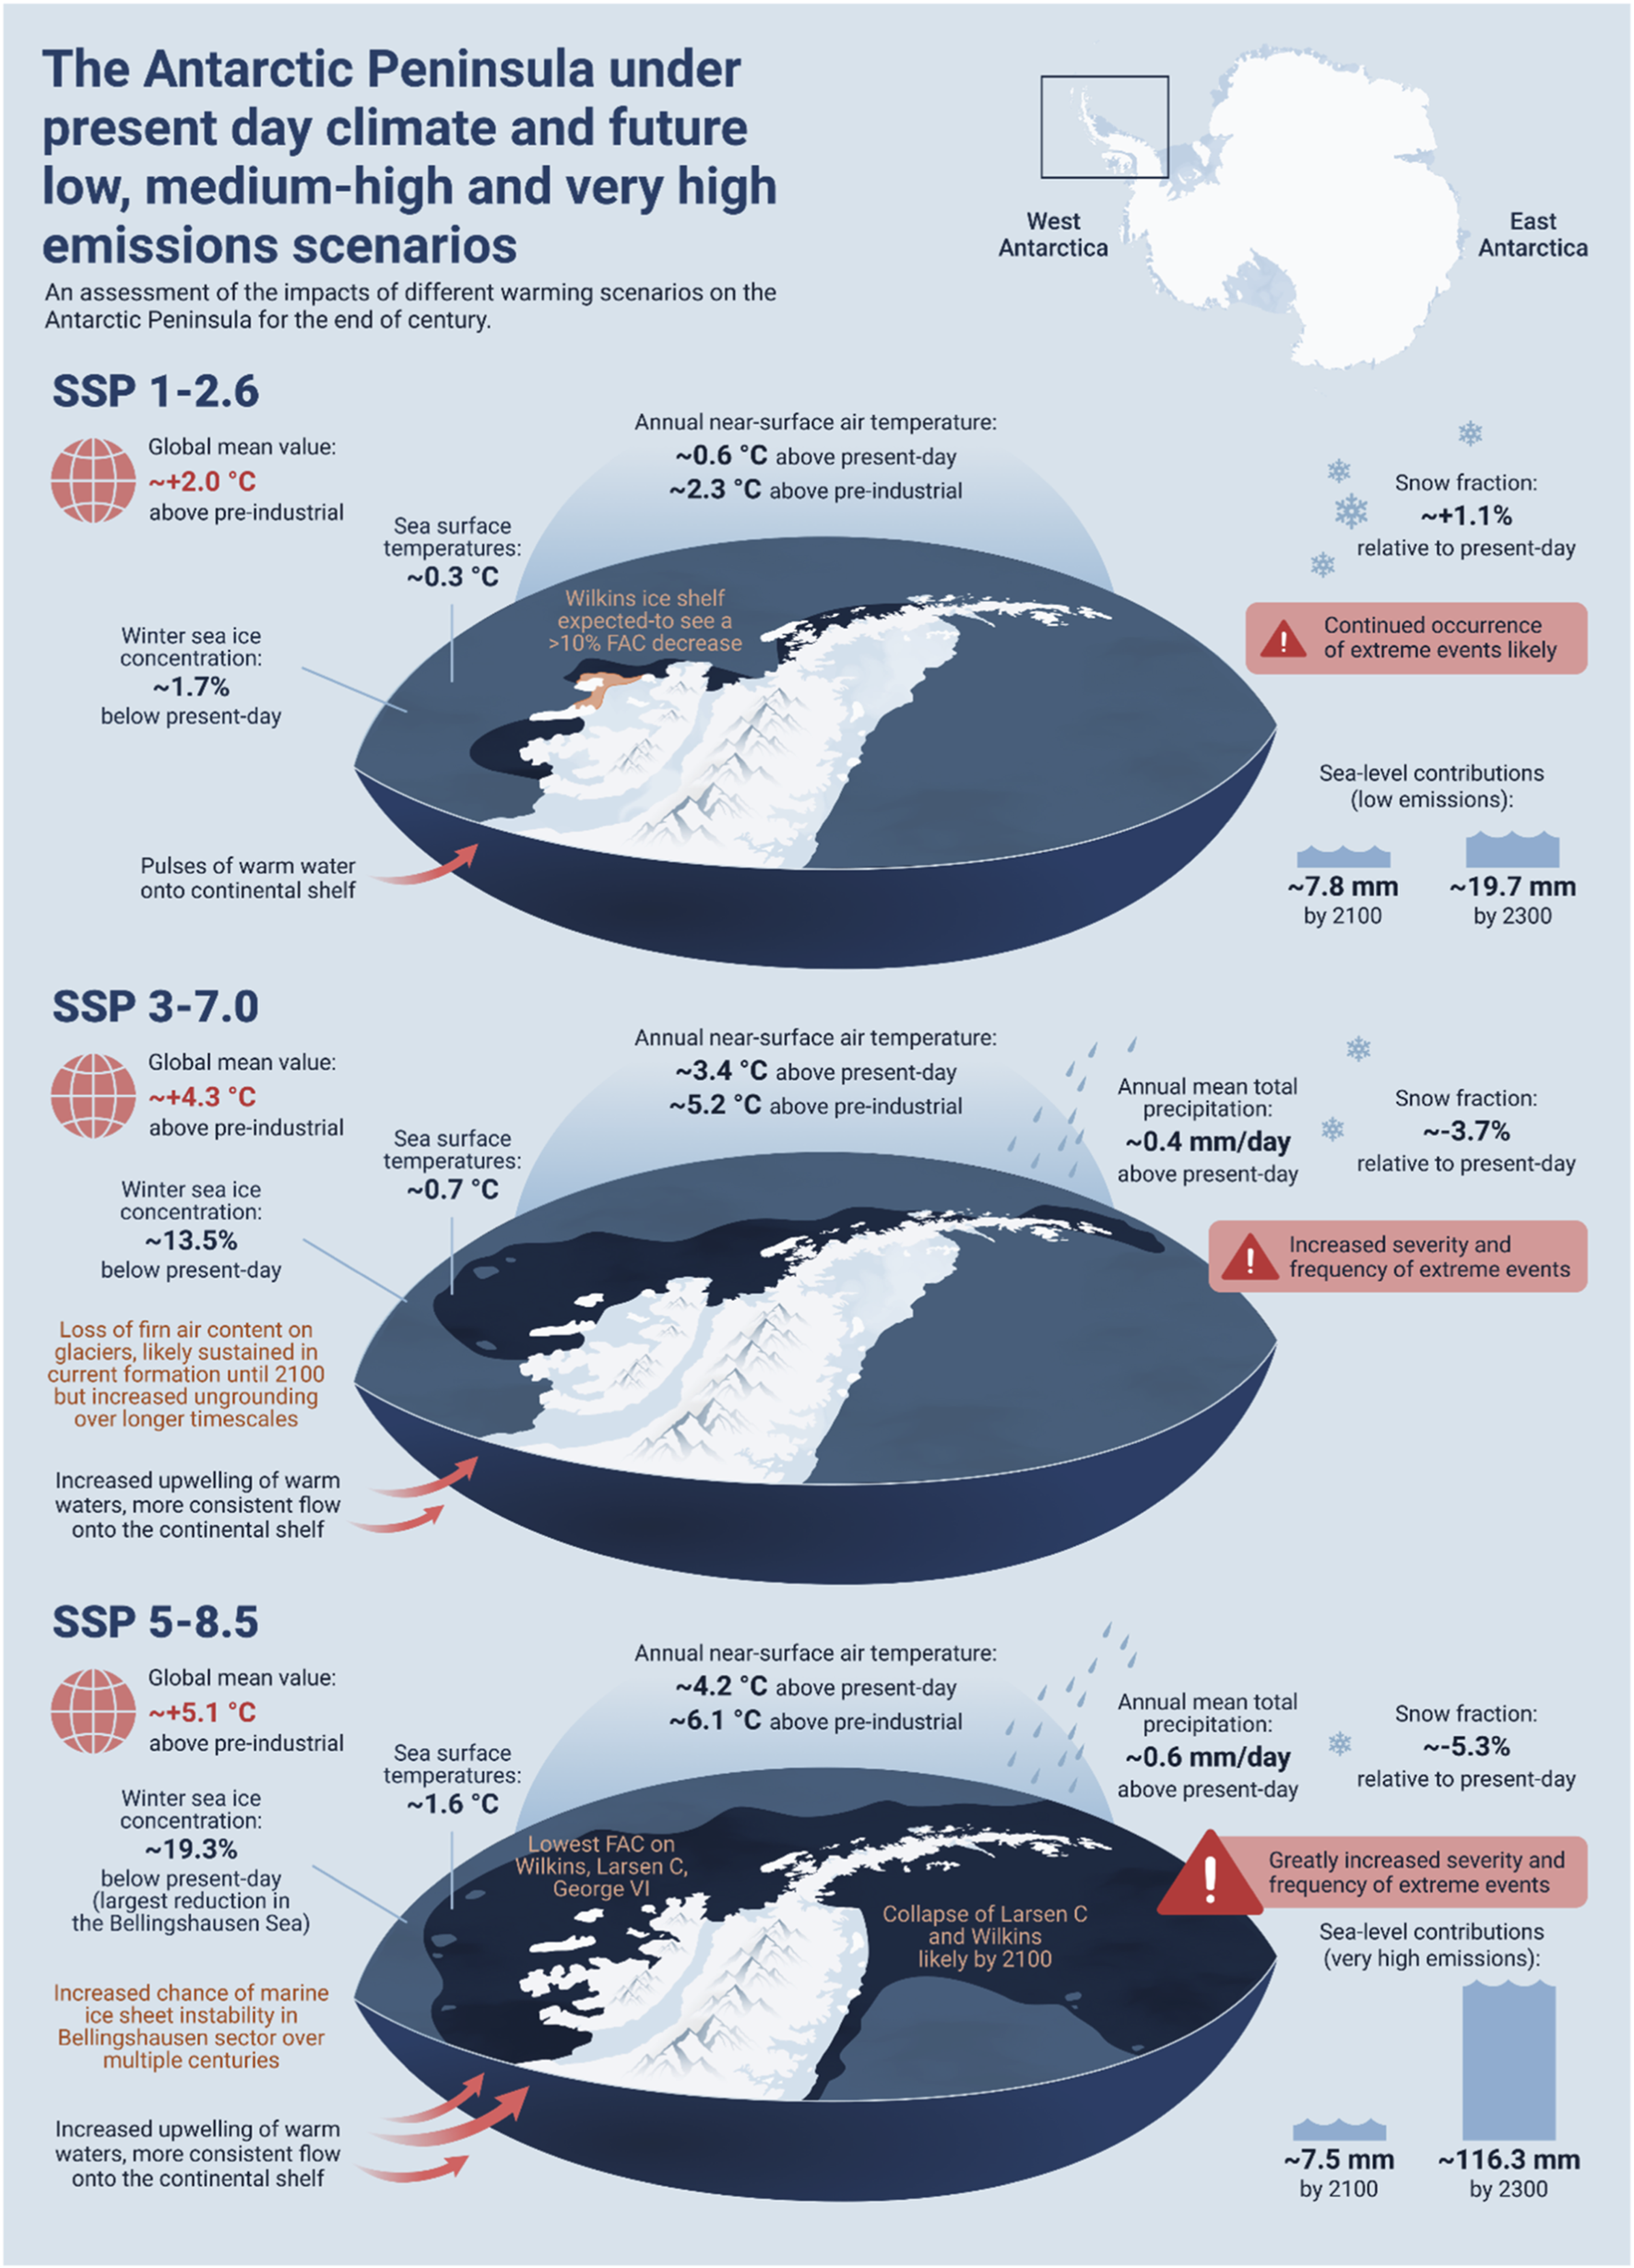
Schematic illustration of how the Peninsula will change under different climate change scenarios. See details in Table 4.
The mid-range scenario of SSP 3–7.0, which has most affinity with current global policies, would likely see ocean warming and increased intensification of warm water upwelling, increased loss of sea ice, particularly in the Bellingshausen Sea, increased surface meltwater, and outlet glacier grounding line recession (Table 4; Figure 7), though further and more detailed land-ice simulations under this SSP are needed. This scenario would see a greater fraction of snow falling as rain, especially in the summer (Table 3), and temperatures rising across the Peninsula, increasingly above 0 °C in the summer. This scenario, closest to our current trajectory, would see sustained ice loss at a faster rate than present, considerable and practically irreversible changes to habitats, infrastructure damage and challenges to the operational environment.
Higher emission scenarios such as SSP 5–8.5 would result in long-term and interrelated changes in the Antarctic Peninsula, which are irreversible on human timescales. Significant ice shelf thinning would weaken their buttressing effect on upstream ice streams and glaciers and likely drive significant ice loss, particularly in southern parts of the Peninsula. Ice-shelf collapse would dramatically and irreversibly increase the volume of land-ice lost from the Peninsula by 2300 CE. Glacier recession and increased exposure of ice-free land would drive ecological challenges, likely exacerbated by a considerable increase in human-assisted establishment of invasive species. Darkening of the ocean due to decreased sea ice, particularly in the Bellingshausen Sea and the southern Weddell Sea, would accelerate ocean warming, and ocean warming and reduced sea ice would likely exacerbate calving and mass loss from marine terminating glaciers. Under SSP 5–8.5, the number of days on the Peninsula above 0 °C would increase from 19.68 days (2015–2024 CE) to 48.08 days (2090–2099 CE) (Tables 3, 4). The frequency and intensity of extreme events such as atmospheric and oceanic heat waves and atmospheric rivers bringing anomalous precipitation would likely increase, challenging the operational environment. Warmer air temperatures mean an increased likelihood of liquid precipitation that can subsequently refreeze should be accounted for in planning logistics, especially for air transport. Increased calving and iceberg discharge and unpredictable sea ice conditions may challenge shipping. The Antarctic Peninsula under this scenario would be very different, with significant impacts on marine and terrestrial biodiversity as well as human operations.
Overall, it remains challenging to predict with confidence the future ice loss from grounded land ice and ice shelves across the Antarctic Peninsula, and this remains a driver of deep uncertainty in projected ice loss (Seroussi et al., 2024; Fricker et al., 2025). More detailed and higher resolution numerical modelling climate and ice-flow experiments are needed for increased confidence, particularly focusing on the specific Antarctic Peninsula domain, to capture its complex topography and the influence of ice shelf collapse, changing sea-ice buttressing and ocean heating. More detailed topographic surveys in this area would support ice sheet model initialisation and higher confidence predictions. The recent record lows in Antarctic sea ice extent highlight limitations in the ability of current climate models to capture this observed variability. The impact of sea ice lows, ice shelf collapse, grounding line recession and the exposure of new coastline needs more detailed study under higher resolution models that capture the relevant processes and ecological impacts of the Peninsula. These studies should take advantage of Regional Climate Models (RCMs) to adequately capture surface mass balance at the Peninsula scale, and coupled ice-ocean models that simulate processes such as ice shelf collapse, landfast sea-ice buttressing, and ocean-ice interactions. These numerical experiments would aid the understanding of freshwater fluxes to the ocean and how changes in the Antarctic Peninsula impact other parts of the climate and ecosystem. Changes in the Antarctic Peninsula region are also likely to influence other parts of the Antarctic system. For example, increased glacial runoff from the Peninsula propagates via a coastal boundary current, leading to enhanced basal melt rates of the West Antarctic ice shelves in the Amundsen and Bellingshausen seas (Flexas et al., 2022).
Despite these uncertainties, following a low-emissions pathway is crucial for protecting the Antarctic Peninsula. The higher emissions pathways, such as SSP 3–7.0 and 5–8.5 considered here, would result in dramatic and irreversible changes to the Peninsula, damaging its charismatic wildlife and unique ecosystems, contributing to sea level rise and resulting in significant operational challenges in a region that is increasingly of global geopolitical interest and competition. Urgent actions towards maintaining global temperatures as far below 2 °C and as close to 1.5 °C of warming as possible, well below the levels outlined in SSP 3–7.0, are needed to avoid these devastating changes in this vulnerable polar region. This requires global movement and cooperation towards a sustainable path. The choices made in this decade will determine which scenario is followed.
Statements
Author contributions
BD: Conceptualization, Data curation, Formal Analysis, Writing – original draft, Writing – review and editing. AA: Conceptualization, Writing – original draft, Writing – review and editing. AB: Conceptualization, Writing – original draft, Writing – review and editing. MB: Writing – original draft, Writing – review and editing. TCH: Data curation, Formal Analysis, Writing – original draft. PC: Writing – original draft, Writing – review and editing. JeR: Writing – original draft, Writing – review and editing. KD: Writing – original draft, Writing – review and editing. RD: Conceptualization, Writing – original draft, Writing – review and editing. TE: Writing – original draft, Writing – review and editing. EG: Writing – original draft, Writing – review and editing. BH: Writing – original draft, Writing – review and editing. KH: Writing – original draft, Writing – review and editing. GM: Data curation, Formal Analysis, Writing – original draft, Writing – review and editing. AO: Data curation, Formal Analysis, Writing – original draft, Writing – review and editing. JoR: Writing – original draft, Writing – review and editing. HS: Data curation, Formal Analysis, Writing – original draft, Writing – review and editing. MS: Writing – original draft, Writing – review and editing. JS: Data curation, Formal Analysis, Writing – original draft, Writing – review and editing. JuR: Conceptualization, Funding acquisition, Writing – original draft, Writing – review and editing.
Funding
The author(s) declared that financial support was received for this work and/or its publication. Financial support was provided by the FCDO Polar Regions Department. AO, EG and GM acknowledge funding from the PolarRES project, funded as part of the EU Horizon 2020 H2020-LC-CLA-2018–2019-2020 call under grant agreement number 101003590. AFB received support from the US National Science Foundation under awards 1841607 and 2213702 to the University of Colorado Boulder (PI Banwell). HS is supported by a grant from NASA Cryospheric Science Program (#80NSSC22K0383). This research was supported in part by grant NSF PHY-2309135 to the Kavli Institute for Theoretical Physics (KITP). PC and KH are supported by NERC core funding to the BAS “Biodiversity, Evolution and Adaptation Team” and Environment Office, respectively. JDR is supported by a UKRI Future Leaders Fellowship (grant no. MR/W011816/1). AA is supported by the Antarctic Wildlife Fund.
Acknowledgments
Stacey McCormack is acknowledged for the design and production of Figure 7. Two reviewers are thanked for their constructive comments that improved the manuscript.
Conflict of interest
The author(s) declared that this work was conducted in the absence of any commercial or financial relationships that could be construed as a potential conflict of interest.
The author MS declared that they were an editorial board member of Frontiers at the time of submission. This had no impact on the peer review process and the final decision.
Generative AI statement
The author(s) declared that generative AI was not used in the creation of this manuscript.
Any alternative text (alt text) provided alongside figures in this article has been generated by Frontiers with the support of artificial intelligence and reasonable efforts have been made to ensure accuracy, including review by the authors wherever possible. If you identify any issues, please contact us.
Publisher’s note
All claims expressed in this article are solely those of the authors and do not necessarily represent those of their affiliated organizations, or those of the publisher, the editors and the reviewers. Any product that may be evaluated in this article, or claim that may be made by its manufacturer, is not guaranteed or endorsed by the publisher.
Supplementary material
The Supplementary Material for this article can be found online at: https://www.frontiersin.org/articles/10.3389/fenvs.2025.1730203/full#supplementary-material
References
1
AbramN. J.PurichA.EnglandM. H.McCormackF. S.StrugnellJ. M.BergstromD. M.et al (2025). Emerging evidence of abrupt changes in the Antarctic environment. Nature644, 621–633. 10.1038/s41586-025-09349-5
2
AshtonG. V.MorleyS. A.BarnesD. K. A.ClarkM. S.PeckL. S. (2017). Warming by 1 °C drives species and assemblage level responses in Antarctica's marine shallows. Curr. Biol.27, 2698–2705. 10.1016/j.cub.2017.07.048
3
AtkinsonA.HillS. L.ReissC. S.PakhomovE. A.BeaugrandG.TarlingG. A.et al (2022). Stepping stones towards Antarctica: switch to southern spawning grounds explains an abrupt range shift in krill. Glob. Change Biol.28, 1359–1375. 10.1111/gcb.16009
4
AtkinsonA.PakhomovE.LaurensonA.SullivanE.BrewinR.HolmesC.et al (2025). Implications of the recent loss of Antarctic sea ice for phytoplankton and summer feeding habitats of salps and krill. Mar. Ecol. Prog. Ser.774, 1–16. 10.3354/meps15002
5
AvilaC.Angulo-PrecklerC.Martín-MartínR. P.FiguerolaB.GriffithsH. J.WallerC. L. (2020). Invasive marine species discovered on non–native kelp rafts in the warmest Antarctic island. Sci. Rep.10, 1639. 10.1038/s41598-020-58561-y
6
BahrndorffS.ConveyP.ChownS. L.SørensenJ. G. (2025). Polar ectotherms more vulnerable to warming than expected. Trends Ecol. and Evol.40, 619–621. 10.1016/j.tree.2025.04.008
7
BamberJ. L.OppenheimerM.KoppR. E.AspinallW. P.CookeR. M. (2019). Ice sheet contributions to future sea-level rise from structured expert judgment. Proc. Natl. Acad. Sci.116, 11195–11200. 10.1073/pnas.1817205116
8
BanwellA. F.MacAyealD. R.SergienkoO. V. (2013). Breakup of the Larsen B ice shelf triggered by chain reaction drainage of supraglacial lakes. Geophys. Res. Lett.40, 5872–5876. 10.1002/2013gl057694
9
BanwellA. F.DattaR. T.DellR. L.MoussaviM.BruckerL.PicardG.et al (2021). The 32-year record-high surface melt in 2019/2020 on the northern George VI Ice Shelf, Antarctic Peninsula. Cryosphere15, 909–925. 10.5194/tc-15-909-2021
10
BanwellA. F.WeverN.DunmireD.PicardG. (2023). Quantifying Antarctic-wide ice-shelf surface melt volume using microwave and firn model data: 1980 to 2021. Geophys. Res. Lett.50, e2023GL102744. 10.1029/2023gl102744
11
BanwellA. F.WillisI. C.StevensL. A.DellR. L.MacAyealD. R. (2024). Observed meltwater-induced flexure and fracture at a doline on George VI Ice Shelf, Antarctica. J. Glaciol.70, 1–14. 10.1017/jog.2024.31
12
BarnesD. K. A.FraserK. P. P. (2003). Rafting by five phyla on man-made flotsam in the Southern Ocean. Mar. Ecol. Prog. Ser.262, 289–291. 10.3354/meps262289
13
BarnesD. K. A.AshtonG. V.MorleyS. A.PeckL. S. (2021). 1 °C warming increases spatial competition frequency and complexity in Antarctic marine macrofauna. Commun. Biol.4, 208. 10.1038/s42003-021-01742-w
14
BellR. E.BanwellA. F.TruselL. D.KingslakeJ. (2018). Antarctic surface hydrology and impacts on ice-sheet mass balance. Nat. Clim. Change8, 1044–1052. 10.1038/s41558-018-0326-3
15
BokhorstS.ConveyP.AertsR. (2019). Nitrogen inputs by marine vertebrates drive abundance and richness in Antarctic terrestrial ecosystems. Curr. Biol.29, 1721–1727.e1723. 10.1016/j.cub.2019.04.038
16
BoxallK.ChristieF. D. W.WillisI. C.WuiteJ.NaglerT. (2022). Seasonal land-ice-flow variability in the Antarctic Peninsula. Cryosphere16, 3907–3932. 10.5194/tc-16-3907-2022
17
BoxallK.ChristieF. D.WillisI. C.WuiteJ.NaglerT.ScheiblauerS. (2024). Drivers of seasonal land‐ice‐flow variability in the Antarctic Peninsula. J. Geophys. Res. Earth Surf.129, e2023JF007378. 10.1029/2023jf007378
18
BozkurtD.CarrascoJ. F.CorderoR. R.FernandoyF.Gómez-ContrerasA.CarrilloB.et al (2024). Atmospheric river brings warmth and rainfall to the northern Antarctic Peninsula during the mid-austral winter of 2023. Geophys. Res. Lett.51, e2024GL108391. 10.1029/2024GL108391
19
BrooksS. T.JabourJ.Van Den HoffJ.BergstromD. M. (2019). Our footprint on Antarctica competes with nature for rare ice-free land. Nat. Sustain.2, 185–190. 10.1038/s41893-019-0237-y
20
BrownM. S.MunroD. R.FeehanC. J.SweeneyC.DucklowH. W.SchofieldO. M. (2019). Enhanced oceanic CO2 uptake along the rapidly changing West Antarctic Peninsula. Nat. Clim. Change9, 678–683. 10.1038/s41558-019-0552-3
21
CaiW.GaoL.LuoY.LiX.ZhengX.ZhangX.et al (2023). Southern Ocean warming and its climatic impacts. Sci. Bull.68, 946–960. 10.1016/j.scib.2023.03.049
22
CannoneN.Dalle FratteM.ConveyP.WorlandM. R.GuglielminM. (2017). Ecology of moss banks on Signy Island (maritime Antarctic). Botanical J. Linn. Soc.184, 518–533. 10.1093/botlinnean/box040
23
CannoneN.MalfasiF.Favero-LongoS. E.ConveyP.GuglielminM. (2022). Acceleration of climate warming and plant dynamics in Antarctica. Curr. Biol.32, 1599–1606.e2. 10.1016/j.cub.2022.01.074
24
CarrascoJ. F.BozkurtD.CorderoR. R. (2021). A review of the observed air temperature in the Antarctic Peninsula. Did the warming trend come back after the early 21st hiatus?Polar Sci.28, 100653. 10.1016/j.polar.2021.100653
25
ChenZ.ChenX.ZhuG. (2025). Ecological niche and habitat use of Antarctic krill (Euphausia superba) and the pelagic tunicate (Salpa thompsoni) under future climate change: further overlap or separation?Biodivers. Conservation34, 1771–1792. 10.1007/s10531-025-03042-9
26
ChownS. L.LeeJ. E.HughesK. A.BarnesJ.BarrettP.BergstromD. M.et al (2012). Challenges to the future conservation of the Antarctic. Science337, 158–159. 10.1126/science.1222821
27
ChristieF. D. W.BenhamT. J.BatchelorC. L.RackW.MontelliA.DowdeswellJ. A. (2022). Antarctic ice-shelf advance driven by anomalous atmospheric and sea-ice circulation. Nat. Geosci.15, 356–362. 10.1038/s41561-022-00938-x
28
CiminoM. A.FraserW. R.Patterson-FraserD. L.SabaV. S.OliverM. J. (2014). Large-scale climate and local weather drive interannual variability in Adélie penguin chick fledging mass. Mar. Ecol. Prog. Ser.513, 253–268. 10.3354/meps10928
29
ClarkM. S.Villota NievaL.HoffmanJ. I.DaviesA. J.TrivediU. H.TurnerF.et al (2019). Lack of long-term acclimation in Antarctic encrusting species suggests vulnerability to warming. Nat. Commun.10, 3383. 10.1038/s41467-019-11348-w
30
ClemK. R.BozkurtD.KennettD.KingJ. C.TurnerJ. (2022). Central tropical Pacific convection drives extreme high temperatures and surface melt on the larsen C ice shelf, Antarctic Peninsula. Nat. Commun.13, 3906. 10.1038/s41467-022-31119-4
31
CockellC. S.RettbergP.HorneckG.Wynn-WilliamsD. D.SchererK.Gugg-HelmingerA. (2002). Influence of ice and snow covers on the UV exposure of terrestrial microbial communities: dosimetric studies. J. Photochem. Photobiol. B Biol.68, 23–32. 10.1016/s1011-1344(02)00327-5
32
CoetzeeB. W. T.ConveyP.ChownS. L. (2017). Expanding the protected area network in Antarctica is urgent and readily achievable. Conserv. Lett.10, 670–680. 10.1111/conl.12342
33
ColesieC.GrayA. M.WalshawC. V.BokhorstS.KerbyJ. T.JawakS.et al (2025). Is Antarctica greening?Glob. Change Biol.31, e70294. 10.1111/gcb.70294
34
COMNAP (2017). Antarctic station catalogue, in: SecretariatC. (Ed.), Christchurch, New Zealand, 154. Available online at: https://www.comnap.aq/antarctic-facilities-information Accessed January 7th, 2026.
35
COMNAP (2025). “Built infrastructure in a changing Antarctica – an early assessment,” Milan, Italy. Work. Pap. 5, Antarct. Treaty Consult. Meet. 47.
36
ConveyP. (1996). Reproduction of Antarctic flowering plants. Antarct. Sci.8, 127–134. 10.1017/s0954102096000193
37
ConveyP. (2011). Antarctic terrestrial biodiversity in a changing world. Polar Biol.34, 1629–1641. 10.1007/s00300-011-1068-0
38
ConveyP.BiersmaE. M. (2024). “Antarctic ecosystems,” in Encyclopedia of biodiversity. Editor ScheinerS. M.3rd Edition (Oxford: Academic Press), 133–148.
39
ConveyP.PeckL. S. (2019). Antarctic environmental change and biological responses. Sci. Adv.5, eaaz0888. 10.1126/sciadv.aaz0888
40
ConveyP.CoulsonS. J.WorlandM. R.SjöblomA. (2018). The importance of understanding annual and shorter-term temperature patterns and variation in the surface levels of polar soils for terrestrial biota. Polar Biol.41, 1587–1605. 10.1007/s00300-018-2299-0
41
ConveyP.BiersmaE. M.Casanova-KatnyA.MaturanaC. S. (2020). “Chapter 10 - refuges of Antarctic diversity,” in Past Antarctica. Editors OlivaM.Ruiz-FernándezJ. (Academic Press), 181–200.
42
CookA. J.VaughanD. G. (2010). Overview of areal changes of the ice shelves on the Antarctic Peninsula over the past 50 years. Cryosphere4, 77–98. 10.5194/tc-4-77-2010
43
CookA. J.HollandP. R.MeredithM. P.MurrayT.LuckmanA.VaughanD. G. (2016). Ocean forcing of glacier retreat in the Western Antarctic Peninsula. Science353, 283–286. 10.1126/science.aae0017
44
CoulonV.De RydtJ.GregovT.QinQ.PattynF. (2024). Future freshwater fluxes from the Antarctic Ice Sheet. Geophys. Res. Lett.51, e2024GL111250. 10.1029/2024gl111250
45
CoulsonS. J.ConveyP.SchuuringS.LangS. I. (2023). Interactions between winter temperatures and duration of exposure may structure Arctic microarthropod communities. J. Therm. Biol.114, 103499. 10.1016/j.jtherbio.2023.103499
46
DalaidenQ.GoosseH.LenaertsJ. T. M.CavitteM. G. P.HendersonN. (2020). Future Antarctic snow accumulation trend is dominated by atmospheric synoptic-scale events. Commun. Earth and Environ.1, 62. 10.1038/s43247-020-00062-x
47
DavisonB. J.HoggA. E.GourmelenN.JakobL.WuiteJ.NaglerT.et al (2023). Annual mass budget of Antarctic ice shelves from 1997 to 2021. Sci. Adv.9, eadi0186. 10.1126/sciadv.adi0186
48
DavisonB. J.HoggA. E.MoffatC.MeredithM. P.WallisB. J. (2024). Widespread increase in discharge from west Antarctic Peninsula glaciers since 2018. Cryosphere18, 3237–3251. 10.5194/tc-18-3237-2024
49
De RydtJ.GudmundssonG. H.RottH.BamberJ. L. (2015). Modeling the instantaneous response of glaciers after the collapse of the larsen B Ice Shelf. Geophys. Res. Lett.42, 5355–5363. 10.1002/2015gl064355
50
de VargasN.SepúlvedaM.GuerreroA. I. (2024). Patterns of surface temperature and link to environmental variables in Weddell seals from the Western Antarctic Peninsula. Polar Biol.47, 629–637. 10.1007/s00300-024-03258-5
51
DellR. L.WillisI. C.ArnoldN. S.BanwellA. F.de Roda HusmanS. (2024). Substantial contribution of slush to meltwater area across Antarctic ice shelves. Nat. Geosci.17, 624–630. 10.1038/s41561-024-01466-6
52
DiamondR.SimeL. C.HolmesC. R.SchroederD. (2024). CMIP6 models rarely simulate Antarctic winter sea-ice anomalies as large as observed in 2023. Geophys. Res. Lett.51, e2024GL109265. 10.1029/2024gl109265
53
DingY. R.LiuX.DaiX. F.YangY.YinG. Y.SunH. P.et al (2025). Spatiotemporal analysis of sea ice in the Weddell Sea of Antarctic based on GTWR. Sci. Rep.15 (1), 5863. 10.1038/s41598-025-90106-z
54
DinnimanM. S.KlinckJ. M.HofmannE. E. (2012). Sensitivity of circumpolar deep water transport and ice shelf basal melt along the West Antarctic Peninsula to changes in the winds. J. Clim.25, 4799–4816. 10.1175/jcli-d-11-00307.1
55
DoakeC. S. M.CorrH. F. J.RottH.SkvarcaP.YoungN. W. (1998). Breakup and conditions for stability of the northern Larsen Ice Shelf, Antarctica. Nature391, 778–780. 10.1038/35832
56
DoddridgeE. W.HobbsW. R.AugerM.BoydP. W.ChuaS. M. T.CookS.et al (2025). Impacts of Antarctic summer sea-ice extremes. PNAS Nexus4, pgaf164. 10.1093/pnasnexus/pgaf164
57
DownieR. H.FretwellP. T. (2007). Antarctic Peninsula, encyclopedia of the Antarctic. New York: Routledge, 66–67.
58
DunmireD.WeverN.BanwellA. F.LenaertsJ. T. M. (2024). Antarctic-wide ice-shelf firn emulation reveals robust future firn air depletion signal for the Antarctic Peninsula. Commun. Earth and Environ.5, 100. 10.1038/s43247-024-01255-4
59
EdwardsT. L.NowickiS.MarzeionB.HockR.GoelzerH.SeroussiH.et al (2021). Projected land ice contributions to twenty-first-century sea level rise. Nature593, 74–82. 10.1038/s41586-021-03302-y
60
EnglandM. R.PolvaniL. M.ScreenJ.ChanA. C. (2025). Minimal Arctic Sea ice loss in the last 20 years, consistent with internal climate variability. Geophys. Res. Lett.52, e2025GL116175. 10.1029/2025gl116175
61
EtourneauJ.SgubinG.CrostaX.SwingedouwD.WillmottV.BarbaraL.et al (2019). Ocean temperature impact on ice shelf extent in the eastern Antarctic Peninsula. Nat. Commun.10, 304. 10.1038/s41467-018-08195-6
62
EyringV.BonyS.MeehlG. A.SeniorC. A.StevensB.StoufferR. J.et al (2016). Overview of the coupled model intercomparison project phase 6 (CMIP6) experimental design and organization. Geosci. Model Dev.9, 1937–1958. 10.5194/gmd-9-1937-2016
63
FeronS.CorderoR. R.DamianiA.MalhotraA.SeckmeyerG.LlanilloP. (2021). Warming events projected to become more frequent and last longer across Antarctica. Sci. Rep.11, 19564. 10.1038/s41598-021-98619-z
64
FisherB. J. (2024). Interactions of organic carbon and nitrogen cycles with phytoplankton in a changing Southern Ocean. Edinburgh: Edinburgh University. Unpublished PhD thesis.
65
FlexasM. M.ThompsonA. F.SchodlokM. P.ZhangH.SpeerK. (2022). Antarctic Peninsula warming triggers enhanced basal melt rates throughout West Antarctica. Sci. Adv.8, eabj9134. 10.1126/sciadv.abj9134
66
FogtR. L.MarshallG. J. (2020). The Southern Annular Mode: variability, trends, and climate impacts across the Southern hemisphere. Wiley Interdiscip. Rev. Clim. Change11, e652. 10.1002/wcc.652
67
FraserC. I.MorrisonA. K.HoggA. M.MacayaE. C.van SebilleE.RyanP. G.et al (2018). Antarctica’s ecological isolation will be broken by storm-driven dispersal and warming. Nat. Clim. Change8, 704–708. 10.1038/s41558-018-0209-7
68
FretwellP. T.BoutetA.RatcliffeN. (2023). Record low 2022 Antarctic sea ice led to catastrophic breeding failure of emperor penguins. Commun. Earth and Environ.4, 273. 10.1038/s43247-023-00927-x
69
FrickerH. A.Galton-FenziB. K.WalkerC. C.FreerB. I. D.PadmanL.DeContoR. (2025). Antarctica in 2025: drivers of deep uncertainty in projected ice loss. Science387, 601–609. 10.1126/science.adt9619
70
FrölicherT. L.FischerE. M.GruberN. (2018). Marine heatwaves under global warming. Nature560, 360–364. 10.1038/s41586-018-0383-9
71
FurstJ. J.DurandG.Gillet-ChauletF.TavardL.RanklM.BraunM.et al (2016). The safety band of Antarctic ice shelves. Nat. Clim. Change6, 479–482. 10.1038/nclimate2912
72
GarbeJ.ZeitzM.Krebs-KanzowU.WinkelmannR. (2023). The evolution of future Antarctic surface melt using PISM-dEBM-simple. Cryosphere17, 4571–4599. 10.5194/tc-17-4571-2023
73
GilbertE.HolmesC. (2024). 2023's Antarctic sea ice extent is the lowest on record. Weather79, 46–51. 10.1002/wea.4518
74
GilbertE.KittelC. (2021). Surface melt and runoff on Antarctic ice shelves at 1.5 C, 2 C, and 4 C of future warming. Geophys. Res. Lett.48 (8), e2020GL091733. 10.1029/2020gl091733
75
GilbertE.PishniakD.TorresJ. A.OrrA.MaclennanM.WeverN.et al (2025). Extreme precipitation associated with atmospheric rivers over West Antarctic ice shelves: insights from kilometre-scale regional climate modelling. Cryosphere19 (2), 597–618. 10.5194/tc-19-597-2025
76
GlasserN. F.ScambosT. A. (2008). A structural glaciological analysis of the 2002 Larsen B Ice Shelf collapse. J. Glaciol.54, 3–16. 10.3189/002214308784409017
77
GlasserN. F.KulessaB.LuckmanA.JansenD.KingE. C.SammondsP. R.et al (2009). Surface structure and stability of the larsen C Ice Shelf, Antarctic Peninsula. J. Glaciol.55, 400–410. 10.3189/002214309788816597
78
GolledgeN. R.KowalewskiD. E.NaishT. R.LevyR. H.FogwillC. J.GassonE. G. W. (2015). The multi-millennial Antarctic commitment to future sea-level rise. Nature526, 421. 10.1038/nature15706
79
Gómez-ValdiviaF.HollandP. R.SiahaanA.DutrieuxP.YoungE. (2023). Projected West Antarctic ocean warming caused by an expansion of the Ross Gyre. Geophys. Res. Lett.50, e2023GL102978. 10.1029/2023gl102978
80
González-HerreroS.BarriopedroD.TrigoR. M.López-BustinsJ. A.OlivaM. (2022). Climate warming amplified the 2020 record-breaking heatwave in the Antarctic Peninsula. Commun. Earth and Environ.3, 122. 10.1038/s43247-022-00450-5
81
GoodwinB. P.Mosley-ThompsonE.WilsonA. B.PorterS. E.Sierra-HernandezM. R. (2016). Accumulation variability in the antarctic peninsula: the role of large-scale atmospheric oscillations and their interactions. J. Clim.29, 2579–2596. 10.1175/jcli-d-15-0354.1
82
GorodetskayaI. V.Durán-AlarcónC.González-HerreroS.ClemK. R.ZouX.RoweP.et al (2023). Record-high Antarctic Peninsula temperatures and surface melt in February 2022: a compound event with an intense atmospheric river. Npj Clim. Atmos. Sci.6, 202. 10.1038/s41612-023-00529-6
83
GrayA.KrolikowskiM.FretwellP.ConveyP.PeckL. S.MendelovaM.et al (2021). Remote sensing phenology of Antarctic green and red snow algae using WorldView satellites. Front. Plant Sci.12, 671981. 10.3389/fpls.2021.671981
84
GriffithsH. J.MeijersA. J.BracegirdleT. J. (2017). More losers than winners in a century of future Southern Ocean seafloor warming. Nat. Clim. Change7, 749–754. 10.1038/nclimate3377
85
GriffithsH. J.CummingsV. J.Van de PutteA.WhittleR. J.WallerC. L. (2024). Antarctic benthic ecological change. Nat. Rev. Earth and Environ.5, 645–664. 10.1038/s43017-024-00583-5
86
GudmundssonG. H.PaoloF. S.AdusumilliS.FrickerH. A. (2019). Instantaneous Antarctic Ice Sheet mass loss driven by thinning ice shelves. Geophys. Res. Lett.46, 13903–13909. 10.1029/2019gl085027
87
GurumoorthiK.LuisA. J. (2025). Southern Ocean marine heatwaves: variability, hotspots and teleconnections. J. Oceanogr.10.1007/s10872-025-00769-5
88
HannaE.TopálD.BoxJ. E.BuzzardS.ChristieF. D.HvidbergC.et al (2024). Short-and long-term variability of the Antarctic and Greenland ice sheets. Nat. Rev. Earth and Environ.5, 193–210. 10.1038/s43017-023-00509-7
89
HaywardA.WrightS. W.CarrollD.LawC. S.WongpanP.Gutiérrez-RodriguezA.et al (2025). Antarctic phytoplankton communities restructure under shifting sea-ice regimes. Nat. Clim. Change15, 1–8. 10.1038/s41558-025-02379-x
90
HellmerH. H.KaukerF.TimmermannR.DetermannJ.RaeJ. (2012). Twenty-first-century warming of a large Antarctic ice-shelf cavity by a redirected coastal current. Nature485, 225–228. 10.1038/nature11064
91
HemmingsA. D.KoivurovaT. (2023). “International regulation of mineral resources activities in the polar regions,” in The Routledge Handbook of Polar Law. Editors TanakaY.JohnstoneR.UlfbeckV. (London: Routledge), 303–319.
92
HermanR.BorowiczA.LynchM.TrathanP.HartT.LynchH. (2020). Update on the global abundance and distribution of breeding Gentoo Penguins (Pygoscelis papua). Polar Biol.43 (12), 1947–1956. 10.1007/s00300-020-02759-3
93
HollandP. R.CorrH. F. J.PritchardH. D.VaughanD. G.ArthernR. J.JenkinsA.et al (2011). The air content of Larsen Ice Shelf. Geophys. Res. Lett.38. 10.1029/2011gl047245
94
HolmesC. R.BracegirdleT. J.HollandP. R.StroeveJ.WilkinsonJ. (2024). Brief communication: new perspectives on the skill of modelled sea ice trends in light of recent Antarctic sea ice loss. Cryosphere18, 5641–5652. 10.5194/tc-18-5641-2024
95
HubbardB.LuckmanA.AshmoreD. W.BevanS.KulessaB.Kuipers MunnekeP.et al (2016). Massive subsurface ice formed by refreezing of ice-shelf melt ponds. Nat. Commun.7, 11897. 10.1038/ncomms11897
96
HughesK. A.PescottO. L.PeytonJ.AdriaensT.Cottier-CookE. J.KeyG.et al (2020). Invasive non-native species likely to threaten biodiversity and ecosystems in the Antarctic Peninsula region. Glob. Change Biol.26, 2702–2716. 10.1111/gcb.14938
97
HughesK. A.ConveyP.TurnerJ. (2021). Developing resilience to climate change impacts in Antarctica: an evaluation of Antarctic Treaty system protected area policy. Environ. Sci. and Policy124, 12–22. 10.1016/j.envsci.2021.05.023
98
HughesK. A.ConveyP.LeeJ. R. (2025). Status assessment of non-native terrestrial species in Antarctica. NeoBiota98, 197–222. 10.3897/neobiota.98.139894
99
IPCC (2021). “Summary for policymakers,” in Climate change 2021: the physical science basis. Contribution of working group I to the sixth assessment report of the intergovernmental panel on climate change. Editors Masson-DelmotteV.ZhaiP.PiraniA.ConnorsS. L.PéanC.BergerS.et al (Cambridge, United Kingdom and New York, NY, USA: Cambridge University Press).
100
JenaB.KshitijaS.BajishC. C.TurnerJ.HolmesC.WilkinsonJ.et al (2024). Evolution of Antarctic sea ice ahead of the record low annual maximum extent in September 2023. Geophys. Res. Lett.51, e2023GL107561. 10.1029/2023GL107561
101
JourdainN. C.AmoryC.KittelC.DurandG. (2025). Changes in Antarctic surface conditions and potential for ice shelf hydrofracturing from 1850 to 2200. Cryosphere19, 1641–1674. 10.5194/tc-19-1641-2025
102
KawaguchiS.AtkinsonA.BahlburgD.BernardK. S.CavanE. L.CoxM. J.et al (2024). Climate change impacts on Antarctic krill behaviour and population dynamics. Nat. Rev. Earth and Environ.5, 43–58. 10.1038/s43017-023-00504-y
103
KingJ. C.BannisterD.HoskingJ. S.ColwellS. R. (2017a). Causes of the Antarctic region record high temperature at Signy Island, 30th January 1982. Atmos. Sci. Lett.18, 491–496. 10.1002/asl.793
104
KingJ. C.KirchgaessnerA.BevanS.ElvidgeA. D.Kuipers MunnekeP.LuckmanA.et al (2017b). The impact of föhn winds on surface energy balance during the 2010–2011 melt season over Larsen C Ice Shelf, Antarctica. J. Geophys. Res. Atmos.122 (12). 062-012,076. 10.1002/2017JD026809
105
KittelC.AmoryC.HoferS.AgostaC.JourdainN. C.GilbertE.et al (2022). Clouds drive differences in future surface melt over the Antarctic ice shelves. Cryosphere16, 2655–2669. 10.5194/tc-16-2655-2022
106
Kuipers MunnekeP.LigtenbergS. R. M.Van Den BroekeM. R.VaughanD. G. (2014). Firn air depletion as a precursor of Antarctic ice-shelf collapse. J. Glaciol.60, 205–214. 10.3189/2014jog13j183
107
KusaharaK.TatebeH.HajimaT.SaitoF.KawamiyaM. (2023). Antarctic ice-shelf holds the fate of antarctic ice-shelf basal melting in a warming climate. J. Clim.36, 713–743. 10.1175/jcli-d-22-0079.1
108
LaiC.-Y.KingslakeJ.WearingM. G.ChenP.-H. C.GentineP.LiH.et al (2020). Vulnerability of Antarctica’s ice shelves to meltwater-driven fracture. Nature584, 574–578. 10.1038/s41586-020-2627-8
109
LeeJ. R.TeraudsA.CarwardineJ.ShawJ. D.FullerR. A.PossinghamH. P.et al (2022). Threat management priorities for conserving Antarctic biodiversity. PLoS Biol.20, e3001921. 10.1371/journal.pbio.3001921
110
LentonT. M.ArmstrongD. I. (2023). in The global tipping points report 2023. Editors LorianiS.AbramsJ. F.LadeS. J.DongesJ. F.MilkoreitM.PowellT.et al (Exeter, UK: University of Exeter).
111
LiggettD.FrameB.GilbertN.MorganF. (2017). Is it all going south? Four future scenarios for Antarctica. Polar Rec.53, 459–478. 10.1017/s0032247417000390
112
LoebelE.BaumhoerC. A.DietzA.ScheinertM.HorwathM. (2025). Calving front positions for 42 key glaciers of the Antarctic Peninsula ice sheet: a sub-seasonal record from 2013 to 2023 based on deep-learning application to Landsat multi-spectral imagery. Earth Syst. Sci. Data17, 65–78. 10.5194/essd-17-65-2025
113
LowryD. P.KrappM.GolledgeN. R.Alevropoulos-BorrillA. (2021). The influence of emissions scenarios on future Antarctic ice loss is unlikely to emerge this century. Commun. Earth and Environ.2, 221. 10.1038/s43247-021-00289-2
114
LuH.OrrA.KingJ.PhillipsT.GilbertE.ColwellS.et al (2023). Extreme warm events in the South Orkney Islands, Southern Ocean: compounding influence of atmospheric rivers and föhn conditions. Q. J. R. Meteorological Soc.149, 3645–3668. 10.1002/qj.4578
115
MaclennanM. L.WintersA. C.ShieldsC. A.ThakerR.BarthelemyL.CodronF.et al (2025). Rising atmospheric moisture escalates the future impact of atmospheric rivers in the Antarctic climate system. Commun. Earth and Environ.6, 369. 10.1038/s43247-025-02333-x
116
MarshallG. J. (2003). Trends in the Southern Annular Mode from observations and reanalyses. J. Clim., 16 (24), 4134–4143. 10.1175/1520-0442(2003)016<4134:TITSAM>2.0
117
MarshallG. J.OrrA.van LipzigN. P. M.KingJ. C. (2006). The impact of a changing Southern hemisphere annular mode on Antarctic Peninsula summer temperatures. J. Clim.19, 5388–5404. 10.1175/JCLI3844.1
118
MarshallJ.ScottJ.ArmourK.CampinJ. M.KelleyM.RomanouA. (2014). The ocean’s role in the transient response of climate to abrupt greenhouse gas forcing. Clim. Dyn.44, 1–13. 10.1007/s00382-014-2308-0
119
MatearR. J.O’KaneT. J.RisbeyJ. S.ChamberlainM. (2015). Sources of heterogeneous variability and trends in Antarctic sea-ice. Nat. Commun.6, 8656. 10.1038/ncomms9656
120
McCarthyA. H.PeckL. S.HughesK. A.AldridgeD. C. (2019). Antarctica: the final frontier for marine biological invasions. Glob. Change Biol.25 (7), 2221–2241. 10.1111/gcb.14600
121
MedleyB.ThomasE. R. (2019). Increased snowfall over the Antarctic ice sheet mitigated twentieth-century sea-level rise. Nat. Clim. Change9, 34–39. 10.1038/s41558-018-0356-x
122
MeinshausenM.NichollsZ. R. J.LewisJ.GiddenM. J.VogelE.FreundM.et al (2020). The shared socio-economic pathway (SSP) greenhouse gas concentrations and their extensions to 2500. Geosci. Model Dev.13, 3571–3605. 10.5194/gmd-13-3571-2020
123
MeredithM. P.KingJ. C. (2005). Rapid climate change in the ocean west of the Antarctic Peninsula during the second half of the 20th century. Geophys. Res. Lett.32. L19604. 10.1029/2005gl024042
124
MeredithM. P.VenablesH. J.ClarkeA.DucklowH. W.EricksonM.LengM. J.et al (2013). The freshwater system west of the Antarctic Peninsula: spatial and temporal changes. J. Clim.26, 1669–1684. 10.1175/jcli-d-12-00246.1
125
MeredithM. P.StefelsJ.van LeeuweM. (2017). Marine studies at the Western Antarctic Peninsula: priorities, progress and prognosis. Deep Sea Res. Part II Top. Stud. Oceanogr.139, 1–8. 10.1016/j.dsr2.2017.02.002
126
MilesK. E.HubbardB.LuckmanA.KulessaB.BevanS.ThompsonS.et al (2025). Influence of the grounding zone on the internal structure of ice shelves. Nat. Commun.16, 4383. 10.1038/s41467-025-58973-2
127
MisiakM.Goodall-CopestakeW. P.SparksT. H.WorlandM. R.BoddyL.MaganN.et al (2020). Inhibitory effects of climate change on the growth and extracellular enzyme activities of a widespread Antarctic soil fungus. Glob. Chang. Biol.27, 1111–1125. 10.1111/gcb.15456
128
MitchamT.GudmundssonG. H.BamberJ. L. (2022). The instantaneous impact of calving and thinning on the Larsen C Ice Shelf. Cryosphere16, 883–901. 10.5194/tc-16-883-2022
129
MoffatC.MeredithM. (2018). Shelf–ocean exchange and hydrography west of the Antarctic Peninsula: a review. Philosophical Trans. R. Soc. A Math. Phys. Eng. Sci.376, 20170164. 10.1098/rsta.2017.0164
130
MorleyS. A.BarnesD. K. A.DunnM. J. (2019). Predicting which species succeed in climate-forced Polar Seas. Front. Mar. Sci.5, 507. 10.3389/fmars.2018.00507
131
MorleyS. A.BatesA. E.ClarkM. S.FitzcharlesE.SmithR.StainthorpR. E.et al (2024). Testing the resilience, physiological plasticity and mechanisms underlying upper temperature limits of Antarctic marine ectotherms. Biology13, 224. 10.3390/biology13040224
132
MorlighemM.RignotE.BinderT.BlankenshipD.DrewsR.EaglesG.et al (2020). Deep glacial troughs and stabilizing ridges unveiled beneath the margins of the Antarctic Ice Sheet. Nat. Geosci.13, 132–137. 10.1038/s41561-019-0510-8
133
MottramR.HansenN.HoggA. E.RodehackeC. B.SimonsenS. B.WallisB. J. (2025). The greenlandification of Antarctica. Nat. Geosci.18, 928–930. 10.1038/s41561-025-01805-1
134
MulvaneyR.AbramN. J.HindmarshR. C. A.ArrowsmithC.FleetL.TriestJ.et al (2012). Recent Antarctic Peninsula warming relative to Holocene climate and ice-shelf history. Nature489, 141–144. 10.1038/nature11391
135
NaughtenK. A.De RydtJ.RosierS. H. R.JenkinsA.HollandP. R.RidleyJ. K. (2021). Two-timescale response of a large Antarctic ice shelf to climate change. Nat. Commun.12, 1991. 10.1038/s41467-021-22259-0
136
NowickiS.GoelzerH.SeroussiH.PayneA. J.LipscombW. H.Abe-OuchiA.et al (2020). Experimental protocol for sea level projections from ISMIP6 stand-alone ice sheet models. Cryosphere14, 2331–2368. 10.5194/tc-14-2331-2020
137
O'NeillJ. F.EdwardsT. L.MartinD. F.ShaferC.CornfordS. L.SeroussiH. L.et al (2025). ISMIP6-based Antarctic projections to 2100: simulations with the BISICLES ice sheet model. Cryosphere19, 541–563. 10.5194/tc-19-541-2025
138
OchwatN. E.ScambosT. A.BanwellA. F.AndersonR. S.MaclennanM. L.PicardG.et al (2024). Triggers of the 2022 Larsen B multi-year landfast sea ice breakout and initial glacier response. Cryosphere18, 1709–1731. 10.5194/tc-18-1709-2024
139
OrrA.CresswellD.MarshallG. J.HuntJ. C. R.SommeriaJ.WangC. G.et al (2004). A “low-level” explanation for the recent large warming trend over the Western Antarctic Peninsula involving blocked winds and changes in zonal circulation. Geophys. Res. Lett.31, L06204. 10.1029/2003GL019160
140
OrrA.MarshallG. J.HuntJ. C. R.SommeriaJ.WangC.van LipzigN. P. M.et al (2008). Characteristics of summer airflow over the Antarctic Peninsula in response to recent strengthening of westerly circumpolar winds. J. Atmos. Sci.65, 1396–1413. 10.1175/2007JAS2498.1
141
OrrA.DebP.ClemK.GilbertE.BromwichD.BobergF.et al (2023). Characteristics of surface “melt potential” over Antarctic ice shelves based on regional atmospheric model simulations of summer air temperature extremes from 1979/80 to 2018/19. J. Clim.36, 3357–3383. 10.1175/JCLI-D-22-0386.1
142
OrsiA. H.WhitworthT.NowlinW. D. (1995). On the meridional extent and fronts of the Antarctic Circumpolar Current. Deep Sea Res. Part I Oceanogr. Res. Pap.42, 641–673. 10.1016/0967-0637(95)00021-w
143
OtosakaI. N.ShepherdA.IvinsE. R.SchlegelN. J.AmoryC.van den BroekeM. R.et al (2023). Mass balance of the Greenland and Antarctic ice sheets from 1992 to 2020. Earth Syst. Sci. Data15, 1597–1616. 10.5194/essd-15-1597-2023
144
ØvstedalD. O.SmithR. L. (2001). Lichens of Antarctica and South Georgia: a guide to their identification and ecology. Cambridge University Press.
145
O’NeillB. C.KrieglerE.EbiK. L.Kemp-BenedictE.RiahiK.RothmanD. S.et al (2017). The roads ahead: narratives for shared socioeconomic pathways describing world futures in the 21st century. Glob. Environ. Change42, 169–180. 10.1016/j.gloenvcha.2015.01.004
146
PakhomovE. A.FronemanP. W.PerissinottoR. (2002). Salp/krill interactions in the Southern Ocean: spatial segregation and implications for the carbon flux. Deep Sea Res. II49, 1881–1907. 10.1016/s0967-0645(02)00017-6
147
ParkinsonC. L.CavalieriD. J. (2012). Antarctic sea ice variability and trends, 1979 - 2010. Cryosphere6, 871–880. 10.5194/tc-6-871-2012
148
ParnikozaI.ConveyP.DykyyI.TrokhymetsV.MilinevskyG.TyschenkoO.et al (2009). Current status of the Antarctic herb tundra formation in the central Argentine Islands. Glob. Change Biol.15, 1685–1693. 10.1111/j.1365-2486.2009.01906.x
149
ParsonsR.SunS.GudmundssonG. H.WuiteJ.NaglerT. (2024). Quantifying the buttressing contribution of landfast sea ice and melange to Crane Glacier, Antarctic Peninsula. Cryosphere18, 5789–5801. 10.5194/tc-18-5789-2024
150
PattynF.RitzC.HannaE.Asay-DavisX.DeContoR.DurandG.et al (2018). The Greenland and Antarctic ice sheets under 1.5 °C global warming. Nat. Clim. Change8, 1053–1061. 10.1038/s41558-018-0305-8
151
PeckL. S. (2018). “Antarctic marine biodiversity: adaptations, environments and responses to change,” in Oceanography and Marine Biology. An Annual Review56, 105–236. 10.1201/9780429454455
152
PedersenÅ. Ø.ConveyP.NewshamK. K.MosbacherJ. B.FugleiE.RavolainenV.et al (2022). Five decades of terrestrial and freshwater research at Ny-Ålesund, Svalbard. Polar Res.41, 6310. 10.33265/polar.v41.6310
153
PolvaniL. M.WaughD. W.CorreaG. J. P.SonS. (2011). Stratospheric ozone depletion: the main driver of twentieth-century atmospheric circulation changes in the Southern hemisphere. J. Clim.24, 795–812. 10.1175/2010JCLI3772.1
154
PritchardH. D.FretwellP. T.FremandA. C.BodartJ. A.KirkhamJ. D.AitkenA.et al (2025). Bedmap3 updated ice bed, surface and thickness gridded datasets for Antarctica. Sci. Data12, 414. 10.1038/s41597-025-04672-y
155
PurichA.DoddridgeE. W. (2023). Record low Antarctic sea ice coverage indicates a new sea ice state. Commun. Earth Environ.4, 314. 10.1038/s43247-023-00961-9
156
RiahiK.van VuurenD. P.KrieglerE.EdmondsJ.O’NeillB. C.FujimoriS.et al (2017). The shared socioeconomic pathways and their energy, land use, and greenhouse gas emissions implications: an overview. Glob. Environ. Change42, 153–168. 10.1016/j.gloenvcha.2016.05.009
157
RignotE.MouginotJ.ScheuchlB. (2011). Ice flow of the Antarctic Ice Sheet. Science333, 1427–1430. 10.1126/science.1208336
158
RignotE.MouginotJ.ScheuchlB.van den BroekeM.van WessemM. J.MorlighemM. (2019). Four decades of Antarctic ice sheet mass balance from 1979–2017. Proc. Natl. Acad. Sci.116, 1095–1103. 10.1073/pnas.1812883116
159
Rigual-HernándezA. S.LeventerA.Fernández-BarbaM.FloresJ. A.NavarroG.EtourneauJ.et al (2025). Response of phytoplankton communities to the onset of the 2020 summer marine heatwave in the Drake Passage and Antarctic Peninsula. Biogeosciences22, 7205–7232. 10.5194/bg-22-7205-2025
160
RiiheläA.BrightR. M.AnttilaK. (2021). Recent strengthening of snow and ice albedo feedback driven by Antarctic sea-ice loss. Nat. Geosci.14, 832–836. 10.1038/s41561-021-00841-x
161
RobelA. A.BanwellA. F. (2019). A speed limit on ice shelf collapse through hydrofracture. Geophys. Res. Lett.46, 12092–12100. 10.1029/2019gl084397
162
RogeljJ.PoppA.CalvinK. V.LudererG.EmmerlingJ.GernaatD.et al (2018). Scenarios towards limiting global mean temperature increase below 1.5 °C. Nat. Clim. Change8, 325–332. 10.1038/s41558-018-0091-3
163
RogeljJ.Den ElzenM. G. J.Portugal PereiraJ. (2024). “Chapter 4: the emissions gap in 2023 and 2035, emissions gap report 2024: no more hot air… please! with a massive gap between rhetoric and reality, countries draft new climate commitments,” in Emissions gap report 2025: off target - continued collective inaction puts global temperature goal at risk. Nairobi, Kenya: United Nations Environment Programme, 26–34.
164
RolandT. P.BartlettO. T.CharmanD. J.AndersonK.HodgsonD. A.AmesburyM. J.et al (2024). Sustained greening of the Antarctic Peninsula observed from satellites. Nat. Geosci.17, 1121–1126. 10.1038/s41561-024-01564-5
165
RottH.WuiteJ.De RydtJ.GudmundssonG. H.FloricioiuD.RackW. (2020). Impact of marine processes on flow dynamics of northern Antarctic Peninsula outlet glaciers. Nat. Communications11, 2969. 10.1038/s41467-020-16658-y
166
SahadeR.LaggerC.TorreL.MomoF.MonienP.SchlossI.et al (2015). Climate change and glacier retreat drive shifts in an Antarctic benthic ecosystem. Sci. Adv.1 (10), e1500050. 10.1126/sciadv.1500050
167
ScambosT.FrickerH. A.LiuC.-C.BohlanderJ.FastookJ.SargentA.et al (2009). Ice shelf disintegration by plate bending and hydro-fracture: satellite observations and model results of the 2008 Wilkins Ice Shelf break-ups. Earth Planet. Sci. Lett.280, 51–60. 10.1016/j.epsl.2008.12.027
168
ScambosT. A.BerthierE.HaranT.ShumanC. A.CookA. J.LigtenbergS. R. M.et al (2014). Detailed ice loss pattern in the northern Antarctic Peninsula: widespread decline driven by ice front retreats. Cryosphere8, 2135–2145. 10.5194/tc-8-2135-2014
169
SchofieldO.CiminoM.DoneyS.FriedlaenderA.MeredithM.MoffatC.et al (2024). Antarctic pelagic ecosystems on a warming planet. Trends Ecology and Evolution39, 1141–1153. 10.1016/j.tree.2024.08.007
170
SenigagliaV.Hatton MacDonaldD.StoecklN.TianJ.LeaneE.AdamsV.et al (2025). Managing tourism in Antarctica: impacts, forecasts, and suitable economic instruments. J. Sustain. Tour., 1–21. 10.1080/09669582.2025.2488958
171
SeroussiH.NowickiS.PayneA. J.GoelzerH.LipscombW. H.Abe-OuchiA.et al (2020). ISMIP6 Antarctica: a multi-model ensemble of the Antarctic ice sheet evolution over the 21st century. Cryosphere14, 3033–3070. 10.5194/tc-14-3033-2020
172
SeroussiH.PelleT.LipscombW. H.Abe-OuchiA.AlbrechtT.Alvarez-SolasJ.et al (2024). Evolution of the Antarctic Ice Sheet over the next three centuries from an ISMIP6 model ensemble. Earth’s Future12, e2024EF004561. 10.1029/2024ef004561
173
ShahateetK.J. FürstJ.NavarroF.SeehausT.FarinottiD.BraunM. (2025). A reconstruction of the ice thickness of the Antarctic Peninsula Ice Sheet north of 70° S. Cryosphere19, 1577–1597. 10.5194/tc-19-1577-2025
174
SiegertM. J.AtkinsonA.BanwellA.BrandonM.ConveyP.DaviesB.et al (2019). The Antarctic Peninsula under a 1.5 °C global warming scenario. Front. Environ. Sci.7, 102. 10.3389/fenvs.2019.00102
175
SiegertM. J.BentleyM. J.AtkinsonA.BracegirdleT. J.ConveyP.DaviesB.et al (2023). Antarctic extreme events. Front. Environ. Sci.11, 1229283. 10.3389/fenvs.2023.1229283
176
SiegertM. J.SevestreH.BentleyM. J.Brigham-GretteJ.BurgessH.BuzzardS.et al (2025). Safeguarding the polar regions from dangerous geoengineering: a critical assessment of proposed concepts and future prospects. Front. Sci.3, 1527393. 10.3389/fsci.2025.1527393
177
SmithR. L.ConveyP. (2002). Enhanced sexual reproduction in bryophytes at high latitudes in the maritime Antarctic. J. Bryology24, 107–117. 10.1179/037366802125000962
178
SmithB.FrickerH. A.GardnerA. S.MedleyB.NilssonJ.PaoloF. S.et al (2020). Pervasive ice sheet mass loss reflects competing ocean and atmosphere processes. Science368, 1239–1242. 10.1126/science.aaz5845
179
SonS.-W.GerberE. P.PerlwitzJ.PolvaniL. M.GillettN. P.SeoK.et al (2010). Impact of stratospheric ozone on Southern Hemisphere circulation change: a multimodel assessment. J. Geophys. Res.115, D00M07. 10.1029/2010JD014271
180
SteinerN. S.BowmanJ.CampbellK.ChiericiM.Eronen-RasimusE.FalardeauM.et al (2021). Climate change impacts on sea-ice ecosystems and associated ecosystem services. Elem. Sci. Anth9, 00007. 10.1525/elementa.2021.00007
181
StokesC. R.BamberJ. L.DuttonA.DeContoR. M. (2025). Warming of +1.5 °C is too high for polar ice sheets. Commun. Earth and Environ.6, 351. 10.1038/s43247-025-02299-w
182
SucklingC. C.ClarkM. S.RichardJ.MorleyS. A.ThorneM. A.HarperE. M.et al (2015). Adult acclimation to combined temperature and p H stressors significantly enhances reproductive outcomes compared to short‐term exposures. J. Animal Ecol.84, 773–784. 10.1111/1365-2656.12316
183
TarlingG. A.WardP.ThorpeS. E. (2018). Spatial distributions of Southern Ocean mesozooplankton communities have been resilient to long‐term surface warming. Glob. Change Biol.24, 132–142. 10.1111/gcb.13834
184
TeskeV.TimmermannR.SemmlerT. (2024). Subsurface warming in the Antarctica’s Weddell Sea can be avoided by reaching the 2∘C warming target. Commun. Earth and Environ.5, 93. 10.1038/s43247-024-01238-5
185
The Copernicus Programme (2025). The 2024 annual climate summary: global climate highlights 2024. Available online at: https://climate.copernicus.eu/global-climate-highlights-2024#:∼:text=hold%20more%20moisture.-,How%20unusual%20was%20the%20global%20warmth%20of%202023%20and%202024,years%20are%202023%20and%202024 (Accessed January 7, 2026).
186
ThompsonD. W.SolomonS. (2002). Interpretation of recent Southern Hemisphere climate change. Science296 (5569), 895–899. 10.1126/science.1069270
187
ThompsonD. W. J.SolomonS.KushnerP. J.EnglandM. H.GriseK. M.KarolyD. J. (2011). Signatures of the Antarctic ozone hole in Southern Hemisphere surface climate change. Nat. Geosci.4, 741–749. 10.1038/ngeo1296
188
ThompsonK. L.PauliJ. N.ZuckerbergB. (2025). The vulnerability of overwintering insects to loss of the subnivium. Divers. Distributions31, e70050. 10.1111/ddi.70050
189
TinT.FlemingZ. L.HughesK. A.AinleyD.ConveyP.MorenoC.et al (2009). Impacts of local human activities on the Antarctic environment. Antarct. Sci.21, 3–33. 10.1017/s0954102009001722
190
TonelliM.SignoriC. N.BendiaA.NeivaJ.FerreroB.PellizariV.et al (2021). Climate projections for the Southern Ocean reveal impacts in the marine microbial communities following increases in sea surface temperature. Front. Mar. Sci., 8–2021. 10.3389/fmars.2021.636226
191
TrewinB.CazenaveA.HowellS.HussM.IsenseeK.PalmerM. D.et al (2021). Headline indicators for global climate monitoring. Bull. Am. Meteorological Soc.102, E20–E37. 10.1175/bams-d-19-0196.1
192
TruselL. D.FreyK. E.DasS. B.KarnauskasK. B.Kuipers MunnekeP.van MeijgaardE.et al (2015). Divergent trajectories of Antarctic surface melt under two twenty-first-century climate scenarios. Nat. Geosci.8, 927–932. 10.1038/ngeo2563
193
TurnerJ.ColwellS. R.MarshallG. J.Lachlan-CopeT. A.CarletonA. M.JonesP. D.et al (2004). The SCAR READER project: toward a high-quality database of mean Antarctic meteorological observations. J. Clim.17, 2890–2898. 10.1175/1520-0442(2004)017%3C2890:TSRPTA%3E2.0.CO;2
194
TurnerJ.LuH.WhiteI.KingJ. C.PhillipsT.HoskingJ. S.et al (2016). Absence of 21st century warming on Antarctic Peninsula consistent with natural variability. Nature535, 411–515. 10.1038/nature18645
195
TurnerJ.MarshallG. J.ClemK.ColwellS.PhillipsT.LuH. (2020). Antarctic temperature variability and change from station data. Int. J. Climatol.40, 2986–3007. 10.1002/joc.6378
196
TurnerJ.LuH.KingJ.MarshallG. J.PhillipsT.BannisterD.et al (2021). Extreme temperatures in the Antarctic. J. Clim.34, 2653–2668. 10.1175/jcli-d-20-0538.1
197
UK Government (2025). National security strategy 2025: Security for the British people in a dangerous world. London, UK: UK Government. Available online at: https://www.gov.uk/government/publications/national-security-strategy-2025-security-for-the-british-people-in-a-dangerous-world/national-security-strategy-2025-security-for-the-british-people-in-a-dangerous-world-html%23strategic-framework&sa=D&source=docs&ust=1753339516863926&usg=AOvVaw2wHVdkkYlURwx8CCPAFpX7 (Accessed July 24, 2025).
198
United Nations Environment Programme (2025). Emissions gap report 2025: off target - continued collective inaction puts global temperature goal at risk. Nairobi.
199
van den BroekeM. (2005). Strong surface melting preceded collapse of Antarctic Peninsula ice shelf. Geophys. Res. Lett.32, L12815. 10.1029/2005gl023247
200
van WessemJ. M.van den BroekeM. R.WoutersB.LhermitteS. (2023). Variable temperature thresholds of melt pond formation on Antarctic ice shelves. Nat. Clim. Change13, 161–166. 10.1038/s41558-022-01577-1
201
VerleyenE.Van de VijverB.TytgatB.PinseelE.HodgsonD. A.KopalováK.et al (2021). Diatoms define a novel freshwater biogeography of the Antarctic. Ecography44, 548–560. 10.1111/ecog.05374
202
VidalF. (2023). The Antarctic Peninsula: Argentina and Chile in the era of global change. Polar J.13, 13–30. 10.1080/2154896x.2023.2205236
203
VignonÉ.RousselM. L.GorodetskayaI. V.GenthonC.BerneA. (2021). Present and future of rainfall in Antarctica. Geophys. Res. Lett.48, e2020GL092281. 10.1029/2020gl092281
204
WallisB. J.HoggA. E.van WessemJ. M.DavisonB.J.van den BroekeM. R. (2023). Widespread seasonal speed-up of west Antarctic Peninsula glaciers from 2014 to 2021. Nat. Geosci.16, 231–237. 10.1038/s41561-023-01131-4
205
WallisB. J.HoggA. E.ZhuY.HooperA. (2024). Change in grounding line location on the Antarctic Peninsula measured using a tidal motion offset correlation method. Cryosphere18, 4723–4742. 10.5194/tc-18-4723-2024
206
WalshawC. V.GrayA.FretwellP. T.ConveyP.DaveyM. P.JohnsonJ. S.et al (2024). A satellite-derived baseline of photosynthetic life across Antarctica. Nat. Geosci.17, 755–762. 10.1038/s41561-024-01492-4
207
WilleJ. D.FavierV.JourdainN. C.KittelC.TurtonJ. V.AgostaC.et al (2022). Intense atmospheric rivers can weaken ice shelf stability at the Antarctic Peninsula. Commun. Earth and Environ.3, 90. 10.1038/s43247-022-00422-9
208
WilleJ. D.FavierV.GorodetskayaI. V.AgostaC.BaimanR.BarrettJ. E.et al (2025). Atmospheric rivers in Antarctica. Nat. Rev. Earth and Environ.6, 178–192. 10.1038/s43017-024-00638-7
209
WilliamsR. G.CeppiP.RoussenovV.KatavoutaA.MeijersA. J. S. (2023). The role of the Southern Ocean in the global climate response to carbon emissions. Philosophical Trans. R. Soc. A Math. Phys. Eng. Sci.381, 20220062. 10.1098/rsta.2022.0062
210
World Meteorological Organisation (2025). State of the Global climate 2024. WMO-No. 1368. Geneva: WMO, 42.
211
ZittoM. E.BarrucandM. G.PiotrkowskiR.CanzianiP. O. (2015). 110 years of temperature observations at Orcadas Antarctic station: multidecadal variability. Int. J. Climatol.36, 809–823. 10.1002/joc.4384
Summary
Keywords
Antarctic Peninsula, climate change, ecology, ice shelf, ocean, operations and maintenance, sea ice
Citation
Davies BJ, Atkinson A, Banwell AF, Brandon M, Caton Harrison T, Convey P, De Rydt J, Dodds K, Downie R, Edwards TL, Gilbert E, Hubbard B, Hughes KA, Marshall GJ, Orr A, Rogelj J, Seroussi H, Siegert M, Stroeve J and Rumble J (2026) The Antarctic Peninsula under present day climate and future low, medium-high and very high emissions scenarios. Front. Environ. Sci. 13:1730203. doi: 10.3389/fenvs.2025.1730203
Received
22 October 2025
Revised
08 December 2025
Accepted
11 December 2025
Published
20 February 2026
Volume
13 - 2025
Edited by
Honglei Wang, Nanjing University of Information Science and Technology, China
Reviewed by
Agnieszka Ziernicka-Wojtaszek, University of Agriculture in Krakow, Poland
Benjamin Pohl, UMR6282 Biogeosciences, France
Updates
Copyright
© 2026 Davies, Atkinson, Banwell, Brandon, Caton Harrison, Convey, De Rydt, Dodds, Downie, Edwards, Gilbert, Hubbard, Hughes, Marshall, Orr, Rogelj, Seroussi, Siegert, Stroeve and Rumble.
This is an open-access article distributed under the terms of the Creative Commons Attribution License (CC BY). The use, distribution or reproduction in other forums is permitted, provided the original author(s) and the copyright owner(s) are credited and that the original publication in this journal is cited, in accordance with accepted academic practice. No use, distribution or reproduction is permitted which does not comply with these terms.
*Correspondence: Bethan J. Davies, bethan.davies@newcastle.ac.uk
Disclaimer
All claims expressed in this article are solely those of the authors and do not necessarily represent those of their affiliated organizations, or those of the publisher, the editors and the reviewers. Any product that may be evaluated in this article or claim that may be made by its manufacturer is not guaranteed or endorsed by the publisher.