 Chunling Li1*
 Jun Han2
- 1School of Statistics and Data Science, Lanzhou University of Finance and Economics, Lanzhou, China
- 2Graduate School, Lanzhou University of Finance and Economics, Lanzhou, China
Industrial parks serve as the core spatial units of global manufacturing and energy consumption, and their low-carbon transformation plays a critical role in achieving the “dual-carbon” goals. This study employs a non-oriented Super Slack-Based Measure model under the assumption of non-increasing returns to scale to measure the carbon emission efficiency of 178 national high-tech zones in China from 2008 to 2023. Within the framework of eight integrated economic regions, regional comparison, efficiency rating, and industrial-combination analyses are conducted. The Moran Index is applied to test spatial autocorrelation, while the Geographical Detector and the Multiscale Geographically and Temporally Weighted Regression model are used to analyze the explanatory power and spatiotemporal heterogeneity of driving factors across four dimensions: economic development and industrial structure, technological innovation and research and development, environmental policy and green finance, and human and social development. The results reveal that carbon emission efficiency shows a spatial pattern characterized by higher values in the south and coastal areas and lower values in the west and inland regions. High-efficiency industrial combinations exhibit synergistic enhancement effects, whereas low-efficiency combinations experience efficiency losses. Overall efficiency displays a spatially negative correlation, indicating insufficient diffusion of low-carbon technologies and a noticeable “siphon effect” among neighboring zones. Among endogenous factors, park area and carbon emissions per unit of industrial output are the dominant driving forces, while exogenous factors play a relatively limited role. Variables at the local scale demonstrate high heterogeneity and short response times, suggesting that expanding production capacity should be accompanied by technological progress and the efficient allocation of land and capital to reduce carbon emissions per unit of output. On this basis, differentiated emission-reduction pathways can be designed to promote the coordinated advancement of economic growth and low-carbon transformation.
1 Introduction
Global climate change poses a major challenge to sustainable human development, and controlling greenhouse gas emissions—primarily carbon dioxide—has become the core focus of climate governance. Since the acceleration of industrialization in the late nineteenth century, the industrial sector has been not only a key pillar of economic growth, but also a principal source of global energy consumption and carbon emissions (IPCC, 2023). As the world’s largest manufacturing country, China’s industrial restructuring and energy system transformation are crucial not only for achieving its “dual-carbon” targets, but also for shaping global temperature control trajectories. China’s industrial system is characterized by a massive scale and broad geographical coverage. According to national planning, by 2060 carbon emissions from the industrial sector must be reduced by nearly 95% relative to current levels (IEA, 2021). This ambitious reduction target both reflects China’s nationally determined contribution and underscores the critical role of the industrial sector in achieving carbon neutrality.
Within China’s industrial system, industrial parks, as spatial economic units shaped by policy guidance and factor agglomeration, play an important role in accommodating industrial layout and driving regional economic growth. At present, there are approximately 25,000 industrial parks nationwide (Lyu et al., 2023). These parks were initially established in coastal areas with relatively mature industrial foundations and institutional environments, and subsequently expanded into central and western regions driven by industrial relocation and regional coordination strategies. Among the numerous industrial parks across China, national high-tech zones (HTZs) occupy less than 2.5% of the country’s construction land, yet contribute about 14% of GDP, serving as a core engine for regional economic development and scientific and technological innovation (State Council of the PRC, 2022). In 1991, China established the first batch of national HTZs in 21 cities, drawing in part on the industry-university-research integration model of the Stanford Research Park (Nahm, 2000). With the continuous advancement of national science and technology policies and industrial development needs, the number of HTZs has steadily increased to 178, and in 2020 they were designated as national demonstration zones for green and low-carbon transformation.
In recent years, energy efficiency and carbon emission performance in HTZs have continued to improve. Between 2015 and 2020, comprehensive energy consumption per unit of industrial value added decreased from 0.584 to 0.451 tonnes of standard coal per 10,000 yuan, with an average annual decline of 4.3%, accompanied by a simultaneous reduction in carbon intensity (Liu et al., 2023). These improvements are partly attributable to the promotion of technical and managerial measures such as building-integrated photovoltaics, smart energy systems and green finance, and partly to regional differences in resource endowments, industrial structures and the stringency of policy implementation. Building on these achievements, the National High-Tech Zone Green Development Special Action Plan sets the target that, by 2025, comprehensive energy consumption per unit of industrial value added should fall below 0.4 tonnes of standard coal per 10,000 yuan, with half of the zones achieving levels better than 0.3, and CO2 emissions per unit of output declining at an average annual rate of no less than 4% (IEA, 2021).
Although HTZs have begun to show results in green development, their low-carbon transition still faces multiple practical challenges (Zhou, 2021): energy consumption and carbon emission statistics for small and medium-sized enterprises remain incomplete; inconsistencies between park boundaries and administrative divisions lead to ambiguous accounting scopes; supply-chain life-cycle accounting and information sharing are insufficient; and carbon management capacity and specialized support platforms are relatively weak. Against this backdrop, it is necessary to establish a unified carbon emission efficiency evaluation system, systematically analyze the main driving factors and reveal their spatiotemporal heterogeneity, so as to provide useful decision-making references for the green and low-carbon transformation of China’s industrial parks and similar regions elsewhere.
The remainder of this paper is organized as follows: Section 2 reviews the relevant research literature; Section 3 introduces the data and research methods; Section 4 presents the empirical analysis and results; The study’s limitations and potential future research directions are covered in Section 5, and the key findings are presented in Section 6.
2 Literature review
Carbon dioxide (CO2) is the primary component of anthropogenic greenhouse gas emissions, and its concentration changes directly influence the intensity of the greenhouse effect and the trajectory of global warming (NASA, 2024). Given that traditional carbon-intensity indicators are unable to capture the multi-input, multi-output nature of emissions, the production frontier and total factor productivity framework (Ganley and Cubbin, 1992) has gradually become a mainstream tool in carbon emission research. Because it can simultaneously handle desirable and undesirable outputs, Data Envelopment Analysis (DEA) and its extended Super-SBM models (Tone, 2001; Tone, 2002) has been widely applied in studies of environmental performance (Charnes et al., 1978). The “carbon emission efficiency” index constructed under this evaluation framework can simultaneously reflect resource-use efficiency, economic output capacity, and pollution-control requirements, and thus provides an effective measure of the level of low-carbon development in a given region (Asteriou and Bashmakova, 2013; Afanasyev et al., 2015).
Despite the continuous enrichment of carbon emission efficiency measurement methods, existing studies still fall short in explaining the carbon emission efficiency of regions or industrial parks characterized by innovation-driven development. Lin et al. (2020) applied the SBM model to evaluate the carbon emission efficiency of countries with different energy structures, highlighting the advantages of developed economies in energy use and carbon reduction. Elahi et al. (2024) found significant spatial heterogeneity and spillover effects in agricultural carbon efficiency along China’s Yangtze River Basin, demonstrating that regional disparities are key sources of efficiency variation. Jiang et al. (2022) further employed the Super-SBM model to measure industrial carbon emission efficiency in cities of the Pearl River Basin, showing a continuous increase from 2009 to 2017. Yu (2023) revealed spatial disparities in green development efficiency across 171 Chinese industrial parks. These studies have provided important insights at the national, regional, and park levels, but their objects of analysis do not encompass national HTZs, which are highly innovation-intensive areas. Therefore, the measurement of carbon emission efficiency and the exploration of its driving mechanisms at the level of national HTZs still require further in-depth investigation.
Regarding the driving factors of carbon emission efficiency, scholars have mainly discussed them from the perspectives of economic development, energy use, industrial structure, and urbanization. For example, the Environmental Kuznets Curve (EKC) hypothesis posits an inverted U-shaped relationship between carbon emissions and income (Stern, 2004). Kacprzyk and Kuchta (2020) empirically confirmed a nonlinear relationship between fossil-fuel CO2 emissions and economic development. Opoku et al. (2022) found that a 0.1 increase in the Human Development Index can significantly reduce the carbon footprint and per capita CO2 emissions, indicating that education and human capital exert a positive effect on carbon efficiency. Waheed et al. (2019) pointed out that most developed countries have essentially decoupled economic growth from emissions, whereas many developing countries remain in an energy-driven growth stage. Jiang et al. (2022) further showed that supply chain structures shape emission reduction strategies. Azizalrahman and Hasyimi (2019) identified a stage-dependent nonlinear relationship between urbanization levels and carbon emissions.
Institutional factors and innovation have also been shown to exert a significant influence on carbon emission efficiency. Although technological progress is an important driver of efficiency improvement, it is constrained by path dependence and technological lock-in (Li et al., 2021; Albitar et al., 2023). Green finance contributes to emission reduction by directing capital flows toward clean technologies and renewable energy (ElBannan and Löffler, 2024). Foreign trade exhibits a stage-specific effect: it may increase carbon emissions in the short term, but in the long run it can promote structural upgrading and efficiency gains (Onwachukwu et al., 2021). Inadequate enforcement of environmental regulations may also lead to a “rebound effect,” thereby aggravating carbon emissions (Baloch and Danish, 2022).
Although existing studies have established analytical frameworks for carbon emission efficiency at the macro level, they have not yet incorporated national high-tech zones as a distinct economic unit. To address this research gap, this paper proposes the following innovations: (1) builds a full-sample dataset covering 178 national HTZs from 2008 to 2023; (2) it uses the Super-SBM model within a non-oriented and NIRS framework, combining unwanted outputs and scale features to increase measurement accuracy; (3) it develops a dominant industrial combination–carbon efficiency matrix to examine how different industrial structures affect efficiency; and (4) it expands the analysis of driving factors to spatiotemporal dimensions, integrating the Geographical Detector and the Multi-Scale Geographically and Temporally Weighted Regression (MGTWR) model to reveal spatial heterogeneity in carbon emission efficiency and identify the differentiated effects of various factors across time and space.
This study takes China’s national HTZs as its research focus and constructs a comprehensive framework for measuring carbon emission efficiency and analyzing its driving mechanisms. The analysis spans national, regional, and industrial levels, providing new theoretical perspectives and methodological support for advancing the green transition and low-carbon governance of HTZs.
3 Materials and methods
3.1 Research methods
3.1.1 Carbon emission measurement
Carbon emission data were derived from the CO2 global gridded dataset in the EDGAR_2024_GHG greenhouse gas database, jointly released by the IEA and EDGAR (Johansson et al., 2017). First, the original 1 ° × 1 ° resolution data were upscaled to 1 km × 1 km using R, and then clipped to the territorial extent of China. Subsequently, the dataset was resampled to a 500 m × 500 m resolution in ArcGIS 10.8 to enhance spatial precision. Vector boundaries and attribute information of national HTZs were extracted via the AMap (Gaode) API using Python, and spatially overlaid with the resampled raster data. Annual total carbon emissions were then extracted for each zone, constructing a continuous time series covering 2008–2023. To ensure high boundary-matching accuracy, a dual “grid–administrative boundary” verification procedure was employed, complemented by alignment with township and subdistrict boundaries.
3.1.2 Carbon emission efficiency measurement
The Super Slack-Based Measure (Super-SBM) model (Tone, 2002) is an important extension of Data Envelopment Analysis (DEA). It overcomes the limitations of traditional radial models, which neglect slack variables and are unable to differentiate among efficient decision-making units with efficiency scores greater than 1. By directly optimizing input excesses and output shortfalls, the Super-SBM model improves the precision of efficiency measurement. It also incorporates undesirable outputs—such as carbon emissions—into the analysis, quantifying their excess levels and providing a more comprehensive reflection of environmental efficiency (Amirteimoori et al., 2024).
This study assesses the carbon emission efficiency of national HTZs using a non-oriented Super-SBM model with undesired outputs under the assumption of NIRS. The non-oriented setting simultaneously optimizes inputs and outputs, which aligns with the multi-objective characteristics of real production activities. The NIRS constraint prevents misinterpreting efficiency improvements as scale expansion, making it particularly suitable for contexts in which carbon emission efficiency improvements are driven primarily by technological progress rather than scale effects. This model is well-suited to assessing environmental efficiency within a multi-input–multi-output framework and provides a more accurate measurement of resource utilization and green performance. The model is expressed as follows (Equation 1):
In a system with
Use
The restriction of non-increasing returns to scale (NIRS) prevents irrational expansion by assuming that inputs do not enhance outputs proportionally. This condition is Equation 2:
3.1.3 Moran index
Geospatial data’s spatial autocorrelation is tested using Moran’s I, which has values between −1 and 1 (Moran, 1950). Positive spatial autocorrelation is shown when Moran’s I > 0, which means that nearby regions have comparable characteristics and create “high–high” or “low–low” clusters. Negative spatial autocorrelation is shown when Moran’s I is less than zero, suggesting notable regional differences with “high–low” or “low–high” distributed patterns. A random spatial distribution with negligible spatial correlation is suggested by Moran’s I ≈ 0. The global Moran’s I statistic is calculated as follows (Equation 3):
Let
Assign
The weights are based on economic–geographic distance (Equation 4).
Let
Analysis of localized spatial autocorrelation uses Local Moran’s I (Equation 5):
3.1.4 Geographical detector
The Geographical Detector is a statistical method used to identify spatial stratified heterogeneity and detect driving factors. Its core idea is that if an independent variable has a significant impact on a dependent variable, the two should exhibit similar spatial distribution patterns (Wang et al., 2010). In this study, the explanatory power of each driving factor on the carbon emission efficiency of national HTZs is evaluated using the determinant power (q-value) of the Geographical Detector. The q-value ranges from 0 to 1, with larger values indicating stronger explanatory power. A q-value of 0 suggests no spatial association between the two distributions, while a q-value of 1 indicates complete spatial consistency. The calculation is given as follows (Equation 6):
3.1.5 Multiscale geographically and Temporally Weighted Regression (MGTWR) model
The Multi-Scale Geographically and Temporally Weighted Regression (MGTWR) model is an extension of the GTWR model that incorporates a multi-scale weighting mechanism across both spatial and temporal dimensions. This allows for a more precise characterization of spatiotemporal dependence and non-stationarity (Wu et al., 2019). While GTWR simultaneously accounts for spatial and temporal effects, it applies a single spatiotemporal bandwidth to all variables (Fotheringham et al., 2015), which limits its ability to capture the multi-scale differences among various driving factors. To address this limitation, MGTWR assigns independent bandwidth parameters to each variable in both the spatial and temporal dimensions, thereby enhancing the model’s capacity to describe and explain spatiotemporal heterogeneity. The model can be expressed as follows (Equation 7):
3.2 Choice of indicators and study region
The study focuses on 178 national HTZs included in the “Torch Program.” The eight integrated economic regions suggested by the State Council’s Development Research Center serve as the basis for the regional classification. An input-output indicator system was created in order to satisfy the standards for measuring carbon emission efficiency (see Table 1).
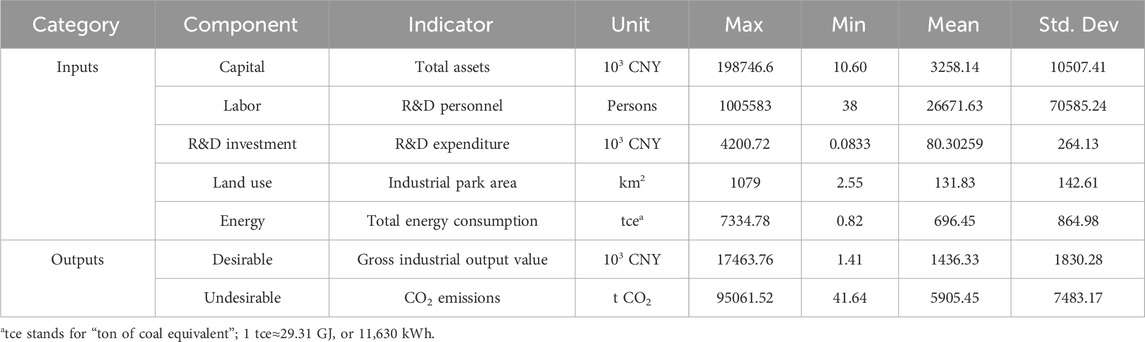
Table 1. Input–output framework for the carbon emission efficiency of HTZs.
The input indicators account for both production and innovation factors. Capital is measured by the total assets of each zone at year-end, reflecting the capacity of fixed asset support. Labor is represented by the number of R&D personnel, indicating the level of knowledge input. Technological input is measured by R&D expenditure, capturing its role in promoting low-carbon technologies and cleaner production. Land is represented by the built-up area of each zone. Energy input is measured by total energy consumption, which is calculated indirectly based on the China National High-Tech Zone Comprehensive Development Report, using the formula “total energy consumption = industrial output × energy consumption per unit of output.”
The input indicators account for both production and innovation factors. Capital is measured by the total assets of each zone at year-end, reflecting the capacity of fixed asset support. Labor is represented by the number of R&D personnel, indicating the level of knowledge input. Technological input is measured by R&D expenditure, capturing its role in promoting low-carbon technologies and cleaner production. Land is represented by the built-up area of each zone. Energy input is measured by total energy consumption, which is calculated indirectly based on the China National High-Tech Zone Comprehensive Development Report, using the formula “total energy consumption = industrial output × energy consumption per unit of output.”
The output indicators encompass both desired and unpleasant outcomes. The desired result is total industrial production, while the undesirable output is CO2 emissions, which are extracted by matching the gridded carbon emission data from the EDGAR database with the vector boundaries of the HTZs. Economic, technological, and regional data are primarily obtained from the China Torch Statistical Yearbook and are supplemented and cross-validated with data from the China City Statistical Yearbook, China Environmental Statistical Yearbook, and various county- and district-level statistical yearbooks.
4 Results
4.1 National high-tech zone carbon emission efficiency measurement
4.1.1 Regional differences and national overview
Based on the assumption of NIRS, this study statistically assesses the carbon emission efficiency of 178 national HTZs between 2008 and 2023 using a non-oriented Super-SBM model with unwanted outputs. Their low-carbon transition features are methodically examined from three angles: regional disparities, park-level efficiency ratings, and industrial combinations.
Overall, the carbon emission efficiency of national HTZs has evolved through four stages: quick improvement, volatile adjustment, steady development, and short-term fall (Figure 1). In 2009, efficiency reached a temporary peak under the combined influence of the global financial crisis and China’s domestic demand expansion policies. Between 2011 and 2014, the expansion of energy-intensive industries and increasing regional development disparities led to a significant decline in efficiency. In 2016, the initial implementation of carbon market pilot programs began to take effect, driving a gradual recovery in efficiency. From 2017 to 2020, guided by the “carbon peaking” target, continued investment in clean energy and industrial restructuring sustained efficiency growth. Although the COVID-19 pandemic posed challenges in 2020, the digital economy helped maintain efficiency at a relatively high level. Between 2021 and 2023, efficiency declined to approximately 0.84, primarily due to a rebound in industrial carbon intensity, rising carbon investment elasticity, and shortages of hydropower.
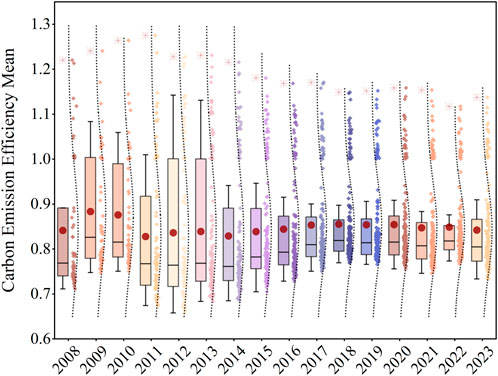
Figure 1. Average carbon emission Efficiency (2008–2023).
Building on this foundation, regional comparison results (Figure 2) reveal a clear “higher in the south, lower in the west” spatial pattern of carbon emission efficiency across the eight integrated economic regions. The Southern Coastal region exhibits the highest efficiency (0.878), followed by the Northeast (0.863) and the Middle Reaches of the Yangtze River (0.862), which show similar levels. The Eastern Coastal (0.856), Southwest (0.850), and Northern Coastal (0.849) regions fall into the intermediate range, while the Yellow River Midstream (0.800) and Northwest (0.772) regions display relatively low efficiency levels. To further uncover intra-regional characteristics, the following section examines carbon emission efficiency from the perspective of park-level ratings.
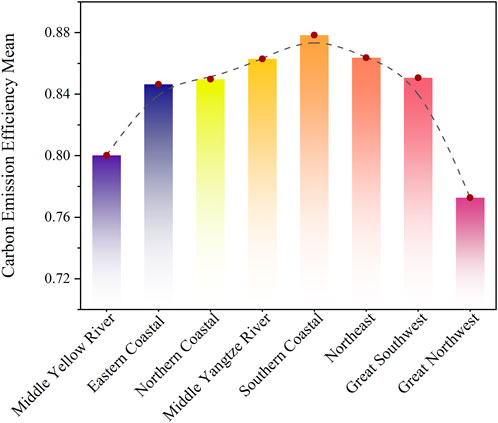
Figure 2. Regional average carbon emission efficiency.
4.1.2 Tiered carbon emission efficiency assessment in national high-tech zones
In order to describe national HTZs' carbon emission efficiency levels across different regions, a rating system was established based on average efficiency values: Zones achieving an average efficiency ≥1.0 are designated “Excellent”, those in the range of 0.9–1.0 and 0.7–0.9 are considered “Good” and “Average”, respectively, while those below 0.7 are regarded as “Poor.” Figure 3 illustrates the spatial distribution and rating results of national HTZs.
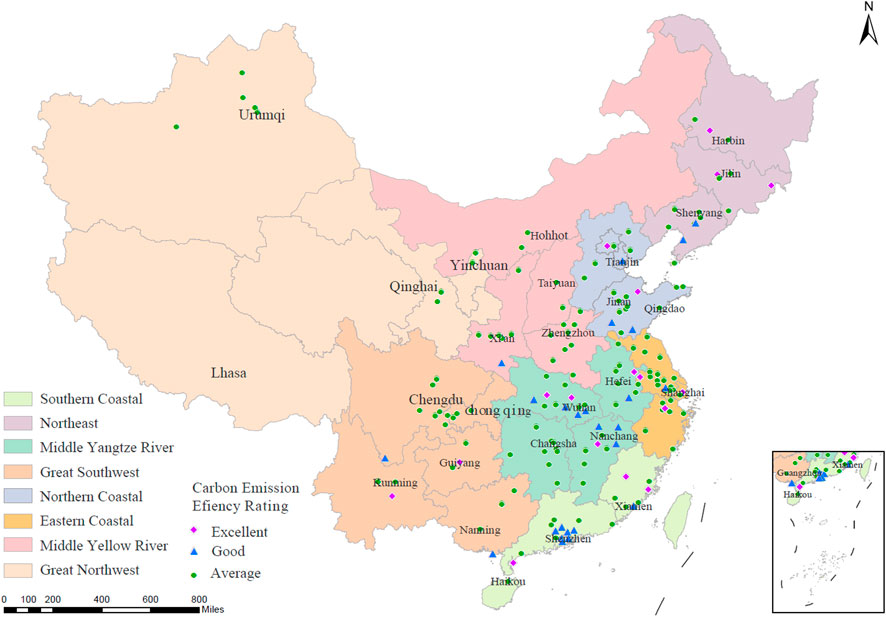
Figure 3. Regional carbon emission efficiency grading map of HTZs.
In the Southern Coastal Economic Region (Fujian, Guangdong, Hainan), which comprises 22 national HTZs, 50% are rated “Excellent” or “Good.” Putian (1.062), Sanming (1.033), and Zhanjiang (1.010) perform particularly well. Leveraging locational, policy, and technological advantages, this region has achieved synergy between ecological and economic benefits. Parks have pursued diversified green transition pathways through industrial decarbonization, green finance, and technological innovation.
In the Northeast Economic Region (Liaoning, Jilin, Heilongjiang), 31.3% of the 16 national HTZs are rated “Excellent” or “Good.” Changchun (1.083), Yanji (1.065), and Daqing (1.050) lead the region. Efficiency improvements have been achieved through smart energy management, CCUS applications, and cleaner production, with technological upgrading and resource recycling emerging as key drivers.
In the Middle Reaches of the Yangtze River Economic Region (Hubei, Hunan, Jiangxi, Anhui), 37.6% of the 38 national HTZs fall into the “Excellent” or “Good” categories. Yichun promotes green production through its full lithium battery industry chain, while Xiaogan leverages 5G industrial internet to increase the share of green electricity. However, parks such as Jiujiang and Xianning are constrained by a single energy structure and low industrial energy efficiency.
In the Southwest Economic Region (Yunnan, Guizhou, Sichuan, Guangxi, Chongqing), 33.3% of the 22 national HTZs fall into the “Excellent” or “Good” categories. Yuxi has built a zero-carbon park, and Guiyang has implemented green access standards, both significantly reducing emissions. However, Panzhihua’s vanadium–titanium industry faces technological constraints limiting its mitigation potential, and Beihai lacks a well-developed circular system. Overall, the region’s green development foundation remains weak, requiring accelerated technological upgrading and structural optimization.
In the Northern Coastal Economic Region (Beijing–Tianjin–Hebei, Shandong), 25% of the 20 national HTZs achieve “Excellent” or “Good” ratings. Zhongguancun in Beijing has taken the lead through zero-carbon park initiatives and AI-based energy management. The Yellow River Delta has optimized its energy structure via carbon capture and integrated “source–grid–load–storage” systems. The regional promotion of “AI + energy” models and expansion of blue carbon pilot projects are contributing to coordinated emission reduction.
In the Eastern Coastal Economic Region (Shanghai, Jiangsu, Zhejiang), 16.7% of the 24 national HTZs fall into the “Excellent” or “Good” categories. Zhangjiang has improved efficiency through waste heat recovery, photovoltaic power generation, and ground-source heat pumps, while Xiaoshan Linjiang has advanced a “materials–manufacturing–recycling” closed-loop transformation. These efforts have produced notable results in energy optimization and carbon reduction, with strong demonstration effects.
In the Yellow River Midstream Economic Region (Shaanxi, Shanxi, Henan, Inner Mongolia), none of the 21 national HTZs are rated “Excellent,” and only Ankang is rated “Good.” The region’s industrial structure is dominated by coal, chemicals, and metallurgy, leading to high carbon intensity. While Xi’an and Yulin have begun developing full hydrogen and photovoltaic industry chains, and some parks are introducing carbon capture technologies with demonstration potential, the region faces pronounced issues of industrial homogeneity and resource misallocation.
In the Northwest Economic Region (Gansu, Qinghai, Ningxia, Tibet, Xinjiang), all 11 national HTZs fall into the “Medium” category. Despite increases in renewable energy capacity, multiple constraints—including grid regulation limitations, the concentration of heavy industries, coal dependence, technological lag, and insufficient policy support—have hindered efficiency improvements.
4.1.3 Carbon efficiency analysis of Dominant Industry Combinations
To analyze the impact of dominant industries on carbon emission efficiency, this study identifies the two industries with the highest shares of total industrial output in each national HTZs, based on the 2018 revised Catalogue for the Review of Chinese Development Zones issued by six ministries and industry data from the official websites of each park. These dominant industries are then used to construct an industrial combination–carbon emission efficiency matrix (Figure 4). The results reveal substantial differences in efficiency across industrial combinations: high-efficiency combinations exhibit synergistic effects, whereas low-efficiency combinations face significant risks of efficiency loss.
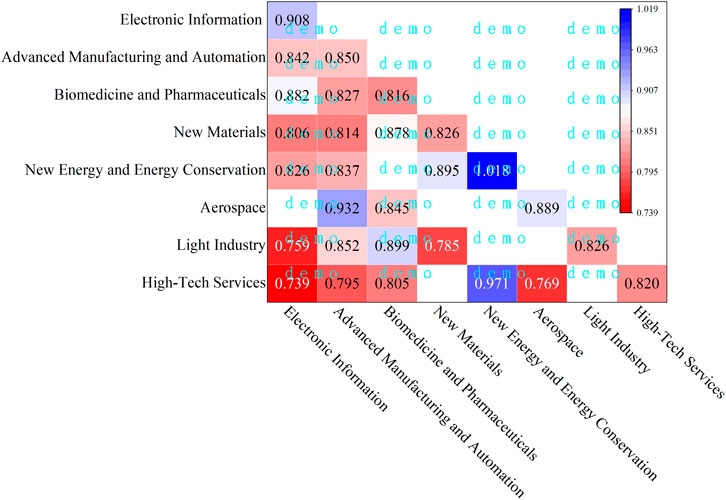
Figure 4. Efficiency matrix of dominant industry combinations.
Industrial combinations led by the new energy sector achieve the highest efficiency levels. The combination of new energy and energy-saving industries reaches an efficiency score of 1.018. Combinations of new energy with high-tech services (0.971) and new materials (0.895) also perform well. These combinations are typically supported by well-developed green infrastructure and highly integrated industrial chains, with extensive applications in photovoltaics, energy storage, and carbon nanomaterials, resulting in outstanding resource use efficiency.
Several “strong–weak” industrial combinations also show considerable improvement potential. The electronic information industry alone has an efficiency of 0.908, but its combination with biopharmaceuticals yields an efficiency of 0.882, reflecting the role of intelligent manufacturing technologies in improving energy efficiency within the pharmaceutical sector. The combination of advanced manufacturing and aerospace reaches an efficiency of 0.932, indicating that precision manufacturing offers energy-saving advantages in complex processing stages. Such combinations generally feature complete chains from R&D to application, demonstrating strong industrial linkage effects.
In contrast, low-efficiency combinations reflect issues of structural mismatch and insufficient integration. The combination of light industry and new materials achieves an efficiency of only 0.785, while the combination of high-tech services and electronic information is even lower at 0.739. These results expose weaknesses such as high energy consumption in traditional manufacturing, inadequate technological integration, and severe resource redundancy. When light-asset services and heavy-asset manufacturing fail to connect effectively, synergistic effects are difficult to achieve, leading instead to increased energy consumption and emissions. The efficiency of the combination of high-tech services and aerospace is only 0.769, indicating a pronounced mismatch between their production chains and demand structures; the low degree of industrial linkage makes it difficult to achieve effective synergy.
Overall, high-efficiency industries exert a positive spillover effect, but the magnitude of this improvement is bounded. Conversely, combinations led by low-efficiency industries significantly drag down overall efficiency, indicating that both the technological characteristics of dominant industries and their capacity for coordination with supporting industries jointly determine overall carbon efficiency in HTZs.
4.2 Spatial correlation analysis of carbon emission efficiency
Moran’s I is used to examine the global spatial autocorrelation of carbon emission efficiency across national HTZs (Table 2). The index is negative for all years, with only the 2020 P-value not reaching statistical significance. This indicates an overall “high–low” or “low–high” spatial distribution pattern, meaning that high-efficiency parks are more likely to be located near low-efficiency parks. Such negative spatial correlation reflects insufficient technological diffusion and resource competition among regions, resulting in a clear “efficiency siphoning” effect.
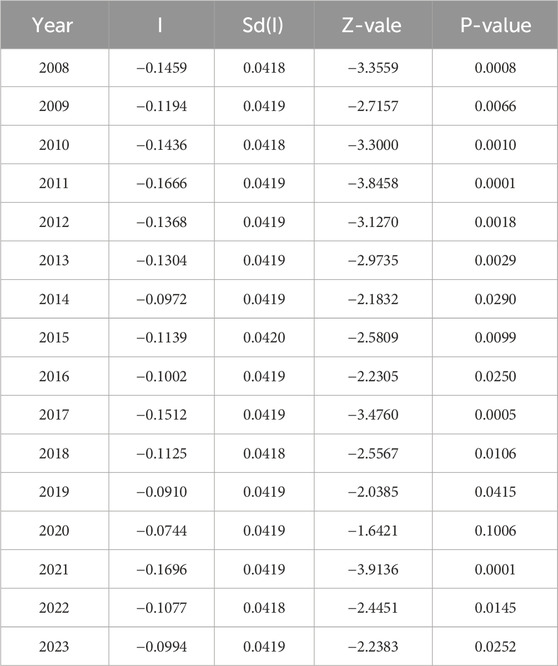
Table 2. Global spatial autocorrelation test results.
The absolute values of the Z-statistics are generally greater than 2 for all years, and the standard deviation remains stable between 0.0418 and 0.0420, demonstrating strong statistical robustness. In 2020, the Z-value was −1.6421. Due to the impact of the COVID-19, pandemic, the carbon emission efficiency of some parks deviated from their original spatial distribution, leading to a temporary weakening of overall spatial association.
Based on the 2023 local Moran scatter plot (Figure 5), several typical spatial clustering patterns can be identified. Parks such as Chuzhou and Benxi fall into the first quadrant, exhibiting a “high–high” clustering pattern. This indicates positive interactions with neighboring parks through industrial chain linkages, resource sharing, and coordinated policies. Parks such as Zizhu in Shanghai, Jingyue in Changchun, and Harbin appear in the second quadrant, forming a “low–high” pattern, which suggests that these lower-efficiency parks possess strong potential for technological absorption and catch-up. No significant clusters are observed in the third quadrant, indicating that low-efficiency parks have not formed stable spatial clusters, consistent with the rating results showing no parks in the “Poor” category. Parks such as Zhongguancun in Beijing and Zhangjiang in Shanghai fall into the fourth quadrant, showing a “high–low” clustering pattern, where high-efficiency parks are surrounded by lower-efficiency ones, revealing significant regional disparities in low-carbon development levels.
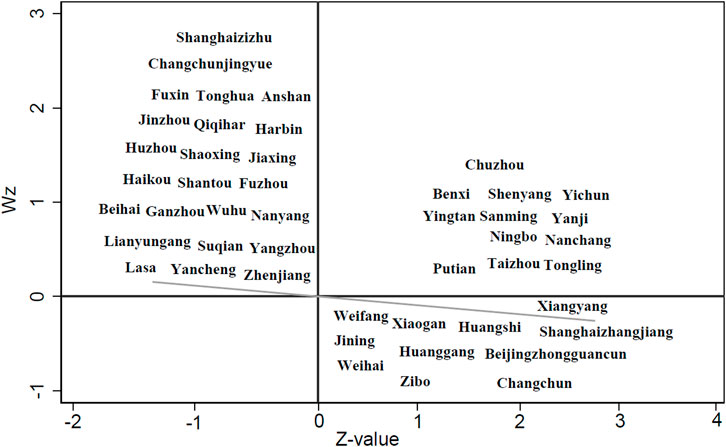
Figure 5. Moran scatterplot of carbon emission efficiency in 2023.
Accordingly, efforts should focus on leveraging the demonstration and spillover effects of “high–high” clusters to promote the diffusion of technologies and management practices. For “low–high” transitional zones, targeted policies should enhance technology spillovers and institutional alignment to support efficiency improvements. In “high–low” clusters, coordinated regional development should be strengthened to address resource misallocation and efficiency divergence caused by uneven development levels.
4.3 Analysis of the main driving factors of carbon emission efficiency in national high-tech zones
After testing for multicollinearity, redundant variables were removed and only indicators with VIF values below 10 were retained (Table A1). Based on this, a 16-indicator system was constructed, encompassing four dimensions: economic development and industrial structure, technological innovation and R&D, environmental policy and green finance, and human and social development (Table 3). This system integrates both park-level input–output characteristics and city-level policy, financial, and social factors. The former serve as endogenous variables that directly influence carbon emission efficiency, while the latter act as exogenous environmental factors that indirectly affect efficiency performance.
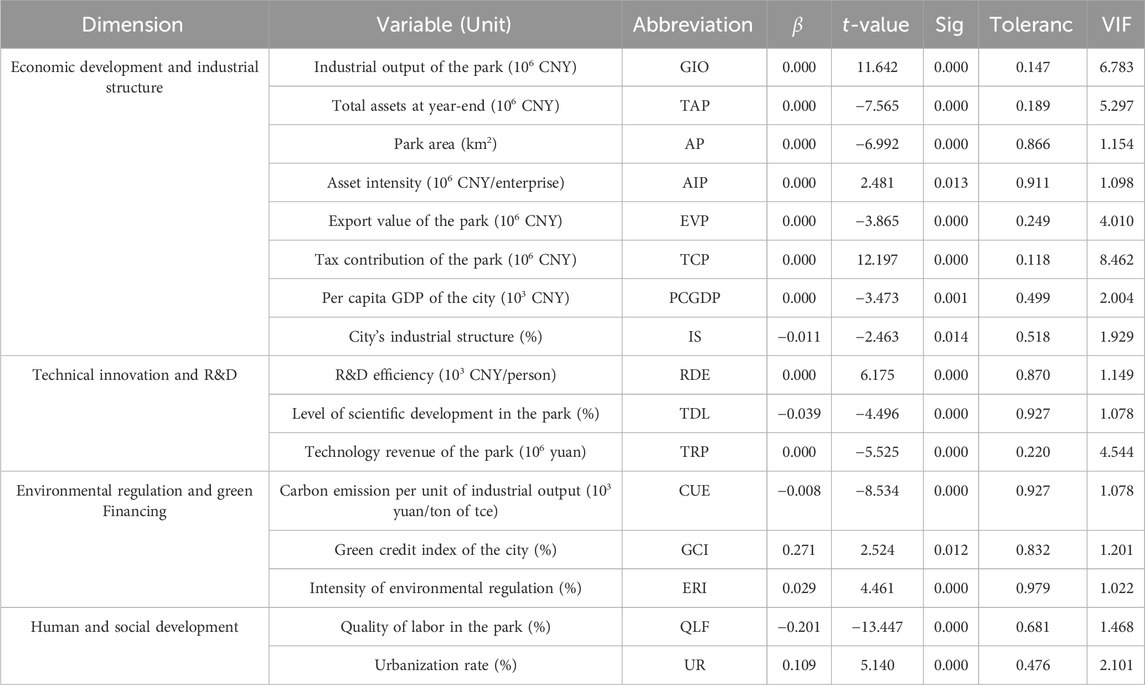
Table a1. VIF test results for driving factors.
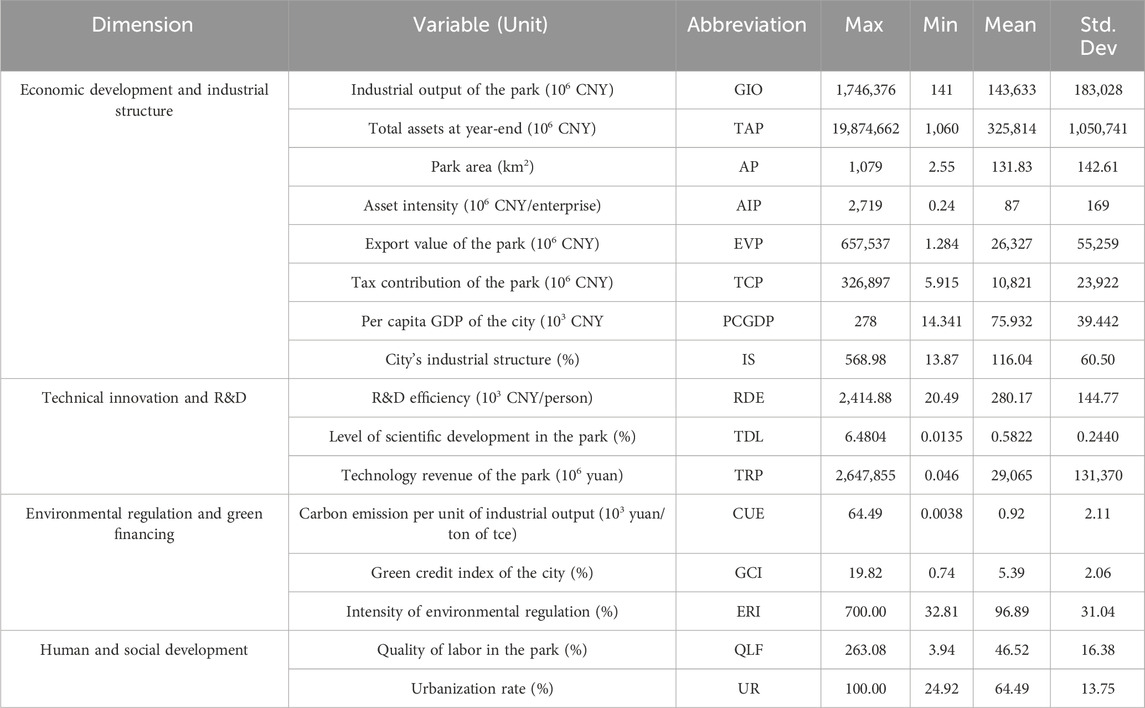
Table 3. Statistical description of driving factors.
Table 4 shows the determinant power (q-values) and significance levels of the factors that influence overall and regional carbon emission efficiency in national HTZs. All variables pass the 1% significance test, confirming the statistical reliability of the results. At the national level, park area (AP, q = 0.564) and carbon emissions per unit of industrial output (CUE, q = 0.312) are identified as the key factors influencing carbon emission efficiency, indicating that spatial scale and carbon intensity per unit of output exert a direct and decisive effect on efficiency. Industrial output (GIO, q = 0.279) and tax contribution (TCP, q = 0.208) follow, reflecting the positive role of economic dynamism and fiscal capacity.
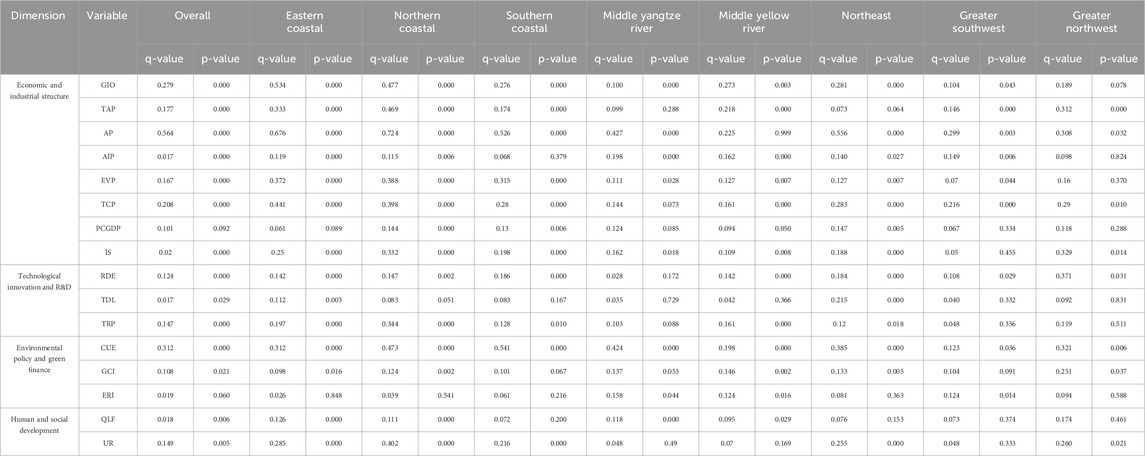
Table 4. Explanatory power (q) and significance levels (p) of driving factors across economic regions.
Significant regional differences exist in the driving factors. In the Eastern Coastal region, efficiency improvements rely primarily on AP (0.676) and GIO (0.534), while TCP (0.441) and EVP (0.372) also play strong roles, indicating that economic scale and openness are important supports for efficiency gains. TRP (0.197) has a limited effect, and ERI, is not significant, revealing insufficient policy regulation intensity. The Northern Coastal region exhibits a similar pattern, with AP (0.724), TRP (0.344), and IS (0.332) playing prominent roles, while ERI, remains insignificant.
In the Southern Coastal region, CUE (0.541) and AP (0.526) are the dominant drivers, while AIP (0.379) and TDL (0.167) are not significant, suggesting that technological investment and resource efficiency have not yet been effectively translated into emission reduction advantages. Similarly, in the Middle Reaches of the Yangtze River region, AP (0.427) and CUE (0.424) dominate, whereas TAP (0.288) and RDE (0.172) are not significant, indicating weak linkages between asset investment and innovation output.
In the Northeast region, AP (0.556) and CUE (0.385) are the main drivers, TCP (0.283) plays a moderate role, and TDL (0.215) and RDE (0.184) have noticeable effects, reflecting the region’s strong potential for technological progress. In the Yellow River Midstream region, GIO (0.273) and CUE (0.198) dominate, while TDL is not significant, indicating that the traditional industrial structure remains the primary bottleneck for efficiency improvement.
In the Southwest region, AP (0.299), TCP (0.216), and AIP (0.149) contribute relatively more than other factors, but overall determinant power remains low. IS and technological variables (TDL, TRP) are not significant, indicating that industrial structure and technological levels still constrain efficiency improvement. In the Northwest region, IS (0.329) and RDE (0.371) are the dominant factors, whereas AIP is not significant, suggesting that industrial structure and technological innovation exert strong influences on carbon emission efficiency, while capital utilization efficiency remains relatively weak.
Overall, endogenous factors such as AP, GIO, and TCP generally exhibit higher determinant power and constitute the core drivers of efficiency improvements. The influence of exogenous factors varies considerably across regions: GCI, IS, and ERI play significant roles only in certain areas, reflecting the regional specificity of policy and institutional effects. The role of technological innovation is nonlinear: it is significant in the Northeast and Northwest regions but shows limited conversion effects in the Middle Reaches of the Yangtze River and Yellow River Midstream regions. To improve carbon emissions in national HTZs, it's important to consolidate the economic and industrial base while also enhancing technological innovation and governmental assistance at the regional level.
4.4 Spatiotemporal heterogeneity of national high-tech zones carbon emission Efficiency Drivers
In the previous section, the Geographical Detector was used to identify the explanatory power of key driving factors for carbon emission efficiency in national HTZs from a static perspective. To further uncover spatiotemporal heterogeneity, this study introduces the Multi-Scale Geographically and Temporally Weighted Regression (MGTWR) model to analyse the non-stationarity of these factors across spatial and temporal dimensions from a dynamic perspective. The applicability of the model is verified by comparing it with Global OLS and GTWR models (Table 5). The results show that MGTWR achieves the highest goodness of fit and yields the lowest AICc and RSS values, indicating its superior ability to capture spatiotemporal heterogeneity and more accurately reflect the underlying data characteristics.
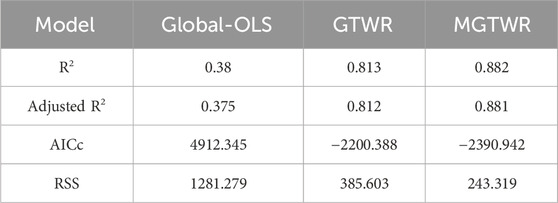
Table 5. Regression model comparison of drivers.
The spatiotemporal characteristics of the estimated parameters for each variable are presented in Table 6. Bandwidths, expressed as multiples of the minimum spatial distance (68.21 km), indicate the spatial and temporal extent of each variable’s influence (Yu and Fotheringham, 2025). A larger spatial bandwidth reflects a broader impact range, with the spatial scale approaching a global pattern; a longer temporal bandwidth indicates more persistent effects and greater structural stability. Based on spatial scales, the 16 variables can be categorized as local (<200 km), regional (200–700 km), and global (>700 km). Temporal scales are measured in years and classified as short-term (<0.3 years), medium-term (0.3–1.0 years), and long-term (>1.0 years) responses.
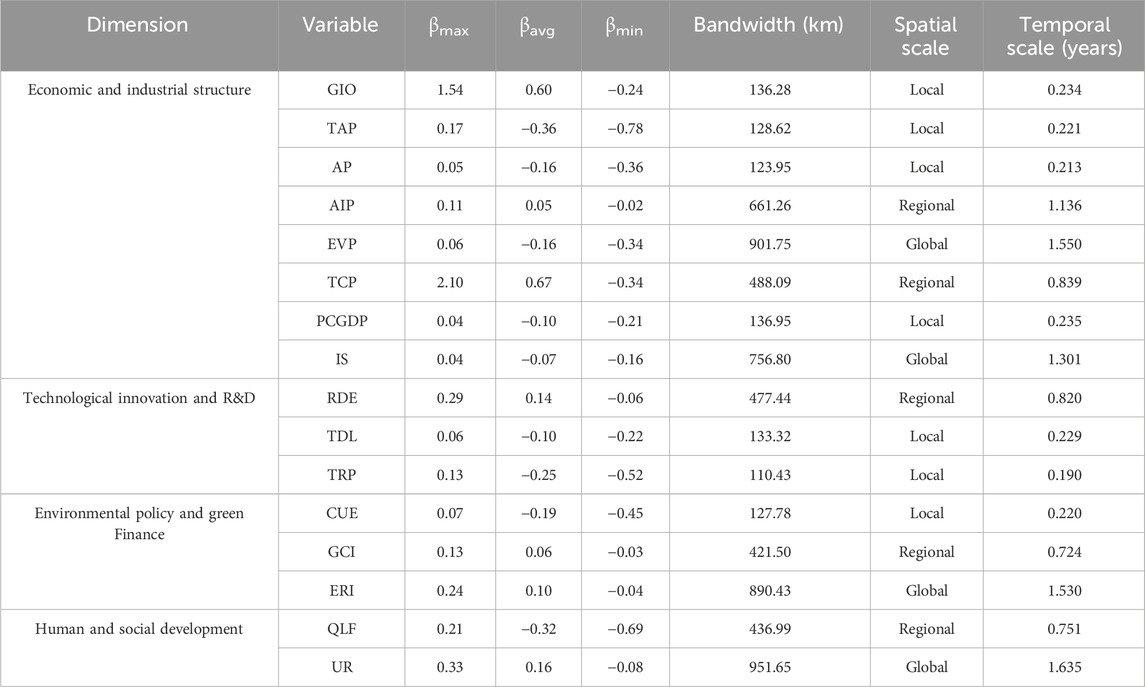
Table 6. Spatiotemporal characteristics of estimated parameters.
Global-scale variables (EVP, IS, ERI, UR) have bandwidths exceeding 750 km, covering the entire country with relatively small regional differences. All exhibit long-term response characteristics, indicating persistent and stable impacts that are less affected by short-term policy or market fluctuations. Among them, UR shows the longest temporal scale, reflecting its dependence on long-term public service provision and infrastructure development, which can continuously enhance carbon emission efficiency over extended periods.
Regional-scale variables (AIP, TCP, RDE, GCI, QLF) have bandwidths ranging from 421 to 661 km, with impacts spanning provincial and economic regions. These variables display medium-term response characteristics, exerting their influence gradually through fiscal support, technological R&D and transformation, green finance investment, and human capital development. TCP (
Local-scale variables (GIO, TAP, AP, PCGDP, TDL, TRP, CUE) have bandwidths between 110.43 and 137 km—approximately twice the minimum neighborhood distance—and their impacts are mostly confined to parks and their surrounding cities. These variables exhibit short-term response characteristics, with TRP (0.19 years), CUE (0.22 years), and TDL (0.229 years) being particularly sensitive to policy and market changes and showing high volatility. Notably, CUE (
Based on the Geographical Detector ranking of driving forces, the five local-scale variables with the strongest heterogeneity were selected for visualization of their average estimated coefficients (
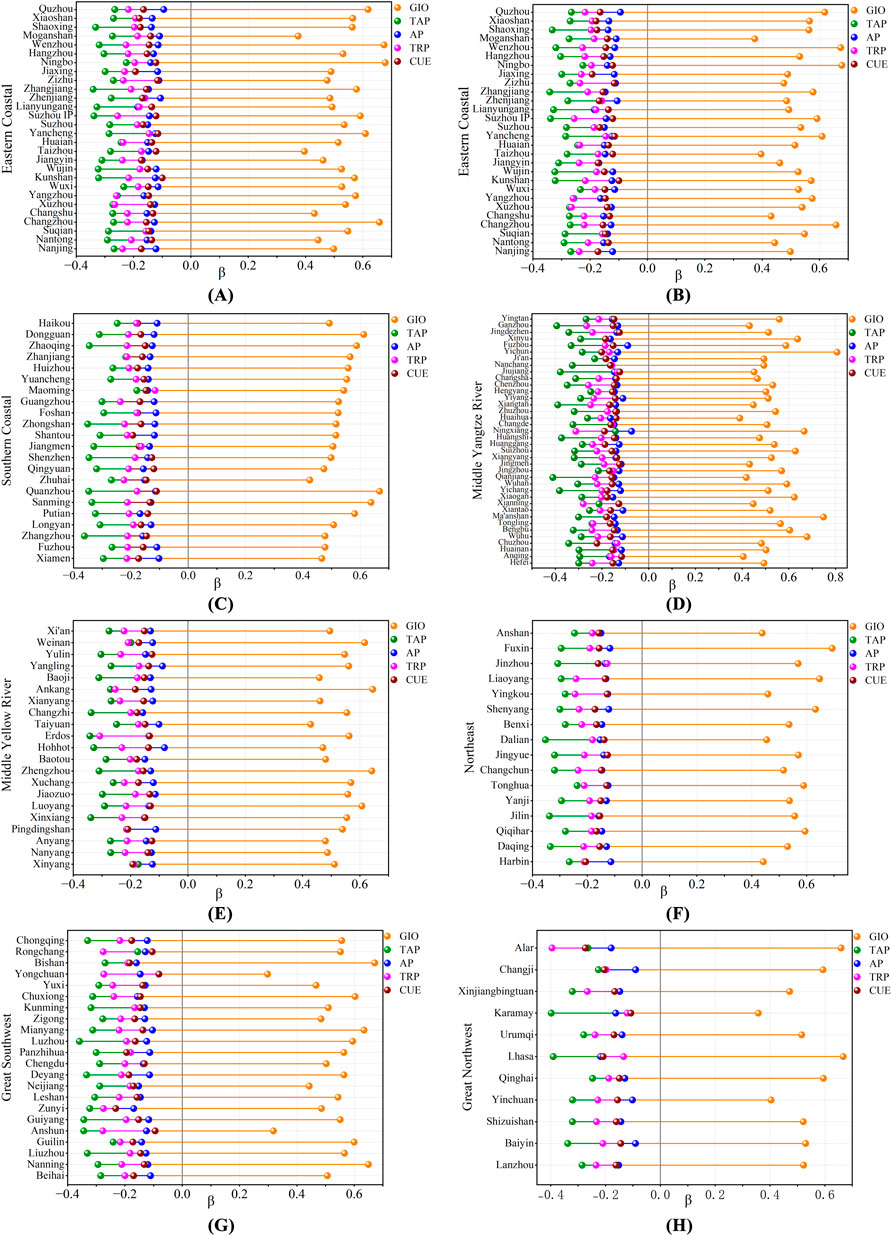
Figure 6. Local-scale spatial visualization of carbon-efficiency drivers by economic region: (A) Eastern coastal, (B) northern coastal, (C) southern coastal, (D) middle reaches of the yangtze river, (E) middle reaches of the yellow river, (F) northeast, (G) southwest, and (H) northwest economic regions.
Total assets at year-end (TAP) generally exhibit a negative effect on carbon emission efficiency, with an average coefficient (
Park area (AP) reflects the carbon burden effect of spatial expansion, with
The technological development level (TDL) shows a
Carbon emissions per unit of industrial output (CUE) are consistently negatively correlated with efficiency, with
In summary, improvements in industrial output efficiency depend critically on clean production processes and refined management. Capital and land expansion, when supported by technological progress, can simultaneously increase capacity and reduce carbon emissions per unit of output, mitigating the negative effects of high-carbon asset lock-in. Conversely, when R&D investment is insufficient and technology transfer efficiency is low, expansion tends to be accompanied by rising energy consumption and emissions, ultimately leading to declines in efficiency.
5 Discussion
Previous studies have often relied on city-level carbon emission data to indirectly estimate park level efficiency; however, this approach fails to accurately reflect the actual emission characteristics within parks. In contrast, this study employs EDGAR–CO2 gridded emission data based on emission inventories and matches them with the vector boundaries of national HTZs to directly extract total park-level carbon emissions. This method improves both the spatial matching accuracy and the credibility of the emission data.
The study employs a non-oriented Super-SBM model with undesirable outputs under a NIRS assumption to measure efficiency. By simultaneously optimizing both inputs and outputs, this approach helps avoid, to some extent, inflated efficiency scores arising from scale expansion, and better reflects real-world conditions in which efficiency improvements are primarily driven by technological progress. In addition, a carbon emission efficiency matrix of leading industry combinations is constructed to link park-level efficiency performance with their dominant industrial structures. This approach reveals the emission reduction potential and efficiency gaps associated with different industry portfolios, offering a new analytical perspective on the low-carbon transition of national HTZs.
The study classifies the driving factors into four dimensions—economic and industrial structure, technological innovation and R&D, environmental policy and green finance, and human and social development—and integrates the geographic detector with the multiscale geographically and MGTWR model. This extends the analysis from a static perspective to a spatiotemporal one, clarifying the spatiotemporal heterogeneity and multi-scale mechanisms of how these driving factors affect efficiency.
Although this study conducts a systematic exploration of efficiency measurement, regional disparities, and driving factors, it still has certain limitations that need to be further improved in future research. While the EDGAR emission inventory offers high international comparability and spatial resolution, it is subject to uncertainties in inventory compilation and biases in underlying energy statistics. Therefore, the carbon emissions of HTZs extracted using EDGAR-CO2 data should be understood as the best possible estimates under current data conditions, rather than absolutely precise values.
The input–output indicator system adopts total industrial output and CO2 emissions as the desirable and undesirable outputs, respectively, without incorporating other economic indicators or atmospheric pollutant emission indicators, which may to some extent constrain a more comprehensive representation of the connotation of green and low-carbon development. Subject to data availability, future studies could enhance the explanatory power of carbon emission efficiency evaluation by introducing multiple desirable and undesirable output indicators.
The combined use of the geographic detector and the MGTWR model in this study is mainly intended to analyze spatial correlations and spatiotemporal heterogeneity among variables, and to identify the scales at which the driving factors are more strongly associated with carbon emission efficiency, rather than to directly establish causal relationships. Future research could incorporate causal inference approaches such as quasi-natural experiments and event-study designs, with a particular focus on how environmental regulation, green finance, and carbon markets interact to influence the carbon emission efficiency of national HTZs and shape their emission reduction pathways, thereby providing an empirical basis for formulating more operational low-carbon transition policies.
6 Conclusion
The study measures the carbon emission efficiency of 178 national HTZs from 2008 to 2023 and conducts an empirical analysis from three perspectives: overall, regional, and industrial. The results show that the carbon emission efficiency of HTZs exhibits an evolutionary pattern of “fluctuating upward and gradually stabilizing,” with only 24% of the parks rated as “excellent or good,” while most fall into the “medium” category. This indicates that, under the guidance of the “dual-carbon” goals and the innovation-driven strategy, national HTZs have already achieved notable emission reduction outcomes. However, the fact that only about 24% of the parks reach an excellent level and the majority remain at a medium level also suggests substantial room for improvement in their overall carbon emission efficiency.
The efficiency pattern across the eight integrated economic regions exhibits a “high in the south, low in the north” distribution. The Southern Coastal and Eastern Coastal economic regions show relatively higher efficiency, while the Great Northwest and the Yellow River Middle Reaches lag behind, indicating that regional differences in technological development, industrial structure, and institutional arrangements have a pronounced impact on carbon emission efficiency.
The carbon emission efficiency of national HTZs exhibits an overall pattern of negative spatial correlation, characterized by high-low and low-high adjacency patterns among parks, indicating problems such as insufficient technological diffusion and unbalanced resource allocation across regions. Park area (AP) and carbon emissions per unit of industrial output (CUE) are key variables affecting efficiency. The direction and magnitude of the effects of different factors are not consistent across temporal and spatial scales, with the heterogeneity of local-scale variables such as GIO, TAP, AP, TDL, and CUE being particularly pronounced. This suggests that the carbon emission efficiency of national HTZs is jointly shaped by macro-level policies, resource endowments, and their stage of development.
These findings suggest that improving carbon emission efficiency requires expanding production capacity on the basis of technological progress, optimizing energy use and industrial structure, and reducing carbon emissions per unit of output through the efficient allocation of land and capital. At the same time, it is necessary to design context-specific mitigation pathways that fully respect regional heterogeneity and stages of development, so as to advance economic growth and the low-carbon transition in a coordinated manner.
Data availability statement
The original contributions presented in the study are included in the article/Supplementary Material, further inquiries can be directed to the corresponding author.
Author contributions
CL: Software, Writing – original draft, Formal Analysis, Methodology, Visualization, Data curation, Validation, Conceptualization, Writing – review and editing. JH: Writing – review and editing, Conceptualization, Funding acquisition, Resources, Project administration, Validation, Supervision.
Funding
The author(s) declared that financial support was received for this work and/or its publication. This research was funded by the National Social Science Foundation of China, grant number 22BTJ001.
Conflict of interest
The author(s) declared that this work was conducted in the absence of any commercial or financial relationships that could be construed as a potential conflict of interest.
Generative AI statement
The author(s) declared that generative AI was not used in the creation of this manuscript.
Any alternative text (alt text) provided alongside figures in this article has been generated by Frontiers with the support of artificial intelligence and reasonable efforts have been made to ensure accuracy, including review by the authors wherever possible. If you identify any issues, please contact us.
Publisher’s note
All claims expressed in this article are solely those of the authors and do not necessarily represent those of their affiliated organizations, or those of the publisher, the editors and the reviewers. Any product that may be evaluated in this article, or claim that may be made by its manufacturer, is not guaranteed or endorsed by the publisher.
Supplementary material
The Supplementary Material for this article can be found online at: https://www.frontiersin.org/articles/10.3389/fenvs.2025.1731000/full#supplementary-material
References
Albitar, K., Borgi, H., Khan, M., and Zahra, A. (2023). Business environmental innovation and CO2 emissions: the moderating role of environmental governance. Bus. Strategy Environ. 32, 1996–2007. doi:10.1002/bse.3232
Afanasyev, D. O., Fedorova, E. A., and Popov, V. U. (2015). Fine structure of the price–demand relationship in the electricity market: multi-scale correlation analysis. Energy Econ. 51, 215–226. doi:10.1016/j.eneco.2015.07.011
Amirteimoori, A., Zadmirzaei, M., Susaeta, A., and Amirteimoori, A. (2024). Efficiency analysis and CO2 emission reduction strategies in the US forest sector: a data envelopment analysis approach. Eur. J. For. Res. 143, 903–916. doi:10.1007/s10342-024-01663-3
Asteriou, D., and Bashmakova, Y. (2013). Assessing the impact of oil returns on emerging stock markets: a panel data approach for ten central and eastern european countries. Energy Econ. 38, 204–211. doi:10.1016/j.eneco.2013.02.011
Azizalrahman, H., and Hasyimi, V. (2019). A model for urban sector drivers of carbon emissions. Sustain. Cities Soc. 44, 46–55. doi:10.1016/j.scs.2018.09.035
Baloch, M. A., and Danish, D. (2022). CO2 emissions in BRICS countries: what role can environmental regulation and financial development play? Clim. Change 172, 9. doi:10.1007/s10584-022-03362-7
Charnes, A., Cooper, W. W., and Rhodes, E. (1978). Measuring the efficiency of decision making units. Eur. J. Oper. Res. 2, 429–444. doi:10.1016/0377-2217(78)90138-8
Elahi, E., Zhu, M., Khalid, Z., and Wei, K. (2024). An empirical analysis of carbon emission efficiency in food production across the yangtze river basin: towards sustainable agricultural development and carbon neutrality. Agric. Syst. 218, 103994. doi:10.1016/j.agsy.2024.103994
ElBannan, M. A., and Löffler, G. (2024). How effectively do green bonds help the environment? J. Bank. Finance 158, 107051. doi:10.1016/j.jbankfin.2023.107051
Fotheringham, A. S., Crespo, R., and Yao, J. (2015). Geographical and temporal weighted regression (GTWR): geographical and temporal weighted regression. Geogr. Anal. 47, 431–452. doi:10.1111/gean.12071
Ganley, J. A., and Cubbin, J. (1992). Public sector efficiency measurement: applications of data envelopment analysis. Amsterdam: North-Holland.
IEA (2021). An energy sector roadmap to carbon neutrality in China – analysis. Paris: Iea. Available online at: https://www.iea.org/reports/an-energy-sector-roadmap-to-carbon-neutrality-in-china (Accessed September 10, 2025).
IPCC (2023). Climate change 2022 - mitigation of climate change: working group III contribution to the sixth assessment report of the intergovernmental panel on climate change. 1st Edn. Cambridge University Press. doi:10.1017/9781009157926
Jiang, H., Yin, J., Qiu, Y., Zhang, B., Ding, Y., and Xia, R. (2022). Industrial carbon emission efficiency of cities in the pearl river basin: spatiotemporal dynamics and driving forces. Land 11, 1129. doi:10.3390/land11081129
Johansson, L., Jalkanen, J.-P., and Kukkonen, J. (2017). Global assessment of shipping emissions in 2015 on a high spatial and temporal resolution. Atmos. Environ. 167, 403–415. doi:10.1016/j.atmosenv.2017.08.042
Kacprzyk, A., and Kuchta, Z. (2020). Shining a new light on the environmental kuznets curve for CO2 emissions. Energy Econ. 87, 104704. doi:10.1016/j.eneco.2020.104704
Li, L., McMurray, A., Li, X., Gao, Y., and Xue, J. (2021). The diminishing marginal effect of R&D input and carbon emission mitigation. J. Clean. Prod. 282, 124423. doi:10.1016/j.jclepro.2020.124423
Lin, X., Zhu, X., Han, Y., Geng, Z., and Liu, L. (2020). Economy and carbon dioxide emissions effects of energy structures in the world: evidence based on SBM-DEA model. Sci. Total Environ. 729, 138947. doi:10.1016/j.scitotenv.2020.138947
Liu, C., Tu, J., and He, Y. (2023). Measurement of China’s human development index and analysis of its influencing factors from the perspective of new development concept. Soc. Indic. Res. 167, 213–268. doi:10.1007/s11205-023-03105-w
Lyu, Y., Yan, K., Tian, J., and Chen, L. (2023). High cost of waste treatment calls for systematic rethinking: a case study for a chemical industrial park in China. J. Ind. Ecol. 27, 362–375. doi:10.1111/jiec.13362
Moran, P. A. P. (1950). A test for the serial independence of residuals. Biometrika 37, 178–181. doi:10.1093/biomet/37.1-2.178
Nahm, K.-B. (2000). The evolution of science parks and metropolitan development. Int. J. Urban Sci. 4, 81–95. doi:10.1080/12265934.2000.9693465
NASA (2024). Climate change - NASA science. Available online at: https://science.nasa.gov/climate-change/(Accessed September 10, 2025).
Onwachukwu, C. I., Yan, K.-M. I., and Tu, K. (2021). The causal effect of trade liberalization on the environment. J. Clean. Prod. 318, 128615. doi:10.1016/j.jclepro.2021.128615
Opoku, E. E. O., Dogah, K. E., and Aluko, O. A. (2022). The contribution of human development towards environmental sustainability. Energy Econ. 106, 105782. doi:10.1016/j.eneco.2021.105782
State Council of the PRC (2022). High-tech zones lead innovative growth over past decade. Available online at: https://english.www.gov.cn/statecouncil/ministries/202209/15/content_WS63227abbc6d0a757729dffea.html?utm_source=chatgpt.com (Accessed September 9, 2025).
Stern, D. I. (2004). The rise and fall of the environmental kuznets curve. World Dev. 32, 1419–1439. doi:10.1016/j.worlddev.2004.03.004
Tone, K. (2001). A slacks-based measure of efficiency in data envelopment analysis. Eur. J. Oper. Res. 130, 498–509. doi:10.1016/S0377-2217(99)00407-5
Tone, K. (2002). A slacks-based measure of super-efficiency in data envelopment analysis. Eur. J. Operational Res. 143, 32–41. doi:10.1016/S0377-2217(01)00324-1
Waheed, R., Sarwar, S., and Wei, C. (2019). The survey of economic growth, energy consumption and carbon emission. Energy Rep. 5, 1103–1115. doi:10.1016/j.egyr.2019.07.006
Wang, J., Li, X., Christakos, G., Liao, Y., Zhang, T., Gu, X., et al. (2010). Geographical detectors-based health risk assessment and its application in the neural tube defects study of the heshun region, China. Int. J. Geogr. Inf. Sci. 24, 107–127. doi:10.1080/13658810802443457
Wu, C., Ren, Fu, Hu, W., and Du, Q. (2019). Multiscale geographically and temporally weighted regression: exploring the spatiotemporal determinants of housing prices. Int. J. Geogr. Inf. Sci. 33, 489–511. doi:10.1080/13658816.2018.1545158
Yu, X. (2023). An assessment of the green development efficiency of industrial parks in China: based on non-desired output and non-radial DEA model. Struct. Change Econ. Dyn. 66, 81–88. doi:10.1016/j.strueco.2023.04.010
Yu, H., and Fotheringham, A. S. (2025). On the calibration of multiscale geographically and temporally weighted regression models. Int. J. Geogr. Inf. Sci. 39, 1203–1222. doi:10.1080/13658816.2024.2440600
Zhou, L. (2021). Reflections on the green development of national high-tech zones under the carbon peak and carbon neutralization target in China. Chin. J. Environ. Manag. 13, 7–12. doi:10.16868/j.cnki.1674-6252.2021.06.007
Appendix A
Keywords: industrial parks, carbon emission efficiency, driving factors, spatiotemporalheterogeneity, national high-tech zones
Citation: Li C and Han J (2025) Spatiotemporal heterogeneity of driving factors of carbon emission efficiency in industrial parks: evidence from China’s national high-tech zones. Front. Environ. Sci. 13:1731000. doi: 10.3389/fenvs.2025.1731000
Received: 24 October 2025; Accepted: 30 November 2025;
Published: 10 December 2025.
Edited by:
Xu Zhao, Shandong University, ChinaReviewed by:
Suisui Chen, Ocean University of China, ChinaMeiling Wu, Chengdu University of Technology, China
Copyright © 2025 Li and Han. This is an open-access article distributed under the terms of the Creative Commons Attribution License (CC BY). The use, distribution or reproduction in other forums is permitted, provided the original author(s) and the copyright owner(s) are credited and that the original publication in this journal is cited, in accordance with accepted academic practice. No use, distribution or reproduction is permitted which does not comply with these terms.
*Correspondence: Chunling Li, bGljaHVubGluZ0BsenVmZS5lZHUuY24=