 David W. MacFarlane
- Department of Forestry, Michigan State University, East Lansing, MI, United States
Wood density is strongly related to key aspects of tree physiological performance. While many studies have examined wood density in different parts of trees, for a variety of reasons, there are very few studies that have compared within-tree density variation across many trees, of many species, drawn from a large geographic area. Here, a large data set representing thousands of trees of 78 species/genera, drawn from hundreds of sites in the Eastern United States, was compiled and analyzed to explore branch to main stem wood basic density relationships. It was expected that differences in stem vs. branch wood density among trees would be due to both genetic constraints and plastic responses in wood properties, due to tree growth responses to external environments. The results show a wide tree-to-tree variation in average branch density, relative to main stem density. However, there was a general pattern for overstory tree species to have high tree branch density relative to stem density at lower stem densities, and a declining branch to stem wood density ratio as stem density increased. Evergreen gymnosperms showed the strongest change in branch to stem wood density ratios over the range of stem wood densities and deciduous angiosperms the least; deciduous gymnosperms showed an intermediate pattern, but with generally higher branch- than stem- wood densities. More cold-hearty, shade-tolerant/drought-intolerant, evergreen gymnosperms, growing at higher latitudes, showed higher branch to stem density ratios than more shade-intolerant/drought tolerant evergreen gymnosperms growing at lower latitudes. Across all trees, canopy position had a significant influence on branch to stem density relationships, with higher branch to stem density ratios for canopy dominant trees and successively lower branch to stem density ratios for trees in successively inferior canopy positions (in terms of light availability). Understory tree species, which remain in the forest understory at maximum height, showed generally lower branch than stem densities over a wide range of stem densities. The results suggested that tradeoffs between mechanical safety and whole-tree hydraulic conductance are driving within-tree differences in wood density and highlighted the need for more detailed examinations of within-tree density variation at the whole-tree level.
Introduction
Wood density is strongly related to key aspects of a tree's physiological performance (e.g., hydraulic conductance, e.g., Markesteijn et al., 2011) and mechanical structure (e.g., risk of trunk failure under wind loads, Telewski, 2012) and is a key trait for determining wood quality, as it is strongly correlated with the properties of many forest products (Zhang and Morgenstern, 1995; Rozenberg et al., 2001). Stem wood density has also been shown to be a valuable predictor in models that estimate the biomass of standing trees, particularly for forest carbon inventories (Chave et al., 2005; MacFarlane, 2015), because at a given volume, a tree with a higher density will have greater mass. Because wood density is strongly, phylogenetically conserved, published species-average values are available which can be used a proxy for various tree functions (Chave et al., 2009). However, it is widely recognized that wood mechanical properties are also highly plastic (e.g., Telewski, 2012; Van Casteren et al., 2012; Dahle et al., 2017), such that species-specific wood densities can have wide ranges and wood density can vary from tree to tree (e.g., Niklas and Spatz, 2010) and within the various parts of trees (e.g., branches, Sarmiento et al., 2011; Momo et al., 2018).
Databases of species-specific values of wood density are often derived from wood samples drawn from wood in the lower stem or trunk (e.g., Chave et al., 2009; Niklas and Spatz, 2010), often measured at breast height on standing trees (1.3 m above the ground) (e.g., Gao et al., 2017). This widespread sampling bias is partly a product of the convenience of measuring trees close to the ground, but likely also because the most valuable wood is found in the lower trunk of tree. Recent studies have shown that trunk-based estimates of wood density can lead to bias in tree or stand -level estimates of forest biomass or carbon (e.g., Momo et al., 2018).
Much less attention has been paid to the density of branches (He and Deane, 2016), though they perform vital functions as part of the whole tree's vascular network (Smith et al., 2014) and play a complex, but less clearly understood role in mechanical stability (Sterck et al., 2006; Santini et al., 2013). From a mechanical perspective, many models assume trees are a series of cantilevered beams, with the main differences between branches vs. trunks arising from differences in the size and orientation of the parts (e.g., Van Casteren et al., 2012; Dahle et al., 2017). Tension wood may be more common in branches to maintain branch orientation (Dahle and Grabosky, 2009), but there is substantial variability even along the length of a single branch, which can make it difficult to generalize (Dahle and Grabosky, 2010). It is generally understood that both stems and branches are more flexible and vascularized when smaller or younger, with mechanical support becoming a more important function over time as the various parts of the tree increase in size (Dahle and Grabosky, 2009).
Theoretically, the density of wood in branches should be similar to the density of wood in the main stem of the same tree, because wood density reflects the intrinsic (genetic) nature of the wood produced by trees of a given species. However, only a relatively small number of studies have directly examined the relationship between branch and stem density at the whole-tree level, across multiple species (e.g., Swenson and Enquist, 2008; Sarmiento et al., 2011; Momo et al., 2018). Two studies which explicitly looked at stem vs. branch density for tropical rain forest trees species found positive, linear relationships: in French Guiana, Sarmiento et al. (2011) and for tropical tree and shrub species in Puerto Rico, Swenson and Enquist (2008). In the latter studies, an important motivation was to show that stem wood density (for standing tree biomass estimation) might be reliably predicted from the density of wood in sample branches. However, there is a great need to better understand when and why trees might have significant differences in branch vs. stem wood density, given the wide range of value of wood and branch density observable across many families and species of woody plants (Sarmiento et al., 2011) (e.g., perhaps to reduce hydraulic risk for tall trees?; see McCulloh et al., 2014). Some key questions are: What types of trees would have lower or higher branch then stem density? What types of growing conditions would cause the crown and the trunk to have different wood densities?
Here, data were compiled from thousands of trees from temperate forests in North America, covering a wide range of tree sizes and species, over a large geographic area, to try to better understand covariation in branch and stem wood density, when both are measured on the same trees. The specific goals of the research were (1) to see if patterns observed already for tropical tree species are similar or different in North America (i.e., Swenson and Enquist, 2008; Sarmiento et al., 2011), and (2) examine both intrinsic (taxonomic) and extrinsic (environmental) differences in branch vs. stem wood density, seeking to extend understanding of why trees of certain types, growing under certain environmental conditions, might differ in branch vs. stem wood density.
Materials and Methods
Data
Data for this study include a subset of the historical “legacy” tree data compiled by Radtke et al. (2016), which included measurements of tens of thousands of trees from the southeastern United States [this subset is hereafter referred to as the “southern” data set, including data from Clark (unpublished data), McNab and Clark (1982), Baldwin and Saucier (1983), Clark et al. (1985, 1986a,b, 1991)], and a “northern” data set developed within the state of Michigan to enhance this historical data (see e.g., MacFarlane, 2015; Dettmann and MacFarlane, 2019). Combined, these two data sets provided branch basic density and stem basic density data, at the individual tree level, for 4,060 trees from 385 sampling sites, across a large graphic area (Figure 1), including diverse tree functional types and many of the common species in temperate forests of eastern North America (Tables 1, 2). “Basic density” here is defined as the dry mass to green volume ratio of the wood (inside-bark portion) of disks removed from sample branches and sections of the main or central stem of each tree, respectively, from trees destructively sampled for development of volume and mass models (see individual studies cited above for more detailed descriptions of sampling methods). Wood basic density, defined this way, is regard as a key functional trait for making comparisons between trees (Chave et al., 2009). Table 2 shows the number of sample trees and measured average branch and stem basic density across 78 species or genera (e.g., Ulmus spp. where the species were unknown or not recorded in the study). The data set also includes a very large range of tree ages (spanning tree 6 to 260 years old), though age was only measured on about 10% of the trees (see Table 1). This data provided an unprecedented level of information for examining covariation in average branch vs. stem wood density in North American trees.

Figure 1. Geographic locations in Eastern USA where tree data were collected for this study.
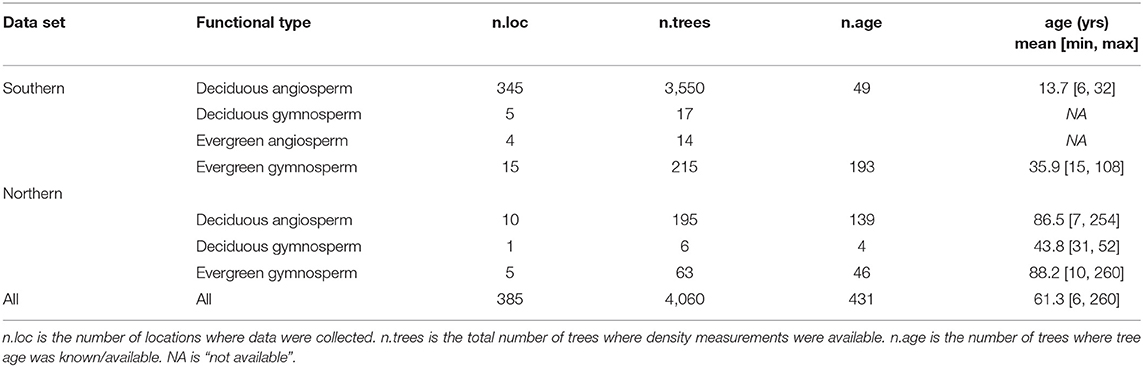
Table 1. Summary of data sets in this study by functional type.
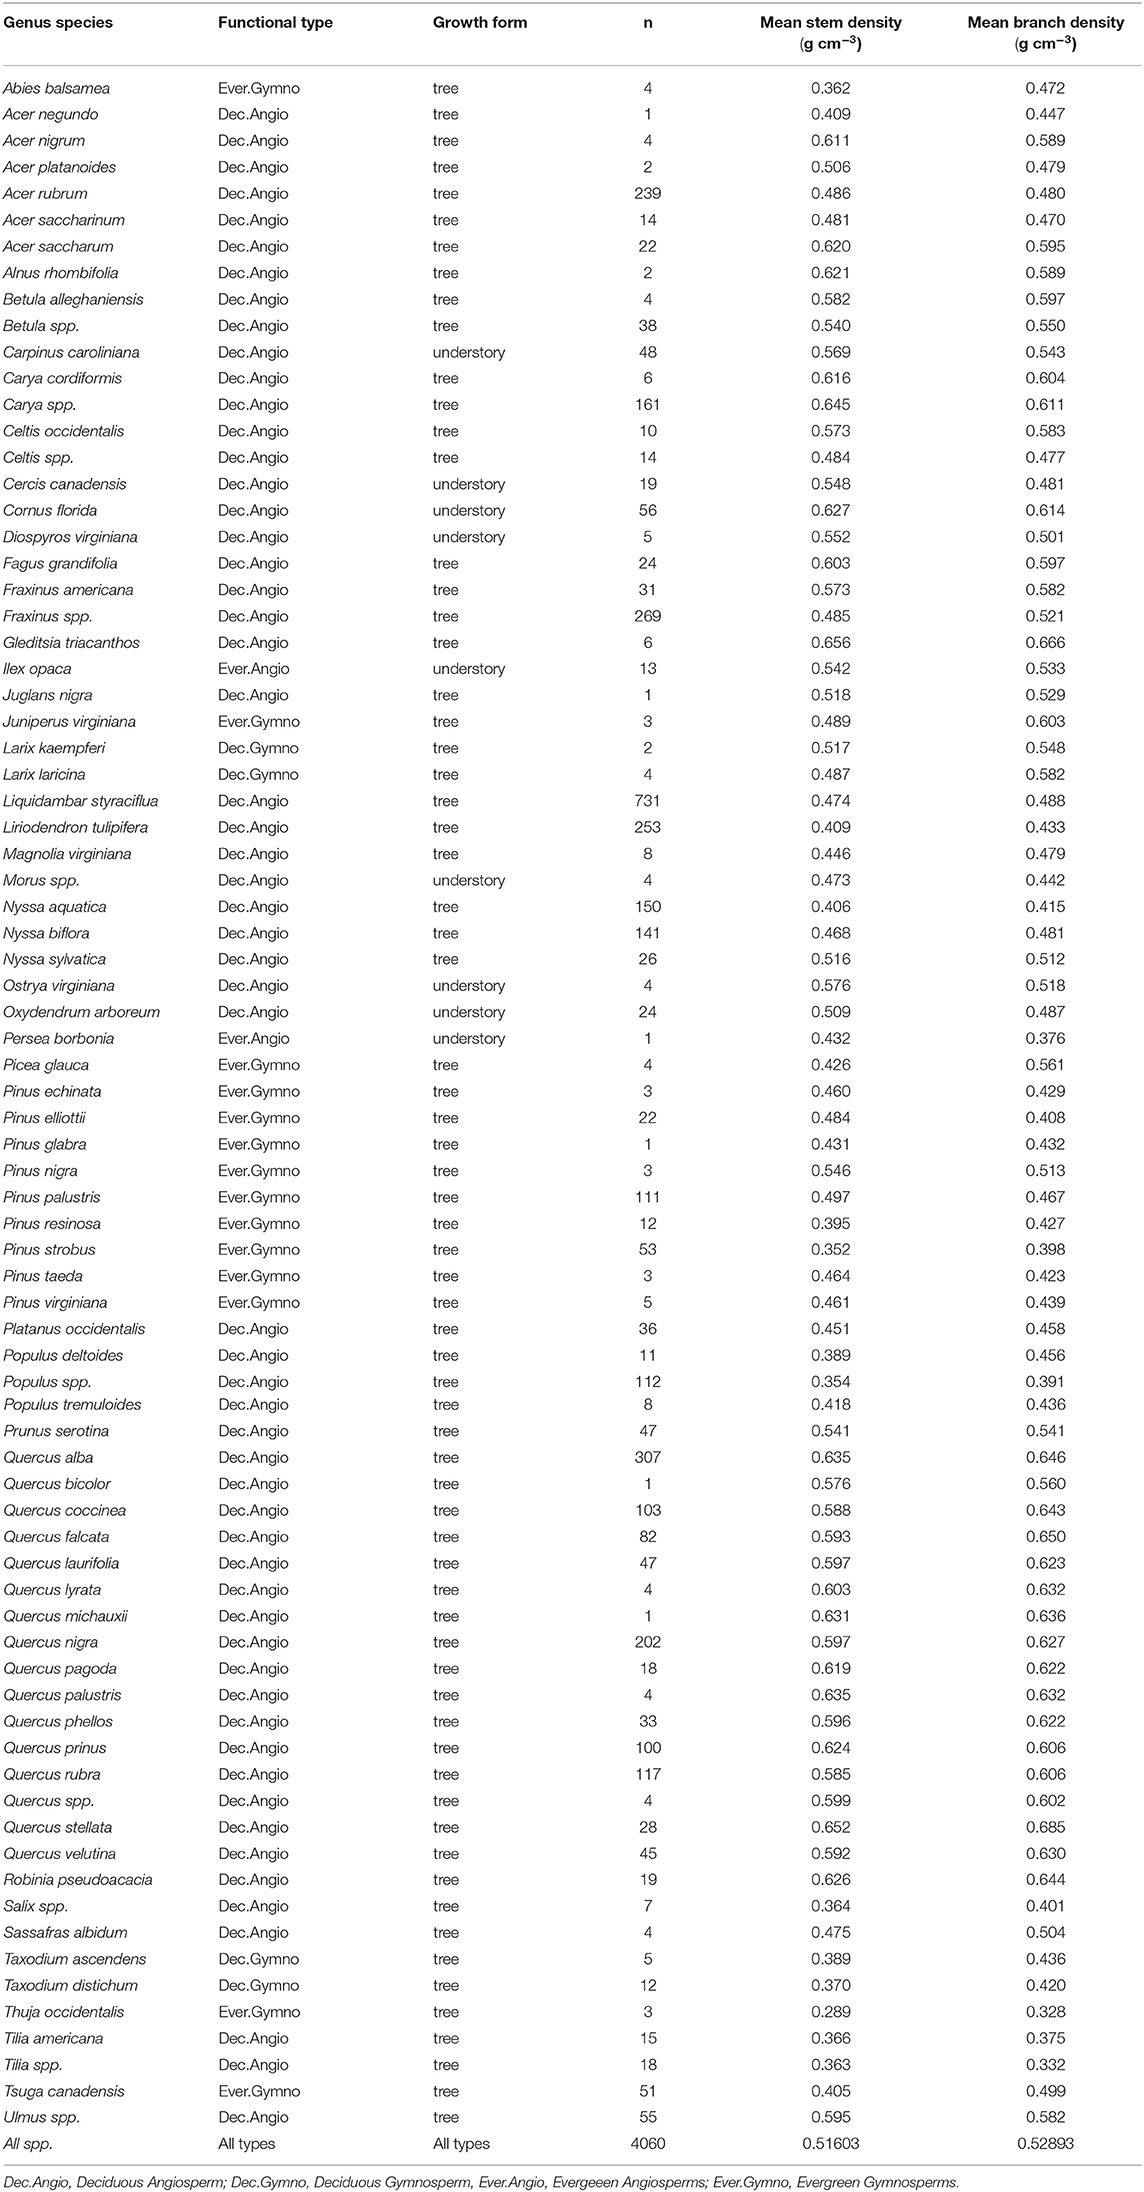
Table 2. Number of sample trees by Genus spp. growth form and average stem and branch density.
Expected Branch to Stem -Wood Density Relationships
Based on limited previous studies of tree branch to stem wood density relationships [by Swenson and Enquist (2008), Sarmiento et al. (2011)] and initial plots of the data, a general, linear model was determined to be appropriate to fit to the data:
where ρb is the average density of wood in tree branches and ρs is the average density of wood in the stem.
A logical null model was employed, specifying that:
H0: the density of wood is the same in the stem and branches.
In Eq. 1, this would correspond to a slope β = 1 and an intercept α = 0 and suggest that branches and stems are performing similarly in functions as they relate to wood density.
Data from all the trees and a variety of subpopulations were fit to eq. 1 using linear regression, to examine deviations from this null model and to examine four alternative hypotheses:
H1: Branches are denser on average than the main stems of trees (α > 0 and β > 1).
H2: Branches are less dense on average than the main stems of trees (α < 0 and β < 1).
H3: The ratio between branch and stem density is high at low stem density and decreases as the wood of the stem becomes denser (α > 0 and β < 1).
H4: The ratio between branch and stem density is low at low stem density and increases as the wood of the stem becomes denser (α < 0 and β > 1).
Statistical tests of the null hypotheses that α = 0 and β = 1, respectively, were performed using the “smart” R package (Warton et al., 2012).
Trees of every species were grouped into four major plant functional types for analysis: Deciduous Angiosperms (n = 3,745), Deciduous Gymnosperms (n = 23), Evergreen Angiosperms (n = 14) and Evergreen Gymnosperms (n = 278) (see Tables 1, 2), with the hypothesis that these groupings would reveal important differences due to fundamental differences in wood anatomy and tree life history. Gymnosperms generally have lighter wood than angiosperms and deciduous tree branches bear the weight of leaves for shorter periods of time than evergreens. The relatively low number of samples of Evergreen Angiosperms and Deciduous Gymnosperms reflects the rarity of trees of these functional types, relative to the other two types, in the study region. Within these broad types, differences in branch - stem density relationships were expected to occur at the species level, but due to small sample sizes for many of the species or genera in our data base (Table 2), the finest level of detail that we examined these relationships was at the genus level, and only when the number of trees in that genus was greater than or equal to 30 trees (a theoretically large sample size for an effectively infinite population of trees). Models were fit separately by functional type and by genus group to examine the influence of life history and phylogeny, respectively, on branch to stem wood density relationships.
It was expected that the relative size and canopy position of trees would affect both the mechanical and physiological properties of each tree's wood. Trees were classed into two “growth forms”: (1) “understory” trees (n = 174) and (2) “overstory” trees, i.e., those which could be canopy dominant at maturity (n = 3,886) (Table 2), but may occupy any canopy position. For 3,961 of the 4,060 trees, the canopy position of the tree was known, assigned during data collection to one of four canopy classes: dominant (n = 811), co-dominant (n = 1,256), intermediate (n = 919) and overtopped (n = 975), following standard definitions used by the USDA Forest Service (see e.g., MacFarlane and Kane, 2017). Models were fit separately by canopy position to examine the influence of a tree's competitive environment on branch to stem wood density relationships.
Site conditions should also influence branch to stem wood density relationships and the data were drawn from a very large number of different locations, stand types and included trees of a wide range of ages (Table 1). However, the focus of the individual studies the data were drawn from was primarily to sample diverse species over a wide geographic area, such that “species” is often confounded with “site” and there was generally limited information gathered on the specific growing conditions at sites where trees were sampled at. This limited the possibility for using “site” or “stand” conditions as an independent variable for analysis. Nonetheless, as the data spanned a geographic domain of about 15° of latitude (~30–45°), the data were analyzed to see if there was a north to south gradient in branch to stem density ratios across these temperate forests. This helped to link study results along a latitudinal gradient to forests in tropical regions. The resultant models of branch to stem wood density were compared to similar relationships published for trees and shrubs in tropical wet forests in Puerto Rico (Swenson and Enquist, 2008) and for trees-only in tropical rainforests of French Guiana (Sarmiento et al., 2011). Swenson and Enquist's (2008) published models translate into eq. 1 values of α = 0.0521 and β = 0.8695 for trees and α = −0.0588 and β = 0.9803, for shrubs, respectively. Results from Sarmiento et al. (2011) translate to α = 0.0341 and β = 0.9174 in eq. 1.
Results
The results show a generally strong, linear relationship between average branch vs. average stem density, but with a high degree of variability from tree to tree (Figure 2). The pattern was distinctively different for small understory trees, which have branch densities that are generally lower than the density of the main stem (Figure 2), with α < 0 and β ≥ 1 (β was higher, but not statistically different than one; Table 3). By contrast, trees that can reach canopy height at maturity showed a trend toward having relatively higher branch densities at low stem density (α > 0), with a decreasing branch density as stem density increases (β < 1, all trees, Table 3). Comparing these results from North America to two previous studies (Swenson and Enquist, 2008; Sarmiento et al., 2011), indicates that this general trend holds in tropical forest systems (α < 0 and β ≥ 1 for small trees/shrubs and α > 0 and β < 1 for trees), but with relatively higher branch vs. stem densities for temperate trees (Figure 2, and compare Table 3 to values presented in the text above).
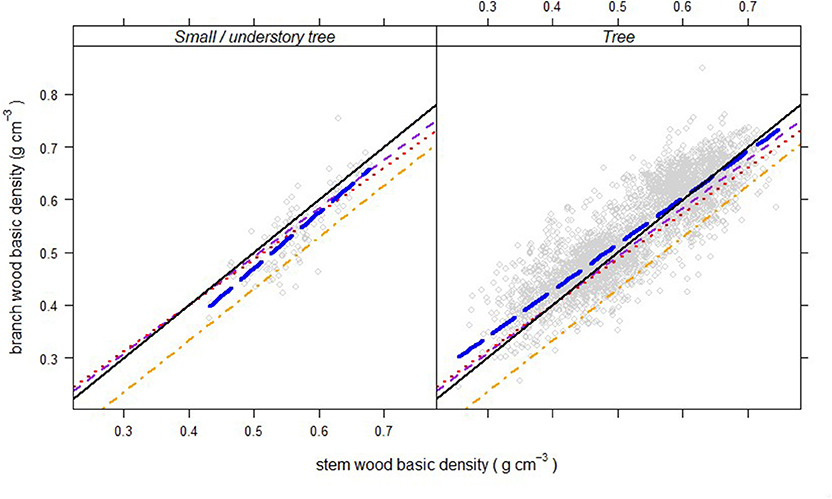
Figure 2. Branch wood – stem wood density relationships (thick, blue, long-dashed lines) for North American trees (gray circles) of two different growth forms. Short-dashed (purple) lines represent the relationship for trees in tropical rainforests in French Guiana published by Sarmiento et al. (2011). Dotted (red) and dot-dashed (orange) lines are relationships for trees and shrubs, respectively, in tropical wet forests in Puerto Rico, reported by Swenson and Enquist (2008).
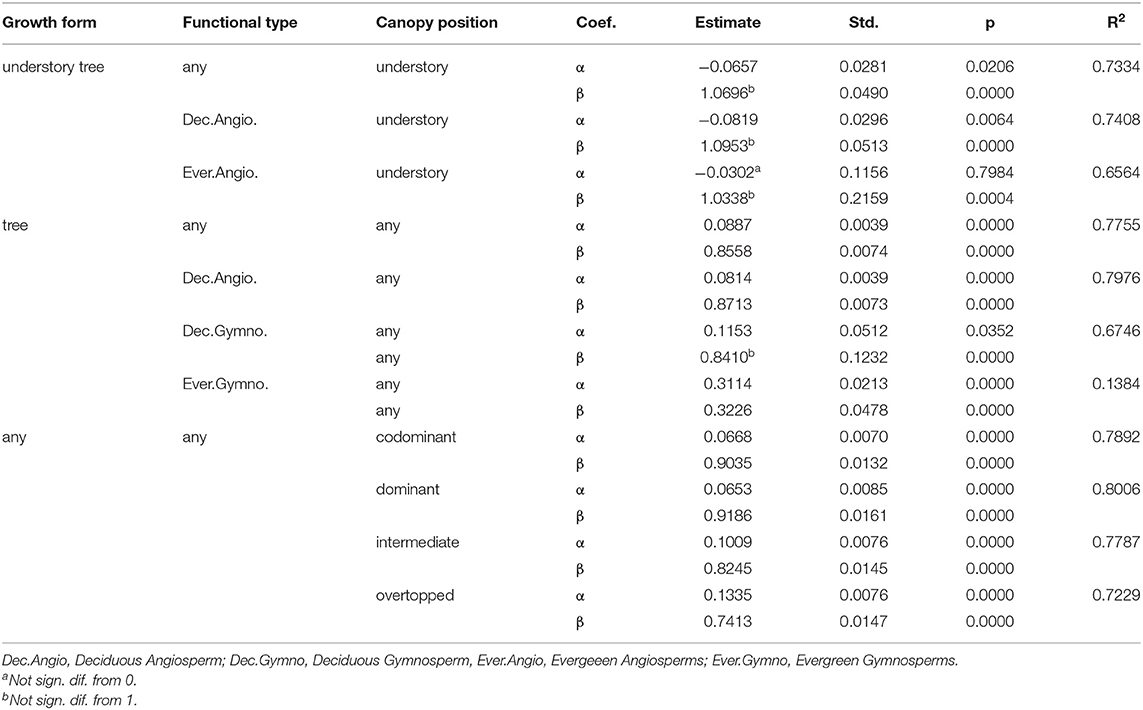
Table 3. Linear models relating tree average branch basic density to average stem basic density (g cm−3) for trees of different growth form and functional type in different positions within forest canopies.
There were clear differences in the relationships, depending on the functional type (Figure 3 and Table 3), with deciduous angiosperms being the only type for which both small understory trees and canopy trees were present in the data base (these showed opposite patterns in terms of the relationship, Figure 3). Gymnosperms showed higher intercepts (α), indicating relatively higher branch densities at lower stem densities, and evergreens had higher intercepts than deciduous species (Figure 3 and Table 3).
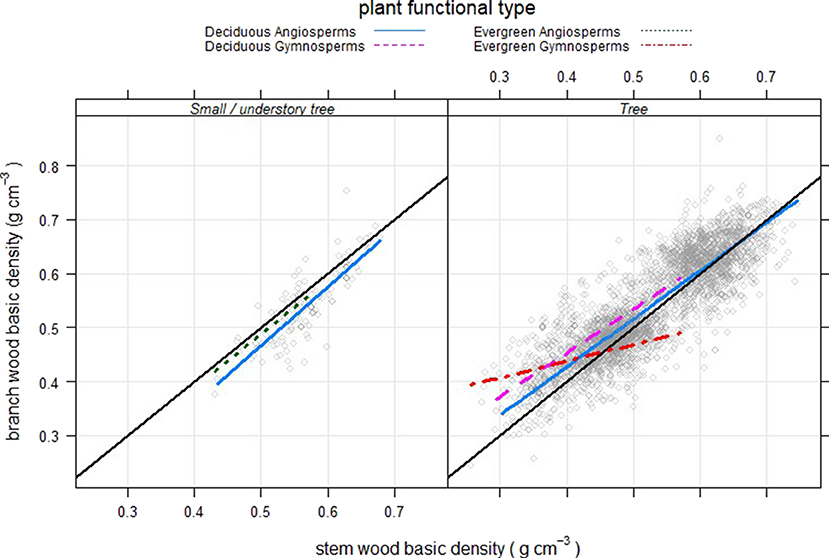
Figure 3. Branch wood – stem wood basic density relationships for North American trees (gray circles) of for different functional types.
Looking at the ratio of branch to stem wood density for the trees (Figure 4), the relationship changed as average stem density increased: evergreen gymnosperms showed a relatively higher branch density at low stem densities, which declined steeply as stem density increased. Deciduous angiosperms showed a much narrower range of change in the relationship; with deciduous gymnosperms falling in between. Most trees of understory species had a ratio of less than 1.
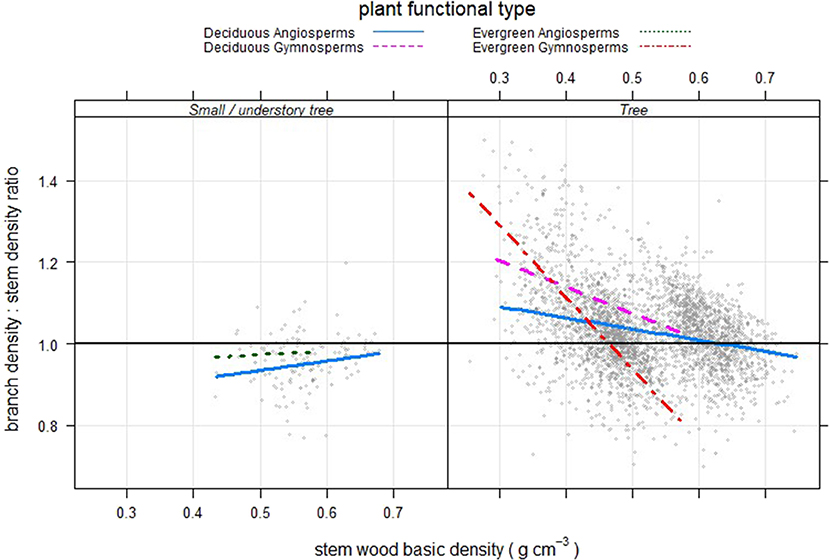
Figure 4. Branch wood: stem wood basic density ratios as a function of tree stem density for North American trees (gray circles) of for different growth forms and functional types.
Patterns for trees in the same genus generally followed the pattern within their functional type (Figure 5), though there were only two genera of evergreen gymnosperms and only two genera of small/understory trees with large enough sample sizes (n ≥ 30 trees) for finer-scale analyses. Both understory species, both deciduous angiosperms (Carpinus caroliniana and Cornus florida), showed generally lower branch then stem densities (Figure 5). Among the evergreen gymnosperms, Tsuga (canadensis) showed a consistently higher branch density than stem density, with an effectively random relationship between them (high α and β ≈ 0, Table 4), though over a fairly-low range of stem densities. The genus Pinus had trees of multiple species covering a much wider range of stem densities (Table 2) and showed a relatively strong trend of high branch density at low stem density and vice versa (Figure 5). Deciduous angiosperms, which made up the bulk of the trees in the data base (Table 1), showed more varied trends than the overall pattern for that functional type (Figure 3), with a few genera showing close to a one-to-one relationship between branch and stem density over the density range examined (Carya, Prunus, and Tilia had values for α and β not statistically different from 0 and 1, respectively; Table 4).
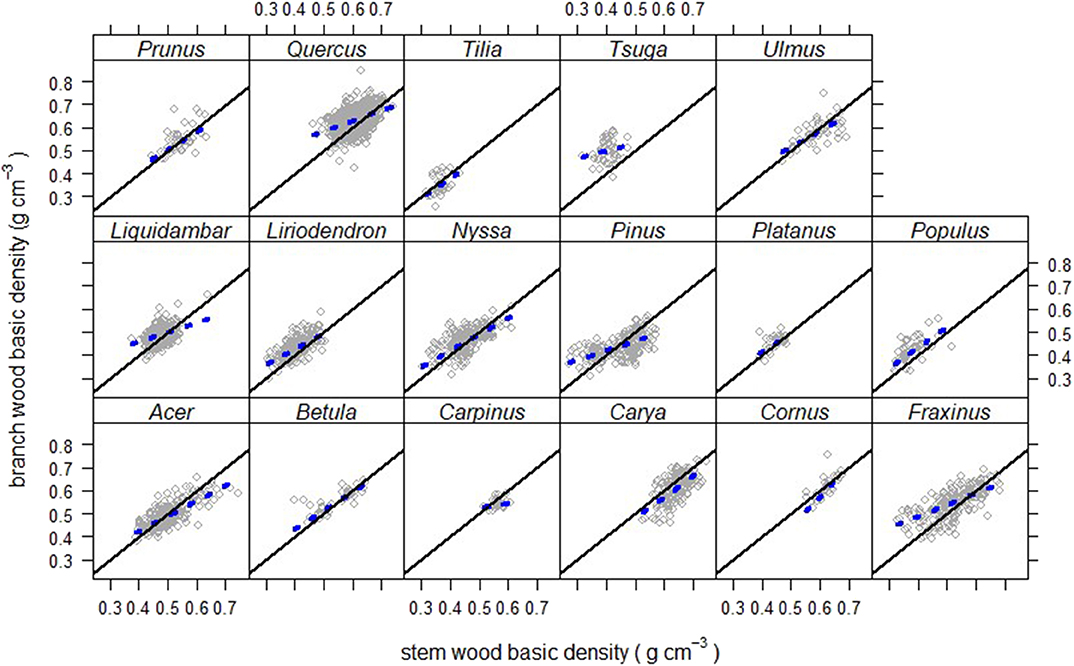
Figure 5. Branch wood – stem wood basic density relationships for North American trees (gray circles) within different genera. Thick-dashed regression lines cover the domain of stem density for that species.
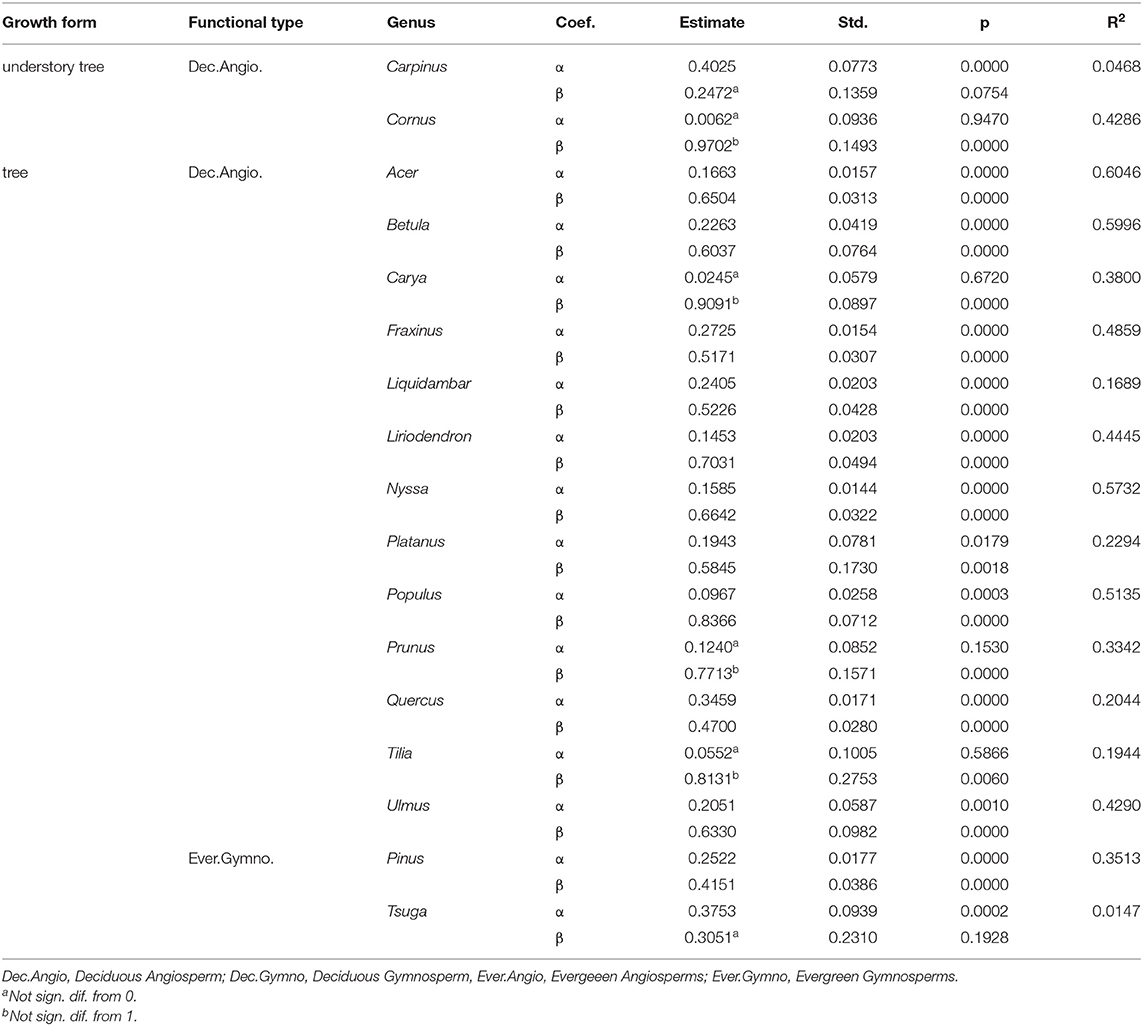
Table 4. Linear models relating tree average branch basic density to average stem basic density (g cm−3) for trees of different genera, listed by growth form and functional type.
When models were fit by canopy position (Table 3) to examine branch to stem density ratios, there was a distinctive pattern of increasing intercept and decreasing slope from canopy dominant to overtopped trees (Figure 6). Most canopy dominant trees had branch densities higher than stem density, with a fairly narrow range of change in the relationship for trees with greater stem density. Overtopped trees, on the other end of the spectrum, showed the steepest change with a trend toward lower branch vs. stem density for trees a higher stem wood density (> 0.5 g cm−3).
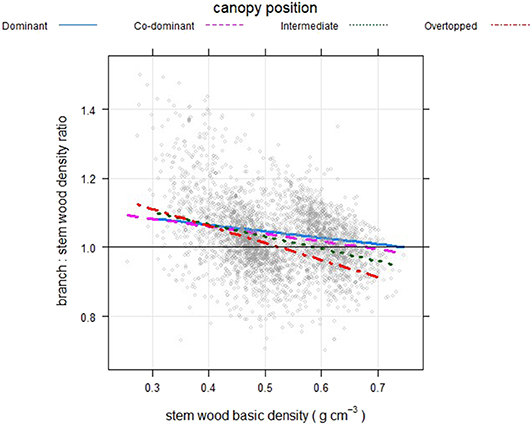
Figure 6. Branch wood: stem wood basic density ratios as a function of tree stem density for North American trees (gray circles) for trees in different positions within the forest canopy.
Looking at the geographic pattern revealed a significant positive slope between branch to stem density ratios and latitude for evergreen gymnosperms (Figure 7), but not for the other three functional types (slopes of the regressions were not significantly different from zero, p > 0.05). However, when relationships for the same species of evergreen gymnosperms were examined, in both the northern and southern data sampling regions, there appeared to be no appreciable pattern of higher branch density at the same stem density at higher latitudes (Figure 8). The latter helps confirm general patterns observed within functional types (Figure 3) and genus (Figure 5) across latitudes. Note that for both Tsuga canadensis and Pinus strobus, the overall pattern persisted, but the trees of these species from the southern data set had relatively higher branch densities (Figure 8). This indicates that the latitudinal gradient observed for evergreen gymnosperms reflects changes in species within that functional group, over the latitudinal gradient, with lower-density, northern species having relatively higher branch densities and higher-density southern species having relatively lower branch densities, at a given stem density.
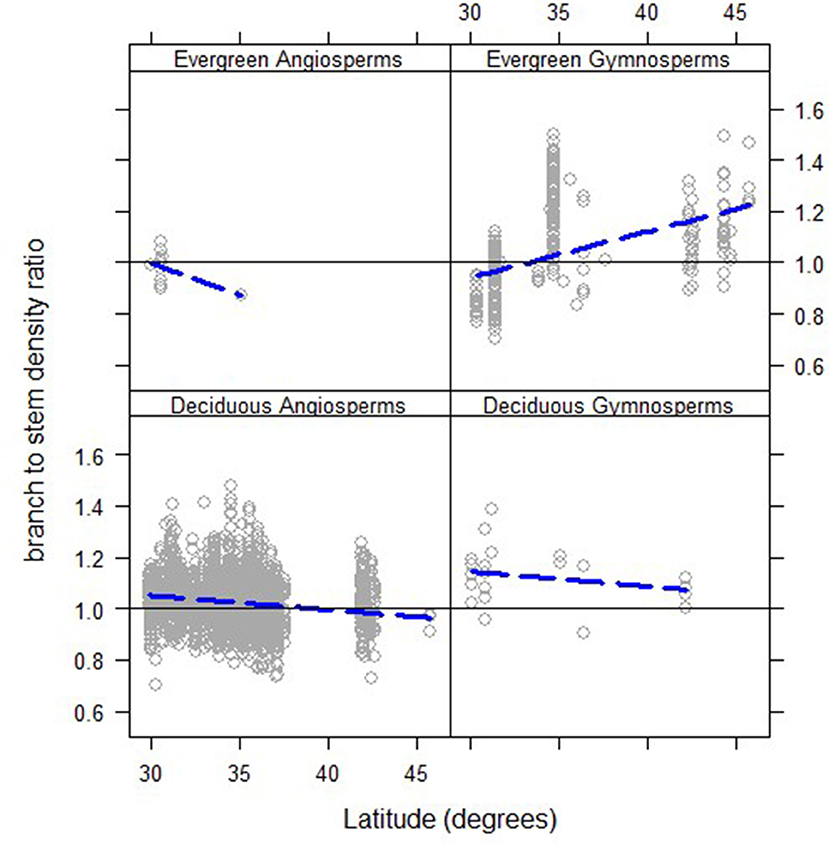
Figure 7. Branch wood: stem wood basic density ratios as a function of the latitude of the tree's growing location (long-dashed lines) for North American trees (gray circles) for trees of different functional types. Only the relationship for evergreen gymnosperms has a slope that is statistically different from 0 (α = 0.05).
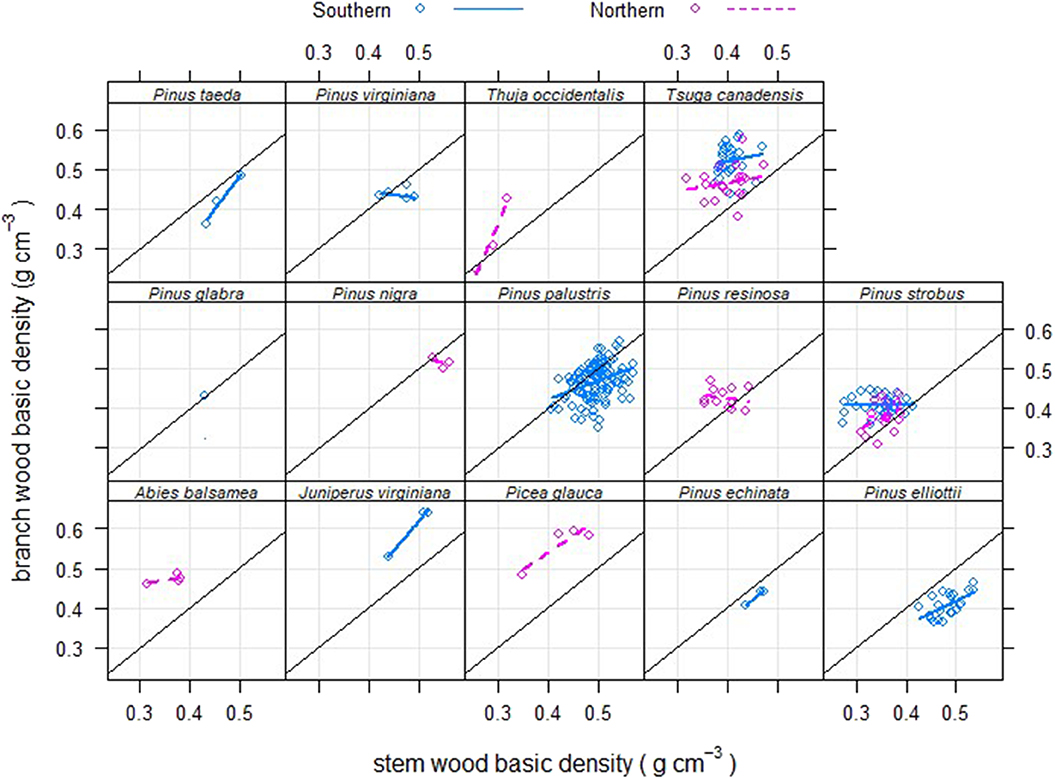
Figure 8. Branch wood – stem wood basic density relationships for North American trees (circles) of different evergreen gymnosperm species that were sampled in either the northern or southern data sets used in this study, or both.
Discussion
Why Higher Branch Density at Lower Stem Wood Density for Trees?
Overall, the results show a high degree of variation in average branch- vs. stem- wood density for North American tree species, but also a strong linear relationship that generally supports Hypothesis 3: that the relationship between branch and stem density changes over the domain of stem density, with a general trend toward higher branch density when stem density is low (α > 0) and a relationship that approaches or goes below a 1:1 ratio of branch to stem density at higher stem densities (β < 1). This empirical pattern is similar to that observed in two studies of tropical trees (Swenson and Enquist, 2008; Sarmiento et al., 2011, see Figure 2), though the pattern appears more pronounced for the temperate tree species. This begs the question: why would branches be generally denser than the main stem, when the main stem is less dense?
Wood density is related to strength and flexibility in the face of mechanical stressors and branches and stems are subjected to different types of stress. Branches should be subjected to greater downward loading pressures than the main stem, because of their more horizontal orientation. For example, snow and ice loading may weigh heavier on branches than the vertical main stem of a tree (Cannell and Morgan, 1989). Several studies suggest that branches may also bear significant stress from horizontal (sideward) forces, such as wind (e.g., Telewski, 2012; Ciftci et al., 2013; Santini et al., 2013). Though wind also pushes on the stem, branches present much of the total surface area creating drag, so branches may have the effect of damping out destructive oscillation due to dynamic sway (Ciftci et al., 2013). However, most studies have focused on mechanical stressors on tree trunks and more comparable data from branches needs to be collected to better understand stress-reactions of stem vs. branch wood (Telewski, 2012). If branches are generally under greater mechanical stress that the main stem, we might anticipate α > 0, but how do we also explain β < 1, such that branches are generally less dense when stem densities are higher?
It has been demonstrated that stem mechanical strength increases exponentially with wood density, so that denser wood is disproportionally stronger than less dense wood (Niklas and Spatz, 2010). This would suggest that trees or species with less-dense wood might need relatively greater branch density for mechanical support than heavier-wooded ones. This would suggest that the risk of branch breakage should be higher when the overall wood density of the tree is low. However, the manner in which branch breakage occurs is not a simple matter of how dense the wood is, e.g., lighter woods appear to be more susceptible to “buckling” instead of “fracturing” (Van Casteren et al., 2012). Since the “whole-tree” wood density is the composite density of all parts of the tree (Momo et al., 2018) and branch and stem density are generally positively correlated, trees with higher stem wood density, should be denser-wooded and much stronger over all woody parts of the tree.
Hydraulic conductance is also an important consideration for branch vs. stem wood density. The branches are attached to the stem and part of a tree-wide fractal-like network that conducts water and minerals to the leaves and conducts sap down from the leaves to the rest of the tree (Enquist, 2002). It is well-documented that there is a negative relationship between wood density and hydraulic efficiency and that this occurs because of narrowing of vessel (for angiosperms) or tracheid (for gymnosperms) diameters, which increases strength but reduces water flow (Markesteijn et al., 2011; Santini et al., 2013). So, a tree needs to balance responding to mechanical support stress vs. water transport stress and it may not possible to optimize for both. If tracheid diameter scales negatively with branch diameter (Enquist, 2002), then smaller branches are more likely to be denser then the main stem and more resistant to water flow. This suggests that branches are less hydraulically efficient then the stem, which should be reflected in greater branch density relative to the stem. Perhaps there is hydraulic constraint to average branch density at higher trunk densities to maintain hydrologic balance for the whole tree? This could be an important line of inquiry for future studies.
Why Would Gymnosperms Need Relatively Stronger Branches Than Angiosperms?
The overall pattern of decreasing branch to stem wood density was most pronounced (but also more variable) for evergreen gymnosperms across all genera, and most notably over the wide wood- density range of Pinus spp. (Figure 8). By contrast, deciduous angiosperms, which spanned the full range of tree densities, showed branch to stem density ratios closer to one and a narrower range of change in branch to stem density ratios. Deciduous gymnosperms showed a pattern in between, suggesting that their leaf-shedding habit influences mechanical / hydraulic constraints on branch vs. stem wood density observed for evergreen gymnosperms. In one of few studies contrasting deciduous gymnosperms with evergreen ones, Gower and Richards (1990) noted that deciduous gymnosperms have larger sapwood area and greater lumen diameters of their tracheids, so they are likely behaving somewhere in between deciduous angiosperms and evergreen gymnosperms from a hydraulic perspective.
Pittermann et al. (2006) noted that the narrow tracheids in gymnosperms reduce risk of embolism and increase strength but decrease hydraulic efficiency, so, a greater hydraulic safety margin is likely required for gymnosperms over angiosperms. However, they also concluded that mechanical constraints may also be more important than resistance to drought for conifers, because angiosperms have additional mechanical support from fibers. For conifers, tracheids make up 95% of the sapwood, so nearly all sapwood area is conducting.
In addition to increasing wood density, another way that a tree might increase its mechanical strength is by increasing the girth of the stem or its branches (Larjavaara and Muller-Landau, 2010). However, even the largest branches in a tree are nearly always thinner than the girth of its main stem. This means that branches generally need to be denser to achieve the same level of mechanical strength that the stem can achieve through greater thickness. The strong apical dominance that the main stem exhibits over the branches of gymnosperms makes their branches relatively thinner, which would suggest that their relatively smaller branches need to be denser under greater, or even equal mechanical stress, relative to the main stem.
A key factor for gymnosperms may be that they have shallower (less vertical) branching angles than angiosperms (Nelson et al., 2014), which increases the mechanical support cost of the branch, holding other factors constant (Morgan and Cannell, 1988). Young's elastic modulus is negatively correlated with specific gravity (more dense wood is generally stiffer, Cannell and Morgan, 1987). Both Young's modulus and wood density are higher under tension and tension wood is common in branches to hold their orientation (Dahle and Grabosky, 2009). So, the branches of gymnosperms may need to be relatively denser and stiffer to maintain a more horizontal position over the lifetime of the branch. Though the data on tree ages were limited, it appears that there is a general tendency for branches to become relatively more dense than the main stem as trees age and this trend appears more pronounced for evergreen gymnosperms than deciduous angiosperms (Pearson's r = 0.33 vs. r = 0.17, respectively, Figure 9). With generally lower wood density for gymnosperms vs. angiosperms and evergreens having to bear the additional weight of foliage year-round (which also contributes to branch support costs, Morgan and Cannell, 1988), we would expect evergreen gymnosperms to have the relatively highest mechanical support costs of tree branches, relative to their stems, especially when the wood is light; this in alignment with the findings of this study.
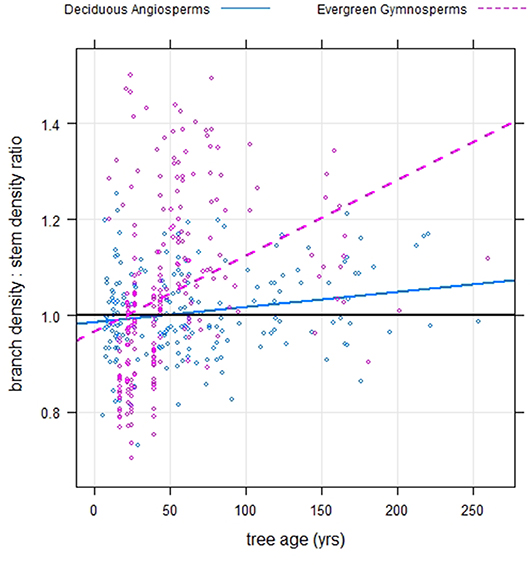
Figure 9. Branch wood – stem wood basic density relationships for North American trees (circles) of different ages within two phylogenetic groupings- evergreen gymnosperms and deciduous angiosperms.
Increasing Relative Branch Density With Increasing Canopy Dominance
It was interesting that canopy-dominant trees of all species had a more consistently higher ratio of branch to stem density across all stem densities (Figure 6). A hydraulic model might be invoked here, since studies have shown that the risk of hydraulic embolism is greater for taller trees and that branch conductance declines through a tree's hydraulic network (McCulloh et al., 2014). Larger trees with bigger crowns also have more structural complexity (Smith et al., 2014), meaning the water not only has to be conducted to greater heights against the force of gravity, but also through a more complex fractal network with greater total resistance to water flow (Enquist, 2002). The branches of canopy-dominant trees are also more likely to be exposed to damaging elemental forces, such as wind (MacFarlane and Kane, 2017) or snow and ice loading (Amateis and Burkhart, 1996), so mechanical safety of branches may also need to be greater for them. MacFarlane and Kane (2017) demonstrated that increased top and side -shading from neighboring trees caused both tree main stems and branches to become increasingly slender- an intrinsically less wind-stable form, which can be adopted to increase light capture, because of increased sheltering from wind from the same neighboring trees. So, on the other end of the spectrum of canopy position, shorter, overtopped trees might be less restricted by hydraulic limitations relative to the mechanical risk for their branches.
Why Are Understory Tree Species Different?
For small, understory trees studied here, the pattern was different than for trees of overstory species, supporting Hypothesis 4: a relatively lower branch density to stem density, with possibly a slight trend increasing toward a 1:1 ratio as the stem density increases. Swenson and Enquist (2008) also found a relatively lower branch than stem density for evergreen shrub species in tropical wet forests in Puerto Rico and a very similar relationship was shown for the only two evergreen angiosperms in this study, Ilex opaca and Persea borbonia, which were both small understory trees/shrubs. While there are some clear differences in the function of shrubs vs. understory trees (see review by Götmark et al., 2016), the most important features for both tropical forest shrubs and the understory trees studied here are a short stature and a generally low-light growing environment through the entire life cycle of the plant, as opposed to overtopped saplings of canopy trees, which are trying to pass through the understory on the way to the canopy (King, 1990).
Having a short stature has implications for both mechanical stability and hydraulic limitations. In a study by King (1990), understory trees were shown to have thicker, more stable trunks than saplings of canopy trees measured at the same height; this was thought to help with persistence in the understory. With falling stems, branches and other debris raining down from the canopy above understory trees may need to invest relatively more in maintaining the strength of the stem to persist (King, 1990) and allowing branches to bend or break can serve as a kind of safety fuse against trunk breakage (Fournier et al., 2013). The opposing pattern in branch to stem wood density ratios with increasing stem density observable for understory vs. canopy species of deciduous angiosperms (Figure 4) may give a clue- the biggest difference in the ratios is for light-wooded species, with understory species having much lighter-wooded branches at a lower stem density, but the trends converge toward similarity at higher stem densities. With a relatively higher risk of slender branches breaking for light-wooded species (Van Casteren et al., 2012), this trend would suggest the lighter-wooded understory trees could be sacrificing some structural support for branches. However, Cannell and Morgan (1987) noted greater flexibility in the branches vs. stems of young trees (12–35 years of age), even though branches had similar or higher density values than stem wood, suggesting that there are ways, other than densifying wood, that could allow branches to increase their mechanical strength under stress [for example, changing microfibril angle or forming “flexure” wood, see review by Telewski (2012)].
The shorter stature of understory trees and shrubs should lower the risk of cavitation due to drought (Götmark et al., 2016) relative to taller trees that may have higher density branches to lower risk of embolism (McCulloh et al., 2014). So, it is reasonable to assume that relatively lower-density branches are not a problem from the perspective of hydraulic risk for understory tree species, which are small in stature, and growing under shaded, low-light forest conditions, which should create conditions for lowering drought risk (Pittermann et al., 2006).
Energy limitation should be an important aspect of the life-history of understory trees and they must be reasonably tolerant of shade. Larjavaara and Muller-Landau (2010) suggested that short-lived, shade-intolerant pioneer species will have a lower wood density and longer-lived, while shade-tolerant species will have higher wood density, but they were referring to stem density. Sterck et al. (2006) found that shade-tolerant tropical tree species had denser and stronger branches than less shade-tolerant species, but their study was of saplings of canopy species and they did not directly examine branch to stem density ratios (since they studied saplings it is also likely that there was less time for tissue differentiation between the stem and branches). In this study, understory species were all relatively shade-tolerant and tended to be on the denser side of the wood density spectrum (> 0.4 g cm−3), which means the branches could still have been sufficiently strong. Since understory trees are generally sheltered from the wind (MacFarlane and Kane, 2017) and may have strong, dense branches and favorable moisture conditions, they may not be experiencing a high degree of mechanical or hydrological limitation in either the stem or branches. So, what else could explain the pattern of generally lower branch than stem density for understory tree species?
Larjavaara and Muller-Landau (2010) suggested that there are other reasons for having denser wood than mechanical strength and hydraulic safety, citing decay resistance and reduced stem maintenance respiration as important ones that have been generally overlooked. For understory tree species, which generally live in darker and more humid conditions, both of these explanations are worth considering. They argued that trees can increase stem mechanical strength by either making stems thicker or denser (understory trees may do both, see above), but increasing volume also increases surface area which increases respiration costs. Larjavaara's and Muller-Landau's ideas could also be applied to branches. Sterck et al. (2006) found that saplings of shade-tolerant tropical tree species could produce stable, horizontal branches at relatively low costs, which would provide some evidence for extending Clark, Phillips and Frederick (1985) idea to branches. Since trees of understory species generally never achieve a relatively great trunk girth and tend to have correspondingly more slender, wiry branches, a generally high density of both would make sense, if the driving force was conserving precious photosynthate captured in the understory. Higher density wood is also more decay resistant (Chave et al., 2009) and a narrow, dense trunk would also have lower surface area for fungal decay spores to attack (Larjavaara and Muller-Landau, 2010). In any event, this study reveals a clear need for more studies examining the mechanical properties of both branch and stem wood of understory tree species.
Latitudinal Gradient in Branch to Stem Wood Densities?
In this study, temperate trees showed slightly greater branch densities at the same stem densities then reported for tropical ones (Figure 2) and evergreen gymnosperms (which are atypical functional types in tropical forests, but see Pittermann et al., 2006) showed an increasing branch to stem wood density with increasing latitude. The latter trends indicate a need for relatively denser branches at higher latitudes. One explanation could be that the colder the environment, the greater the likelihood of snow and ice loading on branches increasing the likelihood of branch breakage (Cannell and Morgan, 1989; Bragg et al., 2003). Freezing-induced embolism of the hydraulic system is also more likely in colder environments, but it is not clear that the trunk should suffer less than branches from such embolisms. Interestingly, freeze-resistant tracheids have been found in tropical conifers that never experience freezing temperatures (members of the Araucariaceae and Podocarpaceae; see Pittermann et al., 2006), so mechanical stress resistance for branches may be a more important aspect of colder environments. As such, one might expect that the intercept (α) of the branch-stem density relationship (eq. 1) should increase with latitude or increasing frequency and intensity of snow and ice storms, and the increase should be steeper for gymnosperms than for angiosperms (for reasons discussed previously regarding fundamental differences in wood anatomy between the groups). Conversely, increasing warmth and growing season length might allow for lower branch density relative to stem density, except in cases where higher temperatures are associated with drought. Sterck et al. (2006) suggested that shade-intolerant species in the tropics produce less dense branches where environmentally-driven mechanical risks for branches are lower and light levels favorable for greater allocation to stem growth. The results of this study showed that more shade-tolerant evergreen gymnosperms, which are predominantly cold-temperate species, tended to have higher branch than stem densities and less shade-tolerant, warm-temperate ones, showed the reverse pattern (Figure 8).
Some previous work by Chave et al. (2009) examined large-scale geographic patterns of changes in tree wood density, noting a pattern of decreasing vessel diameters from tropics to temperate zones. They mapped general latitudinal gradient for patterns of wood density in the Western Hemisphere and found lower wood densities for trees in the north and west of North America, where forest communities are dominated by softer-wooded conifers. However, their work did not directly address branch density or its relationship to stem density. The results of this study suggest associated changes latitudinal changes in branch wood density, at least for evergreen gymnosperms. However, the results of this study generally support the assertion by Chave et al. (2009) that the pattern is much more complex than a simple latitudinal gradient, with a strong phylogenetic signal in the relationship, and a host of environmental factors, including freezing temperatures (in the northern US) and lower water availability (in the western US), which affect branch to stem density relationships.
Data Availability Statement
The datasets analyzed for this study can be found here: http://www.legacytreedata.org/.
Author Contributions
The author confirms being the sole contributor of this work and has approved it for publication.
Funding
This work was supported with funds from a joint venture agreement between Michigan State University and the United States Department of Agriculture Forest Service, Forest Inventory and Analysis Program, Northern Research Station. Part of DM's time was paid for with funds from Michigan AgBioResearch, the USDA National Institute of Food and Agriculture.
Conflict of Interest
The author declares that the research was conducted in the absence of any commercial or financial relationships that could be construed as a potential conflict of interest.
Acknowledgments
The author would like to thank Phil Radtke and David Walker at Virginia Polytechnic Institute and State University for compiling historical data on tree stem and branch density from the southeastern U.S. and making it publicly available for analyses.
References
Amateis, R. L., and Burkhart, H. E. (1996). Impact of heavy glaze in a loblolly pine spacing trial. South. J. Appl. For. 20, 151–155. doi: 10.1093/sjaf/20.3.151
Baldwin, V. C., Jr., and Saucier, J. R. (1983). Aboveground Weight and Volume of Unthinned, Planted Longleaf Pine on West Gulf Forest Sites (New Orleans, LA: U.S. Department of Agriculture, Forest Service, Southern Forest Experiment Station), 25. Res. Pap. SO-191. doi: 10.2737/SO-RP-191
Bragg, D. C., Shelton, M. G., and Zeide, B. (2003). Impacts and management implications of ice storms on forests in the southern United States. For. Ecol. Manage 186, 99–123. doi: 10.1016/S0378-1127(03)00230-5
Cannell, M. G. R., and Morgan, J. (1987). Young's modulus of sections of living branches and tree trunks. Tree Physiol. 3, 355–364. doi: 10.1093/treephys/3.4.355
Cannell, M. G. R., and Morgan, J. (1989). Branch breakage under snow and ice loads. Tree Physiol. 5, 307–317. doi: 10.1093/treephys/5.3.307
Chave, J., Andalo, C., Brown, S., Cairns, M. A., Chambers, J. Q., Eamus, D., et al. (2005). Tree allometry and improved estimation of carbon stocks and balance in tropical forests. Oecologia 145, 87–99. doi: 10.1007/s00442-005-0100-x
Chave, J., Coomes, D., Jansen, S., Lewis, S. L., Swenson, N. G., and Zanne, A. E. (2009). Towards a worldwide wood economics spectrum. Ecol. Lett. 12, 351–366. doi: 10.1111/j.1461-0248.2009.01285.x
Ciftci, C., Brena, S. F., Kane, B., and Arwade, S. R. (2013). The effect of crown architecture on dynamic amplification factor of an open-grown sugar maple (Acer Saccharum L.). Trees 27, 1175–1189. doi: 10.1007/s00468-013-0867-z
Clark, A., Phillips, D. R., and Frederick, D. J. (1985). Weight, Volume, and Physical Properties of Major Hardwood Species in the Gulf and Atlantic Coastal Plains (No. Research Paper SE-250) (USDA Forest Service). doi: 10.2737/SE-RP-250
Clark, A., Phillips, D. R., and Frederick, D. J. (1986a). Weight, Volume, and Physical Properties of Major Hardwood Species in the Piedmont (No. Research Paper SE-255) (USDA Forest Service). doi: 10.2737/SE-RP-255
Clark, A., Phillips, D. R., and Frederick, D. J. (1986b). Weight, Volume, and Physical Properties of Major Hardwood Species in the Upland-South (No. Research Paper SE-257) (USDA Forest Service). doi: 10.2737/SE-RP-257
Clark, A., Souter, R. A., and Schlaegel, B. E. (1991). Stem Profile Equations for Southern Tree Species (No. Research Paper SE-282) (Asheville: USDA Forest Service). doi: 10.2737/SE-RP-282
Dahle, G. A., and Grabosky, J. C. (2009). Review of literature on the function and allometric relationships of tree stems and branches. J. Arboric. 35:311.
Dahle, G. A., and Grabosky, J. C. (2010). Variation in modulus of elasticity (E) along Acer Platanoides L. (Aceraceae) branches. Urban For. Urban Gree. 9, 227–233. doi: 10.1016/j.ufug.2010.01.004
Dahle, G. A., James, K. R., Kane, B., Grabosky, J. C., and Detter, A. (2017). A review of factors that affect the static load-bearing capacity of urban trees. Arboric. Urban For. 43, 89–106.
Dettmann, G. T., and MacFarlane, D. W. (2019). Trans-species predictors of tree leaf mass. Ecol. Appl. 29:e01817. doi: 10.1002/eap.1817
Enquist, B. J. (2002). Universal scaling in tree and vascular plant allometry: toward a general quantitative theory linking plant form and function from cells to ecosystems. Tree Physiol. 22, 1045–1064. doi: 10.1093/treephys/22.15-16.1045
Fournier, M., Dlouha, J., Jaouen, G., and Almeras, T. (2013). Integrative biomechanics for tree ecology: beyond wood density and strength. J. Exp. Bot. 64, 4793–4815. doi: 10.1093/jxb/ert279
Gao, S., Wang, X., Wiemann, M. C., Brashaw, B. K., Ross, R. J., and Wang, L. (2017). A critical analysis of methods for rapid and nondestructive determination of wood density in standing trees. Ann. For. Sci. 74:27. doi: 10.1007/s13595-017-0623-4
Götmark, F., Götmark, E., and Jensen, A. M. (2016). Why be a shrub? a basic model and hypotheses for the adaptive values of a common growth form. Front. Plant Sci. 7:1095. doi: 10.3389/fpls.2016.01095
Gower, S. T., and Richards, J. H. (1990). Larches: deciduous conifers in an evergreen world. Bioscience 40, 818–826. doi: 10.2307/1311484
He, D., and Deane, D. C. (2016). The relationship between trunk and twig –wood density shifts with tree size and species stature. For. Ecol. Manage 372, 137–142. doi: 10.1016/j.foreco.2016.04.015
King, D. A. (1990). Allometry of saplings and understorey trees of a Panamanian forest. Funct. Ecol. 4, 27–32. doi: 10.2307/2389648
Larjavaara, M., and Muller-Landau, H. C. (2010). Rethinking the value of high wood density. Funct. Ecol. 24, 701–705. doi: 10.1111/j.1365-2435.2010.01698.x
MacFarlane, D. W. (2015). A generalized tree component biomass model derived from principles of variable allometry. For. Ecol. Manage. 354, 43–55. doi: 10.1016/j.foreco.2015.06.038
MacFarlane, D. W., and Kane, B. (2017). Neighbour effects on tree architecture: functional trade offs balancing crown competitiveness with wind resistance. Funct. Ecol. 31, 1624–1636. doi: 10.1111/1365-2435.12865
Markesteijn, L., Poorter, L., Bongers, F., Paz, H., and Sack, L. (2011). Hydraulics and life history of tropical dry forest tree species: coordination of species, drought and shade tolerance. New Phytologist 191, 80–495. doi: 10.1111/j.1469-8137.2011.03708.x
McCulloh, K. A., Johnson, D. M., Meinzer, F. C., and Woodruff, D. R. (2014). The dynamic pipeline: hydraulic capacitance and xylem hydraulic safety in four tall conifer species. Plant Cell Environ. 37, 1171–1183. doi: 10.1111/pce.12225
McNab, W. H., and Clark, I. I. I. A. (1982). Total Tree and Major Component Green Weight of White Pine and Hemlock in North Georgia [Pinus strobus, Tsuga canadensis] (Georgia forest research paper), 31.
Momo, S. T., Libalah, M. B., Rossi, V., Fonton, N., Mofack, G. I., Kamdem, N. G., et al. (2018). Using volume-weighted average wood specific gravity of trees reduces bias in aboveground biomass predictions from forest volume data. For. Ecol. Manage 424, 519–528. doi: 10.1016/j.foreco.2018.04.054
Morgan, J., and Cannell, M. G. R. (1988). Support costs of different branch designs: effects of position, number, angle and deflection of laterals. Tree Physiol. 4, 303–313. doi: 10.1093/treephys/4.4.303
Nelson, A. S., Weiskittel, A. R., and Wagner, R. G. (2014). Development of branch, crown, and vertical distribution leaf area models for contrasting hardwood species in Maine, USA. Trees 28, 17–30. doi: 10.1007/s00468-013-0926-5
Niklas, K. J., and Spatz, H.-C. (2010). Worldwide correlations of mechanical properties and green wood density. Am. J. Bot. 97, 1587–1594. doi: 10.3732/ajb.1000150
Pittermann, J., Sperry, J. S., Wheeler, J. K., Hacke, U. G., and Sikkema, E. H. (2006). Mechanical reinforcement of tracheids compromises the hydraulic efficiency of conifer xylem. Plant Cell Environ. 29, 1618–1628. doi: 10.1111/j.1365-3040.2006.01539.x
Radtke, P., Walker, D., Coulston, J., Weiskittel, A., Frank, J., and Westfall, J. (2016). “LegacyTreeData: a national database of detailed tree measurements for volume, weight, and physical properties,” in Proceedings of the 2015 Forest Inventory and Analysis Science Symposium: Pushing Boundaries: New Directions in Inventory Techniques & Applications, eds S. M. Stanton and G. A. Christensen (Portland, OR: USDA Forest Service), 391.
Rozenberg, P., Franc, A., and Cahalan, C. (2001). Incorporating wood density in breeding programs for softwoods in Europe: a strategy and associated methods. Silvae Genet. 50, 1–6.
Santini, N. S., Schmitz, N., Bennion, V., and Lovelock, C. E. (2013). The anatomical basis of the link between density and mechanical strength in mangrove branches. Funct. Plant Biol. 40, 400–408. doi: 10.1071/FP12204
Sarmiento, C., Patiño, S., Paine, C. T., Beauchêne, J., Thibaut, A., and Baraloto, C. (2011). Within-individual variation of trunk and branch xylem density in tropical trees. Am. J. Bot. 98, 140–149. doi: 10.3732/ajb.1000034
Smith, D. D., Sperry, J. S., Enquist, B. J., Savage, V. M., McCulloh, K. A., and Bentley, L. P. (2014). Deviation from symmetrically self similar branching in trees predicts altered hydraulics, mechanics, light interception and metabolic scaling. New Phytol. 201, 217–229. doi: 10.1111/nph.12487
Sterck, F. J., Van Gelder, H. A., and Poorter, L. (2006). Mechanical branch constraints contribute to life-history variation across tree species in a bolivian forest. J. Ecol. 94, 1192–1200. doi: 10.1111/j.1365-2745.2006.01162.x
Swenson, N. G., and Enquist, B. J. (2008). The relationship between stem and branch wood specific gravity and the ability of each measure to predict leaf area. Am. J. Bot. 95, 516–519. doi: 10.3732/ajb.95.4.516
Telewski, F. W. (2012). Is windswept tree growth negative thigmotropism? Plant Sci. 184, 20–28. doi: 10.1016/j.plantsci.2011.12.001
Van Casteren, A., Sellers, W. I., Thorpe, S. K. S., Coward, S., Crompton, R. H., and Ennos, A. R. (2012). Why don't branches snap? The mechanics of bending failure in three temperate angiosperm trees. Trees 26, 789–797. doi: 10.1007/s00468-011-0650-y
Warton, D. I., Duursma, R. A., Falster, D. S., and Taskinen, S. (2012). smatr 3 - an R package for estimation and inference about allometric lines. Methods Ecol. Evol. 3, 257–259. doi: 10.1111/j.2041-210X.2011.00153.x
Keywords: tree physiology, canopy position, deciduous, evergreen, angiosperms, gymnosperms
Citation: MacFarlane DW (2020) Functional Relationships Between Branch and Stem Wood Density for Temperate Tree Species in North America. Front. For. Glob. Change 3:63. doi: 10.3389/ffgc.2020.00063
Received: 03 March 2020; Accepted: 04 May 2020;
Published: 05 June 2020.
Edited by:
Lars Lundqvist, Swedish University of Agricultural Sciences, SwedenReviewed by:
Seray Özden, Kastamonu University, TurkeyLuis Diaz-Balteiro, Polytechnic University of Madrid, Spain
Copyright © 2020 MacFarlane. This is an open-access article distributed under the terms of the Creative Commons Attribution License (CC BY). The use, distribution or reproduction in other forums is permitted, provided the original author(s) and the copyright owner(s) are credited and that the original publication in this journal is cited, in accordance with accepted academic practice. No use, distribution or reproduction is permitted which does not comply with these terms.
*Correspondence: David W. MacFarlane, bWFjZmFyMjRAbXN1LmVkdQ==