 Antonio Gazol1
 J. Julio Camarero1*
 Gabriel Sangüesa-Barreda2
 Xavier Serra-Maluquer1
 Raúl Sánchez-Salguero1,3
 Lluís Coll4,5Pere Casals5
- 1Instituto Pirenaico de Ecología (IPE-CSIC), Zaragoza, Spain
- 2Departamento de Ciencias Agroforestales, EiFAB-iuFOR, Universidad de Valladolid, Soria, Spain
- 3Departamento de Sistemas Físicos, Químicos y Naturales, Universidad Pablo de Olavide, Seville, Spain
- 4Department of Agriculture and Forest Engineering (EAGROF), University of Lleida, Lleida, Spain
- 5Joint Research Unit CTFC – AGROTECNIO, Solsona, Spain
The increase in frequency and intensity of droughts due to climate change might threaten forests under stress levels causing dieback and mortality episodes. Thus, deciphering how tree species from within a region respond to drought along environmental gradients should help us to understand forest vulnerability to climate change. To enlighten contrasting drought responses of dominant tree species, we reconstructed vegetation activity using Normalized Difference Vegetation Index (NDVI) and radial growth using tree-ring width series. We studied six tree species, three angiosperms (Fagus sylvatica, Quercus humilis, and Quercus ilex) and three gymnosperms (Pinus sylvestris, Pinus nigra, and Pinus halepensis), inhabiting a Mediterranean region in north-eastern Spain. We investigated if reduced growth resilience and increased growth synchrony after successive droughts (1986, 1989, 2005, and 2012): (i) were related to cumulative drought stress and (ii) preceded forest dieback in dry sites as compared to wet sites. In 2016, dieback affected Q. ilex and P. sylvestris stands in dry sites showing lower growth rates and NDVI. No dieback symptoms were observed in other species from dry (P. nigra, P. halepensis) or wet (F. sylvatica, Q. humilis, P. sylvestris) sites. Hot and dry summer conditions constrained growth and reduced NDVI. During 2005, a severe drought affected all species, but growth drops were more marked in dry places. All species were able to recover after extreme droughts, albeit angiosperms displayed lower than expected values of growth after the 2012 drought. Growth synchrony was higher in dry sites than in wet sites, and the differences were higher after the 2005 drought. This study reveals that the sensitivity of tree species to drought in species inhabiting the same region is species dependent, and it is contingent on local conditions with higher effects in dry sites than in wet sites. We describe how a cumulative impact of successive droughts increases growth synchrony and triggers the occurrence of dieback events in Mediterranean forests.
Introduction
The occurrence of extreme climate events such as droughts and heat waves among others has been identified as a key factor reducing tree growth and leading to forest dieback (Allen et al., 2015; Senf et al., 2018; Resende et al., 2020). In Mediterranean forests, tree growth is strongly limited by water availability (Pasho et al., 2012) and drought-adapted tree species can present a bimodal growth, maximizing resource use during spring, early summer, and continuing in autumn, when water availability is not limited (e.g., Camarero et al., 2010; Gutiérrez et al., 2011). However, if recurrent drought and heat waves occur, even dieback in drought-adapted Mediterranean tree species happen (Camarero et al., 2015; Sánchez-Salguero et al., 2017; Sánchez-Salguero and Camarero, 2020). Given the prediction of higher frequency and intensity of drought and heat waves (IPCC, 2018), detecting which tree species and populations are more vulnerable to these climatic constraints emerges as a fundamental question (Brodribb et al., 2020).
To understand the temporal and spatial occurrence of hotter forest drought-induced dieback and mortality, and which species will suffer more, multidisciplinary approaches are needed (Anderegg et al., 2013). Drought induced dieback causes bud, leaf and shoot death as well as growth reductions (Dobbertin, 2005). However, leaf shedding and canopy dieback often happen during and after drought occurrence (Camarero et al., 2015), and methods allowing the retrospective quantification of droughts impact on long-term growth and vigor are required. In this sense, tree rings are natural archives on how trees responded to past droughts (Fritts, 1976; Ogle et al., 2000). Moreover, combining tree ring growth with estimates of primary productivity and vegetation activity (e.g., Correa-Díaz et al., 2019; Vicente-Serrano et al., 2019) enhances our ability to upscale growth patterns from individuals or stands to regional scales (Babst et al., 2018; Gazol et al., 2018; Kannenberg et al., 2019). This information, combined with high-resolution climate data, improves our understanding on how forests respond to drought at different spatial scales and allow us to understand drought-driven forest mortality (Hartmann et al., 2018).
The response of tree species to drought can vary at the intraspecific level depending on both, regional and local factors (Orwig and Abrams, 1997; Gazol et al., 2017, 2018; Aragão et al., 2019; Baker et al., 2019; Crouchet et al., 2019). It is expected that tree species will be more vulnerable to drought near the rear-edge (equatorward) and xeric limits of their distribution ranges (Sánchez-Salguero et al., 2017) where stronger legacy effects of drought on growth can be expected (Anderegg et al., 2015; Gazol et al., 2020). However, some studies have also reported greater sensitivity of tree growth to drought at the core and even the cold distribution margins (Muffler et al., 2020). In any case, the cumulative impact of successive droughts on forests can result in more pervasive drought legacies (i.e., lagged effects that can last for years despite drought being meteorologically alleviated), more marked growth reductions (Peltier and Ogle, 2019), and loss of resilience capacity (i.e., a reduced ability to recover growth values as those before drought occurrence). Interestingly, local factors as soil water holding capacity (Baker et al., 2019) and neighbor’s competition for water (Crouchet et al., 2019) can also determine tree responses to drought (Galiano et al., 2012; Anderegg et al., 2013). However, it remains unclear the way in which all these local factors interact and modulate drought-induced dieback (Hartmann et al., 2018).
At the interspecific level, local environmental constrains interact with functional differences in plants response to drought among co-occurring species, such as differences in belowground and aboveground hydraulic conductance (McDowell et al., 2008; Johnson et al., 2018). Isohydric trees will be more vulnerable to carbon starvation because they regulate stomata closure to avoid xylem cavitation, whereas anisohydric trees are more vulnerable to hydraulic failure because they keep open stomata during drought (McDowell et al., 2008). Long-lasting growth reductions preceding tree death after drought have been found in several species, usually gymnosperms, and agree with the deterioration of their hydraulic system (Pellizzari et al., 2016). In contrast, carbon starvation has been considered as the main driver in declining angiosperms (Galiano et al., 2012; Klockow et al., 2018). These results question the validity of the isohydry-anisohydry dichotomy as a framework to determine dieback susceptibility because other local (e.g., Sánchez-Salguero and Camarero, 2020) and regional factors can limit growth (Körner, 2015). Recent studies suggest that factors such as oxidative stress, fire-drought interactions and root mortality among others can play important roles on tree mortality caused by drought (Parra and Moreno, 2017; Ameye et al., 2018). In this respect, drought timing arises as an important factor in Mediterranean regions since species inhabiting dry areas are more constrained by water availability and show responses to longer droughts, whereas those species from wet regions depend more on temperature and respond to short droughts (Pasho et al., 2011, 2012). Severe winter droughts or summer dry spells impact growth of coexisting tree species in different ways (Camarero et al., 2015).
In 2016 a severe forest dieback episode characterized by abundant leaf shedding (defoliation) and rise in mortality rates was observed in lowlands of the Montsec massif situated in Catalonia, north eastern Spain (Supplementary Figure S1). The dieback mainly affected Holm oak (Quercus ilex L.) and Scots Pine (Pinus sylvestris L.) (DeBosCat, 2017; Michel and Seidling(eds), 2017). Furthermore, trees in these regions were still recovering from the damages caused by the severe 2012 drought (DeBosCat, 2017). Motivated by this event, we started a dendrochronological study to evaluate the growth response to drought of six tree species (three gymnosperms of the Pinaceae family, and three angiosperms of the Fagaceae family) present along an altitudinal gradient (from 400 to 1300 m a.s.l.) in the Montsec massif. Furthermore, we combined this information with estimations of past vegetation activity at the ecosystem level derived from remotely sensed images (Normalized Difference Vegetation Index, NDVI; Myneni et al., 1995). Thus, we can obtain a better understanding on the relationship between radial growth and vegetation activity, and upscale the consequences of forest dieback from population to ecosystem levels. Specifically, we expect that: (i) all species are negatively impacted by drought resulting in severe growth reductions; (ii) growth and NDVI will be positively linked since wood formation is an important component of vegetation activity; and (iii) the cumulative impacts of successive droughts on growth and their legacies will be higher in dry low-elevation sites resulting in a stronger growth synchrony between species and stands, a lower vegetation activity and a higher risk of drought-induced dieback. We argue that the retrospective quantification of growth responses to past droughts can help us to understand why some tree species and stands are more sensitive to drought than others guiding future research on the mechanisms that lead to a greater drought vulnerability.
Materials and Methods
The study area is the Montsec massif, situated in Catalonia, north eastern Spain (42.03°N; 1.02°E). The massif is 40 km long and 5 km wide with an elevation range from 400 to 1676 m a.s.l. With a Mediterranean climate it presents cold winters and hot summers characterized by a marked dry season from July to September. During the last years, the air temperature has increased in the region leading to more frequent and intense drought events since the 1980s (Supplementary Figure S2).
Due to the strong elevation and bioclimatic gradient there is a marked change in forest species composition with Aleppo pine (Pinus halepensis Mill.) and Holm oak dominating the lowland drier parts of the study area, and Scots pine and European beech (Fagus sylvatica L.), dominating the high-elevation sites. Other sub-Mediterranean species such as downy oak (Quercus humilis Mill.) and black pine (Pinus nigra J. F. Arn.) are present at intermediate elevations. Soils are rocky and basic.
We selected two different regions: a mid- to high-elevation site without evident signs of dieback (hereafter wet site) and a lowland site with marked signs of dieback (hereafter dry site; Supplementary Figure S1). In each site several tree species were selected (see Table 1). Beech and oak were sampled in the wet site, Aleppo pine (a natural forests and a plantation subjected to natural climate conditions) and Holm oak were sampled in the dry site, and Scots pine and black pine were sampled in both sites. For those sites in which the two species showing dieback were dominant (Q. ilex and P. sylvestris), 50-m long transects were established to quantify stand characteristics and dieback incidence (Table 2).
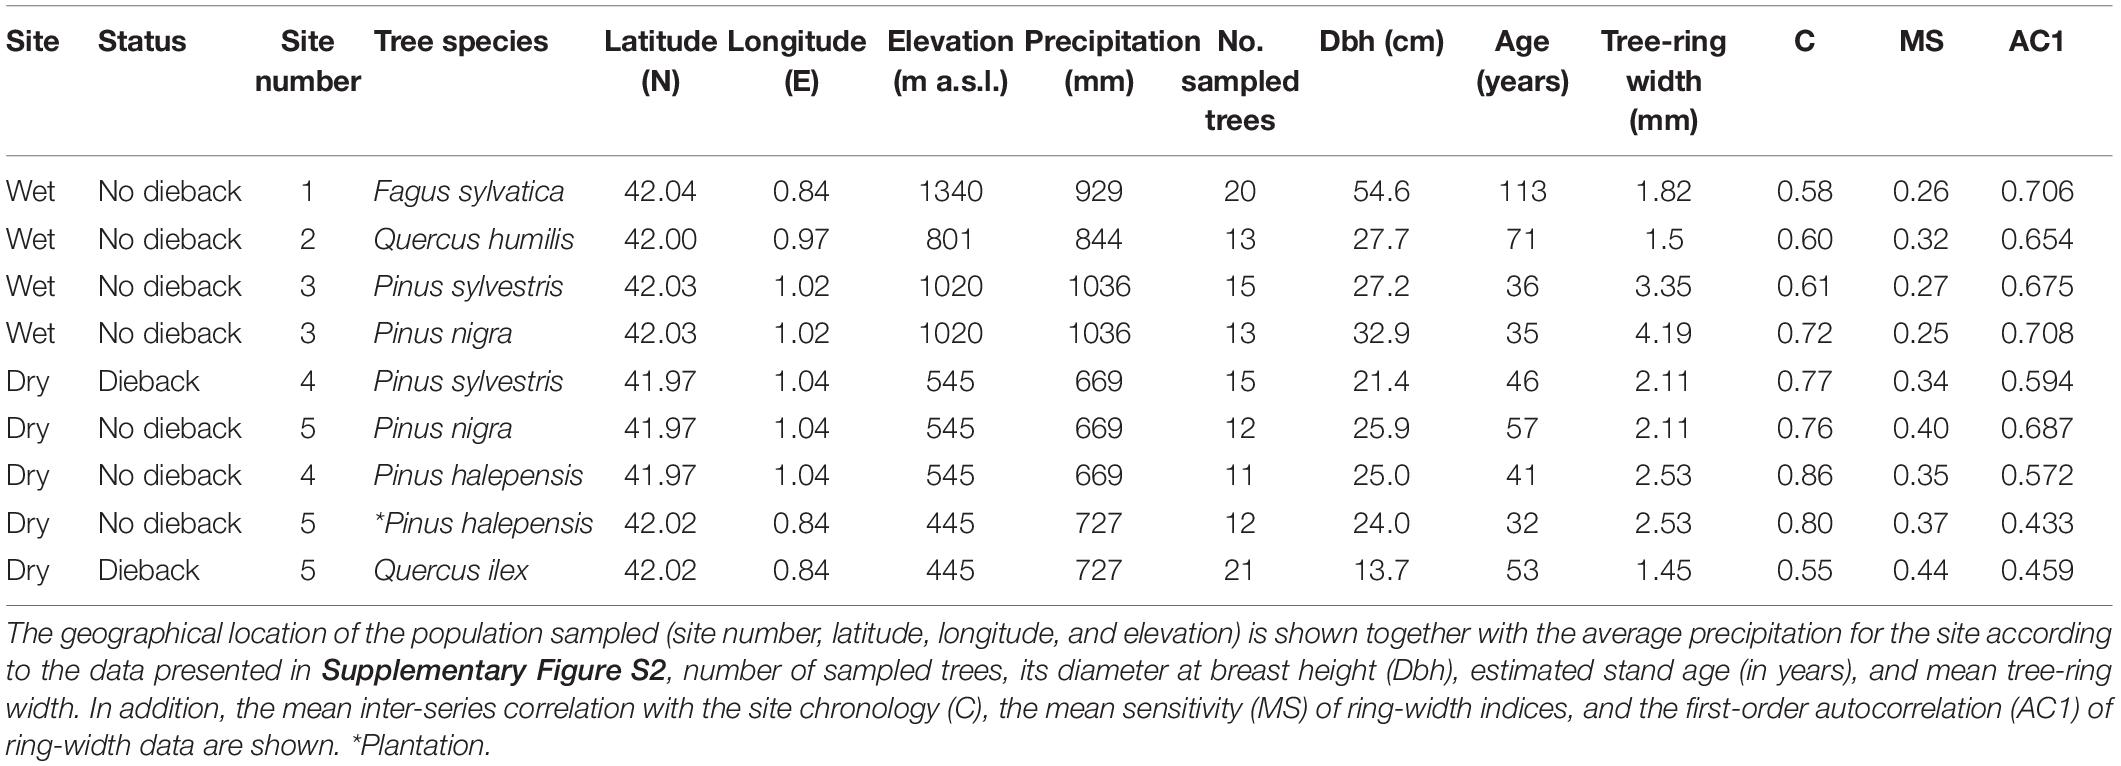
Table 1. Main characteristics of the sampled sites and species.
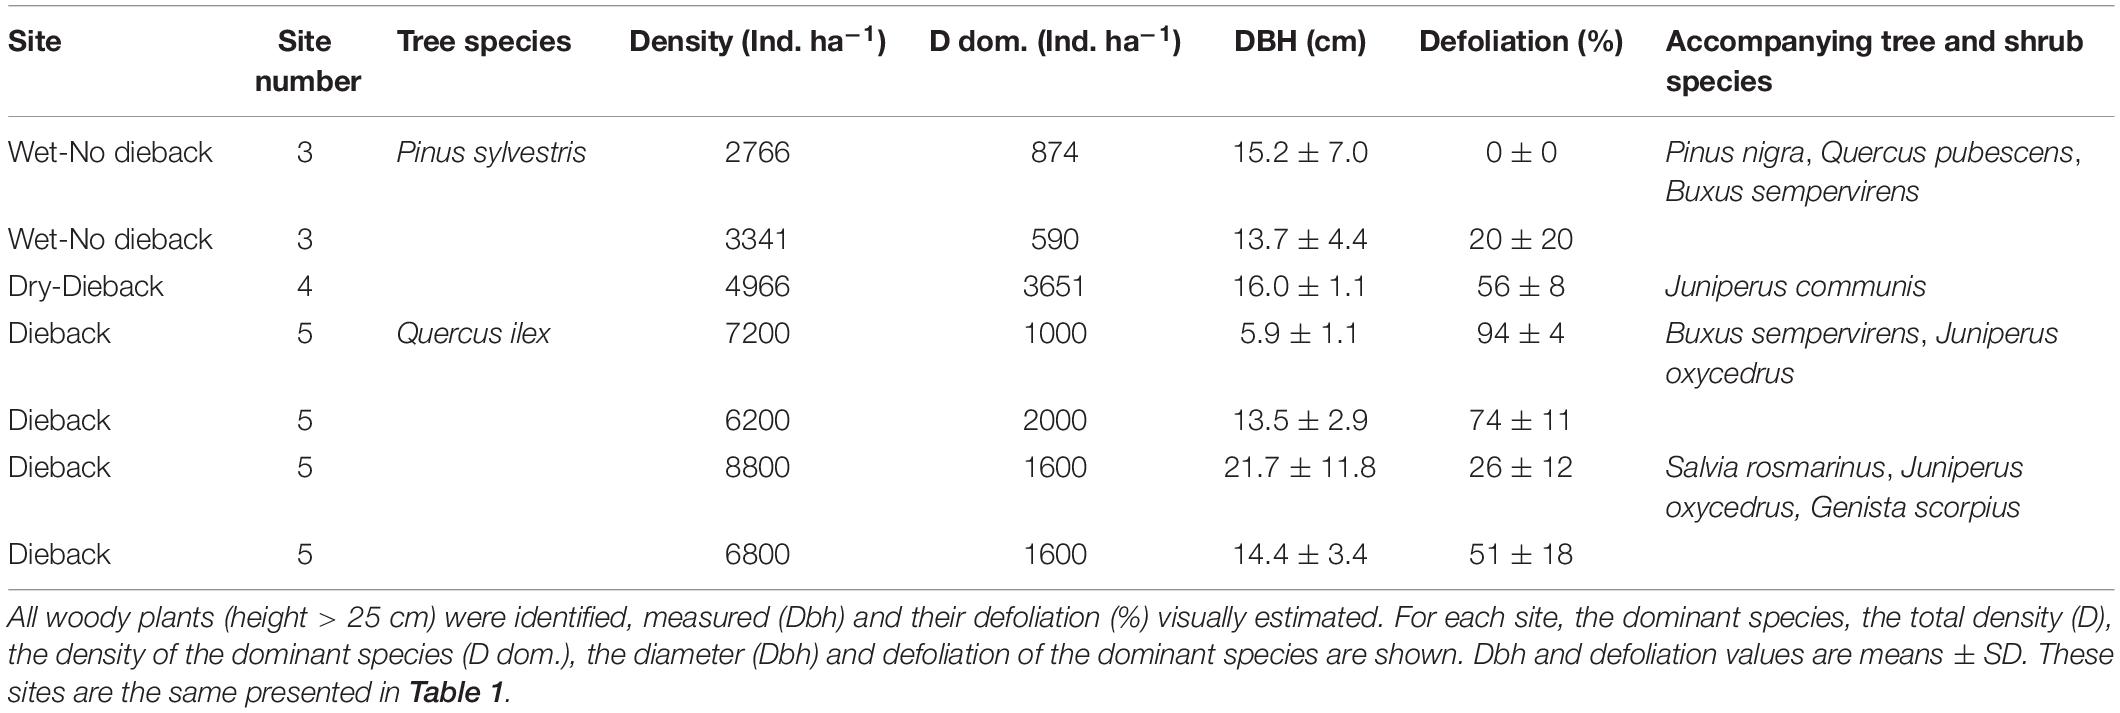
Table 2. Quantification of drought-induced damage in climatically contrasting sites (wet P. sylvestris sites without dieback, a dry P. sylvestris site showing dieback, and four dry Q. ilex sites showing dieback).
For each species in each site, 10–25 dominant trees, usually separated by at least 5 m, were sampled for dendrochronological analyses. The diameter at breast height of each tree (Dbh) was measured at 1.3 m using a metric tape. In addition, we annotated whether the tree was dead, i.e., if it showed a crown without living leaves and branches, or alive. In the case of sprouting species as oaks we tagged them and checked that dead trees did not sprout 2 years after sampling. In the case of the two most negatively impacted stands (Scots pine and Holm oak populations from the dry site) we sampled eight (pine) and 10 (oak) individuals recently dead, respectively, by taking cross sections.
Tree-Ring Processing
Wood cores were extracted at 1.3 m using 5-mm increment borers (Haglöf, Sweden), and perpendicular to the slope. After that, wood samples were air-dried, glued and polished using a series of sand-paper grids until tree-ring boundaries were clearly visible. Cores were visually cross-dated and measured to the nearest 0.01 mm using a LINTAB measuring device (Rinntech, Heidelberg, Germany). Cross-dating accuracy was checked by using the software COFECHA (Holmes, 1983).
Individual tree-ring width series were detrended using a cubic regression spline with a frequency response of 0.5 at a wavelength of 32 years to obtain yearly values of detrended ring-width indices (RWI). The resulting standardized RWI tree-level series (RWIstd) were pre-whitened (fitting an autoregressive model to the time series) to obtain series of pre-whitened ring-width indices (RWIres). Finally, the RWIstd and RWIres individual series were averaged year-by-year using a biweight robust mean to obtain a standard and residual site chronology, respectively. All the processes of tree-ring series detrending and chronology computation were performed using the ARSTAN software (Cook and Krusic, 2007). Finally, we calculated three statistics to characterize the chronologies: the first-order autocorrelation of RWIstd (AR1), the mean sensitivity (MS) of RWIres to quantify the year-to-year relative changes in growth, and the mean inter-series correlation with the master chronology (Briffa and Jones, 1990).
We calculated the drought effect on tree growth following Kannenberg et al. (2019):
Since the average RWIstd () is equal to one this is a measure of the percentage of growth reduction due to the occurrence of drought.
Legacies of drought were calculated as the difference between standardized growth (RWIstd) and detrended growth variation (RWIres) predicted by drought following Anderegg et al. (2015). The RWIres predicted by the drought index (SPEI) represents the expected impact of drought on growth in the absence of autocorrelation. Negative legacies indicate that the growth is lower than expected by the effect of drought.
Climate and NDVI Data
We used 1 km2-gridded climatic data assembled at a weekly timescale based on values of daily mean air temperature, sunshine duration, wind speed, relative humidity, and precipitation coming from the Spanish Meteorological Agency (AEMET). The dataset was homogenized and quality-checked prior to the estimation of gridded values for the period 1962–2016 (see Vicente-Serrano et al., 2017). Based on this gridded dataset, we calculated the monthly water balance as the difference between precipitation (P) and potential evapotranspiration (PET). Further, the water balance (P–PET) was used to calculate the Standardized Precipitation-Evapotranspiration index (SPEI), which is a drought index that allows for spatial and temporal comparability of drought severity (Vicente-Serrano et al., 2010). The SPEI is a multiscalar drought index that may take negative and positive values, indicating dry and wet periods, respectively (Vicente-Serrano et al., 2010). Previous studies have found that the radial growth of Mediterranean tree species responds to drought at long timescales (Pasho et al., 2011), thus we calculated the drought index at 12-month long time-scales for the entire study period (1962–2016).
We generated five NDVI time series, one per study site (see Table 1), by combining the MODIS Vegetation Index Products MOD13Q1 and MYD13Q1 (data available at https://modis.gsfc.nasa.gov/data/dataprod/mod13.php). Since NDVI time series may contain spurious data such as missing values or cloudy pixels, data were filtered using the quality metadata provided by MODIS products. In this way, time series for the period 2003–2019 at a resolution of 16-day were generated by combining the 9 × 9 NDVI images obtained at high-resolution (250 m × 250 m) for each study site. Missing values were filled as the average between the previous and the posterior value. Yearly values of NDVI were calculated by summing the values from February to November of the year in which the tree-ring is formed, as the relationship between RWI and NDVI reaches maximum values during this period in Mediterranean forests (Vicente-Serrano et al., 2019).
Statistical Analyses
Bootstrapped correlations were used to test for the relationship between tree-ring width chronologies (RWIres) and mean maximum and minimum air temperature, precipitation and the 12-month long SPEI. Analyses were performed from September in the year before the tree-ring was formed to October of the year of tree-ring formation based on previous studies in these species (Andreu et al., 2007; Pasho et al., 2011). Significance was assessed by resampling 1000 times using the exact bootstrapping method in the Seascorr package (Meko et al., 2011). Mean maximum and minimum air temperature and precipitation data were detrended using a cubic regression spline as done for RWI. In this study all statistical analyses were performed in the R environment (R Development Core Team, 2019).
To assess the impact of severe drought on growth, we selected four drought events (1986, 1989, 2005, and 2012) which present SPEI values below −1.5 (Supplementary Figure S2c) and that have impacted the growth of trees in the Iberian Peninsula (Vicente-Serrano et al., 2017; Gazol et al., 2018). Further, we quantified the cumulative impact of successive drought episodes (1986, 1989, 2005, and 2012) on the growth of each species by summing the drought effects which were individually computed for each drought episode using Eq. 1.
Legacies of drought were calculated as the difference between observed RWIstd and the RWIres predicted by the 12-month long August SPEI for all the years in the period 1983–2016 to reflect those years in which growth was lower than the value predicted by the drought effect.
Linear mixed-effect models (LME; Pinheiro and Bates, 2000) were used to evaluate whether the relationship between tree-ring width chronologies (RWIres) and drought varies between dry and wet sites. This was done by testing the significance of interactions between the 12-month long August SPEI and site. Chronology identity was used as random factor (random intercept only) since each chronology represents repeated measures over the same tree population. We run all potential models combining site and SPEI and selected the most parsimonious one based on information theory (Burnham and Anderson, 2002). First, we listed the models according to their corrected Akaike Information Criterion (AIC) values. Second, we selected the model with the lowest degrees of freedom among those models with a difference lower than 2 AIC units from the lowest AIC model. The final selected model was evaluated graphically, and its fit was quantified with the marginal and conditional pseudo-R2 values which account for the variation explained by the fixed only and fixed and random factors, respectively (Nakagawa et al., 2017).
We quantified synchrony across ring-width chronologies for the common period 1983–2016 (period in which all chronologies were robust and well replicated). Particularly, we tested for the existence of within- and between-site synchrony comparing dry vs. wet sites, as well as angiosperms vs. gymnosperms. Separate analyses were performed. Briefly, we fitted seven variance covariance (VCOV) models relating RWIres at site level and RWIres at functional group level. Similar analyses were performed with RWIstd and we decided to use RWIres which produced stronger results. The existence of within- and between-group synchrony in homocedastic or heterocedastic models was tested based on information criterion (Burnham and Anderson, 2002). Particularly, we compared the AIC for each model and we selected the most parsimonious one (i.e., the model with the lowest degrees of freedom among those models with a difference lower than 2 AIC units from the lowest-AIC model). After that, we also tested for the existence of temporal trends in synchrony by analyzing models of 20-year moving windows with 1-year lag.
Generalized Additive Mixed Models (GAMM; Wood, 2017) were used to study the temporal trend in NDVI and whether it varies between wet and dry sites. NDVI was modeled using a cyclic cubic regression spline to represent intra-annual variations and a thin plate regression spline to explain long-term NDVI trends. Further, we included interactions with site to decipher if the intra-annual variation and long-term trend varied between wet and dry sites. Site identity was included as random factor since NDVI series represent repeated measures for every location. Finally, the degrees of freedom for each smooth term were set to a maximum of 6.
Linear mixed-effect models were also used to evaluate the relationship between tree-ring-width data and NDVI. We tested for the relationship between RWIstd and the NDVI (10-month long cumulative NDVI for November). Chronology identity was used as random factor as RWIstd series represent repeated measures over the same population. In addition, we tested for the influence of site (i.e., dry vs. wet site) and functional group (gymnosperms vs. angiosperms) in the relationship between RWIstd and NDVI for the period 2003–2016. Different models were created and ranked according to their AIC. Finally, we selected the most parsimonious model based on the AIC and the degrees of freedom of the model.
Bootstrapped correlations were calculated using the treeclim package (Zang and Biondi, 2015), Synchrony between ring-width chronologies was calculated using the DendroSync package (Alday et al., 2017, 2018), and LMEs were fitted and compared, in that order, with the nlme (Pinheiro et al., 2018) and MuMIn (Barton, 2018) packages. The mgcv package (Wood, 2017) was used to fit the GAMMs and the visreg package was used to visualize the regression models (Breheny and Burchett, 2017).
Results
Patterns in growth variability (RWIstd) varied between sites but growth reductions in dry years were common and marked for all species (Figure 1 and Supplementary Figure S3). All species, excepting Aleppo pine and black pine from dry sites, showed significant positive correlations with June or July precipitation and negative correlations with the mean maximum temperature in June (Supplementary Figure S4). Significant positive correlations were also found between growth of most species and the precipitation in the previous winter (Supplementary Figure S4). Tree growth was strongly limited by drought as demonstrated by the strong relationship between growth and the 12-month SPEI (Supplementary Figure S4).
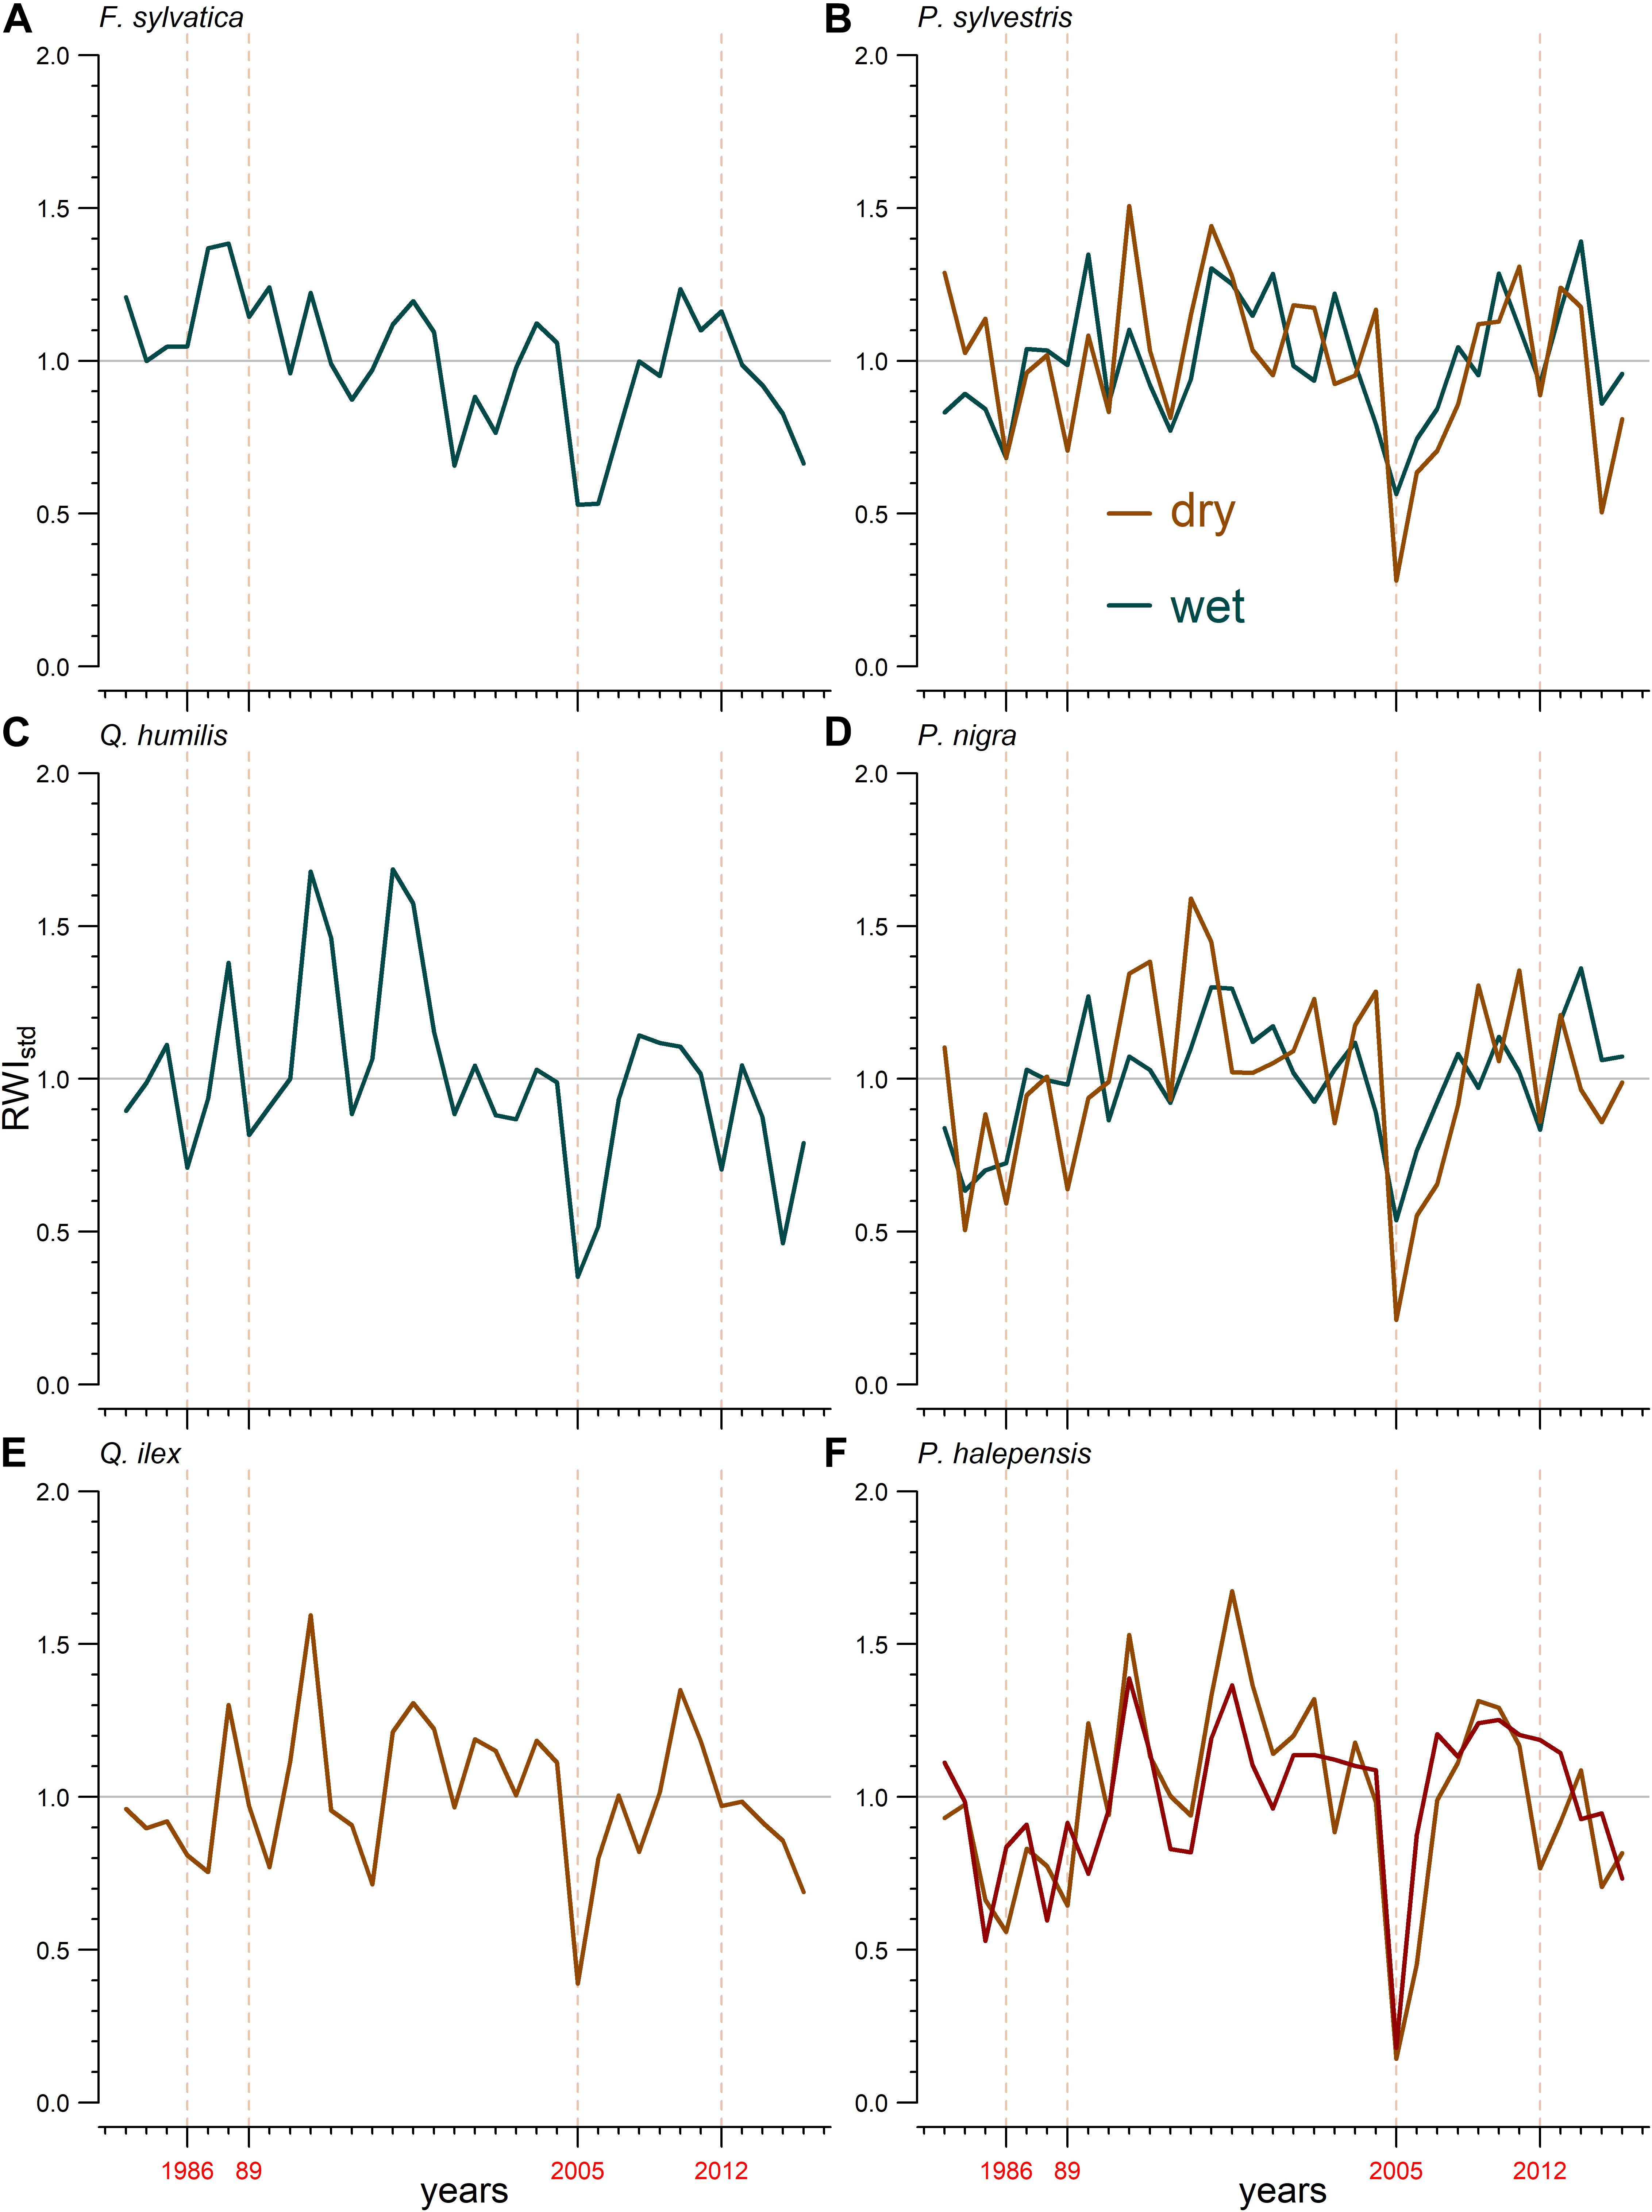
Figure 1. Standardized tree-ring width chronologies (RWIstd) for the six studied species [(A), F. sylvatica; (B), P. sylvestris; (C), Q. humilis; (D), P. nigra; (E), Q. ilex; (F), P. halepensis]. The horizontal line represents the mean ring-width index. Dark green colors indicate populations sampled in wet sites and brown colors indicate populations sampled in dry sites (dark red color indicates the Pinus halepensis plantation). The vertical dashed lines and numbers in red indicate major droughts.
Tree growth reductions because of drought were more manifest in dry than in wet sites (Figure 1 and Supplementary Figure S5). The strongest growth reductions were observed in response to the 2005 drought at the dry sites (Figure 1 and Supplementary Figure S5). The cumulative drought-induced growth reductions were higher for the species in dry sites, and particularly for Scots pine and black pine (Supplementary Figure S5b). The results of the LMEs confirmed that the relationship of tree growth with the 12-month August SPEI was stronger in dry than in wet sites (Supplementary Tables S1, S2 and Figure 2).
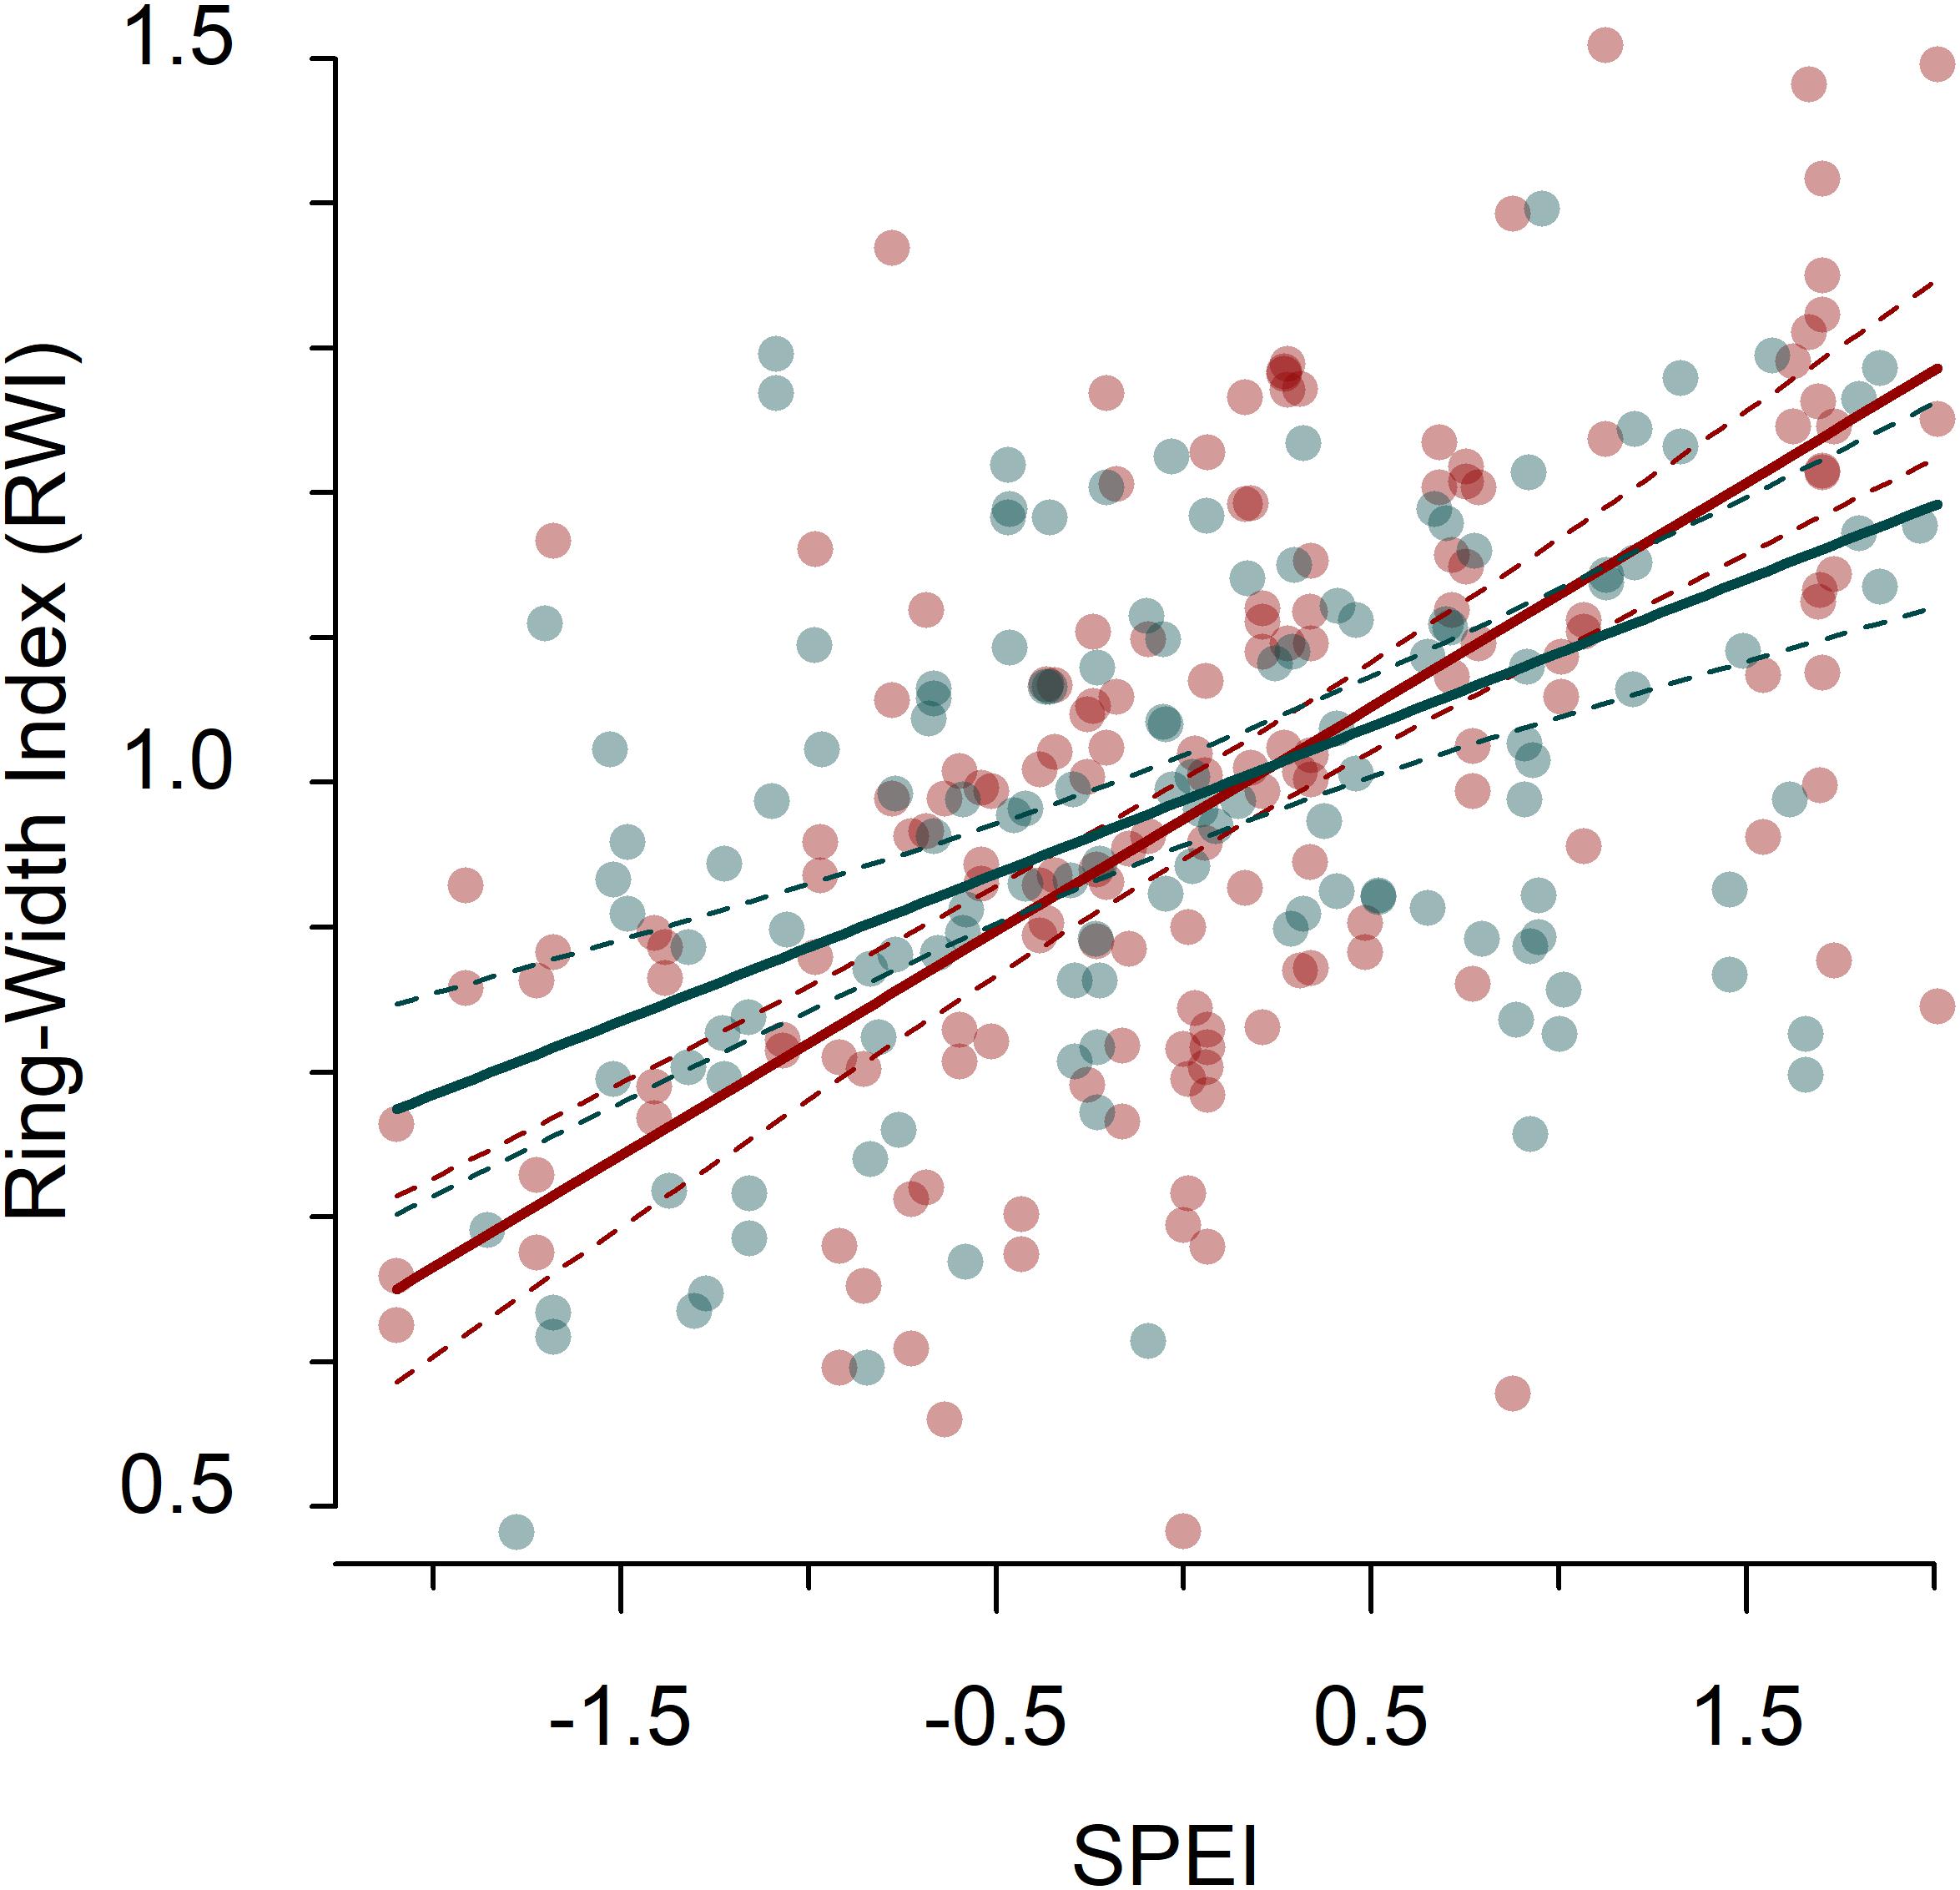
Figure 2. Relationship between residual tree-ring width chronologies (RWIres) and drought (the 12-month SPEI in August) in dry and wet sites according to the fitted linear mixed-effect models. Blue symbols and lines indicate populations sampled in wet sites and red symbols and lines indicate populations sampled in dry sites. The thick solid line shows the effect of SPEI on RWIres (and 95% confidence intervals are plotted as dashed lines).
The difference between the observed growth and that predicted by drought (i.e., expected drought impact on growth) showed that the 12-month August SPEI was not able to fully predict the impact of the 2005 drought on growth (Figure 3A). Lower than expected growth values were found after the 2005 (Figure 3B) and 2012 droughts (Figure 3C). These drought legacies were more intense and lasted longer after the 2012 drought, particularly for beech and oaks. Most of the dead trees in the two species most impacted by drought-induced dieback (Holm oak, Scots pine) died (i.e., formed their last ring) between 2005 and 2017 (Supplementary Figure S6).
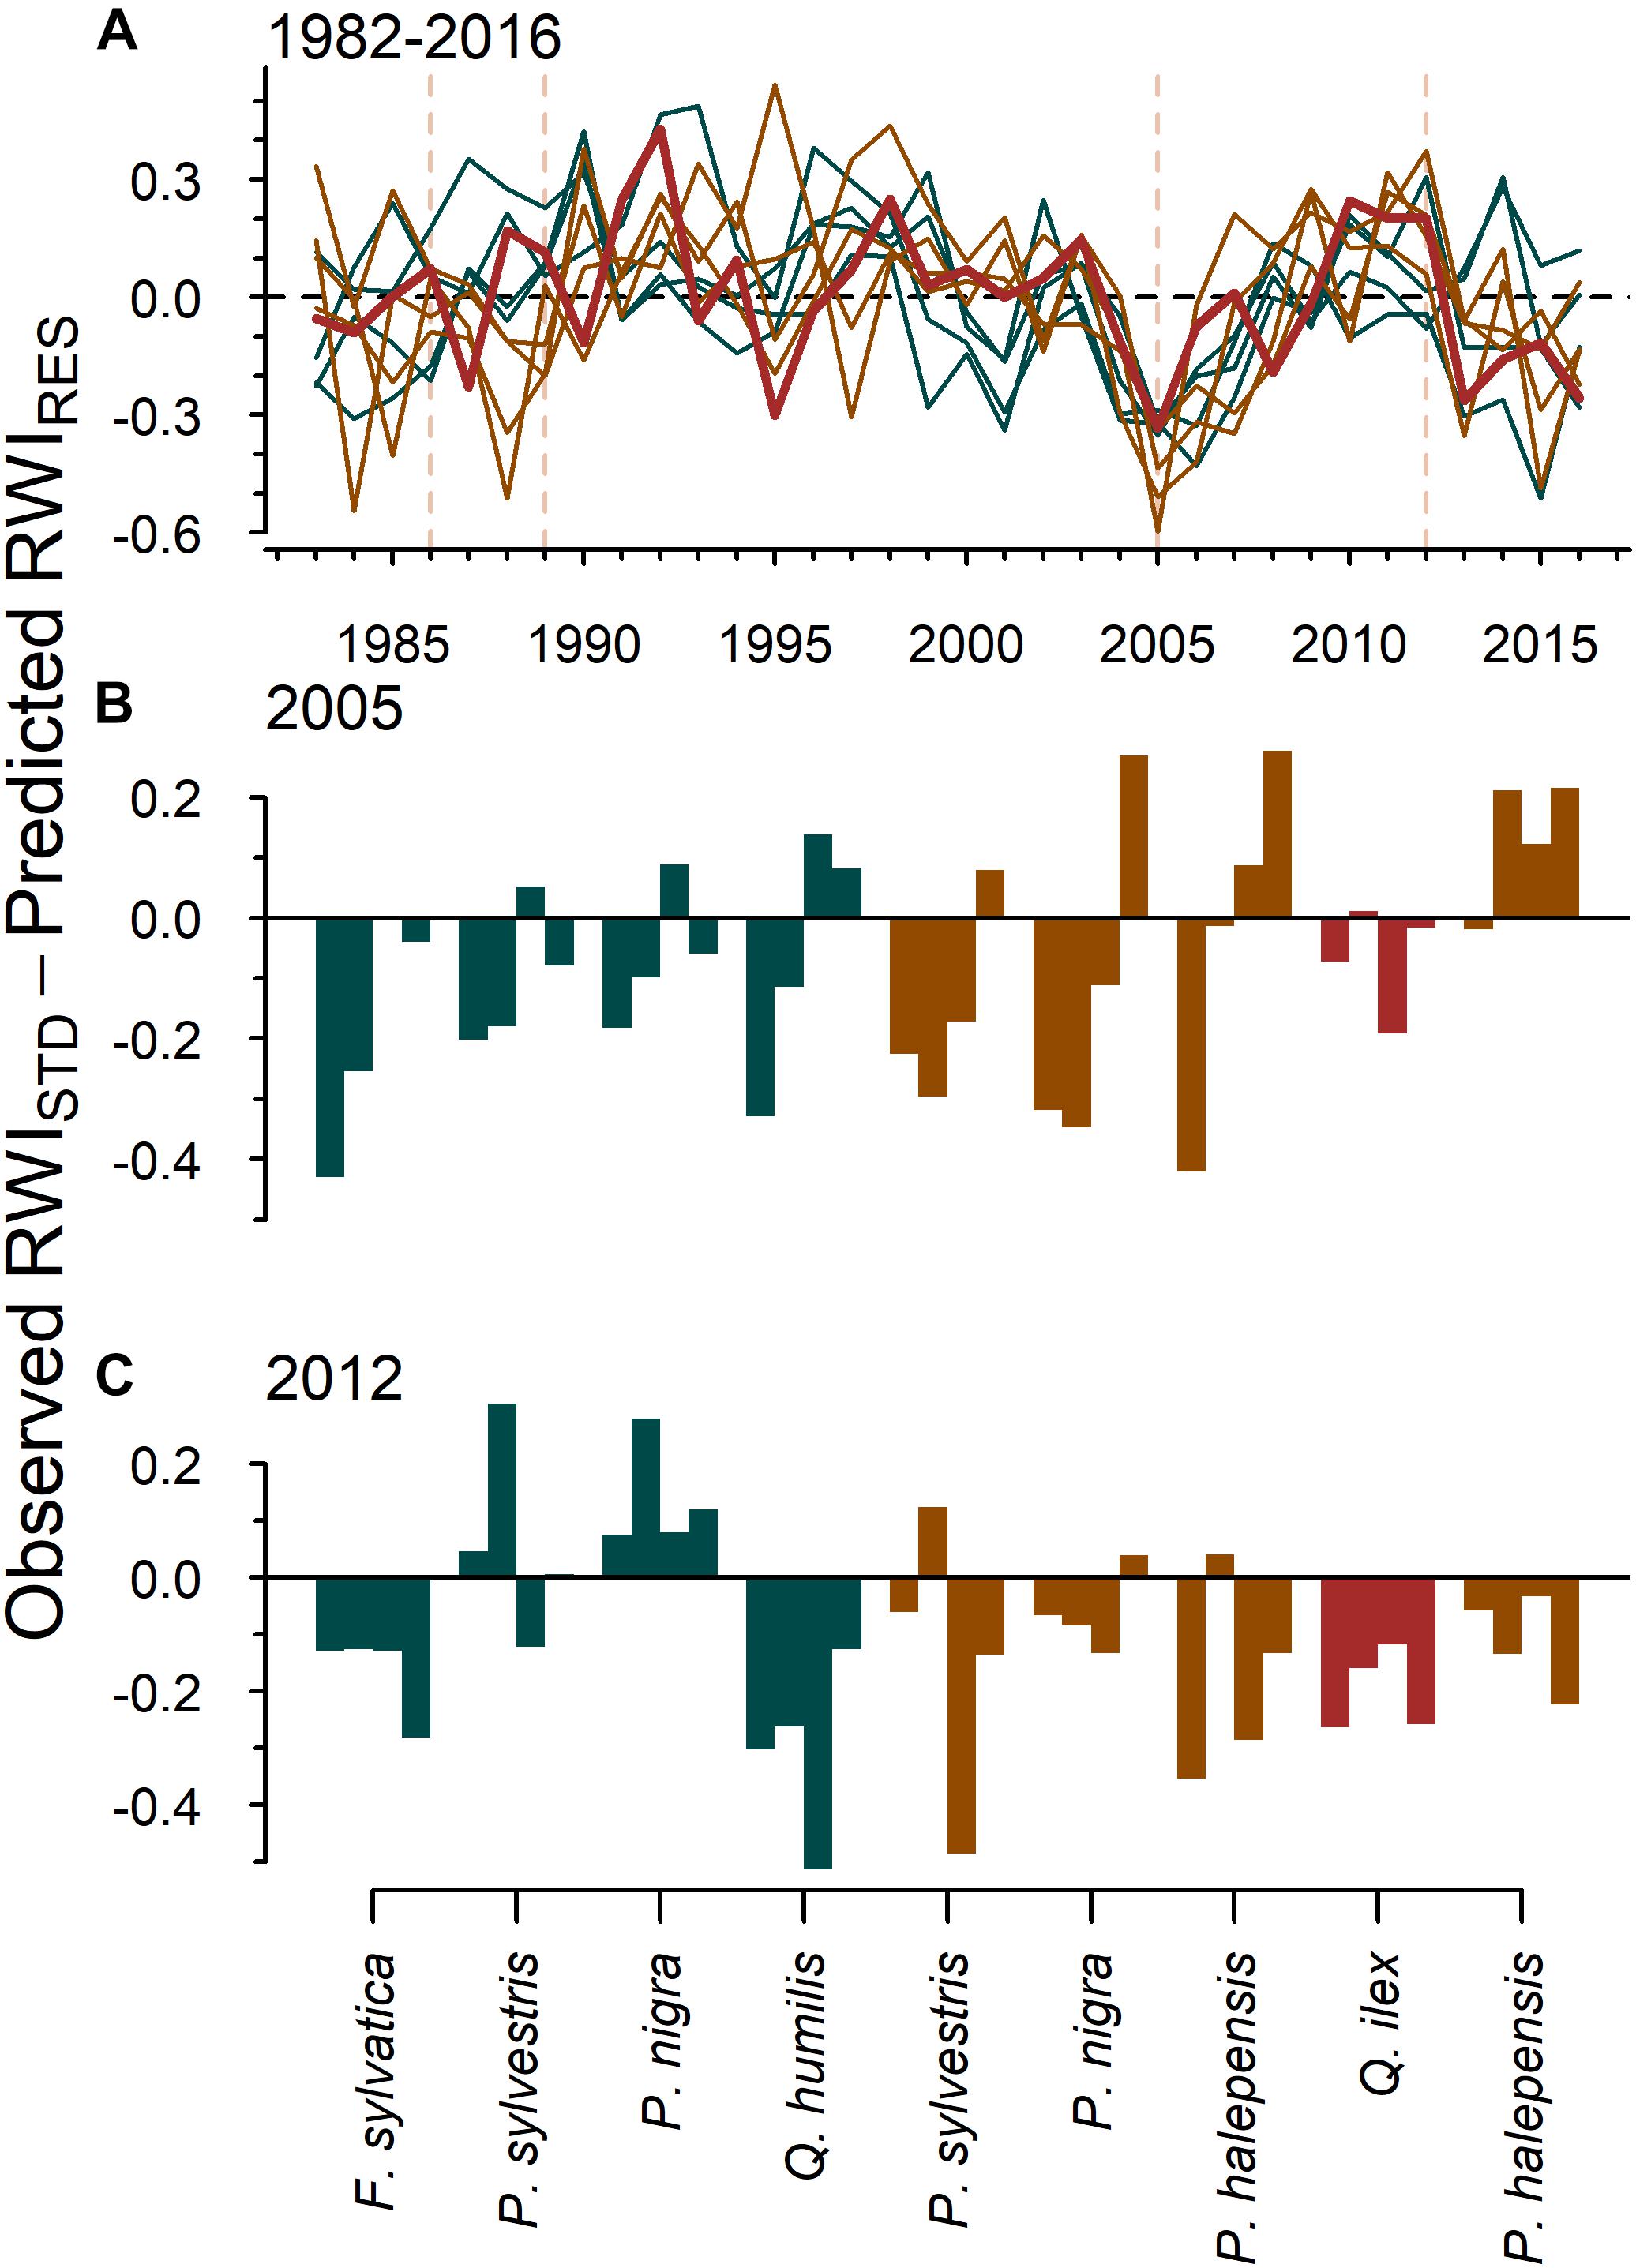
Figure 3. Legacies of drought on tree growth (i.e., pervasive effects of drought on growth that persist after the drought has finished). The figure shows (A) the difference between the standardized growth variability (RWIstd) and the growth (RWIres) predicted by drought (SPEI) for the entire period and 4 years after the (B) 2005 and (C) 2012 droughts, respectively. Negative values indicate that growth was lower than expected by the effect of SPEI (i.e., drought legacies). Dark green colors correspond to the tree species in wet sites and brown colors in dry sites, whilst red bars and lines [plot (A)] correspond to Holm oak. Dashed vertical lines in plot (A) indicate the studied droughts (i.e., 1986, 1989, 2005, and 2012).
Within-site tree growth synchrony varied between wet and dry sites (Figure 4 and Supplementary Table S3). In the case of the comparison of dry vs. wet sites, we selected the homocedastic unstructured model, i.e., allowing for heterogeneous variances and covariances. Similar results were observed for RWIstd and RWIres (Supplementary Table S3). In the case of RWIres, the selected model (homoscedastic unstructured model) provided support for the existence of lower synchrony in wet sites (0.44 ± 0.06) than in dry sites (0.61 ± 0.06). There was also a notable within-group variation (0.48 ± 0.06). In the case of the comparison between gymnosperms and angiosperms, the best VCOV model proved to be a broad evaluation model suggesting the lack of synchrony. The temporal trend in synchrony showed an increase in dry sites as compared to wet sites (Figure 4).
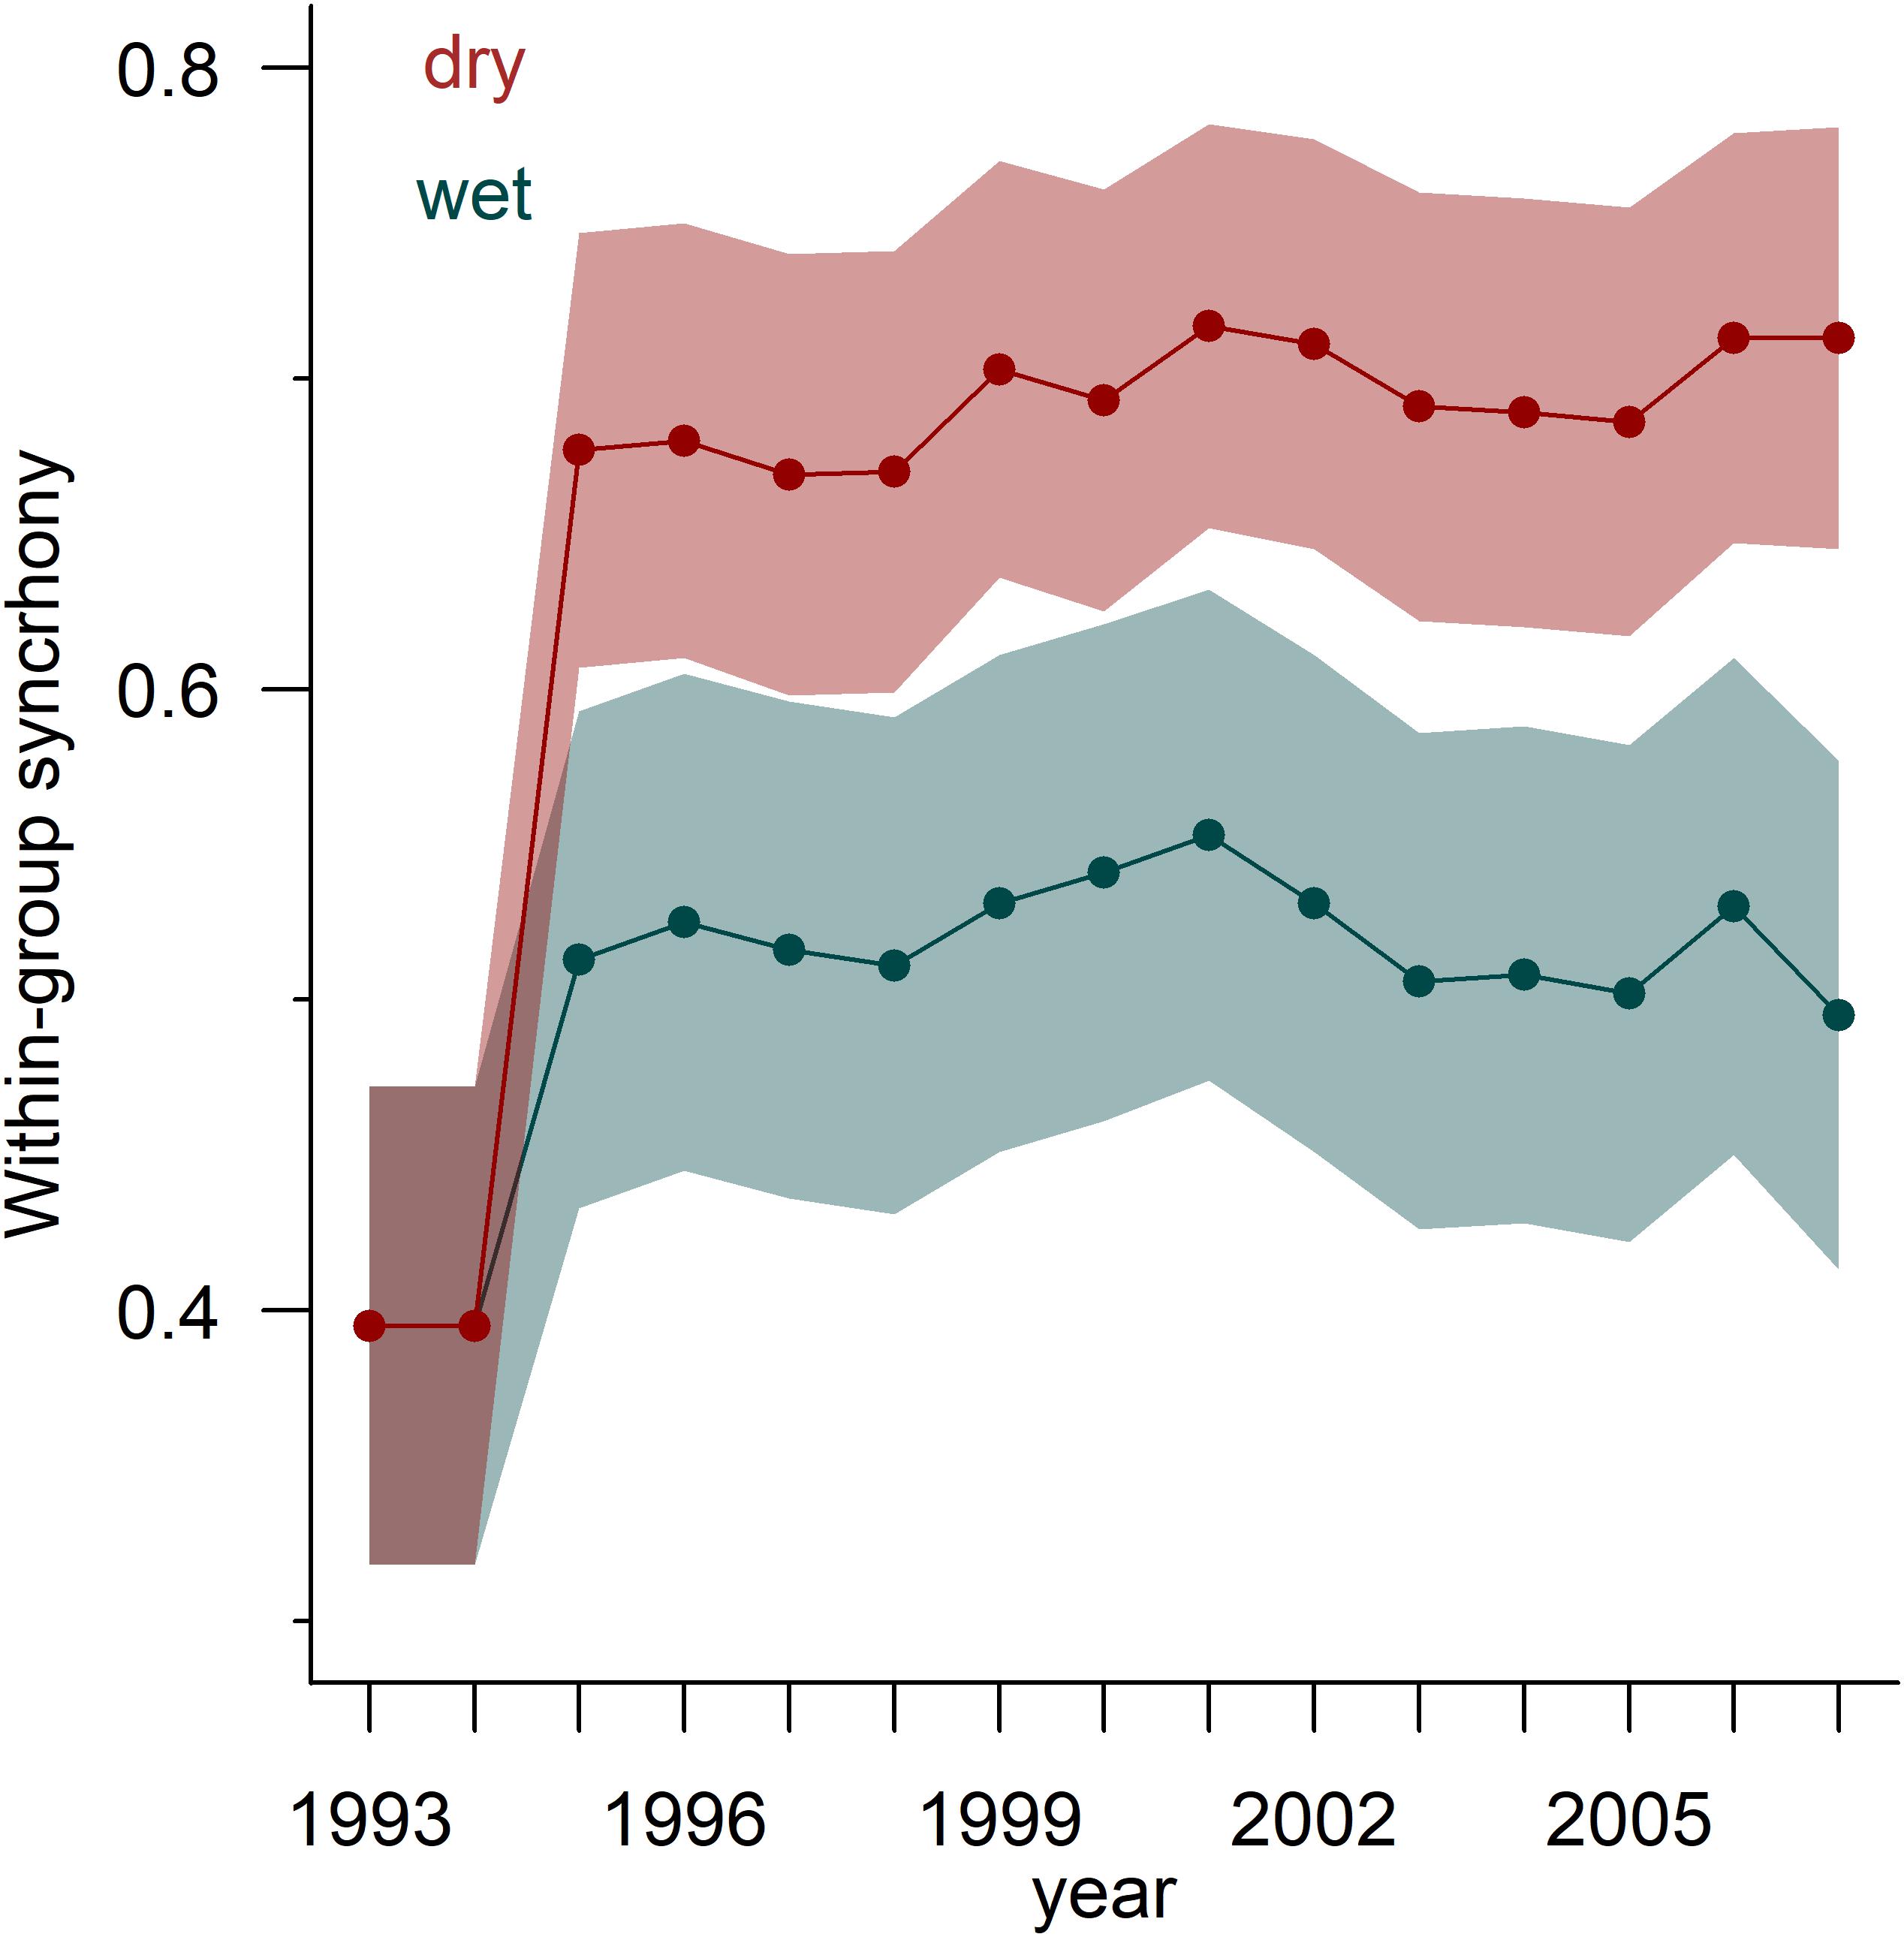
Figure 4. Temporal trends in within-group tree-ring width (RWIres) synchrony calculated for dry (red symbols and areas) and wet (blue symbols and areas) sites. The synchrony was calculated for the best model considering 20-year moving intervals lagged by 1 year over the period 1983–2016. The x-axis shows the central year of the moving intervals. Lines and points represent observed values and shadows are standard errors. Synchrony increased sharply between the second and the third periods (1985–2005 and 1986–2006), and was higher in dry sites than in wet sites during the following periods. The results correspond to a homocedastic variance covariance (VCOV) unstructured model.
We found that NDVI peaked during May and winter (December–January) and decreased during summer (July and August) but the pattern was different in dry and wet sites (Figure 5 and Supplementary Figures S7–S9). The GAMM accounted for 50% of the variation in NDVI and showed that the intra-annual variation varied more than the temporal trend (Supplementary Figure S8) and that this variation was stronger in dry sites (Supplementary Table S4). The long-term trend of NDVI showed reductions in the dry years (Supplementary Figures S7, S8), which were more marked in dry sites (Supplementary Figure S9). Lower NDVI values were found in dry places suggesting low productivity (Supplementary Figure S9). In this sense, we found that RWIstd and NDVI were positively related (0.37 ± 0.03; p < 0.05). The LME also showed that RWIstd depended on site conditions (0.86 ± 0.15; p < 0.05; see Supplementary Table S5) but not its interaction with NDVI, and so the slope of the relationship between NDVI and RWIstd was the same in dry and wet sites but the intercept varied (Figure 5). The model accounted for 79% of the variation in RWIstd and 55% of the variation was explained by the effects of NDVI and site.
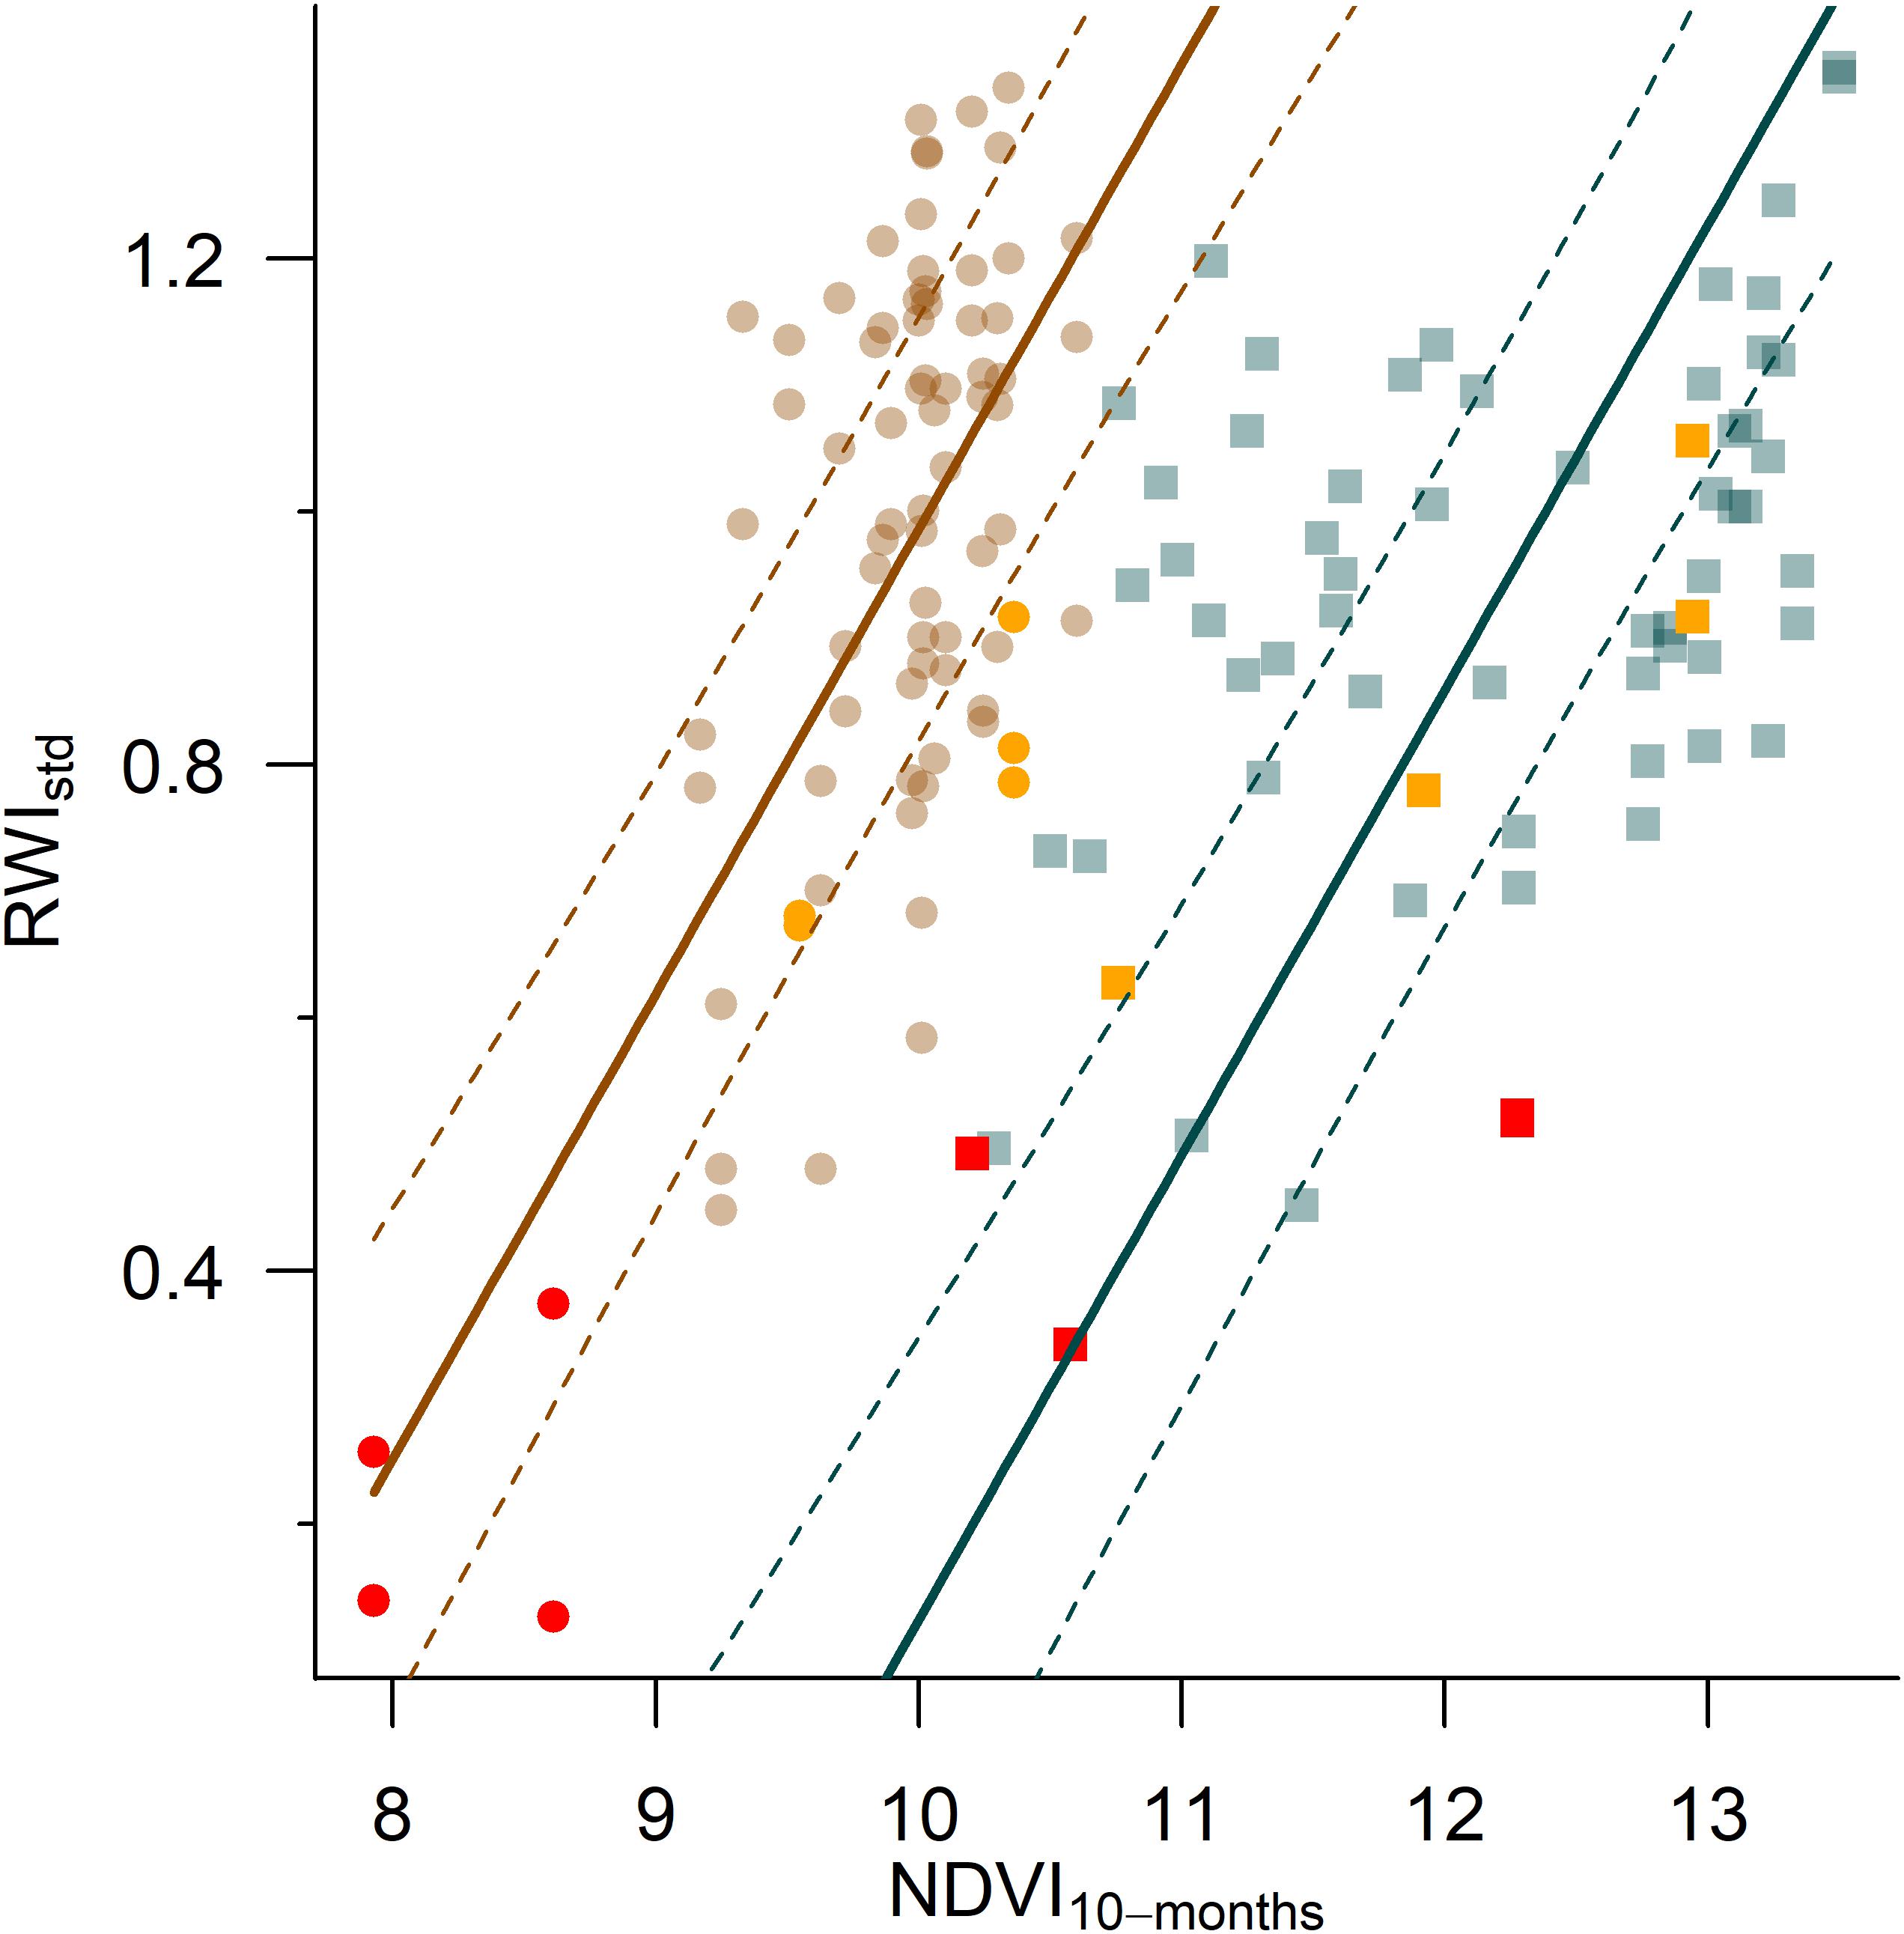
Figure 5. Relationship between the standard tree-ring width chronologies (RWIstd) and the 10-month long cumulative NDVI for November in dry (brown circles) and wet (blue squares) sites. The lines show the effect of NDVI on RWIstd according to the linear-mixed effect models (see Supplementary Table S5) and the dashed lines show the 95% confidence intervals for the predictions. Red and orange symbols show the values observed in the 2005 and 2016 droughts, respectively.
Discussion
We found that the radial growth of the six studied tree species was greatly constrained by early summer drought according to our first hypothesis. This phenomenon was fully evidenced during the 2005 extreme drought that lead to growth reductions higher than 40% in all species. We also found that growth reductions were more marked in dry places due to a stronger dependency on precipitation and leading to an increasing trend in within-site spatial synchrony between species, a phenomenon that may be considered an early warning of the impacts of climate change (Shestakova et al., 2016; Tejedor et al., 2020). Drought legacies were particularly intense and durable for Fagaceae species after the 2012 drought and suggest that the long-term deterioration of the hydraulic system and/or the depletion of carbon reserves can explain drought-induced mortality in Holm oak in the studied sites (Galiano et al., 2012). However, we cannot discard than the causes that lead to tree mortality can depend on other factors such as oxidative stress (Ameye et al., 2018). The strongest legacy, i.e., the deviation between growth observed in 2005 and drought-predicted growth, pointed again to the largest impact of that drought compared to previous dry events. Our results point out to cumulative effects of more frequent hotter droughts on tree growth and vigor, dieback, and increased mortality of vulnerable species in dry sites from the studied region. Further, drought-induced growth reductions also resulted in vegetation activity reductions because greater growth sensitivity to drought was strongly linked with a remarkably lower vegetation activity as indicated by the NDVI drops. Hot and dry conditions leading to increased evapotranspiration rates and drought stress in spring and summer (Supplementary Figure S10) can have pervasive and negative consequences on the growth recovery of tree species in sites with low soil water-holding capacity (Sánchez-Salguero and Camarero, 2020), as the one studied here. Whether this result can be extrapolated to other regions remains unclear due to the mainly local extent of our study. However, we demonstrate that accounting for growth sensitivity to drought helps to identify those species and sites most impacted by drought.
We found that drought is an important factor constraining the growth of the studied species as previously found in comparable Mediterranean ecosystems (Pasho et al., 2012; Gazol et al., 2018). All species, excepting Aleppo pine and black pine, responded positively to precipitation and negatively to maximum temperature during early summer (Supplementary Figure S4). Aleppo pine is a species adapted to drought that may present a bimodal growth under xeric conditions (e.g., Camarero et al., 2010) and its growth strongly relies on precipitation during winter (De Luis et al., 2013). It is also plausible to think that under dry circumstances, the growth of black pine also depends on water availability before the growing season which recharges soil water pools in winter (Sangüesa-Barreda et al., 2019). Indeed, these two pine populations responded significantly to the 12-month long SPEI indicating that their growth depends on winter conditions. In this sense, the impact of SPEI was only non-significant in the case of Scots pine and black pine in wet sites. Pasho et al. (2011) found that gymnosperms from wet sites responded to drought at short-time scales in contraposition to other species from dry sites. Furthermore, the black pine population in the wet site was particularly young and thus it can be less vulnerable to drought occurrence (Martínez del Castillo et al., 2018). These results also indicate that local conditions can influence how tree growth responds to drought, and the increased sensitivity to drought of the two pine species in the driest sites suggests a higher drought-vulnerability toward drier sites (Sánchez-Salguero et al., 2017). This conclusion is supported by the stronger impact of SPEI on growth in dry sites (Figure 2), and it is further corroborated by the enhanced growth synchrony in those sites (Figure 4).
The extraordinary growth reductions observed during the 2005 drought (Figure 1 and Supplementary Figure S5) were not captured by the effect of SPEI on RWI (Figure 4), in contrast to what occurred in response to previous drought events (Figure 4). That is, the observed growth in 2005 was much lower than the growth predicted by drought (Figure 4). Furthermore, the marked increase in growth synchrony between species in dry sites started when the 2005 drought was considered in the time window (i.e., from the 1985 to 2005 period onward). These results point out to the extraordinary dimension of that drought regarding its impact on forests (González-Hidalgo et al., 2018). In this sense, widespread foliage loss, dieback and mortality of Mediterranean tree species have occurred since the early 1990s and aggravated in response to the strong 2005 drought in the region (Carnicer et al., 2011). This drought was characterized by elevated temperatures and evapotranspiration rates during the growing season (Supplementary Figure S10). Probably, the negative effects of the 2005 drought on growth lasted over the last decade, and its negative impacts have reactivated by recent warming trends and ended in a strong dieback event in 2016 (DeBosCat, 2017). This is further reinforced by the aggravation in drought legacies, i.e., the difference between observed and drought-predicted growth, from the 2005 to 2012 droughts (Figure 3). These results confirm that the impacts of drought on growth can last for several years (e.g., Ogle et al., 2000; Anderegg et al., 2015; Peltier et al., 2016), and that these drought legacies can aggravate with the accumulation of severe droughts resulting in more pervasive growth reductions (Peltier and Ogle, 2019). This is particularly notable in the case of Holm oak, the most affected species, which showed more pervasive drought legacies after the 2012 drought, which was characterized by warm-dry conditions during the 2011–2012 winter and the 2012 spring, than after the 2005 drought. However, deviation between observed and drought-predicted growth were in general lower in response to the 2005 drought than after drought occurrence. Deciphering whether those growth deviations are a consequence of prolonged drought impacts may require further research over longer time periods. In any case, the results points that the cumulative impact of hotter droughts can have negative consequences on some Mediterranean tree species and forests.
There might be a trade-off between growth resistance (i.e., how growth is impacted by drought) and growth recovery (i.e., capacity to recover after drought) that might depend on species adaptations. Gymnosperms are known to have marked growth reductions (i.e., low resistance) in response to drought but in some cases, they can recover fast. Such is the case of Mediterranean pines (Gazol et al., 2020). Thus, growth resistance and recovery alone provide useful but incomplete information as many other factors can ultimately determine how tree species tolerate drought. For instance, the occurrence of favorable conditions at some point may facilitate the performance of a species that can suffer strong mortality rates when climate conditions worsen (Jump et al., 2017). In this respect, combining different sources of information might be useful and the use of permanent plots that allow quantifying stand characteristics and recruitment capacity are of great value. This evidences the utility of the intensive, long-term monitoring of those sites showing dieback to understand its causes and consequences and how it varies between species.
Angiosperms were more severely defoliated in 2016 than gymnosperms in the region (DeBosCat, 2017). Interestingly, GAMM showed a stronger impact of the 2005 drought on NDVI in wet than in dry sites (Supplementary Figure S8) which might indicate that primary production was more constrained in those sites dominated by Q. humilis, F. sylvatica, and P. sylvestris. However, growth reductions in response to drought were much more intense in gymnosperms, particularly those in dry sites during the 2005 drought (Figure 1 and Supplementary Figure S5), than in angiosperms. This is in line with the higher prevalence of abrupt growth reductions in gymnosperms (Schweingruber, 1986), and with previous studies indicating that pines from the Mediterranean region present a plastic growth response to drought (Camarero et al., 2010). According to our results the capacity to recover from drought of gymnosperms from dry sites is faster than that of angiosperms in general (Gazol et al., 2018). However, it is also true that most studies have found longer and more lasting legacies of drought in gymnosperms than in angiosperms (e.g., Anderegg et al., 2015; Gazol et al., 2020). Recently, DeSoto et al. (2020) found that those trees that die because of drought presented lower growth resilience than surviving ones. Our results indicate that the growth of Holm oak was lower than expected in the 4 years after the 2012 drought occurrence. However, these long-lasting growth reductions were also common in the rest of tree species, particularly in Fagaceae species from wet sites, and did not result in dieback and elevated mortality.
The potential occurrence of pervasive drought legacies cannot explain why some Holm oak and Scots pine trees showed more dieback and mortality rate despite the mechanisms can be partially inferred (e.g., Cailleret et al., 2017). It is unlikely to think that differences in morphological, structural, or hydraulic traits drive differences in drought-induced mortality in the Montsec sites. Most likely, a feasible explanation for the decline of several holm oak and Scots pine trees can be on the influence of local site conditions in general (Kannenberg et al., 2019; Stralberg et al., 2020), and belowground conditions in particular. In these drought-prone and low productive sites, tree survival during drought may depend on the capacity to access to rock bedrock groundwater (McDowell et al., 2019; Mackay et al., 2020). Several studies have found that small trees from different oak species can be more vulnerable to drought than larger individuals (Colangelo et al., 2018), and this could be due to a smaller root system and a reduced ability to use deep soil water sources (Ripullone et al., 2020). Along this, the diameter of the trees was the smallest in the two sites impacted by drought (see Table 1), which can suggest a greater sensitivity of smaller individuals. However, we lack enough data to provide a statistically sound comparison between dead and living trees. Future studies will benefit from a random sampling of trees (Nehrbass-Ahles et al., 2014) together with a characterization of tree height and stand density of all dead and living individuals within permanent plots, which can improve the interpretations of the effects of tree size on growth response to drought. If the causes of dieback and tree death depend on the ability to access belowground water resources, the size and architecture of trees can also determine their vulnerability by regulation of non-structural carbohydrates allocation (Galiano et al., 2012). On the other hand, the dieback and mortality of Scots pine could be more related to hydraulic failure (Pellizzari et al., 2016). However, more research is needed to fully understand whether long-term hydraulic failure or carbon depletion contributed to explain Holm oak dieback and mortality, which seems to be mainly triggered by local soil factors.
How drought-induced growth reductions translate to changes in primary productivity and vegetation activity at the ecosystem level remains unclear (Gazol et al., 2020). Interestingly, we found a positive relationship between RWIstd and NDVI, which is in accordance with previous results (Vicente-Serrano et al., 2019). We also found that NDVI was lower in dry sites indicating that those sites that are more susceptible of drought-induced growth reductions are also less productive. This confirms that carbon uptake and growth are limited by water availability (Körner, 2015). Moreover, seasonal patterns in NDVI were very different between sites indicating that phenology varies between sites according to the species dominating the forests (Aragonés et al., 2019). However, recent studies have identified that NDVI variations depend on the interaction of multiple factors cautioning about the interpretation of the impact of single factors (Piedallu et al., 2019). These results indicate that combining tree- and ecosystem level measures help to understand how dieback events translate into changes in vegetation activity patterns at the ecosystem level.
Conclusion
We combined tree-ring measures and satellite-derived vegetation indexes to show that droughts severely constrain growth and that this has an impact on forest productivity. As hotter droughts become more frequent and intense their negative consequences on terrestrial ecosystems are exacerbated. However, the impacts of drought on growth are clearly site- and species- specific thus making difficult to drive universal rules on how trees respond to drought. Accordingly, additional local studies combining different approaches are required to improve our understanding on how forests respond to drought and what can be expected in the near future. Such is the case of this study, which despite being local in geographic extent offers information on how six tree species varying in their functional characteristics respond to drought in a region.
The most important conclusion of our study is that dry sites are more vulnerable to drought but that the species will respond in different ways. We found that growth reductions in response to drought were strong in Mediterranean pines, but mortality was stronger in Holm oak and in Scots pine inhabiting dry sites. Thus, understanding how tree growth responds to drought is not enough to understand the resilience capacity of forests to drought. Further research is required to corroborate if the drought-induced dieback and growth decline of some species is determined by their ability to access groundwater resources. The importance of such soil water and nutrients in driving dieback and tree mortality episodes in dry ecosystems, and how they interact with the physiological behavior of tree species, should be considered in further studies.
Data Availability Statement
The raw data supporting the conclusions of this article will be made available by the authors, without undue reservation.
Author Contributions
AG led the analyses and writing of the manuscript with substantial contributions by JC. GS-B and JC were responsible of tree-ring analyses. All authors carried out field sampling, edited and discussed the final draft.
Funding
JC, AG, and RS-S acknowledge the support of the FORMAL (RTI2018-096884-B-C31) and LESENS (RTI2018-096884-B-C33) projects from the Spanish Ministry of Science, Innovation and Universities; and VULBOS project (UPO-1263216) from the ERDF funds Andalusia regional government 2014-2020. GS-B was supported by Spanish Ministry of Economy, Industry and Competitiveness Postdoctoral grant (FJCI 2016-30121; FEDER funds) and from the European Union through the CANOPEE Interreg POCTEFA project.
Conflict of Interest
The authors declare that the research was conducted in the absence of any commercial or financial relationships that could be construed as a potential conflict of interest.
Acknowledgments
We thank the Departament d’Agricultura, Ramaderia, Pesca i Alimentació (Generalitat de Catalunya) for providing permission for the field campaigns.
Supplementary Material
The Supplementary Material for this article can be found online at: https://www.frontiersin.org/articles/10.3389/ffgc.2020.573346/full#supplementary-material
References
Alday, J. G., Shestakova, T. A., Resco de Dios, V., and Voltas, J. (2017). DendroSync: Evaluating Synchrony from Dendrochronological Data. Package Version 0.1.0.
Alday, J. G., Shestakova, T. A., Resco de Dios, V., and Voltas, J. (2018). DendroSync: an R package to unravel synchrony patterns in tree-ring networks. Dendrochronologia 47, 17–22. doi: 10.1016/j.dendro.2017.12.003
Allen, C. D., Breshears, D. D., and McDowell, N. G. (2015). On underestimation of global vulnerability to tree mortality and forest die-off from hotter drought in the anthropocene. Ecosphere 6:129.
Ameye, M., Allmann, S., Verwaeren, J., Smagghe, G., Haesaert, G., Schuurink, R. C., et al. (2018). Green leaf volatile production by plants: a meta-analysis. New Phytol. 220, 666–683. doi: 10.1111/nph.14671
Anderegg, L. D. L., Anderegg, W. R. L., and Berry, J. A. (2013). Not all droughts are created equal: translating meteorological drought into woody plant mortality. Tree Physiol. 33, 672–683. doi: 10.1093/treephys/tpt044
Anderegg, W. R. L., Schwalm, C., Biondi, F., Camarero, J. J., Koch, G., Litvak, M., et al. (2015). Pervasive drought legacies in forest ecosystems and their implications for carbon cycle models. Science 349, 528–532. doi: 10.1126/science.aab1833
Andreu, L., Gutiérrez, E., Macias, M., Ribas, M., Bosch, O., and Camarero, J. J. (2007). Climate increases regional tree-growth variability in Iberian pine forests. Glob. Chang. Biol. 13, 1–12.
Aragão, J. R. V., Groenendijk, P., and Lisi, C. S. (2019). Dendrochronological potential of four neotropical dry-forest tree species: climate-growth correlations in northeast Brazil. Dendrochronologia 53, 5–16. doi: 10.1016/j.dendro.2018.10.011
Aragonés, D., Rodríguez-Galiano, V. F., Caparros-Santiago, J. A., and Navarro-Cerrillo, R. M. (2019). Could land surface phenology be used to discriminate Mediterranean pine species? Int. J. Appl. Earth Observ. Geoinform. 78, 281–294. doi: 10.1016/j.jag.2018.11.003
Babst, F., Bodesheim, P., Charney, N., Friend, A. D., Girardin, M. P., Klesse, S., et al. (2018). When tree rings go global: challenges and opportunities for retro- and prospective insight. Quat. Sci. Rev. 197, 1–20. doi: 10.1016/j.quascirev.2018.07.009
Baker, K. V., Tai, X., Miller, M. L., and Johnson, D. M. (2019). Six co-occurring conifer species in northern Idaho exhibit a continuum of hydraulic strategies during an extreme drought year. AoB Plants 11:lz056.
Barton, K. (2018). MuMIn: Multi-Model Inference. R Package Version 1.42.1. Available online at: https://CRAN.R-project.org/package=MuMIn (accessed June 8, 2020).
Breheny, P., and Burchett, W. (2017). Visualization of regression models using visreg. R J. 9, 56–71. doi: 10.32614/rj-2017-046
Briffa, K. R., and Jones, P. D. (1990). “Basic chronology statistics and assessment,” in Methods of Dendrochronology: Applications in the Environmental Sciences, eds E. R. Cook and L. A. Kairiukstis (Dordrecht: Kluwer), 137–152.
Brodribb, T. J., Powers, J., Cochard, H., and Choat, B. (2020). Hanging by a thread? Forests and drought. Science 368, 261–266. doi: 10.1126/science.aat7631
Burnham, K. P., and Anderson, D. R. (2002). Model Selection and Multimodel Inference, a Practical Information-Theoretic Approach. New York, NY: Springer.
Cailleret, M., Jansen, S., Robert, E. M. R., DeSoto, L., Aakala, T., Antos, J. A., et al. (2017). A synthesis of radial growth patterns preceding tree mortality. Glob. Chang. Biol. 23, 1675–1690.
Camarero, J. J., Gazol, A., Sangüesa-Barreda, G., Oliva, J., and Vicente-Serrano, S. M. (2015). To die or not to die: early-warning signals of dieback in response to a severe drought. J. Ecol. 103, 44–57. doi: 10.1111/1365-2745.12295
Camarero, J. J., Olano, J. M., and Parras, A. (2010). Plastic bimodal xylogenesis in conifers from continental Mediterranean climates. New Phytol. 185, 471–480. doi: 10.1111/j.1469-8137.2009.03073.x
Carnicer, J., Coll, M., Ninyerola, M., Pons, X., Sánchez, G., and Peñuelas, J. (2011). Widespread crown condition decline, food web disruption, and amplified tree mortality with increased climate change-type drought. Proc. Natl. Acad. Sci. U.S.A. 108, 1474–1478. doi: 10.1073/pnas.1010070108
Colangelo, M., Camarero, J. J., Borghetti, M., Gentilesca, T., Oliva, J., Redondo, M-A., et al. (2018). Drought and phytophthora are associated with the decline of oak species in Southern Italy. Front. Plant Sci. 9, 1–13. doi: 10.3389/fpls.2018.01595
Cook, E. R., and Krusic, P. (2007). ARSTAN 44: A Tree-Ring Standardization Program Based on Detrending and Autoregressive Time Series Modeling with Interactive Graphics. Available online at: https://wwwldeocolumbiaedu/tree-ring-laboratory/resources/software (accessed September 23, 2019).
Correa-Díaz, A., Silva, L. C. R., Horwath, W. R., Gómez-Guerrero, A., Vargas-Hernández, J., Villanueva-Díaz, J., et al. (2019). Linking remote sensing and dendrochronology to quantify climate-induced shifts in high-elevation forests over space and time. J. Geophys. Res. Biogeosci. 124, 166–183. doi: 10.1029/2018jg004687
Crouchet, S. E., Jensen, J., Schwartz, B. F., and Schwinning, S. (2019). Tree mortality after a hot drought: distinguishing density-dependent and -independent drivers and why it matters. Front. For. Glob. Chang. 2:21. doi: 10.3389/ffgc.2019.00021
De Luis, M., Èufar, K., Di Filippo, A., Novak, K., Papadopoulos, A., Piovesan, G., et al. (2013). Plasticity in dendroclimatic response across the distribution range of Aleppo pine (Pinus halepensis). PLoS One 8:e83550. doi: 10.1371/journal.pone.0083550
DeSoto, L., Cailleret, M., Sterck, F., Jansen, S., Kramer, K., Robert, E., et al. (2020). Low growth resilience to drought is related to future mortality risk in trees. Nat. Commun. 11:545. doi: 10.1038/s41467-020-14300-14305
Dobbertin, M. (2005). Tree growth as indicator of tree vitality and of tree reaction to environmental stress: a review. Eur. J. For. Res. 124, 319–333. doi: 10.1007/s10342-005-0085-3
Galiano, L., Martínez-Vilalta, J., Sabaté, S., and Lloret, F. (2012). Determinants of drought effects on crown condition and their relationship with depletion of carbon reserves in a Mediterranean holm oak forest. Tree Physiol. 32, 478–489. doi: 10.1093/treephys/tps025
Gazol, A., Camarero, J. J., Sánchez-Salguero, R., Vicente-Serrano, S. M., Serra-Maluquer, X., Gutiérrez, E., et al. (2020). Drought legacies are short, prevail in dry conifer forests and depend on growth variability. J. Ecol. 108, 2473–2484. doi: 10.1111/1365-2745.13435
Gazol, A., Camarero, J. J., Vicente-Serrano, S. M., Sánchez-Salguero, R., Gutiérrez, E., De Luis, M., et al. (2018). Forest resilience to drought varies across biomes. Glob. Chang. Biol. 24, 2143–2158. doi: 10.1111/gcb.14082
Gazol, A., Ribas, M., Gutiérrez, E., and Camarero, J. J. (2017). Aleppo pine forests from across Spain show drought-induced growth decline and partial recovery. Agric. For. Meteorol. 232, 186–194. doi: 10.1016/j.agrformet.2016.08.014
González-Hidalgo, J. C., Vicente-Serrano, S. M., Peña-Angulo, D., Salinas, C., Tomás-Burguera, M., and Beguería, S. (2018). High-resolution spatio-temporal analyses of drought episodes in the western Mediterranean basin (Spanish mainland, Iberian Peninsula). Acta Geophys. 66, 381–392. doi: 10.1007/s11600-018-0138-x
Gutiérrez, E., Campelo, F., Camarero, J. J., Ribas, M., Muntán, E., Nabais, C., et al. (2011). Climate controls act at different scales on the seasonal pattern of Quercus ilex L. stem radial increments in NE Spain. Trees 25, 637–646. doi: 10.1007/s00468-011-0540-3
Hartmann, H., Moura, C. F., Anderegg, W. R. L., Ruehr, N. K., Salmon, Y., Allen, C. D., et al. (2018). Research frontiers for improving our understanding of drought-induced tree and forest mortality. New Phytol. 218, 15–28. doi: 10.1111/nph.15048
Holmes, R. (1983). Computer-assisted quality control in tree-ring dating and measurement. Tree Ring Bull. 43, 69–78.
IPCC (2018). “Summary for Policymakers,” in Global Warming of 1.5°C. An IPCC Special Report on the Impacts of Global Warming of 1.5°C Above Pre-Industrial Levels and Related Global Greenhouse Gas Emission Pathways, in the Context of Strengthening the Global Response to the Threat of Climate Change, Sustainable Development, and Efforts to Eradicate Poverty, eds V. Masson-Delmotte, P. Zhai, H. O. Pörtner, D. Roberts, J. Skea, P. R. Shukla, et al. (Geneva: WMO), 32.
Johnson, D. M., Domec, J. C., Carter Berry, Z., Schwantes, A. M., McCulloh, K. A., Woodruff, D. R., et al. (2018). Co-occurring woody species have diverse hydraulic strategies and mortality rates during an extreme drought. Plant Cell Environ. 41, 576–588. doi: 10.1111/pce.13121
Jump, A. S., Ruiz-Benito, P., Greenwood, S., Allen, C. D., Kitzberger, T., Fensham, R., et al. (2017). Structural overshoot of tree growth with climate variability and the global spectrum of drought-induced forest dieback. Glob. Chang. Biol. 23, 3742–3757. doi: 10.1111/gcb.13636
Kannenberg, S. A., Novick, K. A., Alexander, M. R., Maxwell, J. T., Moore, D. J. P., Phillips, R. P., et al. (2019). Linking drought legacy effects across scales: from leaves to tree rings to ecosystems. Glob. Chang. Biol. 25, 2978–2992. doi: 10.1111/gcb.14710
Klockow, P. A., Vogel, J. G., Edgar, C. B., and Moore, G. W. (2018). Lagged mortality among tree species four years after an exceptional drought in east Texas. Ecosphere 9:e02455. doi: 10.1002/ecs2.2455
Körner, C. (2015). Paradigm shift in plant growth control. Curr. Opin. Plant Biol. 25, 107–114. doi: 10.1016/j.pbi.2015.05.003
Mackay, D. S., Savoy, P. R., Grossiord, C., Tai, X., Pleban, J. R., Wang, D. R., et al. (2020). Conifers depend on established roots during drought: results from a coupled model of carbon allocation and hydraulics. New Phytol. 225, 679–692. doi: 10.1111/nph.16043
Martínez del Castillo, E., Tejedor, E., Serrano-Notivoli, R., Novak, K., Saz, M. A., Longares, L. A., et al. (2018). Contrasting patterns of tree growth of Mediterranean pine species in the Iberian Peninsula. Forests 9:416. doi: 10.3390/f9070416
McDowell, N., Pockman, W. T., Allen, C. D., Breshears, D. D., Cobb, N., Kolb, T., et al. (2008). Mechanisms of plant survival and mortality during drought: why do some plants survive while others succumb to drought? New Phytol. 178, 719–739. doi: 10.1111/j.1469-8137.2008.02436.x
McDowell, N. G., Grossiord, C., Adams, H. D., Pinzón-Navarro, S., Mackay, D. S., Breshears, D. D., et al. (2019). Mechanisms of a coniferous woodland persistence under drought and heat. Env. Res. Lett. 14:045014. doi: 10.1088/1748-9326/ab0921
Meko, D. M., Touchan, R., and Anchukaitis, K. J. (2011). Seascorr: a MATLAB program for identifying the seasonal climate signal in an annual tree-ring time series. Comput. Geosci. 37, 1234–1241. doi: 10.1016/j.cageo.2011.01.013
Michel, A., and Seidling, W. (eds) (2017). Forest Condition in Europe: 2017 Technical Report of ICP Forests. Report under the UNECE Convention on Long-Range Transboundary Air Pollution (CLRTAP). Vienna: BFW Austrian Research Centre for Forests.
Muffler, L., Weigel, R., Hacket-Pain, A. J., Klisz, M., van der Maaten, E., Wilmking, M., et al. (2020). Lowest drought sensitivity and decreasing growth synchrony towards the dry distribution margin of European beech. J. Biogeogr. 47, 1910–1921. doi: 10.1111/jbi.13884
Myneni, R. B., Hall, F. G., Sellers, P. J., and Marshak, A. L. (1995). The interpretation of spectral vegetation indexes. IEEE Trans. Geosci. Rem. Sens. 33, 481–486. doi: 10.1109/tgrs.1995.8746029
Nakagawa, S., Johnson, P. C. D., and Schielzeth, H. (2017). The coefficient of determination R2 and intra-class correlation coefficient from generalized linear mixed-effects models revisited and expanded. J R Soc Interf. 14:20170213. doi: 10.1098/rsif.2017.0213
Nehrbass-Ahles, C., Babst, F., Klesse, S., Nötzli, M., Bouriaud, O., Neukom, R., et al. (2014). The influence of sampling design on tree-ring-based quantification of forest growth. Glob. Chang. Biol. 20, 2867–2885. doi: 10.1111/gcb.12599
Ogle, K., Whitham, T. G., and Cobb, N. S. (2000). Tree-ring variation in pinyon predicts likelihood of death following severe drought. Ecology 81, 3237–3243. doi: 10.1890/0012-9658(2000)081[3237:trvipp]2.0.co;2
Orwig, D. A., and Abrams, M. D. (1997). Variation in radial growth responses to drought among species, site, and canopy strata. Trees 11, 474–484. doi: 10.1007/s004680050110
Parra, A., and Moreno, J. M. (2017). Post-fire environments are favourable for plant functioning of seeder and resprouter Mediterranean shrubs, even under drought. New Phytol. 214, 1118–1131. doi: 10.1111/nph.14454
Pasho, E., Camarero, J. J., de Luis, M., and Vicente-Serrano, S. M. (2011). Impacts of drought at different time scales on forest growth across a wide climatic gradient in north-eastern Spain. Agric. For. Meteorol. 151, 1800–1811. doi: 10.1016/j.agrformet.2011.07.018
Pasho, E., Camarero, J. J., de Luis, M., and Vicente-Serrano, S. M. (2012). Factors driving growth responses to drought in Mediterranean forests. Eur. J. For. Res. 131, 1797–1807. doi: 10.1007/s10342-012-0633-6
Pellizzari, E., Camarero, J. J., Gazol, A., Sangüesa-Barreda, G., and Carrer, M. (2016). Wood anatomy and carbon-isotope discrimination support long-term hydraulic deterioration as a major cause of drought-induced dieback. Glob. Chang. Biol. 22, 2125–2137. doi: 10.1111/gcb.13227
Peltier, D. M. P., Fell, M., and Ogle, K. (2016). Legacy effects of drought in the southwestern United States: a multi-species synthesis. Ecol. Monogr. 86, 312–326. doi: 10.1002/ecm.1219
Peltier, D. M. P., and Ogle, K. (2019). Legacies of more frequent drought in ponderosa pine across the western United States. Glob. Chang. Biol. 25, 3803–3816. doi: 10.1111/gcb.14720
Piedallu, C., Chéret, V., Denux, J. P., Perez, V., Azcona, J. S., Seynave, I., et al. (2019). Soil and climate differently impact NDVI patterns according to the season and the stand type. Sci. Total Environ. 651, 2874–2885. doi: 10.1016/j.scitotenv.2018.10.052
Pinheiro, J., Bates, D., DebRoy, S., Sarkar, D., and R Core Team (2018). nlme: Linear and Nonlinear Mixed Effects Models. R Package Version 3. Available online at: http://CRAN. R-project.org/package=nlme (accessed June 8, 2020).
R Development Core Team (2019). R: A Language and Environment for Statistical Computing. Vienna: R Foundation for Statistical Computing.
Resende, A. F., Piedade, M. T. F., Feitosa, Y. O., Andrade, V. H. F., Trumbore, S. E., Durgante, F. M., et al. (2020). Flood-pulse disturbances as a threat for long-living Amazonian trees. New Phytol. 227, 1790–1803. doi: 10.1111/nph.16665
Ripullone, F., Camarero, J. J., Colangelo, M., and Voltas, J. (2020). Variation in the access to deep soil water pools explains tree-to-tree differences in drought-triggered dieback of Mediterranean oaks. Tree Physiol. 40, 591–604. doi: 10.1093/treephys/tpaa026
Sánchez-Salguero, R., and Camarero, J. J. (2020). Greater sensitivity to hotter droughts underlies juniper dieback and mortality in Mediterranean shrublands. Sci. Total Environ. 721:137599. doi: 10.1016/j.scitotenv.2020.137599
Sánchez-Salguero, R., Camarero, J. J., Gutiérrez, E., González Rouco, F., Gazol, A., Sangüesa-Barreda, G., et al. (2017). Assessing forest vulnerability to climate warming using a process-based model of tree growth: bad prospects for rear-edges. Glob. Chang. Biol. 23, 2705–2719. doi: 10.1111/gcb.13541
Sangüesa-Barreda, G., Camarero, J. J., Sánchez-Salguero, R., Gutiérrez, E., Linares, J. C., Génova, M., et al. (2019). Droughts and climate warming desynchronize Black pine growth across the Mediterranean Basin. Sci. Total Environ. 697:133989. doi: 10.1016/j.scitotenv.2019.133989
Schweingruber, F. H. (1986). Abrupt growth changes in conifers. IAWA Bull. 7, 277–283. doi: 10.1163/22941932-90000998
Senf, C., Pflugmacher, D., and Zhiqiang, Y. (2018). Canopy mortality has doubled in Europe’s temperate forests over the last three decades. Nat. Commun. 9:4978.
Shestakova, T. A., Gutiérrez, E., Kirdyanov, A. V., Camarero, J. J., Génova, M., Knorre, A. A., et al. (2016). Forests synchronize their growth in contrasting Eurasian regions in response to climate warming. Proc. Natl. Acad. Sci. U.S.A. 113, 662–667. doi: 10.1073/pnas.1514717113
Stralberg, D., Arseneault, D., and Baltzer, J. L. (2020). Climate-change refugia in boreal North America: what, where, and for how long? Front. Ecol. Environ. 18, 261–270. doi: 10.1002/fee.2188
Tejedor, E., Serrano-Notivoli, R., and de Luis, M. (2020). A global perspective on the climate-driven growth synchrony of neighbouring trees. Glob. Ecol. Biogeogr. 29, 1114–1125. doi: 10.1111/geb.13090
Vicente-Serrano, S. M., Beguería, S., and López-Moreno, J. I. (2010). A multiscalar drought index sensitive to global warming: The standardized precipitation evapotranspiration index. J. Clim. 23, 1696–1718. doi: 10.1175/2009jcli2909.1
Vicente-Serrano, S. M., Martín-Hernández, N., Camarero, J. J., Gazol, A., Sánchez-Salguero, R., Peña-Gallardo, M., et al. (2019). Linking tree-ring growth and satellite-derived gross primary growth in multiple forest biomes, Temporal-scale matters. Ecol. Ind. 108, 105753. doi: 10.1016/j.ecolind.2019.105753
Vicente-Serrano, S. M., Tomas-Burguera, M., Beguería, S., Reig, F., Latorre, B., Peña-Gallardo, M., et al. (2017). A high-resolution dataset of drought indices for Spain. Data 2:22. doi: 10.3390/data2030022
Wood, S. N. (2017). Generalized Additive Models: An Introduction with R. Boca Raton, FL: Chapman & Hall.
Keywords: dendroecology, Fagaceae, Holm oak, NDVI, Pinaceae, Scots pine, SPEI, tree-rings
Citation: Gazol A, Camarero JJ, Sangüesa-Barreda G, Serra-Maluquer X, Sánchez-Salguero R, Coll L and Casals P (2020) Tree Species Are Differently Impacted by Cumulative Drought Stress and Present Higher Growth Synchrony in Dry Places. Front. For. Glob. Change 3:573346. doi: 10.3389/ffgc.2020.573346
Received: 16 June 2020; Accepted: 21 October 2020;
Published: 24 November 2020.
Edited by:
Rosana López Rodríguez, Polytechnic University of Madrid, SpainReviewed by:
Bruno O. Gimenez, Smithsonian Tropical Research Institute, PanamaWilliam Marchand, Université du Québec à Montréal, Canada
Mario Trouillier, University of Greifswald, Germany
Copyright © 2020 Gazol, Camarero, Sangüesa-Barreda, Serra-Maluquer, Sánchez-Salguero, Coll and Casals. This is an open-access article distributed under the terms of the Creative Commons Attribution License (CC BY). The use, distribution or reproduction in other forums is permitted, provided the original author(s) and the copyright owner(s) are credited and that the original publication in this journal is cited, in accordance with accepted academic practice. No use, distribution or reproduction is permitted which does not comply with these terms.
*Correspondence: J. Julio Camarero, ampjYW1hcmVyb0BpcGUuY3NpYy5lcw==