 Naomi B. Schwartz1*
 Xiaohui Feng2
 Robert Muscarella3
 Nathan G. Swenson4María Natalia Umaña5
 Jess K. Zimmerman6
 María Uriarte2
- 1Department of Geography, University of British Columbia, Vancouver, BC, Canada
- 2Department of Ecology, Evolution, and Environmental Biology, Columbia University, New York, NY, United States
- 3Plant Ecology and Evolution, Evolutionary Biology Centre, Uppsala University, Uppsala, Sweden
- 4Department of Biology, University of Maryland, College Park, College Park, MD, United States
- 5Department of Ecology and Evolutionary Biology, University of Michigan, Ann Arbor, MI, United States
- 6Department of Environmental Science, University of Puerto Rico, San Juan, Puerto Rico
Predicting drought responses of individual trees in tropical forests remains challenging, in part because trees experience drought differently depending on their position in spatially heterogeneous environments. Specifically, topography and the competitive environment can influence the severity of water stress experienced by individual trees, leading to individual-level variation in drought impacts. A drought in 2015 in Puerto Rico provided the opportunity to assess how drought response varies with topography and neighborhood crowding in a tropical forest. In this study, we integrated 3 years of annual census data from the El Yunque Chronosequence plots with measurements of functional traits and LiDAR-derived metrics of microsite topography. We fit hierarchical Bayesian models to examine how drought, microtopography, and neighborhood crowding influence individual tree growth and survival, and the role functional traits play in mediating species’ responses to these drivers. We found that while growth was lower during the drought year, drought had no effect on survival, suggesting that these forests are fairly resilient to a single-year drought. However, growth response to drought, as well as average growth and survival, varied with topography: tree growth in valley-like microsites was more negatively affected by drought, and survival was lower on steeper slopes while growth was higher in valleys. Neighborhood crowding reduced growth and increased survival, but these effects did not vary between drought/non-drought years. Functional traits provided some insight into mechanisms by which drought and topography affected growth and survival. For example, trees with high specific leaf area grew more slowly on steeper slopes, and high wood density trees were less sensitive to drought. However, the relationships between functional traits and response to drought and topography were weak overall. Species sorting across microtopography may drive observed relationships between average performance, drought response, and topography. Our results suggest that understanding species’ responses to drought requires consideration of the microenvironments in which they grow. Complex interactions between regional climate, topography, and traits underlie individual and species variation in drought response.
Introduction
Tropical rainfall regimes are predicted to change in future climate scenarios, with many parts of the tropics becoming drier (Chadwick et al., 2015; Duffy et al., 2015). Dry conditions will likely have large impacts on tropical forests: drought influences forest ecosystem structure, composition, and function (Bonal et al., 2016; Uriarte et al., 2016b), and importantly, could decrease the size of the tropical forest carbon sink (Phillips et al., 2009; Pan et al., 2011; Gatti et al., 2014). However, large uncertainties about the impacts of drought on tropical forests remain, in part due to the difficulties of experimentally manipulating moisture conditions in tropical forests (but see Nepstad et al., 2007; da Costa et al., 2010). Observational studies of forest dynamics during natural droughts provide an opportunity to learn how drought affects tropical forests, especially where long-term data has been collected over multiple years (e.g., Condit et al., 1995; Clark et al., 2010; Uriarte et al., 2016a). Understanding the impacts of recent droughts will help anticipate future changes in tropical forests caused by shifting frequency and intensity of precipitation.
Most studies of drought in tropical forests have aimed to quantify effects on carbon uptake and storage and to understand how sensitivity to drought varies across size classes and tree species. Drought increases tree mortality and reduces growth which can result in large losses of stored carbon from tropical forests (Chazdon et al., 2005; Nepstad et al., 2007; da Costa et al., 2010; Phillips et al., 2010; Gatti et al., 2014). Growth and mortality of larger trees tend to respond more strongly to drought, though this relationship is not consistent across sites (Nepstad et al., 2007; Phillips et al., 2010; Bennett et al., 2015; Powers et al., 2020). Sensitivity to drought varies drastically across species. These differences can often be explained by physiological or functional traits, such as wood density, specific leaf area, stem hydraulic conductivity, turgor loss point, rooting depth, or specific leaf area, though the strength and direction of trait relationships with drought are highly variable (Skelton et al., 2015; Uriarte et al., 2016a; Greenwood et al., 2017; O’Brien et al., 2017; Powers et al., 2020).
However, even within species and size classes, substantial unexplained variation in individual drought response exists (Condit et al., 1995; Clark et al., 2010; Phillips et al., 2010). Spatial heterogeneity in the severity of water stress experienced by individual trees linked to topography, soils, or competitive environment could explain these differences. For example, competition for water via neighborhood crowding can suppress tree growth and drive variation in mortality rates across rainfall gradients (Ruiz-Benito et al., 2013). A more intense competitive environment can amplify water shortages during drought, increasing the probability of dying (Gleason et al., 2017).
Similarly, moisture conditions are well understood to vary across topographic positions. Variation in drainage and runoff means that slopes and ridges are drier than valleys (Burt and Butcher, 1985; Western et al., 1999; Daws et al., 2002). In the northern hemisphere, southwest facing slopes receive more solar radiation and have higher rates of evapotranspiration, and so water stress is typically higher (Stephenson, 1990). Accordingly, drought-induced mortality is often higher in drier landscape positions (Fekedulegn et al., 2003; Guarín and Taylor, 2005). In wetter landscape positions, moist microsites might provide refugia for less drought-tolerant species, mitigating drought impacts (Dobrowski, 2011). In future drier climates, these sites could rescue species that might face extinction if subject to regional climates (McLaughlin et al., 2017).
Despite its likely importance, few studies have considered topographic variation in drought effects in tropical forests (but see Nakagawa et al., 2000; Silva et al., 2013; Schwartz et al., 2019). Previous research has shown that topography influences species distributions (Ashton et al., 2006; Engelbrecht et al., 2007; Bartlett et al., 2016), canopy dynamics and disturbance rates (Comita and Engelbrecht, 2009; Silva et al., 2013). Drought could amplify or diminish these differences in performance, due to moisture stress being more severe at drier topographic positions. Furthermore, variation in performance across topography should depend on species and their functional traits, as some species are more sensitive to moisture, light, or nutrient availability than others.
Studies linking tree performance, moisture, and topography have typically focused on variation across sites or plots (Fekedulegn et al., 2003; Guarín and Taylor, 2005; Ashton et al., 2006; Engelbrecht et al., 2007; Comita and Engelbrecht, 2009). However, soil moisture and tree performance both vary with microtopography, i.e., topographic relief at very small (1 m) scales (Famiglietti et al., 1998; Daws et al., 2002; Tenenbaum et al., 2006). Ecological studies of the effects of microsite topography on tree performance have typically used categorical designations of topographic position (e.g., hummock vs. hollow, Nishimua et al., 2007; dry plateau vs. wet slopes, Engelbrecht et al., 2007), but mapping and identifying these categories across a continuous landscape is difficult. New remote sensing techniques can generate digital elevation models (DEMs) at very fine scales (<1 m), which can be used to quantify microtopographic relief and can be linked to variation in soil moisture (Tenenbaum et al., 2006; Buchanan et al., 2014). To our knowledge, no study has linked these quantitative characterizations of microsite topography with variation in tree performance during drought in the tropics.
In this study, we leverage a recent drought in Puerto Rico, and link annual tree census data from second-growth forests with LiDAR-derived measures of microtopographic relief to assess how drought affects tree growth and survival, and how traits, topography, and crowding mediate drought response. Specifically, we ask:
(1) What was the effect of a drought on tree growth and survival? We expected growth and survival to be reduced during drought, and for these effects to be more severe for larger trees.
(2) How does microtopographic relief affect tree growth and survival, and do its effects differ depending on rainfall? We expected that growth and survival would be lower on steeper slopes and ridges (i.e., areas with more convex curvature). Because these topographic positions tend to be drier, we also expected the effects of drought on tree growth and mortality would be amplified on steeper slopes and more convex surfaces.
(3) How does crowding affect tree growth and survival, and do its effects vary depending on rainfall? We expected that crowding would reduce growth and survival, and further predicted that the effect of crowding would be amplified during dry years, due to more intense competition for water between neighbors.
(4) How does interspecific variation in functional traits mediate the effects of rainfall, microtopography, and crowding on tree demographics? We expected that trees with traits representing more resource acquisitive strategies would have higher growth rates and lower rates of survival than trees with more conservative traits. Furthermore, we predicted that trees with acquisitive traits would be more sensitive to stressful conditions, i.e., drought, dry topographic position, and crowding.
Materials and Methods
To address our questions, we used hierarchical Bayesian models that allowed us to examine the importance of drought, topography, and crowding for tree performance. We focused on two topographic variables that are important for moisture conditions and flow of water across surfaces: slope and curvature (Burt and Butcher, 1985). We used this analytical approach to assess if and how functional traits drive inter-specific variation in response to environmental conditions. We considered two functional traits that are associated with carbon metabolism and plant hydraulics: specific leaf area (SLA) and wood density (WD). SLA represents the investment in photosynthetic machinery (leaf surface area) relative to total investment in leaf biomass. Leaves with high SLA tend to have higher photosynthetic rates and nutrient concentrations, and high SLA species typically have higher growth rates. However, high SLA leaves tend to be shorter-lived, potentially leading to shorter full-plant life spans (Reich et al., 1998; Santiago and Wright, 2007). Wood density represents the investment in wood biomass per volume of wood. Trees with higher WD are typically more shade tolerant (Valladares and Niinemets, 2008), and tend to have lower growth rates (Poorter et al., 2008). However, trees with denser wood are more resistant to cavitation (Hacke et al., 2001; Markesteijn et al., 2011) and structural damage (Everham and Brokaw, 1996; Curran et al., 2008), so species with higher wood density tend to have longer life spans, higher survival rates, and lower sensitivity to drought (Poorter et al., 2008; Phillips et al., 2010; Greenwood et al., 2017, but see Hoffmann et al., 2011).
Study Area, Tree Census, and Rainfall Data
This study was conducted with data from four forest plots, comprising the El Yunque Chronosequence Plots (Table 1). The land-use histories and ages of these forests were determined from aerial photographs taken between 1936 and 1977 (Lugo et al., 2004): three of the plots were previously cleared for agriculture and represent a range of forest ages from 35 to 76 years since agricultural activities ceased. The fourth plot was, to our knowledge, never cleared for agriculture, but has been subject to hurricane disturbance. The plots range in elevation from 100 to 500 m above sea level, and vary in size from ∼0.5 to 1 hectare (Table 1). The dominant soil type is Zarzal, a deep and well- drained oxisol (Mount and Lynn, 2004). All stems >1 cm diameter at breast height (dbh) have been mapped, and identified to species, and diameters and tree status (live/dead) have been recorded in September of every year since 2012. We used this data to calculate absolute diameter growth and survival for each individual tree for each census interval from 2013 to 2016.

Table 1. Field plot descriptions.
In 2015, Puerto Rico experienced a severe meteorological drought: rainfall in El Yunque was only 2,035 mm, the second lowest recorded since 1975 (Figure 1). Annual rainfall in the region averages 3,500 mm, and rainfall was close to average in 2014 and 2016 (3,193 and 3,506 mm, respectively). For the purposes of assessing drought effects, we used growth and survival data from the 2014 (2013–2014), 2015 (2014–2015), and 2016 (2015–2016) censuses in our analyses. We used daily rainfall data from the El Verde field station to calculate the total rainfall between census dates. Rainfall since the last census was used as a predictor in all models to assess the effect of drought on tree growth and survival.
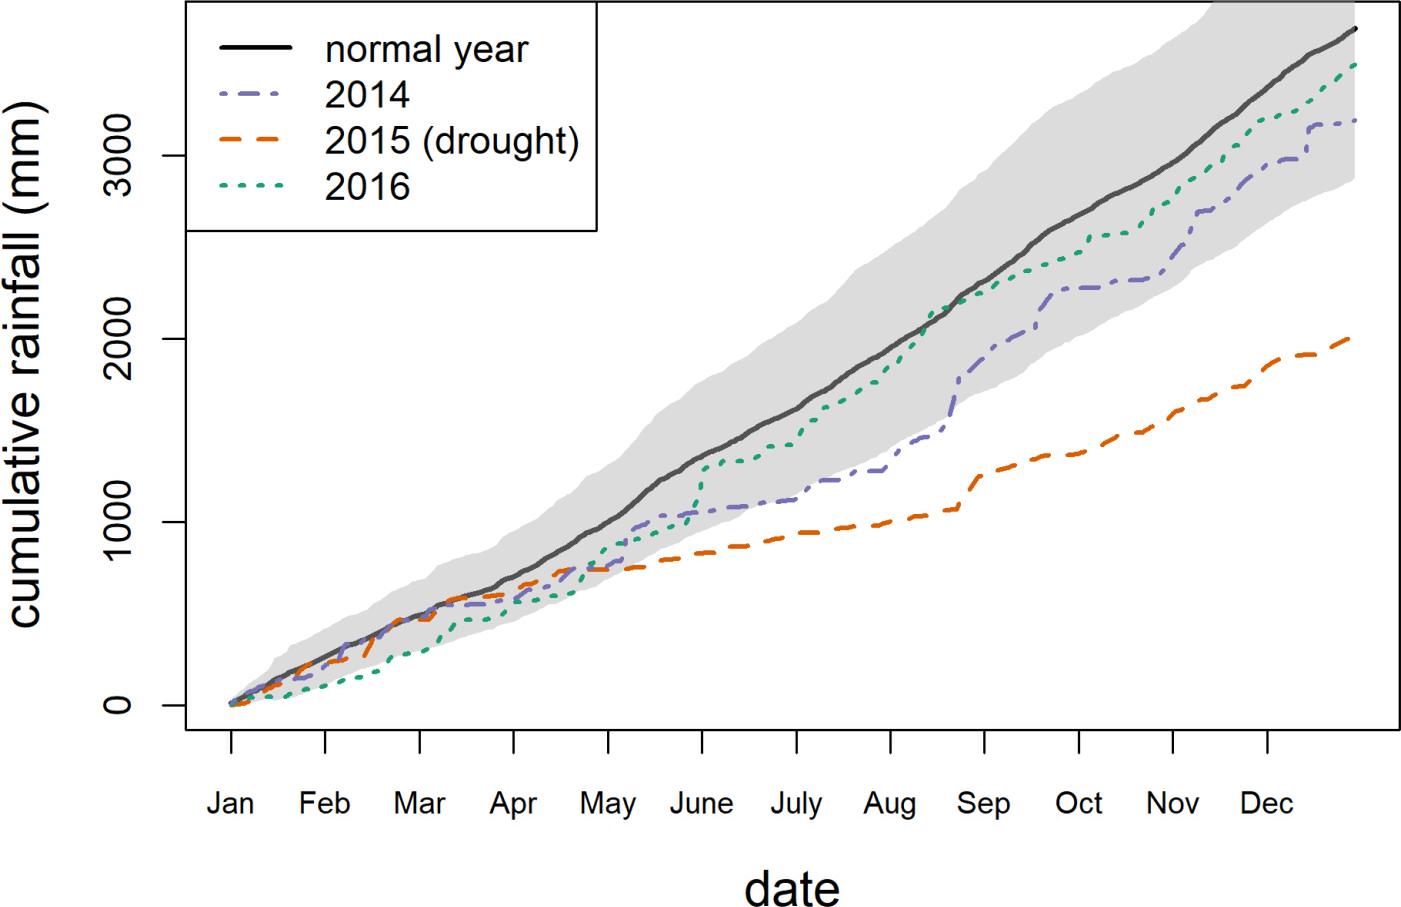
Figure 1. Cumulative rainfall in El Yunque National Forest. Solid black line indicates 1975–2014 average with the gray shaded area representing mean cumulative rainfall plus/minus one standard deviation.
Functional Trait Data
Wood density and SLA measurements were collected on 5–10 individuals per species using standard protocols (Cornelissen et al., 2003; Swenson et al., 2012), with stem wood density for shrubs estimated from branch material following the methods outlined in Swenson and Enquist (2008). For all analyses, we used the mean trait value for each species, though we acknowledge that intraspecific trait variation may influence performance along environmental gradients (Bolnick et al., 2011). The two traits were weakly correlated (Pearson’s r = −0.35, p = 0.01).
Topography Data
Topography data was derived from airborne LiDAR data, collected by the National Center for Airborne Laser Mapping in May 20111. We followed standard procedures to generate a digital elevation model (DEM) at 1 m2 resolution from LiDAR returns, using the minimum z-values of the last-return ground classified points to construct the DEM. Further details about the LiDAR data and DEM construction are in Wolf et al. (2016).
We used the 1 m LiDAR DEM to derive topographic slope and hilltop curvature, following methods in Hurst et al. (2012). Using a very fine-scale DEM to calculate topographic indices can result in local extreme values, and many studies coarsen the resolution of these DEMs to minimize the impact of these extremes (e.g., Jucker et al., 2018). Instead of coarsening the DEM’s resolution, the Hurst et al. (2012) method fits a surface model to each focal grid cell based on the surrounding grid cells across a moving window of a specified length. This smooths the surface, reducing local extremes but preserving the 1-m resolution of the DEM. Slope and curvature are then calculated from the fit coefficients of the model. We used a 99 × 99 m moving window to fit this regression, such that the surface is fitted for each 1 m2 grid cell of the DEM, but taking into account a 99 m neighborhood. This scale best fits soil moisture data collected at a nearby site (Supplementary Figure S1). Slope (m/m) and curvature (unitless) are calculated from the fitted coefficients following the methods in Hurst et al. (2012). Hilltop curvature was calculated such that positive curvature indicates valley-like microtopography and negative curvature indicates ridge-like microtopography. We used the georeferenced stem locations from the plot data to extract slope and curvature at the stem location for each tree. Slope and curvature in this dataset were not correlated (r = −0.004). Though the mean slope and curvature differ across plots, plots encompass large, overlapping ranges of values for slope and curvature (Supplementary Figure S2).
Modeling Approach
We fit hierarchical Bayesian models of annual diameter growth and survival as a function of rainfall, topography, and crowding, with a second level in the model describing the relationship between functional traits and the species-specific responses to these factors. Growth was normally distributed, as negative growth is common due to shrinkage and/or measurement error. Our model of the expected value of growth took the form:
where gtsi is absolute diameter growth of individual i of species s at time t. Covariates include a binary indicator for drought/non-drought year (droughtt = 0 in 2014 and 2016, droughtt = 1 in 2015), slope and curvature at the precise location of each stem (slopesi and curvaturesi), and NCItsi, the neighborhood crowding index, a measure of crowding. γ1iis an individual random effect for each stem. Stem diameter (DBHtsi) was included as a control, to account for well-known variation in growth and survival with tree size. To account for differences across plots, we included a random effect for plot (γ2p). Both random effects were drawn from a normal distribution with mean 0 and standard deviations σi and σp, respectively. Error (ε) was normally distributed. DBH, NCI, and slope were highly left-skewed and therefore log-transformed to facilitate analysis. DBH, NCI, slope, and curvature were not strongly correlated (all r < 0.16, Supplementary Table S2). We modeled the logit-transformed probability of survival (pa) with the same covariates and random effects as the growth model, as well as a predictor term for each stem’s previous year’s growth (gt–1,si). Survival observations were Bernoulli distributed with probability pa.
NCI is a dimensionless quantity calculated for each stem, taking into account the diameter and distance of all stems within a 10 m radius around the focal tree. Specifically, it is calculated as:
where stem i has j neighbors within 10 m and dij is the distance from stem i to its neighbor j. We used a 10 m radius as prior studies have indicated that this radius is sufficient to capture effects of crowding (Uriarte et al., 2004a). Excluding trees less than 10 m from the edge of the plot would have resulted in exclusion of a large number of individuals. For those edge trees, we scaled their NCI by the ratio of a full-size neighborhood (i.e., a 10 m radius circle) to the size of the edge tree’s partial neighborhood.
We incorporated functional traits into the second level of our models to assess how interspecific trait variation mediates the effects of drought, topography, and crowding on tree demography. If functional traits capture variation in plant strategies, then species-level responses to stressful or high-resources conditions should vary predictably with their trait values. We expected that functional traits might influence average growth and survival rates (β1s) along with species’ sensitivities to drought (β3s), crowding (β4s), topography (β5s, β6s), and their interactions (β8s, β9s, β10s). We did not model species-specific parameters for tree diameter (β2) or the interaction between drought and diameter (β7). For each covariate (k) we modeled the species-specific βks as a normally distributed process deriving from a linear function of that species’ traits:
σk is the variance in species’ responses to covariate k unexplained by functional traits. Because it was strongly left-skewed, we log-transformed SLA. We centered and scaled the traits so that bk represents the mean species response to covariate k, and bk1 and bk2 represent the departure from the mean with an increase of one standard deviation of log(SLA) and WD, respectively.
In the models of both growth and survival, we included data for all species with more than 20 individuals and with available trait data, which accounted for 49% of all species, and 94% of all basal area for a total of 46 species (Supplementary Table S1). All stems were included in calculations of neighborhood crowding. The tree species Syzygium jambos (Myrtaceae) was excluded from analyses, as it is an exotic species that in recent years has been experiencing extremely high mortality due to infection by the rust Austropuccinia psidii (Burman et al., 2017). In exploratory analyses it appeared to be a major outlier and had a disproportionate influence on the magnitude and direction of relationships between the predictors and response variables, so we removed it from analyses presented here. We fit all models including and excluding the palm species Prestoea montana, as this species is often an outlier (Muscarella et al., 2013). Exclusion of P. montana did not qualitatively change the results, and here we present results including the palm species. To facilitate convergence and remove outliers, we excluded growth and NCI observations greater than two standard deviations from the mean, due to these two variables having several extreme, unrealistic values in the dataset. This resulted in 24,218 growth observations and 25,125 survival observations across all years.
We standardized all predictors by subtracting the mean and dividing by the standard deviation to facilitate model convergence and ease interpretation (Gelman and Hill, 2006). We standardized DBH and NCI on a species-by-species basis, to avoid confounding their effects with species-specific differences in size and crowding. Other predictors were standardized across the whole dataset. We specified uninformative priors for all parameters, and estimated posterior distributions for all parameters using Markov chain Monte Carlo (MCMC) sampling implemented in JAGS (Plummer, 2003). We verified convergence visually and by ensuring the potential scale reduction statistic () was equal to 1 (Gelman and Rubin, 1992). Models generally converged after 30,000 iterations. We performed posterior predictive checks by simulating predicted growth and survival for all observations (Supplementary Figures S3, S4) and calculating the R2 and root mean squared error (rmse) between predicted and observed values. We considered β parameters to be statistically significant if their 95% credible interval did not overlap 0, and as marginally significant if their 90% credible interval did not overlap 0. All statistical analyses were conducted in R (R Core Team, 2016) with the packages rjags and R2jags (Plummer, 2016; Su and Yajima, 2018).
Results
Growth Model
Across the study period, the average annual growth was 0.06 cm. Average growth was lowest during the drought year and highest in the year following the drought (2014 mean = 0.06 cm, SD = 0.18 cm; 2015 mean = 0.04 cm, SD = 0.17 cm; 2016 mean = 0.09 cm, SD = 0.18 cm; Supplementary Figure S3). The model predicting tree growth captured observed variation in growth (R2 = 0.35, r.m.s.e. = 0.15 cm), though it over/under predicted low/high growth values (Supplementary Figure S4). Diameter was the strongest predictor of growth, with larger trees growing more (Figure 2A and Supplementary Table S3). After diameter, drought was the most important predictor of growth. The interaction between drought and diameter was significant, such that growth of larger trees was more negatively affected by drought.
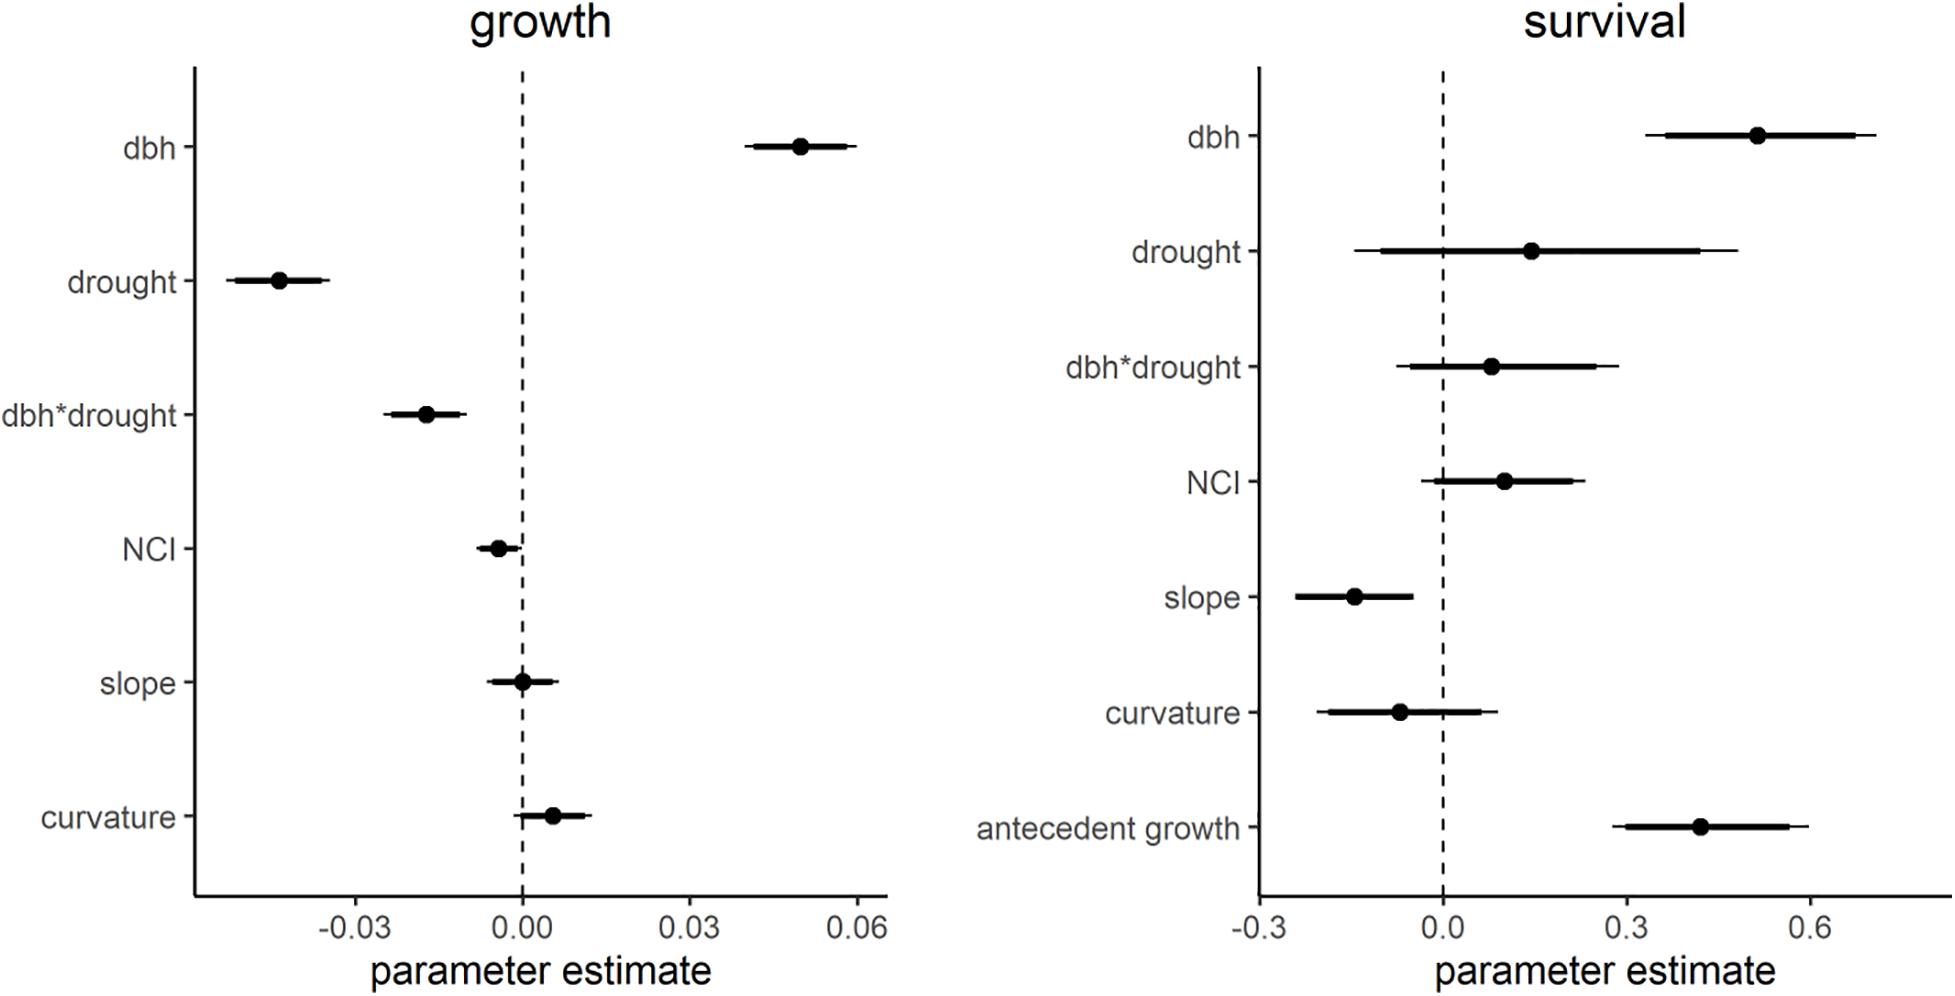
Figure 2. Average parameters from the growth and survival models. Points indicate mean parameter estimates. Thicker lines show 90% credible intervals with thin tails showing 95% credible interval. Parameter values are bk (Eq. 3) i.e., average species effects. Parameters with credible intervals that did not overlap 0 were considered to be significant.
Topography and crowding variables were also significant predictors of tree growth, though less important for drought response. More crowded individuals (trees with higher NCI) had reduced growth (Figures 2A, 3C). There was no significant relationship between slope and growth. Curvature had a marginally significant positive association with growth, showing that during normal, non-drought years, trees in local valleys grow more. Furthermore, there was a significant interaction between curvature and drought such that that trees located in areas with higher curvature (i.e., valley-like microsites) grew more slowly during drought (Figures 2A, 3B). There was no significant interaction between crowding and drought, or between slope and drought, indicating that the effects of crowding and slope on growth were similar in drought vs. non-drought years (Figures 2A, 3A,C). To summarize, though crowding and slope both affected growth, they were not important for drought response, and only curvature influenced drought response.
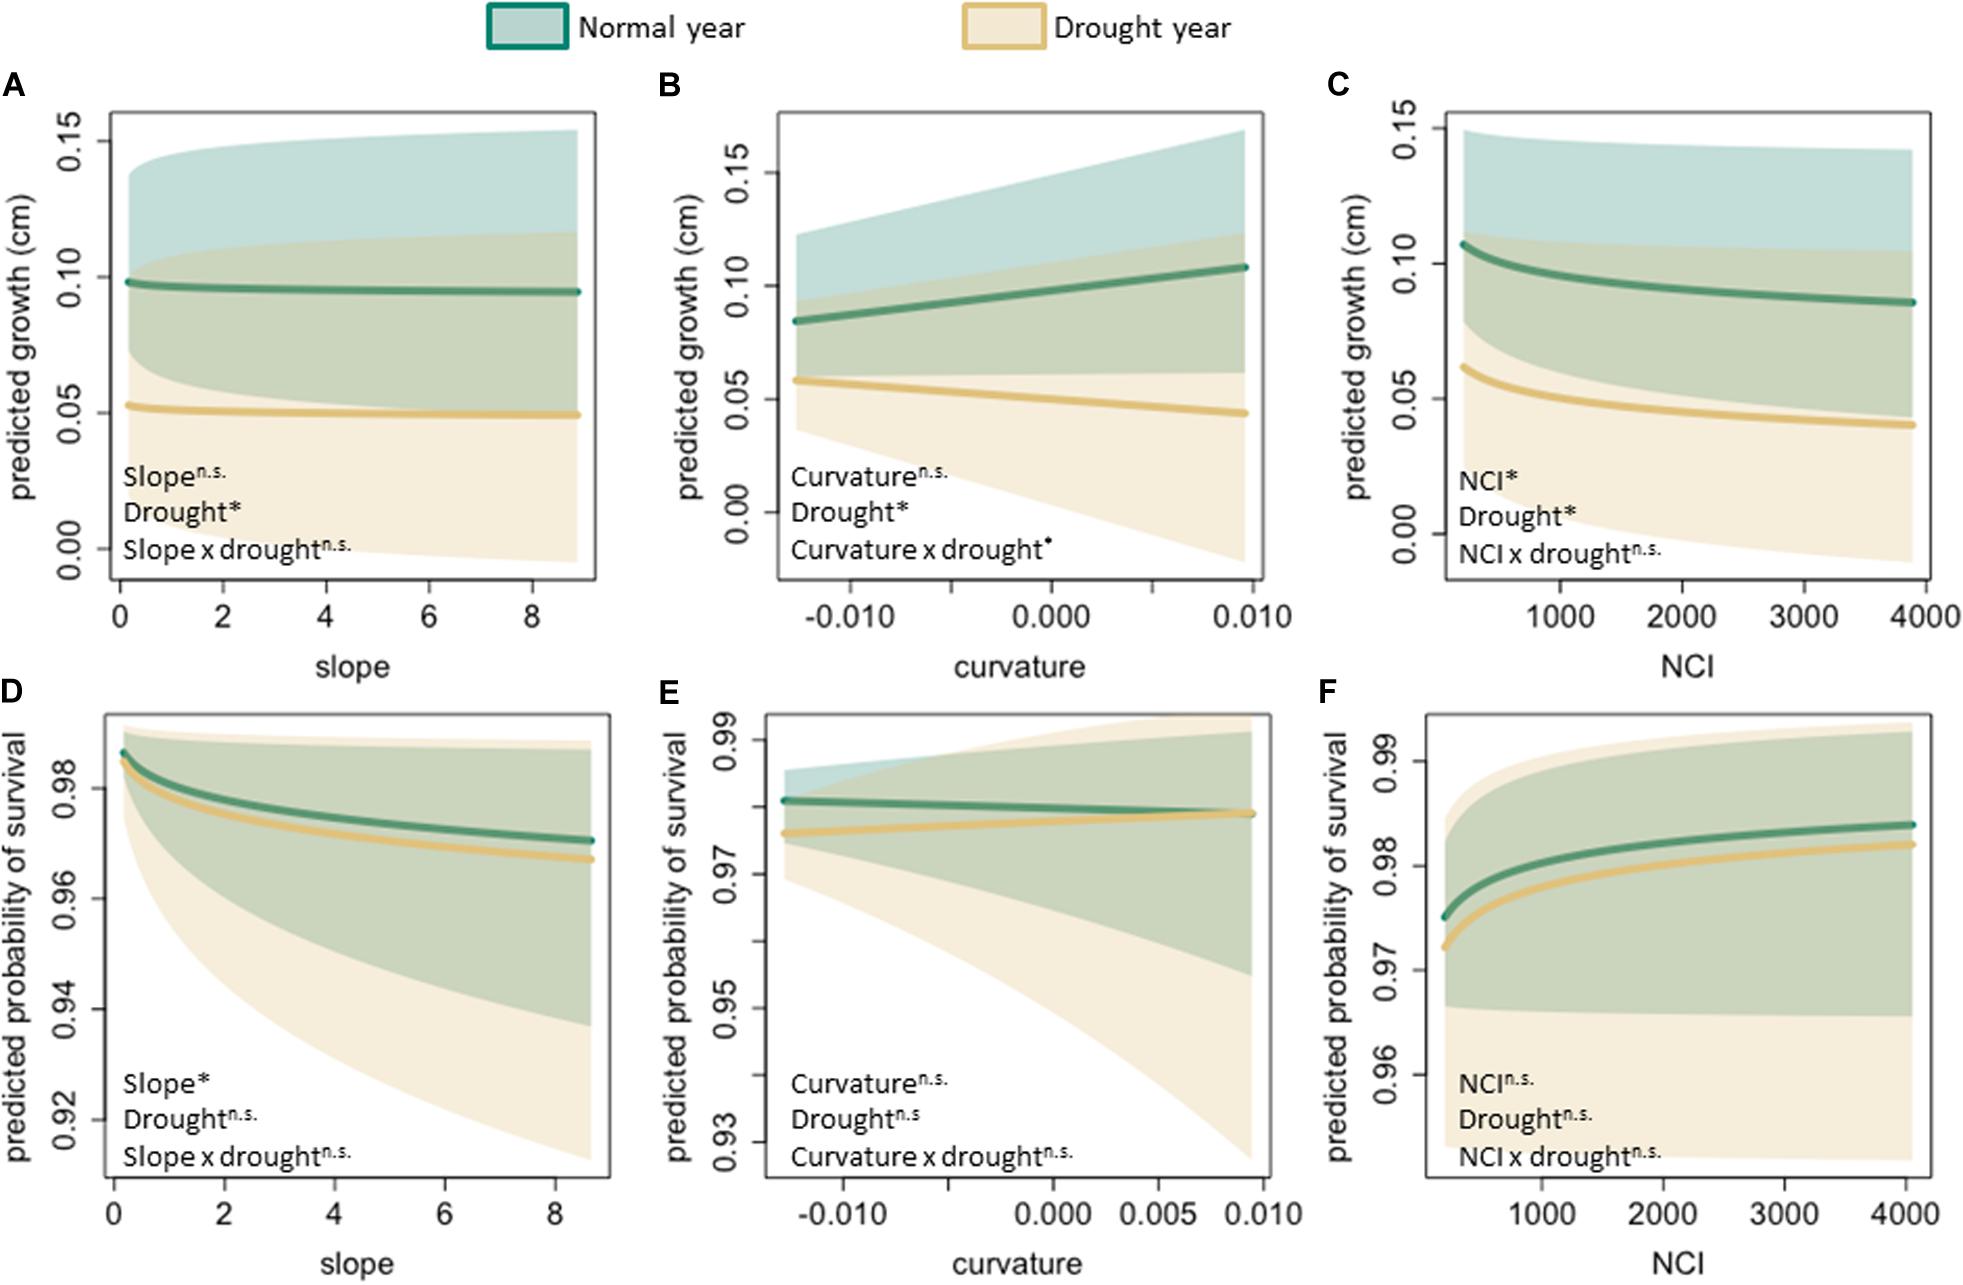
Figure 3. Predicted growth (A–C) and probability of survival (D–F) as a function of slope, curvature, and neighborhood crowding. Green lines and shaded areas show the fitted values for the relationship between each predictor and response variables (and their 95% credible intervals) at average rainfall during the non-drought years (i.e., 2014, 2016 average). Brown lines and shaded areas show relationships during the drought year. Text in the lower left corner indicates whether main effects and interactions were significant (∗P < 0.05), marginally significant (^p < 0.1), or not significant (n.s.).
Functional traits were correlated with species’ growth responses to drought and topography, though there were no significant trait associations with sensitivity of growth to crowding (Table 2). Trees with dense wood had significantly less negative growth responses to drought (Figure 4A). SLA was negatively associated with slope response, such that trees with low SLA experience a positive effect of slope on growth, whereas trees with high SLA experience a negative effect of slope (Figure 4B). SLA also had a negative association with the curvature-drought interaction term, such that growth of species with high SLA, when located in sites with valley-like microtopography, were more negatively affected by drought (Table 2 and Figure 5).
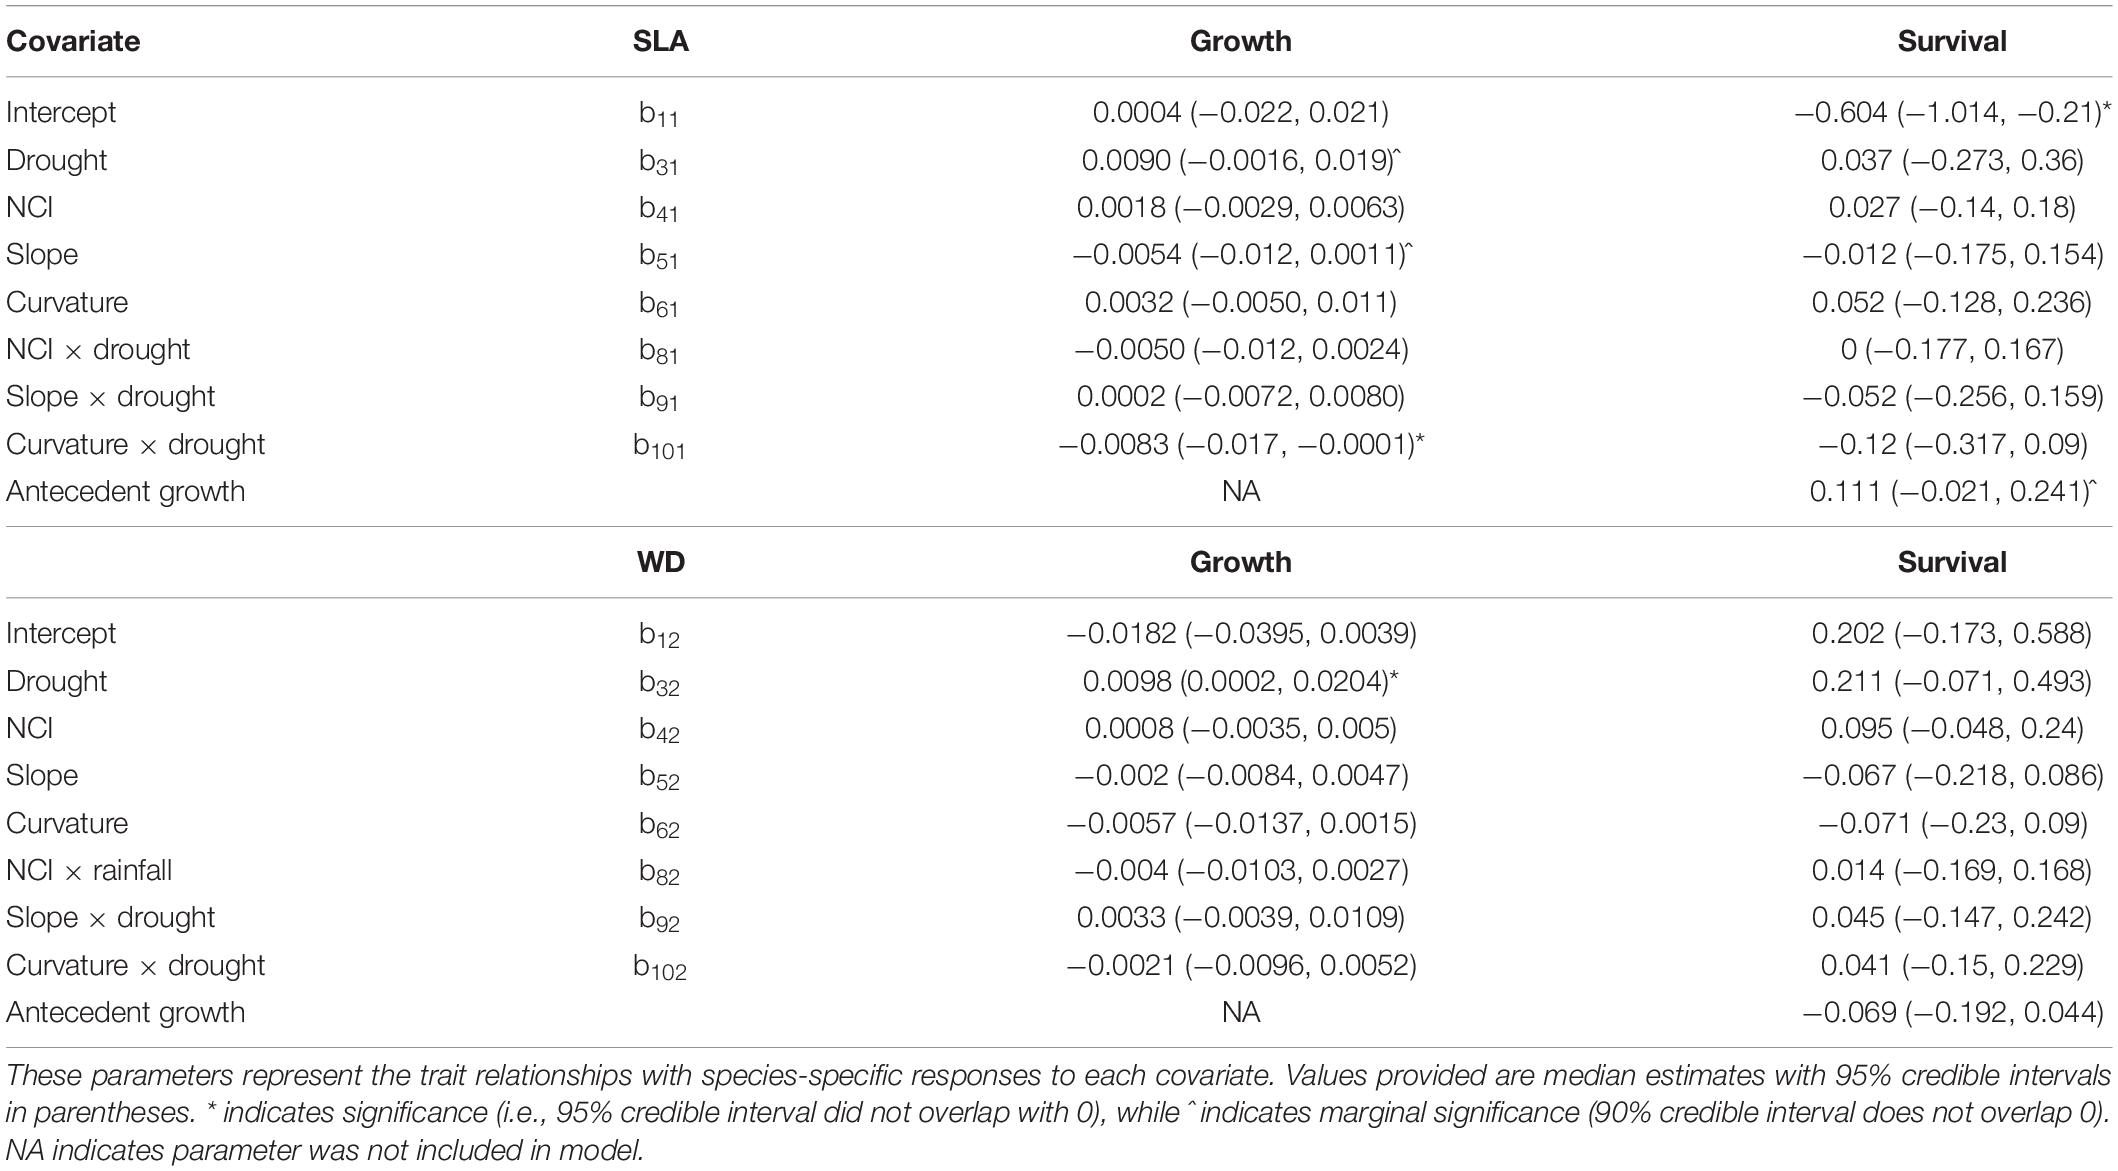
Table 2. Parameters from the second level of the growth and survival models.
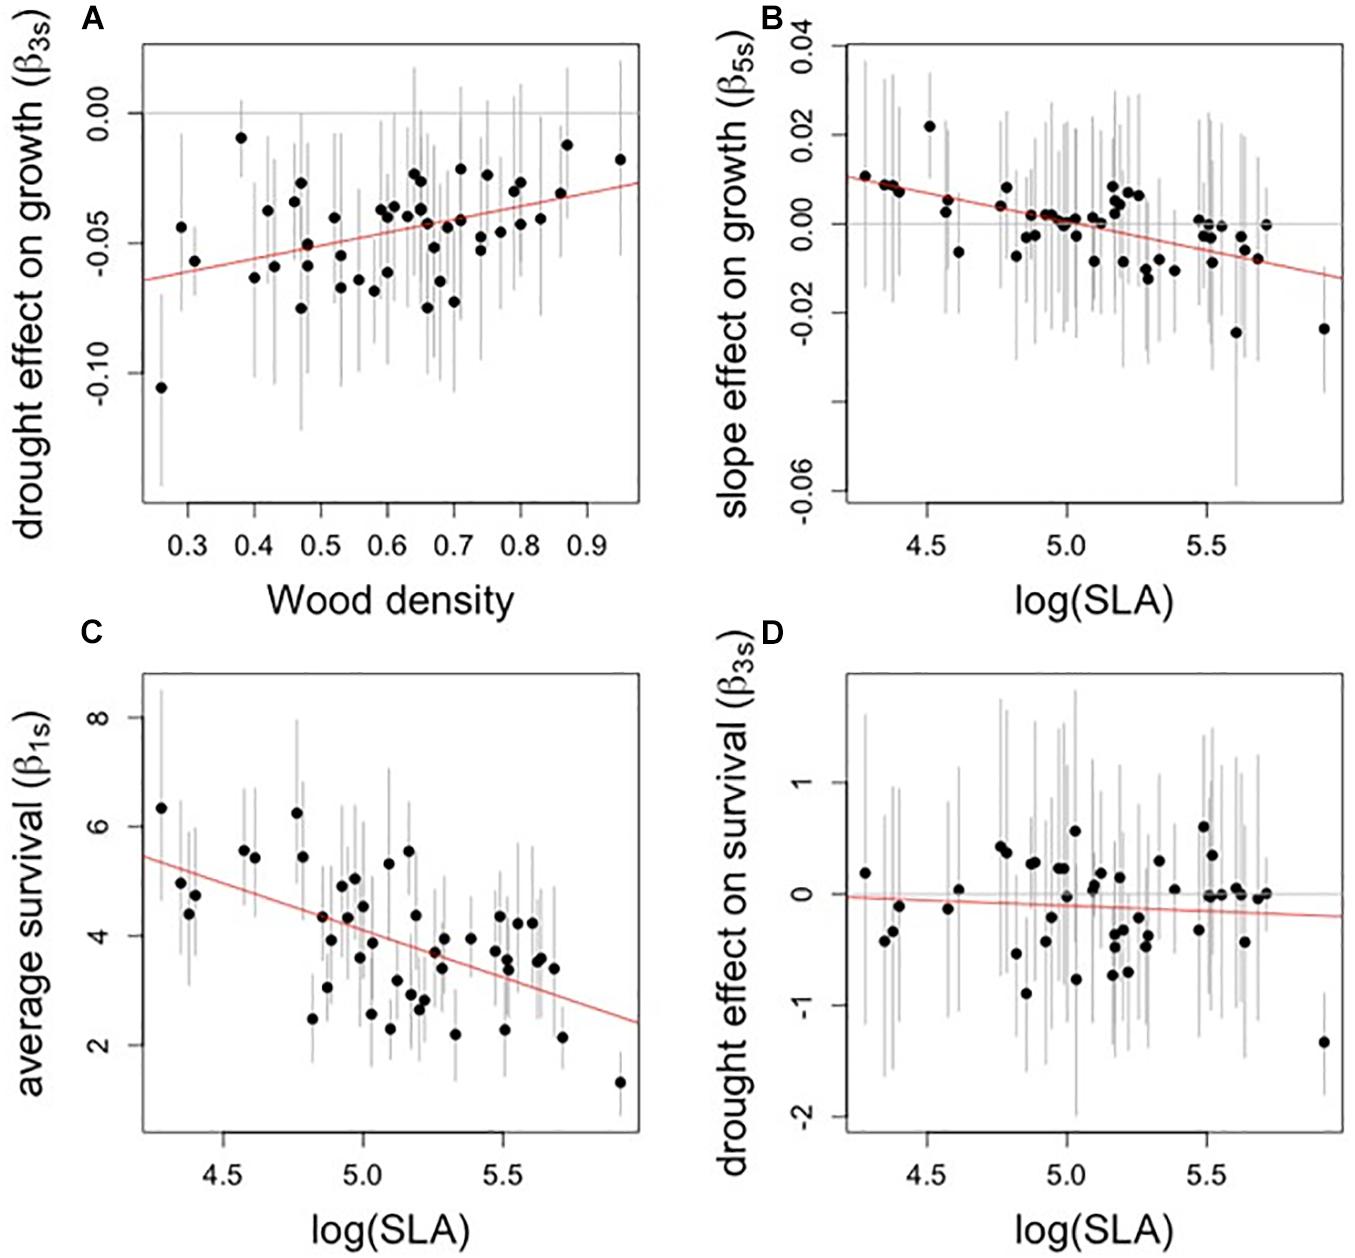
Figure 4. Relationships between traits (x-axis) and select species-specific estimates of model parameters (y-axis). Each point represents the median estimate of one species’ parameter, and bar represent credible intervals. All relationships shown were significantly different from zero except for panel (D). (A) Drought effect (growth model) vs. wood density. (B) Slope effect (growth model) vs. SLA. (C) Average survival (survival model) vs. SLA. (D) Drought effect (survival model) vs. SLA. Note that SLA is log-transformed.
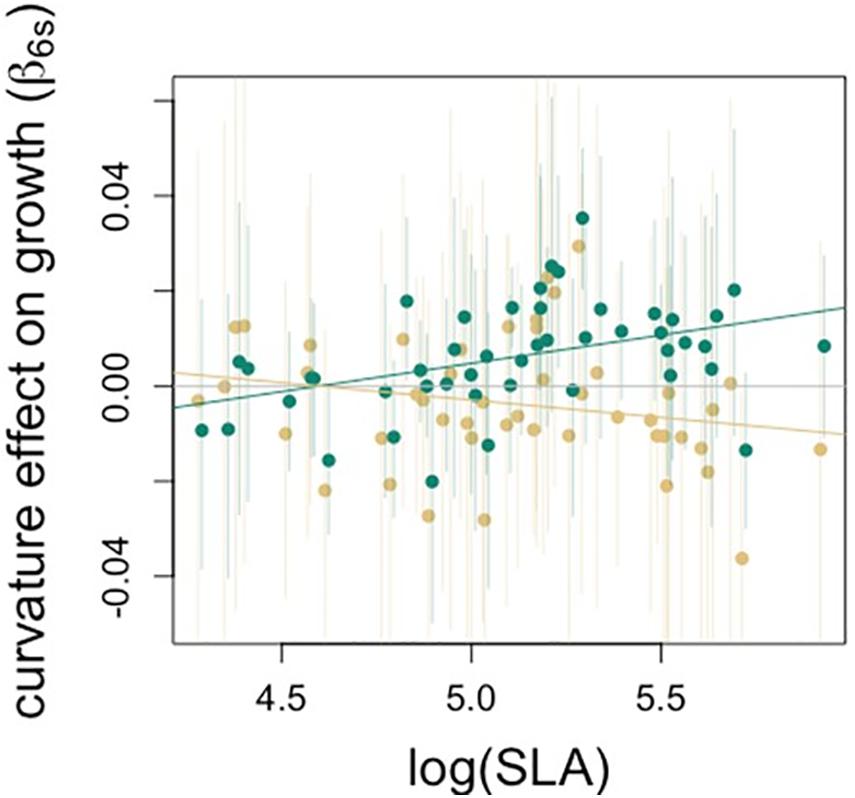
Figure 5. Relationship between SLA and species-specific estimates of curvature effect on growth. The effect of SLA on the curvature-drought interaction term means that the extent to which the effect of curvature differs in drought years depends on species’ SLA. Green points show curvature effect on performance for average rainfall conditions during the non-drought years (2013, 2014, 2016), beige shows effects during the drought year.
Survival Model
The mean survival rate across the whole dataset was 93.1%, with significant inter-annual variation (91.7% in 2014, SD = 0.28; 92.5% in 2015, SD = 0.26; 95.1% in 2016, SD = 0.22; p < 0.001). The model of survival captured some observed variation (R2 = 0.32, Supplementary Figure S5). Diameter and antecedent growth were the most important predictors of survival, with larger trees and trees that had experienced higher growth in the preceding year having a higher probability of survival. Drought did not affect survival, nor was there a significant interaction between drought and diameter (Figures 2B, 3). More crowded trees had a higher probability of survival, though this effect was not significant (Figures 2B, 3F). Survival was negatively associated with slope, meaning that trees on steeper slopes had a lower probability of survival (Figures 2B, 3D). Curvature did not have a significant effect on survival (Figures 2B, 3E). In the survival model none of the interaction terms were significant, indicating that the effects of antecedent growth, microtopography, and crowding on survival were similar, on average, across all 3 years of the study (Figures 3D–F).
There were two significant trait associations with first-level parameters in the survival model (Table 2 and Figures 4C,D). Trees with high SLA had lower average survival (i.e., the intercept term, β1s), and responded more positively to antecedent growth (Table 2). Wood density was not significantly associated with any parameters in the survival model, and we found no significant trait associations with the effects of drought, microtopography, crowding, or their interactions on survival.
Discussion
Drought can have large effects on tropical forests, but impacts of drought vary across species and space (Bonal et al., 2016). Spatial variability in drought impacts is often driven by differences in the local moisture conditions that individual trees experience, because of the way regional climate is filtered through topography, vegetation, and other environmental factors that vary on small scales (McLaughlin et al., 2017), and by species differences in physiology and drought response. The 2015 drought in Puerto Rico provided a unique opportunity to leverage repeat census data collected in a topographically complex tropical forest to examine the way that species differences and local filtering of climate affect drought response. Our results show that (1) some tropical forests may be resilient to a single year drought, as drought negatively affected growth but not survival, (2) microtopography and crowding influence tree performance, but their interactions with drought may not conform with predictions, and (3) functional traits can provide limited insight into the mechanisms by which drought, microtopography, and crowding affect growth and survival.
Drought Effects on Tree Performance
As expected, drought affected tree performance both directly and via interactions with microtopography. Though growth was lower in the drought year, drought did not affect survival directly or via interactions with microtopography or crowding. This lack of immediate drought-induced mortality is at odds with observations of high mortality during single-year droughts in some tropical forests (Phillips et al., 2009; Lewis et al., 2011; Doughty et al., 2015), but consistent with results from some experimental studies: in two drought experiments in the Amazon, 50–60% of rainfall was excluded, but mortality rates were low during the experiments’ first years and major die-offs were only observed after about 3 years of sustained drought (Nepstad et al., 2007; da Costa et al., 2010). In 2015, El Yunque rainfall was only 56% of the annual mean, but the drought lasted for less than 1 year (Mote et al., 2017), perhaps not long enough to cause a severe die-off. However, antecedent growth was a strong predictor of survival, and drought did have a strong effect on growth, implying that survival could be reduced after a lag. Lagged effects of drought on growth and mortality lasting for multiple years have been observed in many ecosystems (Anderegg et al., 2015) including tropical forests (Lingenfelder and Newbery, 2009; Phillips et al., 2010). In our study a lag effect was not observable immediately after the drought: survival was higher in the year following the drought. Still, lag effects can last multiple years, and more years of study could reveal further effects of drought.
Tropical tree growth seems to respond to drought on more rapid time scales than survival: in the same throughfall experiments described above, growth impacts were observed in the experiments’ first years (Brando et al., 2008; da Costa et al., 2010). Tree-ring and long-term monitoring studies have found strong correlations between diameter growth and rainfall in tropical trees (Brienen et al., 2010; Clark et al., 2010), and have found that growth of large trees is more severely affected by drought (Bennett et al., 2015). Accordingly, drought was the strongest predictor of growth in our model, and large trees suffered larger growth reductions during drought. Reductions in radial growth may be driven by overall declines in productivity, and/or shifts in allocation from stem growth to leaves, branches, roots, or non-structural carbohydrates (Malhi et al., 2015). Trees can use non-structural carbohydrates to maintain core metabolic functions when photosynthetic rates are reduced during drought, and shift allocation during and after drought (Metcalfe et al., 2010; Doughty et al., 2014). The drivers of tree allocation of carbon are poorly understood, though they are essential for understanding the mechanisms by which drought affects trees (Malhi et al., 2015).
Topography and Crowding Effects on Tree Performance
Effects of microtopography on tree performance were evident, but did not always conform to expectations. For example, we expected that tree growth and survival would both be lower on steeper slopes. We found that survival declined with increasing slope, but that slope had no effect on growth. Contrary to our expectation that drought would further amplify variation in performance with slope, we found that the effects of slope did not vary across drought and non-drought years. This result could be explained by several possible mechanisms. First, moisture differences across slopes may be consistent regardless of rainfall. However, studies have often found that the strength and direction of the relationship between moisture and topography differ depending on rainfall (Famiglietti et al., 1998; Tenenbaum et al., 2006; Tromp-van Meerveld and McDonnell, 2006).
Another possible explanation for why drought effects did not vary across slopes is that trees growing on steeper slopes could be more drought tolerant. Even if drought is more severe on steeper slopes, differences in tree performance might not be amplified if trees growing on steeper slopes are more drought tolerant. In such a case, despite experiencing more severe moisture deficits, species in dry topographic positions would not suffer more severe impacts on performance. Studies in other tropical forests have shown that local variation in water availability affects species distributions, with drought-tolerant species showing a stronger affinity for dry micro-sites (Ashton et al., 2006; Engelbrecht et al., 2007; Comita and Engelbrecht, 2009), though these studies did not link this species sorting to variation in demographic rates. Our results provide some evidence for species sorting across microtopography via weak, but significant correlations between functional traits and topographic indices (Supplementary Table S2), though most species span a wide range of microtopography (Supplementary Figure S6). Trees growing at drier topographic positions may also be better acclimated to dry conditions due to individual-level environmental plasticity, which could be reflected through intra-specific trait variation or variation in allocation to above vs. belowground structures (Nicotra et al., 2010).
Finally, topographic variation in soil depth, nutrient availability, or susceptibility to disturbance, and not in soil moisture, could drive differences in performance across slope. Soil nutrient availability is known to vary with microtopography and fine-scale variation in nutrient variability affects tree species distributions, diversity, and performance (Baraloto and Couteron, 2010; Homeier et al., 2010; Baldeck et al., 2013). If variation in nutrient availability were the key driver of differences in performance across slopes, we would not expect drought to influence variation in performance across microtopography. The elevated mortality rates on slopes may also reflect higher rates of wind disturbance, because trees on steeper slopes are more susceptible to windthrow from extreme winds (Everham and Brokaw, 1996). In general, adult trees’ deep and extensive roots might make them relatively insensitive to microtopographic differences in soil moisture, which would explain why there were not many significant interactions between drought and microtopography.
However, the relationship between curvature and growth suggests that moisture plays at least some role in driving differences in performance across microtopography. We found that growth increased with increasing curvature, indicating an advantage for trees in valleys (high curvature areas) during normal years. During drought years, however, we found curvature negatively affected growth (Figure 3), despite our assumption that trees growing in areas with more positive curvature (i.e., valleys) would experience less severe moisture deficits, and thus show less sensitivity to drought. This result could be driven by species sorting along microtopography or individual acclimation as discussed above: if trees growing in valleys are more frequently of drought-sensitive species or are less acclimated to dry conditions, they might show a strong response to drought despite experiencing less severe moisture stress. Further research on how environmental conditions, including soil moisture, soil depth, and soil nutrient status, and intraspecific trait values, vary with microtopography could help tease apart these competing explanations for the relationship between microtopography, drought, and performance.
We found that crowding reduced growth but increased survival (though this effect was only marginally significant). While many studies have shown that competitive effects from crowding have a negative impact on tree performance (Uriarte et al., 2012), others have found no effect on growth and/or survival (Lasky et al., 2014; Uriarte et al., 2016a) or even positive effects (Hurst et al., 2011). Furthermore, sensitivity to crowding varies across species (Uriarte et al., 2004a, b; Canham et al., 2009). Variation in the effects of crowding across studies and our finding that crowding increased survival could have to do with the difficulty of disentangling competitive impacts from the environmental drivers of crowding. Variation in number and size of stems within and across forest stands can be driven by variation in site favorability (Clark and Clark, 2000; Alves et al., 2010; Hernández-Stefanoni et al., 2011). If this is the case, our finding of somewhat enhanced survival in more crowded neighborhoods could reflect site quality. High mortality rates in gaps relative to more crowded, closed canopy areas could also drive the association between survival and crowding. Trees in gaps tend to experience higher rates of herbivory (Richards and Coley, 2007) and may be more subject to desiccation (Denslow, 1980). These hypotheses are also consistent with our finding that crowding effects were not amplified during drought years. However, we found very weak correlations between topographic variables and crowding (Supplementary Table S2). If crowding is associated with site favorability, then soil nutrients or canopy gaps, but not topography, underlie variation in site favorability and crowding effects.
Interactions Between Functional Traits, Drought, Topography, and Tree Performance
Plant functional traits reflect tradeoffs in life-history strategies, which are relevant to understanding responses to drought and other disturbances and influence how trees are spatially structured within and across communities (Wright et al., 2004; Reich, 2014). SLA and wood density have frequently been used as proxies for a conservative-acquisitive tradeoff, with high wood density and low SLA indicating slower, more conservative strategies, and low wood density and high SLA representing faster, acquisitive strategies (Chave et al., 2009; Poorter et al., 2010). Our results only partially reflect this tradeoff: wood density was negatively associated with average diameter growth but had no significant relationship with average survival, while SLA was negatively associated with average survival, but had no significant relationship with growth. Because both traits integrate multiple aspects of plant physiology and function, the strength and direction of their associations with growth and survival rates have differed across studies (Yang et al., 2018). For example, while some studies have found the expected growth-survival tradeoff with SLA (Lasky et al., 2015), others have found the opposite, or no relationship between traits and performance (e.g., Poorter et al., 2008). Our results suggest that in this forest, variation in SLA and wood density do encompass at least some of the variation in average performance across species, and can be useful for understanding tradeoffs between “slow” and “fast” strategies.
Differences in life-history strategies are also reflected in inter-specific variation in performance across topography. For example, reduced survival of high SLA species on slopes and enhanced growth at high curvature suggest that high SLA is associated with low stress tolerance, but fast growth in high-resource areas. Wood density was not related to variation in performance across topography for either topographic variable in either model. Many studies have linked variation in wood density to shade tolerance (Lawton, 1984; Poorter et al., 2010), and so it is possible that light, which is potentially decoupled from microtopography, is a stronger filter on wood density. Yet overall, the functional traits we considered explained little of the inter-specific variation in growth and survival responses to topography. This suggests a need for more mechanistic functional traits, or a need to consider multiple traits and their relationships as part of an integrated whole-plant strategy (Yang et al., 2018).
By incorporating these easy-to-measure functional traits, we can begin to identify mechanisms by which drought affects species differentially. For example, growth of trees with high wood density was less sensitive to drought. During normal conditions, trees with high wood density typically have slower growth due to lower transpiration rates and the higher carbon cost of building denser wood (Chave et al., 2009). However, these trees can also maintain hydraulic conductivity under drier conditions (Chave et al., 2009; Reich, 2014) and so may be able to maintain photosynthetic and growth rates closer to normal during drought. Trees with high SLA tend to have higher photosynthetic rates and accordingly, higher transpiration rates, which predisposes them to more severe water loss during drought (depending on stomatal regulation, Poorter et al., 2009), so we expected that species with high SLA would suffer more severe drought effects. However, we found no significant relationships between SLA and drought response in either model. Though many other studies, including a recent global meta-analysis (Greenwood et al., 2017) have found that wood density and SLA are associated with sensitivity to drought-induced mortality (Metcalfe et al., 2010; Phillips et al., 2010; Uriarte et al., 2016a), the strength and direction of these relationships have differed across studies (Hoffmann et al., 2011; O’Brien et al., 2017).
These discrepancies likely occur because associations between these traits and drought vulnerability are indirect, and driven by to their links with other physiological traits. For example, SLA is often correlated with hydraulic traits including turgor loss point and water potential at 50% loss of conductivity (P50; Mitchell et al., 2008; Xu et al., 2016; but not always; see Markesteijn et al., 2011). The relationships between WD and vessel, xylem, or other wood anatomy traits likely explain resistance to cavitation in trees with higher wood density, though these relationships are poorly understood (Phillips et al., 2010; O’Brien et al., 2017). However, linking these widely and easily measured traits to observed variation in tree species responses to drought and other environmental conditions is an important step toward building a general predictive framework for species’ responses to future environmental change. Measuring hydraulic traits such as stomatal conductance, stomatal response to leaf water potential, turgor loss point, water potential at 50% loss of conductivity, or stem water potential would provide more power for predicting species’ drought responses (Brodribb et al., 2003; Skelton et al., 2015; Powers et al., 2020). Though some of these measurements can be expensive and time consuming (O’Brien et al., 2017), new methods are making them easier (Maréchaux et al., 2015), providing a promising way forward to improving predictions of drought response. The modeling framework we demonstrate here, which incorporates functional traits, drought response, and environmental variability could easily be applied with hydraulic trait data, and could greatly improve our ability to predict drought responses.
This study provides insight into interactions between climate, topography, crowding, and traits that underlie individual- and species-level variation in drought response, but also highlights the complexity of predicting drought effects and some major research gaps that remain. For example, while drought influenced tree performance via effects on growth, we did not detect a direct effect of drought on survival. However, the strong effect of antecedent growth on survival suggests possible future lagged effects of drought, and the potential for repeated or prolonged droughts to have a major impact. Future studies could manipulate drought conditions (as in the throughfall exclusion experiments in the Amazon) to quantify lag effects and explore effects of repeated drought on tree performance in Caribbean forests. The functional traits we considered helped explain some of the variation in species’ responses to environmental conditions, including drought, but their explanatory power was limited, suggesting a role for hydraulic and other more explicitly physiologically based functional traits. Finally, how the effects of microtopography on individual tree performance within plots scale up and relate to the effects of coarse-scale topographic relief across forest stands and landscapes is not well understood, and is an important avenue for future research.
Data Availability Statement
The datasets presented in this study can be found in online repositories. The names of the repository/repositories and accession number(s) can be found below: https://luq.lter.network/data/luqmetadata190.
Author Contributions
NBS and MU conceived and designed the study, and wrote the first draft of the manuscript. XF analyzed the rainfall data. MU and JZ collected the forest census data. RM, MNU, and NGS collected the functional trait data. NBS performed the statistical analysis. All authors contributed to the manuscript revision, read, and approved the manuscript.
Funding
This work was supported by the US National Science Foundation (NSF) awards DEB-1050957 to MU and DEB-1546686 to the Institute for Tropical Ecosystem Studies, University of Puerto Rico, working with the International Institute of Tropical Forestry (USDA Forest Service), for the Luquillo Long-Term Ecological Research Program. The trait data were collected by NGS funded by a research grant from ForestGeo—Smithsonian Tropical Research Institute.
Conflict of Interest
The authors declare that the research was conducted in the absence of any commercial or financial relationships that could be construed as a potential conflict of interest.
The reviewer TB declared a past co-authorship with one of the authors JZ to the handling editor.
Acknowledgments
We thank the census crews who collected the data and reviewers for their help improving this paper.
Supplementary Material
The Supplementary Material for this article can be found online at: https://www.frontiersin.org/articles/10.3389/ffgc.2020.596256/full#supplementary-material
Footnotes
References
Alves, L. F., Vieira, S. A., Scaranello, M. A., Camargo, P. B., Santos, F. A. M., Joly, C. A., et al. (2010). Forest structure and live aboveground biomass variation along an elevational gradient of tropical Atlantic moist forest (Brazil). For. Ecol. Manag. 260, 679–691. doi: 10.1016/j.foreco.2010.05.023
Anderegg, W. R. L., Schwalm, C., Biondi, F., Camarero, J. J., Koch, G., Litvak, M., et al. (2015). Pervasive drought legacies in forest ecosystems and their implications for carbon cycle models. Science 349, 528–532. doi: 10.1126/science.aab1833
Ashton, M. S., Singhakumara, B. M. P., and Gamage, H. K. (2006). Interaction between light and drought affect performance of Asian tropical tree species that have differing topographic affinities. For. Ecol. Manag. 221, 42–51. doi: 10.1016/j.foreco.2005.09.017
Baldeck, C. A., Harms, K. E., Yavitt, J. B., John, R., Turner, B. L., Valencia, R., et al. (2013). Soil resources and topography shape local tree community structure in tropical forests. Proc. Royal Soc. B Biol. Sci. 280:20122532. doi: 10.1098/rspb.2012.2532
Baraloto, C., and Couteron, P. (2010). Fine-scale microhabitat heterogeneity in a French Guianan forest. Biotropica 42, 420–428. doi: 10.1111/j.1744-7429.2009.00620.x
Bartlett, M. K., Zhang, Y., Yang, J., Kreidler, N., Sun, S. W., Lin, L., et al. (2016). Drought tolerance as a driver of tropical forest assembly: resolving Spatial signatures for multiple processes. Ecology 97, 503–514. doi: 10.1890/15-0468.1
Bennett, A. C., McDowell, N. G., Allen, C. D., and Anderson-Teixeira, K. J. (2015). Larger trees suffer most during drought in forests worldwide. Nat. Plants 1:15139.
Bolnick, D. I., Amarasekare, P., Araújo, M. S., Bürger, R., Levine, J. M., Novak, M., et al. (2011). Why intraspecific trait variation matters in community ecology. Trends Ecol. Evol. 26, 183–192. doi: 10.1016/j.tree.2011.01.009
Bonal, D., Burban, B., Stahl, C., Wagner, F., and Hérault, B. (2016). The response of tropical rainforests to drought - lessons from recent research and future prospects. Ann. For. Sci. 73, 27–44. doi: 10.1007/s13595-015-0522-5
Brando, P. M., Nepstad, D. C., Davidson, E. A., Trumbore, S. E., Ray, D., and Camargo, P. (2008). Drought effects on litterfall, wood production and belowground carbon cycling in an Amazon forest: results of a throughfall reduction experiment. Philos. Trans. Royal Soc. B Biol. Sci. 363, 1839–1848. doi: 10.1098/rstb.2007.0031
Brienen, R. J. W., Lebrija-Trejos, E., Zuidema, P. A., and Martínez-Ramos, M. (2010). Climate-growth analysis for a Mexican dry forest tree shows strong impact of sea surface temperatures and predicts future growth declines. Glob. Change Biol. 16, 2001–2012. doi: 10.1111/j.1365-2486.2009.02059.x
Brodribb, T. J., Holbrook, N. M., Edwards, E. J., and Gutierrez, M. V. (2003). Relations between stomatal closure, leaf turgor and xylem vulnerability in eight tropical dry forest trees. Plant Cell Environt. 26, 443–450. doi: 10.1046/j.1365-3040.2003.00975.x
Buchanan, B. P., Fleming, M., Schneider, R. L., Richards, B. K., Archibald, J., Qiu, Z., et al. (2014). Evaluating topographic wetness indices across central New York agricultural landscapes. Hydrol. Earth Syst. Sci. 18, 3279–3299. doi: 10.5194/hess-18-3279-2014
Burman, E., Ackerman, J. D., and Tremblay, R. L. (2017). Invasive Syzygium jambos trees in Puerto Rico: no refuge from guava rust. J. Trop. Ecol. 33, 205–212. doi: 10.1017/s026646741700013x
Burt, T. P., and Butcher, D. P. (1985). Topographic controls of soil-moisture distributions. J. Soil Sci. 36, 469–486. doi: 10.1111/j.1365-2389.1985.tb00351.x
Canham, C. D., Papaik, M. J., Uriarte, M., Mcwilliams, W. H., Jenkins, J. C., and Twery, M. J. (2009). Neighborhood analyse of canopy tree competition along environmental gradients in New England forests. Ecol. Appl. 16, 540–554. doi: 10.1890/1051-0761(2006)016[0540:naoctc]2.0.co;2
Chadwick, R., Good, P., Martin, G., and Rowell, D. P. (2015). Large rainfall changes consistently projected over substantial areas of tropical land. Nat. Clim. Change 6, 177–182. doi: 10.1038/nclimate2805
Chave, J., Coomes, D., Jansen, S., Lewis, S. L., Swenson, N. G., and Zanne, A. E. (2009). Towards a worldwide wood economics spectrum. Ecol. Lett. 12, 351–366. doi: 10.1111/j.1461-0248.2009.01285.x
Chazdon, R. L., Brenes, A. R., and Alvarado, B. V. (2005). Effects of climate and stand age on annual tree dynamics in tropical second-growth rain forests. Ecology 86, 1808–1815. doi: 10.1890/04-0572
Clark, D., and Clark, D. (2000). Landscape-scale variation in forest structure and biomass in a tropical rain forest. For. Ecol. Manag. 137, 185–198. doi: 10.1016/s0378-1127(99)00327-8
Clark, D. B., Clark, D. A., and Oberbauer, S. F. (2010). Annual wood production in a tropical rain forest in NE Costa Rica linked to climatic variation but not to increasing CO2. Glob. Change Biol. 16, 747–759. doi: 10.1111/j.1365-2486.2009.02004.x
Comita, L. S., and Engelbrecht, B. M. J. (2009). Seasonal and spatial variation in water availability drive habitat associations in a tropical forest. Ecology 90, 2755–2765. doi: 10.1890/08-1482.1
Condit, R., Hubbell, S. P., and Foster, R. B. (1995). Mortality rates of 205 neotropical tree and shrub species and the impact of a severe drought. Ecol. Monogr. 65, 419–439. doi: 10.2307/2963497
Cornelissen, J. H. C., Lavorel, S., Garnier, E., Díaz, S., Buchmann, N., Gurvich, D. E., et al. (2003). A handbook of protocols for standardised and easy measurement of plant functional traits worldwide. Austr. J. Bot. 51, 335–380. doi: 10.1071/bt02124
Curran, T. J., Gersbach, L. N., Edwards, W., and Krockenberger, A. K. (2008). Wood density predicts plant damage and vegetative recovery rates caused by cyclone disturbance in tropical rainforest tree species of North Queensland, Australia. Austr. Ecol. 33, 442–450. doi: 10.1111/j.1442-9993.2008.01899.x
da Costa, A. C. L., Galbraith, D., Almeida, S., Portela, B. T. T., da Costa, M., de Athaydes Silva Junior, J., et al. (2010). Effect of 7 yr of experimental drought on vegetation dynamics and biomass storage of an eastern Amazonian rainforest. New Phytol. 187, 579–591. doi: 10.1111/j.1469-8137.2010.03309.x
Daws, M. I., Mullins, C. E., Burslem, D. F. R. P., Paton, S. R., and Dalling, J. W. (2002). Topographic position affects the water regime in a semideciduous tropical forest in Panam’a. Plant Soil 238, 79–90.
Denslow, J. S. (1980). Gap partitioning among tropical rainforest trees. Biotropica 12, 47–55. doi: 10.2307/2388156
Dobrowski, S. Z. (2011). A climatic basis for microrefugia: the influence of terrain on climate. Glob. Change Biol. 17, 1022–1035. doi: 10.1111/j.1365-2486.2010.02263.x
Doughty, C. E., Malhi, Y., Araujo-Murakami, A., Metcalfe, D. B., Silva-Espejo, J. E., Arroyo, L., et al. (2014). Allocation trade-offs dominate the response of tropical forest growth to seasonal and interannual drought. Ecology 95, 2192–2201. doi: 10.1890/13-1507.1
Doughty, C. E., Metcalfe, D. B., Girardin, C. A. J., Amézquita, F. F., Cabrera, D. G., Huasco, W. H., et al. (2015). Drought impact on forest carbon dynamics and fluxes in Amazonia. Nature 519, 78–82. doi: 10.1038/nature14213
Duffy, P. B., Brando, P., Asner, G. P., and Field, C. B. (2015). Projections of future meteorological drought and wet periods in the Amazon. Proc. Natl. Acad. Sci. U.S.A. 112, 13172–13177. doi: 10.1073/pnas.1421010112
Engelbrecht, B. M. J., Comita, L. S., Condit, R., Kursar, T., Tyree, M. T., Turner, B. L., et al. (2007). Drought sensitivity shapes species distribution patterns in tropical forests. Nature 447, 80–82. doi: 10.1038/nature05747
Everham, E. M., and Brokaw, N. V. L. (1996). Forest damage and recovery from catastrophic wind. Bot. Rev. 62, 113–185. doi: 10.1007/bf02857920
Famiglietti, J. S., Rudnicki, J. W., and Rodell, M. (1998). Variability in surface moisture content along a hillslope transect: rattlesnake Hill, Texas. J. Hydrol. 210, 259–281. doi: 10.1016/s0022-1694(98)00187-5
Fekedulegn, D., Hicks, R. R., and Colbert, J. J. (2003). Influence of topographic aspect, precipitation and drought on radial growth of four major tree species in an Appalachian watershed. For. Ecol. Manag. 177, 409–425. doi: 10.1016/s0378-1127(02)00446-2
Gatti, L. V., Gloor, M., Miller, J. B., Doughty, C. E., Malhi, Y., Domingues, L. G., et al. (2014). Drought sensitivity of Amazonian carbon balance revealed by atmospheric measurements. Nature 506, 76–80. doi: 10.1038/nature12957
Gelman, A., and Hill, J. (2006). Data Analysis Using Regression and Multilevel/Hierarchical Models. Cambridge: Cambridge University Press.
Gelman, A., and Rubin, D. B. (1992). Inference from iterative simulation using multiple sequences. Statist. Sci. 7, 457–472. doi: 10.1214/ss/1177011136
Gleason, K. E., Bradford, J. B., Bottero, A., D’Amato, A. W., Fraver, S., Palik, B. J., et al. (2017). Competition amplifies drought stress in forests across broad climatic and compositional gradients. Ecosphere 8:e01849. doi: 10.1002/ecs2.1849
Greenwood, S., Ruiz-Benito, P., Martínez-Vilalta, J., Lloret, F., Kitzberger, T., Allen, C. D., et al. (2017). Tree mortality across biomes is promoted by drought intensity, lower wood density and higher specific leaf area. Ecol. Lett. 20, 539–553. doi: 10.1111/ele.12748
Guarín, A., and Taylor, A. H. (2005). Drought triggered tree mortality in mixed conifer forests in Yosemite National Park, California, USA. For. Ecol. Manag. 218, 229–244. doi: 10.1016/j.foreco.2005.07.014
Hacke, U. G., Sperry, J. S., Pockman, W. T., Davis, S. D., and McCulloh, K. A. (2001). Trends in wood density and structure are linked to prevention of xylem implosion by negative pressure. Oecologia 126, 457–461. doi: 10.1007/s004420100628
Hernández-Stefanoni, J. L., Dupuy, J. M., Tun-Dzul, F., and May-Pat, F. (2011). Influence of landscape structure and stand age on species density and biomass of a tropical dry forest across spatial scales. Landsc. Ecol. 26, 355–370. doi: 10.1007/s10980-010-9561-3
Hoffmann, W. A., Marchin, R. M., Abit, P., and Lau, O. L. (2011). Hydraulic failure and tree dieback are associated with high wood density in a temperate forest under extreme drought. Glob. Change Biol. 17, 2731–2742. doi: 10.1111/j.1365-2486.2011.02401.x
Homeier, J., Breckle, S. W., Günter, S., Rollenbeck, R. T., and Leuschner, C. (2010). Tree diversity, forest structure and productivity along altitudinal and topographical gradients in a species-rich Ecuadorian montane rain forest. Biotropica 42, 140–148. doi: 10.1111/j.1744-7429.2009.00547.x
Hurst, J. M., Allen, R. B., Coomes, D. A., and Duncan, R. P. (2011). Size-specific tree mortality varies with neighbourhood crowding and disturbance in a montane Nothofagus forest. PLoS One 6:e0026670. doi: 10.1371/journal.pone.0026670.g003
Hurst, M. D., Mudd, S. M., Walcott, R., Attal, M., and Yoo, K. (2012). Using hilltop curvature to derive the spatial distribution of erosion rates. J. Geophys. Res. 117:F02017.
Jucker, T., Bongalov, B., Burslem, D. F. R. P., Nilus, R., Dalponte, M., Lewis, S. L., et al. (2018). Topography shapes the structure, composition and function of tropical forest landscapes. Ecol. Lett. 21, 989–1000. doi: 10.1111/ele.12964
Lasky, J. R., Bachelot, B., Muscarella, R., Schwartz, N., Forero-Montaña, J., Nytch, C. J., et al. (2015). Ontogenetic shifts in trait-mediated mechanisms of plant community assembly. Ecology 96, 2157–2169. doi: 10.1890/14-1809.1
Lasky, J. R., Uriarte, M., Boukili, V. K., Erickson, D. L., John Kress, W., and Chazdon, R. L. (2014). The relationship between tree biodiversity and biomass dynamics changes with tropical forest succession. Ecol. Lett. 17, 1158–1167. doi: 10.1111/ele.12322
Lawton, R. O. (1984). Ecological constraints on wood density in a tropical montane rain forest. Am. J. Bot. 71, 261–267. doi: 10.1002/j.1537-2197.1984.tb12512.x
Lewis, S. L., Brando, P. M., Phillips, O. L., van der Heijden, G. M. F., and Nepstad, D. (2011). The 2010 Amazon Drought. Science 331, 554–554.
Lingenfelder, M., and Newbery, D. M. (2009). On the detection of dynamic responses in a drought-perturbed tropical rainforest in Borneo. Plant Ecol. 201, 267–290. doi: 10.1007/978-90-481-2795-5_21
Lugo, A. E., Lopez, T., del M., Ramos González, O. M., and Velez, L. L. (2004). Urbanización De Los Terrenos en La Periferia De El Yunque. USDA Forest Service Report WO 66:29 pp.
Malhi, Y., Doughty, C. E., Goldsmith, G. R., Metcalfe, D. B., Girardin, C. A. J., Marthews, T. R., et al. (2015). The linkages between photosynthesis, productivity, growth and biomass in lowland Amazonian forests. Glob. Change Biol. 21, 2283–2295. doi: 10.1111/gcb.12859
Maréchaux, I., Bartlett, M. K., Sack, L., Baraloto, C., Engel, J., Joetzjer, E., et al. (2015). Drought tolerance as predicted by leaf water potential at turgor loss point varies strongly across species within an Amazonian forest. Funct. Ecol. 29, 1268–1277. doi: 10.1111/1365-2435.12452
Markesteijn, L., Poorter, L., Bongers, F., Paz, H., and Sack, L. (2011). Hydraulics and life history of tropical dry forest tree species: coordination of species’ drought and shade tolerance. New Phytol. 191, 480–495. doi: 10.1111/j.1469-8137.2011.03708.x
McLaughlin, B. C., Ackerly, D. D., Klos, P. Z., Natali, J., Dawson, T. E., and Thompson, S. E. (2017). Hydrologic refugia, plants, and climate change. Glob. Change Biol. 23, 2941-2961.
Metcalfe, D. B., Meir, P., Aragão, L. E. O. C., Lobo-do-Vale, R., Galbraith, D., Fisher, R. A., et al. (2010). Shifts in plant respiration and carbon use efficiency at a large-scale drought experiment in the eastern Amazon. New Phytol. 187, 608–621. doi: 10.1111/j.1469-8137.2010.03319.x
Mitchell, P. J., Veneklaas, E. J., Lambers, H., and Burgess, S. S. O. (2008). Leaf water relations during summer water deficit: differential responses in turgor maintenance and variation in leaf structure among different plant communities in south-western Australia. Plant Cell Environ. 31, 1791–1802. doi: 10.1111/j.1365-3040.2008.01882.x
Mote, T. L., Ramseyer, C. A., and Miller, P. W. (2017). The Saharan air layer as an early rainfall season suppressant in the eastern Caribbean: the 2015 Puerto Rico drought. J. Geophys. Res. Atmos. 122, 10966–10982. doi: 10.1002/2017JD026911
Mount, H. R., and Lynn, W. C. (2004). Soil Survey Laboratory Data and Soil Descriptions for Puerto Rico and the U.S. Soil Survey Investigations Report No. 49. Virgin: United States Department of Agriculture, Natural Resources Conservation Service, National Soil Survey Center.
Muscarella, R., Uriarte, M., Forero-Montaña, J., Comita, L. S., Swenson, N. G., Thompson, J., et al. (2013). Life-history trade-offs during the seed-to-seedling transition in a subtropical wet forest community. J. Ecol. 101, 171–182. doi: 10.1111/1365-2745.12027
Nakagawa, M., Tanaka, K., Nakashizuka, T., Ohkubo, T., Kato, T., Maeda, T., et al. (2000). Impact of severe drought associated with the 1997–1998 El Niño in a tropical forest in Sarawak. J. Trop. Ecol. 16, 355–367.
Nepstad, D. C., Tohver, I. M., David, R., Moutinho, P., and Cardinot, G. (2007). Mortality of large trees and lianas following experimental drought in an amazon forest. Ecology 88, 2259–2269. doi: 10.1890/06-1046.1
Nicotra, A. B., Atkin, O. K., Bonser, S. P., Davidson, A. M., Finnegan, E. J., Mathesius, U., et al. (2010). Plant phenotypic plasticity in a changing climate. Trends Plant Sci. 15, 684–692. doi: 10.1016/j.tplants.2010.09.008
Nishimua, T. B., Suzuki, E., Kohyama, T., and Tsuyuzaki, S. (2007). Mortality and growth of trees in peat-swamp and heath forests in Central Kalimantan after severe drought. Plant Ecol. 188, 165–177. doi: 10.1007/s11258-006-9154-z
O’Brien, M. J., Engelbrecht, B. M. J., Joswig, J., Pereyra, G., Schuldt, B., Jansen, S., et al. (2017). A synthesis of tree functional traits related to drought-induced mortality in forests across climatic zones. J. Appl. Ecol. 54, 1669–1686. doi: 10.1111/1365-2664.12874
Pan, Y., Birdsey, R. A., Fang, J., Houghton, R., Kauppi, P. E., Kurz, W. A., et al. (2011). A large and persistent carbon sink in the world’s forests. Science 333, 988–993.
Phillips, O. L., Aragao, L. E. O. C., Lewis, S. L., Fisher, J. B., Lloyd, J., Lopez-Gonzalez, G., et al. (2009). Drought sensitivity of the amazon rainforest. Science 323, 1344–1347.
Phillips, O. L., van der Heijden, G., Lewis, S. L., López-González, G., Aragão, L. E. O. C., Lloyd, J., et al. (2010). Drought-mortality relationships for tropical forests. New Phytol. 187, 631–646.
Plummer, M. (2003). “JAGS: A program for analysis of Bayesian graphical models using Gibbs sampling,” in Proceedings of the 3rd International Workshop on Distributed Statistical Computing, Vienna, 125.
Poorter, H., Niinemets, Ü, Poorter, L., Wright, I. J., and Villar, R. (2009). Causes and consequences of variation in leaf mass per area (LMA): a meta-analysis. New Phytol. 182, 565–588. doi: 10.1111/j.1469-8137.2009.02830.x
Poorter, L., McDonald, I., Alarcón, A., Fichtler, E., Licona, J. C., Peña-Claros, M., et al. (2010). The importance of wood traits and hydraulic conductance for the performance and life history strategies of 42 rainforest tree species. New Phytol. 185, 481–492. doi: 10.1111/j.1469-8137.2009.03092.x
Poorter, L., Wright, S. J., Paz, H., Ackerly, D. D., Condit, R., Ibarra-Manríquez, G., et al. (2008). Are functional traits good predictors of demographic rates? evidence from five neotropical forests. Ecology 89, 1908–1920. doi: 10.1890/07-0207.1
Powers, J. S., Vargas-G, G., Brodribb, T. J., Schwartz, N. B., Perez-Aviles, D., Smith-Martin, C. M., et al. (2020). A catastrophic tropical drought kills hydraulically vulnerable tree species. Glob. Change Biol. 26, 3122–3133. doi: 10.1111/gcb.15037
R Core Team. (2016). R: A Language and Environment for Statistical Computing, Vienna, Austria. Available online at: https://www.R-project.org/
Reich, P. B. (2014). The world-wide ‘fast-slow’ plant economics spectrum: a traits manifesto. J. Ecol. 102, 275–301. doi: 10.1111/1365-2745.12211
Reich, P. B., Ellsworth, D. S., and Walters, M. B. (1998). Leaf structure (specific leaf area) modulates photosynthesis-nitrogen relations: evidence from within and across species and functional groups. Funct. Ecol. 12, 948–958. doi: 10.1046/j.1365-2435.1998.00274.x
Richards, L. A., and Coley, P. D. (2007). Seasonal and habitat differences affect the impact of food and predation on herbivores: a comparison between gaps and understory of a tropical forest. Oikos 116, 31–40. doi: 10.1111/j.2006.0030-1299.15043.x
Ruiz-Benito, P., Lines, E. R., Gómez-Aparicio, L., Zavala, M. A., and Coomes, D. A. (2013). Patterns and drivers of tree mortality in Iberian forests: climatic effects are modified by competition. PLoS One 8:e56843. doi: 10.1371/journal.pone.0056843
Santiago, L. S., and Wright, S. J. (2007). Leaf functional traits of tropical forest plants in relation to growth form. Funct. Ecol. 21, 19–27.
Schwartz, N. B., Budsock, A., and Uriarte, M. (2019). Fragmentation, topography, and forest age influence drought and recovery in a tropical forested landscape. Ecology 100:e02677. doi: 10.1002/ecy.2677
Silva, C. E., Kellner, J. R., Clark, D. B., and Clark, D. A. (2013). Response of an old-growth tropical rainforest to transient high temperature and drought. Glob. Change Biol. 19, 3423–3434.
Skelton, R. P., West, A. G., and Dawson, T. E. (2015). Predicting plant vulnerability to drought in biodiverse regions using functional traits. Proc. Natl. Acad. Sci. 112, 5744–5749. doi: 10.1073/pnas.1503376112
Stephenson, N. L. (1990). Climatic control of vegetation distribution: the role of the water balance. Am. Nat. 135, 649–670. doi: 10.1086/285067
Su, Y. S., and Yajima, M., (2015). R2jags: Using R to Run ‘JAGS’. R package version 0.5-7. Available online at: https://CRAN.R-project.org/package=R2jags (accessed September 2015).
Swenson, N. G., and Enquist, B. J. (2008). The relationship between stem and branch wood specific gravity and the ability of each measure to predict leaf area. Am. J. Bot. 95, 516–519. doi: 10.3732/ajb.95.4.516
Swenson, N. G., Stegen, J. C., Davies, S. J., Erickson, D. L., Forero-Montana, J., Hurlbert, A. H., et al. (2012). Temporal turnover in the composition of tropical tree communities: functional determinism and phylogenetic stochasticity. Ecology 93, 490–499. doi: 10.1890/11-1180.1
Tenenbaum, D. E., Band, L. E., Kenworthy, S. T., and Tague, C. L. (2006). Analysis of soil moisture patterns in forested and suburban catchments in Baltimore, Maryland, using high-resolution photogrammetric and LIDAR digital elevation datasets. Hydrol. Process. 20, 219–240. doi: 10.1002/hyp.5895
Tromp-van Meerveld, H. J., and McDonnell, J. J. (2006). On the interrelations between topography, soil depth, soil moisture, transpiration rates and species distribution at the hillslope scale. Adv. Water Resour. 29, 293–310. doi: 10.1016/j.advwatres.2005.02.016
Uriarte, M., Canham, C. D., Thompson, J., and Zimmerman, J. K. (2004a). A neighborhood nalysis of tree growth and survival in a hurricane-driven tropical forest. Ecol. Monogr. 74, 591–614. doi: 10.1890/03-4031
Uriarte, M., Clark, J. S., Zimmerman, J. K., Comita, L. S., Forero-Montaña, J., and Thompson, J. (2012). Multidimensional trade-offs in species responses to disturbance: implications for diversity in a subtropical forest. Ecology 93, 191–205. doi: 10.1890/10-2422.1
Uriarte, M., Condit, R., Canham, C. D., and Hubbell, S. P. (2004b). A spatially explicit model of sapling growth in a tropical forest: does the identity of neighbours matter? J. Ecol. 92, 348–360. doi: 10.1111/j.0022-0477.2004.00867.x
Uriarte, M., Lasky, J. R., Boukili, V. K., and Chazdon, R. L. (2016a). A trait-mediated, neighbourhood approach to quantify climate impacts on successional dynamics of tropical rainforests. Funct. Ecol. 30, 157–167. doi: 10.1111/1365-2435.12576
Uriarte, M., Schwartz, N., Powers, J. S., Marín-Spiotta, E., Liao, W., and Werden, L. K. (2016b). Impacts of climate variability on tree demography in second growth tropical forests: the importance of regional context for predicting successional trajectories. Biotropica 48, 780–797. doi: 10.1111/btp.12380
Valladares, F., and Niinemets, Ü (2008). Shade tolerance, a key plant feature of complex nature and consequences. Annu. Rev. Ecol. Evol. Syst. 39, 237–257. doi: 10.1146/annurev.ecolsys.39.110707.173506
Western, A. W., Grayson, R. B., Bschl, G., and Willgoose, G. R. (1999). Observed spatial organization of soil moisture indices. Water Resour. Res. 35, 797–810. doi: 10.1029/1998wr900065
Wolf, J. A., Brocard, G. Y., Willenbring, J. K., Porder, S., and Uriarte, M. (2016). Abrupt change in forest structure localized to elevation of regional knickpoints in a tropical mountain range. Rem. Sens. 8:864. doi: 10.3390/rs8100864
Wright, I. J., Westoby, M., Reich, P. B., Oleksyn, J., Ackerly, D. D., Baruch, Z., et al. (2004). The worldwide leaf economics spectrum. Nature 428, 821–827.
Xu, X., Medvigy, D., Powers, J. S., Becknell, J. M., and Guan, K. (2016). Diversity in plant hydraulic traits explains seasonal and inter-annual variations of vegetation dynamics in seasonally dry tropical forests. New Phytol. 212, 80–95. doi: 10.1111/nph.14009
Keywords: tropical forest, drought, forest dynamics, LiDAR, microtopography, functional traits, second growth
Citation: Schwartz NB, Feng X, Muscarella R, Swenson NG, Umaña MN, Zimmerman JK and Uriarte M (2020) Topography and Traits Modulate Tree Performance and Drought Response in a Tropical Forest. Front. For. Glob. Change 3:596256. doi: 10.3389/ffgc.2020.596256
Received: 18 August 2020; Accepted: 09 November 2020;
Published: 23 December 2020.
Edited by:
Rosana López Rodríguez, Polytechnic University of Madrid, SpainReviewed by:
Christof Bigler, ETH Zürich, SwitzerlandThomas Brandeis, United States Forest Service (USDA), United States
Copyright © 2020 Schwartz, Feng, Muscarella, Swenson, Umaña, Zimmerman and Uriarte. This is an open-access article distributed under the terms of the Creative Commons Attribution License (CC BY). The use, distribution or reproduction in other forums is permitted, provided the original author(s) and the copyright owner(s) are credited and that the original publication in this journal is cited, in accordance with accepted academic practice. No use, distribution or reproduction is permitted which does not comply with these terms.
*Correspondence: Naomi B. Schwartz, bmFvbWkuc2Nod2FydHpAdWJjLmNh