 Lukas Gerhard
 Heike Puhlmann
 Margret Vogt2
 Jörg Luster
- 1Department of Soil and Environment, Forest Research Institute Baden Württemberg, Freiburg, Germany
- 2Forest Soils and Biogeochemistry, Swiss Federal Institute for Forest, Snow and Landscape Research (WSL), Birmensdorf, Switzerland
Foliar phosphorus (P) concentrations in beech trees are decreasing in Europe, potentially leading to reductions in the trees’ growth and vitality. In the course of climate change, drying and rewetting (DRW) cycles in forest soils are expected to intensify. As a consequence, P leakage from the root zone may increase due to temporarily enhanced organic matter mineralization. We addressed the questions whether sites with different soil properties, including P pools, differ in their susceptibility to DRW-induced P leaching, and whether this is affected by the DRW intensity. A greenhouse experiment was conducted on naturally structured soil columns with beech saplings from three sites representing a gradient of soil P availability. Four DRW cycles were conducted by air-drying and irrigating the soils over 4 hours (fast rewetting) or 48 hours (slow rewetting). Leachates below the soil columns were analyzed for total P, and molybdate reactive P (considered as inorganic P). The difference was considered to represent organically bound P. Boosted regression trees were used to examine the effects of DRW and soil characteristics on P leaching. Contrary to a first hypothesis, that P leaching increases upon rewetting with the intensity of the preceding desiccation phase, intense soil drying (to pF 3.5 to 4.5) did not generally increase P leakage compared to moderate drying (to pF 2 to 3). However, we observed increased inorganic P concentrations and decreased organic P concentrations in leachates after drying to matric potentials above pF 4. Also against our expectations, fast rewetting did not lead to higher leakage of P than slow rewetting. However, the results confirmed our third hypothesis that the site poorest in P, where P recycling is mainly limited to the humus layer and the uppermost mineral soil, lost considerably more P during DRW than the other two sites. The results of our experiment with naturally structured soils imply that intensified drying and rewetting cycles, as predicted by climate-change scenarios, may not per se lead to increased P leaching from forest soils. Soil properties such as soil organic carbon content and texture appear to be more important predictors of P losses.
Introduction
As an essential plant nutrient, phosphorus (P) is of paramount importance for the nutrition of beech trees (Fagus sylvatica L.). Temporal decoupling of P acquisition and growth, and internal P trade-off between storage tissues and leaves are physiological strategies enabling this species to flexibly adapt to different soil P availabilities (Zavišić and Polle, 2017; Meller et al., 2019). In this context, cycling and re-utilization of P within the ecosystem are crucial for P nutrition of beech. As Odum (1969) hypothesized, the cycling of P as part of plant nutritional strategies becomes tighter as an ecosystem matures, shifting from open to closed P cycles, with increasing importance of detritus for nutrient recycling. Total P uptake from forest trees has been found to be an order of magnitude higher than P supplied from chemical weathering, which indicates that P is efficiently re-utilized from the forest floor. However, despite nutrient recycling, the finite organic P pool in the forest floor is short-lived and susceptible to continuous losses through plant litter erosion or its dissolution and export (Uhlig and von Blanckenburg, 2019).
Lang et al. (2016) argue that the soilss’ P status (in terms of their carbon/phosphorous (C/P) ratios or total P pools) may be the most influential factor for forest P nutrition, and that different ecosystems of similar maturity may display differing tightness in their P cycling, depending on the soil’s P status. They propose that at sites rich in P, the nutrient is predominantly acquired from weathered primary soil minerals (“P acquiring strategy”). In contrast, P recycled from organic material becomes an important nutrient source at P-poor sites, leading to a tightening of the P cycle and a minimization of ecosystem P losses (“P recycling strategy”).
The soil solution, containing both dissolved organic and inorganic P forms, is the central compartment of the P cycle in forests (Weihrauch and Opp, 2018). Mobilized P that is neither taken up by plants nor immobilized by microbes or sorbed, can be leached from the topsoil into the subsoil. Leaching of P from the subsoil is considered small, due to the high P binding capacity there (Heathwaite and Dils, 2000; Sinaj et al., 2002). However, leaching may be triggered when under certain conditions, interactions of soil pore water and soil matrix are hampered (Julich et al., 2017; Makowski et al., 2020).
Soil moisture is an abiotic key factor controlling nutrient fluxes (Meier and Leuschner, 2014). Prolonged dry spells alternating with heavy rains can create new preferential pathways for P, initiate leaching processes and thereby open up gaps in an ecosystem’s P cycle (Sohrt et al., 2017).
In a changing climate, prolonged periods of drought alternating with more intense rain events (“drying and rewetting events,” DRW) are predicted to occur more often (Trenberth, 2011; Coumou and Rahmstorf, 2012). As a result, fluctuations in soil moisture are likely to become more extreme in many environmental settings (Zwiers et al., 2013). As compared to constantly moist soil, the rewetting of dry soil is known to induce pulses of CO2 efflux and nutrient leaching associated with the mineralization of organic matter, called the Birch effect (after Birch, 1958). Barnard et al. (2020) list six main causes for this mineralization pulse: cell lysis from microbial necromass; organic matter becoming more accessible to microbial decomposition after disruption of soil aggregates; exposure of mineralizable C after desorption of soluble organic compounds associated with minerals; restoration of water film connectivity that enables microorganisms to access substrates by diffusion; a net increase in resource availability for microorganisms upon rewetting due to sustained exoenzyme activity despite reduced microbial activity during soil drying; microbial release and catabolization of osmolytes accumulated in response to drying. All these processes also affect P mobilization in soil (Barnard et al., 2020). The DRW-induced release of P is primarily derived from biotic processes such as microbial cell lysis (e.g., Blackwell et al., 2010; Achat et al., 2012; Dinh et al., 2017; Pezzolla et al., 2019; Makowski et al., 2020) and soil organic matter mineralization (Wu and Brookes, 2005; Butterly et al., 2009; Chen et al., 2021). Microbial cell lysis has been found to enhance leaching mainly of organic P (Turner and Haygarth, 2001; Turner et al., 2003; Blackwell et al., 2009). However, also the leaching of inorganic P has been associated with cell lysis (Brödlin et al., 2019; Khan et al., 2019), possibly due to the rapid mineralization of released organic compounds rich in P (Annaheim et al., 2013; Dinh et al., 2016). Apart from biotic processes, abiotic processes may release both organic and inorganic P upon DRW. The disruption of soil aggregates (Bünemann et al., 2013) as well as desorption and increased organic matter solubility (Frossard et al., 2000; Turner and Haygarth, 2003; Butterly et al., 2009) were found to increase leakage of inorganic P. Turner and Haygarth (2003) discuss that physical disruption of organic matter coatings is the primary mechanism contributing to the increase in extractable inorganic P upon soil drying, but that dry conditions also reduce the specific surface area and thus the P sorption capacity of increasingly crystalline Fe and Al oxides.
Drying and rewetting has been found to increase the mobility of P in experiments performed with sieved soil, for example by Dinh et al. (2017) and Brödlin et al. (2019) from O and A horizons of forest soils, by Forber et al. (2017) from agricultural soils and by Blackwell et al. (2013) and Bünemann et al. (2013) from grassland soils. Blackwell et al. (2009) found that the rate of rewetting significantly changed the concentrations of dissolved and particulate P in the leachate, with highest concentrations being observed under fastest rewetting. Similarly, Messing et al. (2015) found in a field study on clay soil under agriculture that increased rain intensities enhanced losses of total P and inorganic P. Preferential flow, e.g., through macropores, has been found to be an important pathway for the translocation of particulate (Julich et al., 2017; Makowski et al., 2020) or colloidal (Missong et al., 2018) P within soils after irrigation events. Other than the rate of rewetting, the duration (Forber et al., 2017) and degree (Dinh et al., 2017; Brödlin et al., 2019; Gao et al., 2020) of drying, as well as the frequency of DRW cycles (Chen et al., 2016, 2021; Dinh et al., 2016) have been studied. Forber et al. (2017) identified 7–15 drying days as critical breakpoints after which substantially more P was found in mineral soil solution. Also, Brödlin et al. (2019) found that longer and warmer dry spells enhanced P release after drought, most likely due to increasing osmotic stress levels exerted on microorganisms. Dinh et al. (2017) identified a pF of 4 as a critical degree of desiccation of artificial soils, above which microbial P release increased substantially upon rewetting and continued to increase up to pF 6. Regarding repeated DRW cycles, Dinh et al. (2016) found no increase in P release after repeated DRW, whereas Chen et al. (2016) report decreases in microbial P, yet increases in inorganic P upon frequent DRW. Further, in a study by Chen et al. (2021), three repeated DRW cycles affected biotic and abiotic processes differently, with most biotic indicators, including microbial P, quickly adjusting to the treatment.
All above-mentioned studies on DRW-induced P release were performed on sieved, homogenized soil. DRW studies on undisturbed soil samples are rare. Batch experiments on disturbed soils, however, appear to be of limited use in predicting P release rates from naturally structured soils. For example, Forsmann and Kjaergaard (2014) found that P release rates from sieved soils were hardly correlated with actual P release rates, which illustrates the overall influence of the soil structure on P transport processes. To our knowledge, so far only one DRW study on P release used undisturbed soil columns, however only from forest floors (Hömberg and Matzner, 2017). The authors found that DRW caused a significant short-term increase in concentrations and leachate fluxes of dissolved P, with a stronger effect on organic than on inorganic P.
In experimental soil science, percolation experiments with undisturbed soil columns are a viable alternative to in-field experiments and allow the study of nutrient transport in naturally structured soils (e.g., Hildebrand, 1994; Thaysen et al., 2014; Holzmann et al., 2016). These studies showed that soil aggregate surfaces and adjacent macropores are selectively and systematically depleted of nutrients. Hildebrand (1994) found the soil structure to heavily delay nutrient release from aggregate surfaces into the pore space compared to homogenized soil. Those findings have been confirmed by several studies (e.g., Horn and Taubner, 1989; Hantschel et al., 1994; Vogt and Matschonat, 1997; Schlotter et al., 2012).
Despite ongoing research, overall understanding of leaching of P from forest soils is still fragmentary, which implies a lack of detailed studies quantifying such P losses (Bol et al., 2016). In particular, it remains less understood (a) how rain events and fast soil infiltration affect P translocation, (b) how strongly P fractions differ in their susceptibility to leaching and (c) how various ecosystem properties are involved in P leaching processes. To approach these questions we conducted a multivariate soil mesocosm experiment. Specifically we wanted to test the following hypotheses: (H1) intense soil drying compared to moderate drying increases P leakage upon rewetting, possibly due to P release from lysed microbial cells, (H2) fast rewetting leaches more P than slow rewetting, due to induced macropore flow and reduced uptake of P by plants and microorganisms, and (H3) more P is released upon rewetting from soils with low sorption capacity, in particular organically bound P.
Materials and Methods
Study Sites and Collection of Soil Columns
We took samples from three different sites in Germany with mature European beech (Fagus sylvatica L.) stands: Bad Brückenau (BBR), Vessertal (VES) and Lüss (LUE). The soils represent a gradient in available and total P stocks (total P: BBR 904 g m–2, VES 464 g m–2, LUE 164 g m–2, to 1 m soil depth). Table 1 summarizes other important site characteristics. The sites differ with respect to humus form (BBR: mull-like moder, VES: moder, LUE: mor-like moder), texture (BBR: silty clay loam, VES: loam, LUE: loamy sand) and sesquioxide contents. The soil in LUE shows signs of podzolization. Soil microbial activity is higher in VES than in BBR and LUE (Lang et al., 2017). According to the concept proposed by Lang et al. (2016), the site BBR is categorized as an “acquiring” forest ecosystem, whereas LUE corresponds to a “recycling” forest ecosystem. VES is considered an intermediate site (Lang et al., 2017).
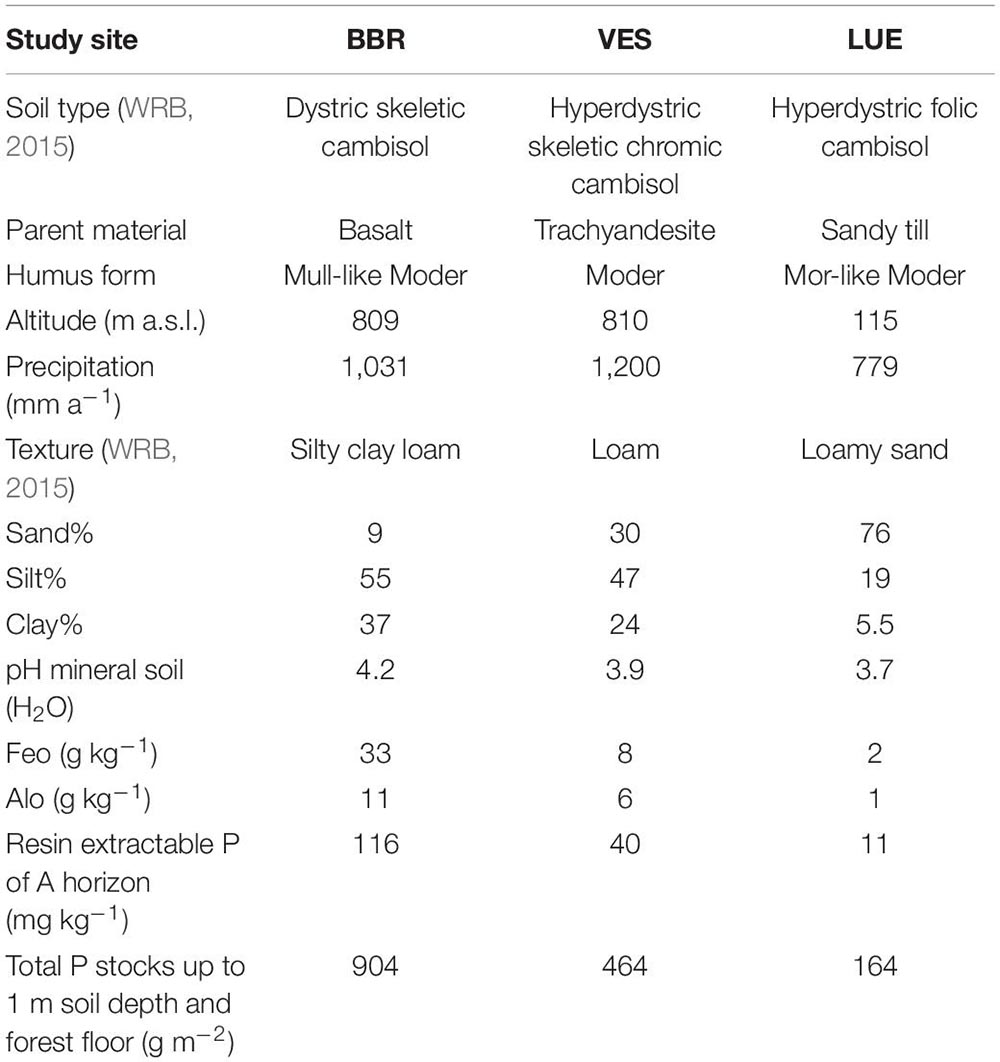
Table 1. Basic site and soil characteristics of the three sampling sites Bad Brückenau (BBR), Vessertal (VES) and Lüss (LUE) for the upper 20 cm soil. Feo and Alo, are proxies for sesquioxide content. Fe/Al suffix “o”: oxalate extracted. Data retrieved from Lang et al. (2017).
In March 2017, we sampled naturally structured soil columns including young beech trees from natural regeneration. We retrieved the soil samples by driving acrylic glass cylinders (inner diameter: 7.4 cm, height: 30 cm) into the soil, using a metal cartridge with a lid to protect the trees. Sampled soil columns comprised 15 to 24 cm of the top mineral soil as well as the organic layers (Oi, Oe, Oa). The sampled forest floor varied in thickness between 4 and 8 cm, the P-poor site LUE exhibiting the thickest and the P-rich site BBR the thinnest humus layer. Due to the abundance of fresh litter in spring, Oi layers were thick irrespective of the humus form. To prevent translocation of organic layer material into the mineral soil during the sampling process, we carefully removed the humus layer within and around the sampling spot before soil extraction and added it to the soil column later. Beech saplings were about 30 to 60 cm high. After storage at 5°C in a cooling chamber until May 2017, we moved the mesocosms to the greenhouse.
Conditioning
The DRW experiments were preceded by a 14-month conditioning phase starting in May 2017, in order to reduce possible effects of the soil sampling (e.g., disruption of roots and soil aggregates) on the DRW results. We equipped all mesocosms with vertically installed MPS 6 sensors (Decagon) which continuously monitored matric potential and soil temperature in the center of the mineral soil. Air humidity and temperature in the greenhouse were also monitored throughout the experiment. During conditioning, we irrigated the mesocosms with 20 to 40 ml of irrigation solution every second to third day to maintain a matric potential of around -10 kPa. Especially in the warm summer period, however, matric potentials in the mesocosms occasionally decreased between the irrigations to values below this target value. For irrigation, a solution was used which resembled the average precipitation water from around Freiburg i.B., Germany (detailed information provided in Holzmann et al., 2016). From mid-December 2017 to mid-March 2018, we set up a cooling case around the mesocosms to simulate winter conditions. Soil temperatures varied between 7 and 10°C during this period.
Drying and Rewetting
We conducted four DRW cycles between 17th of July and 20th of September 2018. Between the DRW cycles, there were 20-day intervals, in which all mesocosms were treated as during the conditioning phase. During the drying phase of a DRW cycle, irrigation was suspended for 3 to 5 days to achieve a moderate drying to pF values between 2 and 3 (LUE soils) or 2 and 3.5 (BBR and VES soils), or for 5 to 8 days to achieve an intense drying to pF values between 3 and 4 (LUE soils) or 3.5 and 5 (BBR and VES soils). We rewetted by continuously watering each mesocosm with 250 ml over 4 hours (fast rewetting) or over 48 hours (slow rewetting), simulating 58 l m–2 of rainfall. The irrigated water volume and the duration of the rewetting phase were chosen based on records of regional precipitation data (Malitz and Ertel, 2015) and available water capacities of the soils. Estimated return periods of the simulated rain events are 40, 30 and 50 years for the 4 hour rain, and 1.5, 1.5, and 4 years for the 48 hour rain for BBR, VES and LUE, respectively. We realized three combinations of drying intensity and rewetting duration: (1) moderate drying and slow rewetting (MOD-S), (2) intense drying and slow rewetting (DRY-S), and (3) intense drying and fast rewetting (DRY-F). We used five replicate mesocosms per variant from each of the three sites. All mesocosms of one variant were irrigated simultaneously. Irrigation of the different variants started with a slight time offset within a few hours. Each mesocosm was exposed to the same DRW variant (either MOD-S, DRY-S or DRY-F) throughout the four DRW cycles.
Irrigation water was supplied to each mesocosm from a 250 ml glass bottle by use of a peristaltic pump (Ismatec). The pump constantly delivered the irrigation solution to about 5 cm above the soil surface via silicone tubing, from where it dripped down at the preset rate. We manually changed the position of the dripping tube every 15 min to facilitate even water distribution over the mesocosm surface.
Experimental Boundary Conditions
Regardless of the DRW variant, rewetting aimed at saturating the mesocosms to matric potentials at or above −10 kPa. With very few exceptions, this was achieved for all DRW cycles and mesocosms. However, the location in a greenhouse entailed a certain susceptibility to environmental influences and therefore, conditions varied to some extent among the four DRW cycles. The second DRW cycle, for instance, took place in a considerably warmer period than the other three, which resulted in approximately 4°C higher soil temperatures. Apart from varying atmospheric conditions, differences between the sites with respect to the water retention characteristics complicated the aim to achieve similar matric potentials during the desiccation phase, and LUE samples generally remained wetter than samples from BBR and VES. Reasons for this could be a lower water uptake by the trees, a decreased evaporation due to hampered capillary rise through sand and the presence of an Oh horizon with a particularly high water retention capacity in the LUE soils compared to the other two sites. The mere effect of the drying and rewetting intensities on the leaching of P is therefore not easily comparable among the different sites.
Matric Potential During DRW
Average matric potentials before rewetting were for DRY-S and DRY-F: BBR: −2,004 ± 1,093 kPa, VES: −1,607 ± 824 kPa, LUE: −457 ± 645 kPa, and for MOD-S: BBR: −335 ± 465 kPa, VES: −176 ± 282 kPa, LUE: −16 ± 16 kPa. In the fast rewetting variant, the measured matric potential reached values around -10 kPa (upper measurement limit of the MPS 6 sensors) within 3.7 ± 3.0 hours on average after start of the irrigation, while in the slow rewetting variants it took on average 9.7 ± 9.9 hours (MOD-S) and 25.9 ± 13.1 hours (DRY-S) (Figure 1). After the experiment, we retrieved soil cores of 100 cm3 from the lower part of the mesocosms, and determined the volumetric water content at -6.3 kPa (field capacity).
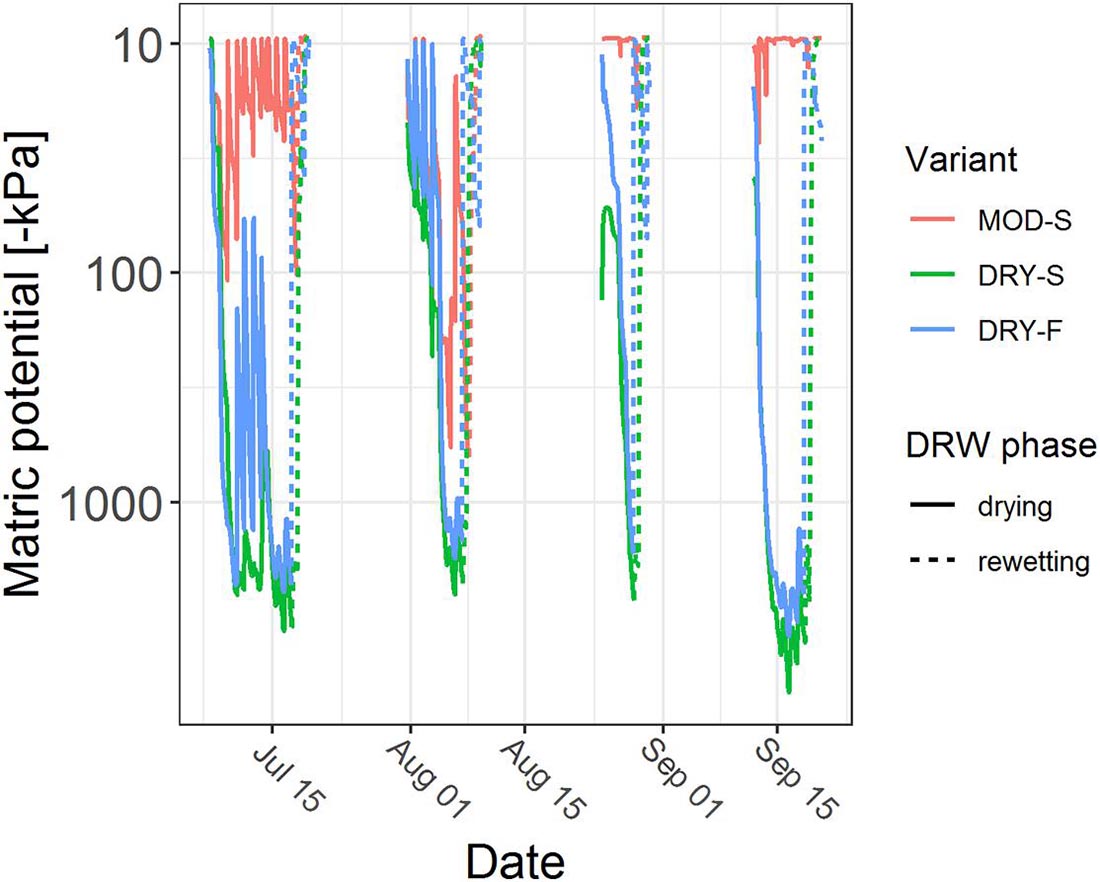
Figure 1. Matric potential of mesocosms from Bad Brückenau over the course of the four DRW cycles. MOD-S, moderate drying, slow rewetting; DRY-S, intense drying, slow rewetting; DRY-F, intense drying, fast rewetting.
Sampling and Chemical Analysis
Soil solution was collected at the bottom of the mesocosms with filter plates (ROBU GmbH) which consisted of borosilicate glass 3.3 and had a pore size of 10–16 μm. The leachate was collected in separate 500 ml borosilicate glass bottles, which were constantly cooled in a water bath to 12–15°C. During rewetting and for several hours thereafter, we reduced the air pressure inside the collection bottles by 6–8 kPa through a connected vacuum pump (KNF Neuberger GmbH). Thus, water-logging, anaerobic soil conditions and, as a consequence, reductive P mobilization were avoided. We sampled the leachates during each DRW cycle. For this, we emptied the glass bottles at the beginning of a cycle and transferred the leached solution from the bottles into storage containers at the end of a cycle.
Until analysis, the leachates were stored for 4 to 8 weeks at 5°C. Despite cooling, some enzymatic transformation of organic P likely occurred during the storage, so inorganic P leaching is probably somewhat overestimated in our data. We analyzed total phosphorus (TP) of the leachates after digestion of unfiltrated soil solution with K2S2O8 and H2SO4 and addition of ascorbic acid solution. Molybdate reactive phosphorus (MRP) as well as all other chemical parameters were determined in soil solution that was filtered through 0.45 μm cellulose acetate filters. Total minus molybdate reactive P was considered to represent organically bound P including colloidal organic P (molybdate unreactive P, MUP). TP, MRP, dissolved organic carbon (DOC), total nitrogen (TN) and NH4 were measured with a San++ Continuous Flow Analyzer (Skalar Analytical B.V.). Al, Fe, NO3, SO4, Cl, Si, Mn, Zn, Mg, K, Ca and Na were analyzed with an 881 Compact IC pro (Deutsche METROHM GmbH & Co. KG). Soil solution pH was measured with an A 220 pH meter (Denver Instrument). For a detailed explanation of chemical analyses see Holzmann et al. (2016).
Leachate obtained from individual mesocosms was not always sufficient for a complete laboratory analysis. In those cases, we combined leachates from replicate samples (same site, same DRW variant) to obtain an analyzable leachate volume. If leachate was still not sufficient, TP analysis was prioritized over other parameters, hence more observations are available for TP (n = 154) than for MRP and MUP (n = 137). The total P loss (P load) within a DRW cycle was determined by multiplying the leachate volumes by the P concentrations.
Statistical Analysis and Model Building
To compare P leaching between the different DRW variants and the different sites, we firstly applied a Wilcoxon signed-rank test at 5% error probability.
We then used Boosted Regression Trees (BRTs) to analyze the effect of experimental variants, environmental conditions as well as soil and soil solution properties on P leakage. BRT modelling seemed appropriate due to its ability to handle different types of predictor variables, outliers and missing data (Elith et al., 2008). BRTs fit multiple regression trees and combine them, using a combination of the ordinary regression tree approach and boosting, thereby potentially improving the predictive performance compared to standard regression methods which produce a single model (Buston and Elith, 2011). All predictor variables are ranked according to their relative influence (RI) on the response variable (De’Ath, 2007). Partial dependence plots (Friedman and Meulman, 2003) were used to visualize the effect of a given predictor on the response, while all other predictors are held at their mean value (Greenwell, 2017).
We built BRTs for the leachate concentrations of MRP, MUP and TP, the ratio of MUP/TP as well as the total loss of MRP, MUP and TP during each DRW cycle. We increased the number of predictor variables included in the BRTs in three hierarchical steps. Firstly, we fitted basic models (“Level I BRTs”) with the predictors SITE (BBR, VES or LUE), INT (MOD or DRY for the drying intensity), IRR_RATE (SLOW or FAST for the applied rewetting rate) and CYCLE (1, 2, 3 or 4 for the consecutive DRW cycles).
Secondly (“Level II BRTs”), we added predictor variables that are specific to the DRW cycle of each individual mesocosm: PSI_START (log-transformed matric potential just before rewetting [log10(hPa)]), RW_TIME (duration of rewetting [min], derived from matric potential sensor readings), WRET (water retention during irrigation = irrigated volume - leached volume [ml]), MESO_FC (field capacity of the individual mesocosm [mm]), and SOIL_TEMP (soil temperature [°C]). Air temperature [°C] and air humidity [%] were tested as predictor variables to clarify that the number of the DRW cycle was not a mere proxy for the prevailing climatic conditions.
Thirdly (“Level III BRTs”), we included soil solution chemical parameters in the final models: pH, DOC ([mg l–1]) and NH4_N (ammonium-N [mg l–1]). NO3_N (nitrate-N [mg l–1]), DIN = NH4_N + NO3_N (dissolved inorganic nitrogen [mg l–1]) and TN (total nitrogen [mg l–1]) were dropped in the process of model development due to their high correlation with the stronger predictor NH4_N (Pearson correlation coefficients > | ± 0.7|). Likewise, Al (total aluminum [mg l–1]), Fe (total iron [mg l–1]), and DON (dissolved organic nitrogen [mg l–1], TN – DIN) were dropped in favor of DOC. To make these selections, we calculated separate BRT models with only one of the intercorrelated predictor variables (DIN, NO3_N, NH4_N, TN, and Al, Fe, DOC, DON) at a time. We then chose the predictor that contributed to the model with the highest score of explained variance.
We tested all other parameters available from soil solution analysis (Si, Mn, Zn, Mg, K, Ca, Na, Cl, and SO4) for their influence on P response variables, but rejected them due to their negligible impact. Because of their skewed distribution, the values of the predictors Al, Fe, DOC, NH4_N, and DON were log-transformed.
All analyses were conducted in R (R Core Team, 2019). We used the dismo (Hijmans et al., 2017) and gbm (Greenwell et al., 2019) packages based on scripts provided by Elith et al. (2008) and Elith and Leathwick (2017) to model BRTs and examine the models for predictor interactions. The applied gbm.step function uses cross validation of simulated vs. measured P concentrations and loads to estimate the optimum number of trees. As some randomness usually improves model accuracy and reduces overfitting (Friedman, 2002), models were built using randomly selected 50% of the data at each iteration (bag fraction = 0.5). To obtain models with at least 1,000 trees, we used a learning rate of 0.002, which was increased to 0.003 when the number of fitted trees exceeded 10,000. To allow for the fitting of interactions between predictor effects, tree complexity was set to 5. As measures for predictive performance, we calculated the variance explained by the BRT models according to Derville et al. (2016), as well as the cross-validation variance according to Sutcliffe et al. (2013).
Results
Effects of DRW Variants and Site on Phosphorus Leaching as Revealed by Rank Testing
Phosphorus in the leachates was composed to a larger degree of molybdate unreactive phosphorus (MUP) than of molybdate reactive phosphorus (MRP; Figure 2; for details see below). While the experimental drying-rewetting (DRW) variants (MOD-S, DRY-S, DRY-F) had no effect on either P fraction, when considering soil columns from all three sites (Figure 2A), there were differences when comparing data from given sites (see Supplementary Table 1). DRY-S resulted in the lowest total phosphorus (TP) concentrations in BBR and VES leachates (22.9 ± 9.3 and 27.9 ± 13.2 μg l–1, respectively), as well as the lowest MUP concentrations in BBR (12.8 ± 8.5 μg l–1) and the second lowest MUP concentrations in VES (15.6 ± 9.1 compared to 15.3 ± 6.7 μg l–1 in DRY-F). Contrarily, LUE leachates showed the highest concentrations of TP and MUP in DRY-S (63.2 ± 25.7 and 54.8 ± 24.6 μg l–1, respectively). As for MRP concentrations, MOD-S, DRY-S and DRY-F only had a noticeable effect in VES leachates (12.2 ± 16.2, 10.8 ± 13.2 and 16.8 ± 12.8 μg l–1, respectively). We found significant differences when comparing data from the three sites, but irrespective of DRW variant (Figure 2B). MRP concentrations in leachates from VES soil (14 ± 10.3 μg l–1) were significantly and about 1.5 times higher than in leachates from BBR (8.6 ± 4.6 μg l–1) and LUE (9.2 ± 5.0 μg l–1). By contrast, both TP and MUP concentrations in leachates from LUE soil (TP: 50.9 ± 26.4 μg l–1; MUP: 41.7 ± 24.3 μg l–1) were significantly and about two times higher than in leachates from VES soil (TP: 32.7 ± 14.3 μg l–1; MUP: 18.7 ± 10.8 μg l–1) and BBR soil (TP: 26.6 ± 10.1 μg l–1; MUP: 17.0 ± 10.1 μg l–1). As a consequence, also the relative proportion of MUP (MUP/TP) was significantly higher in LUE soil leachates (0.79 ± 0.14) than in leachates from VES (0.57 ± 0.21) and BBR (0.61 ± 0.24) soils. As higher P concentrations generally coincided with higher leachate volumes, the inter-site differences described above for P concentrations also applied to P loads (not shown).
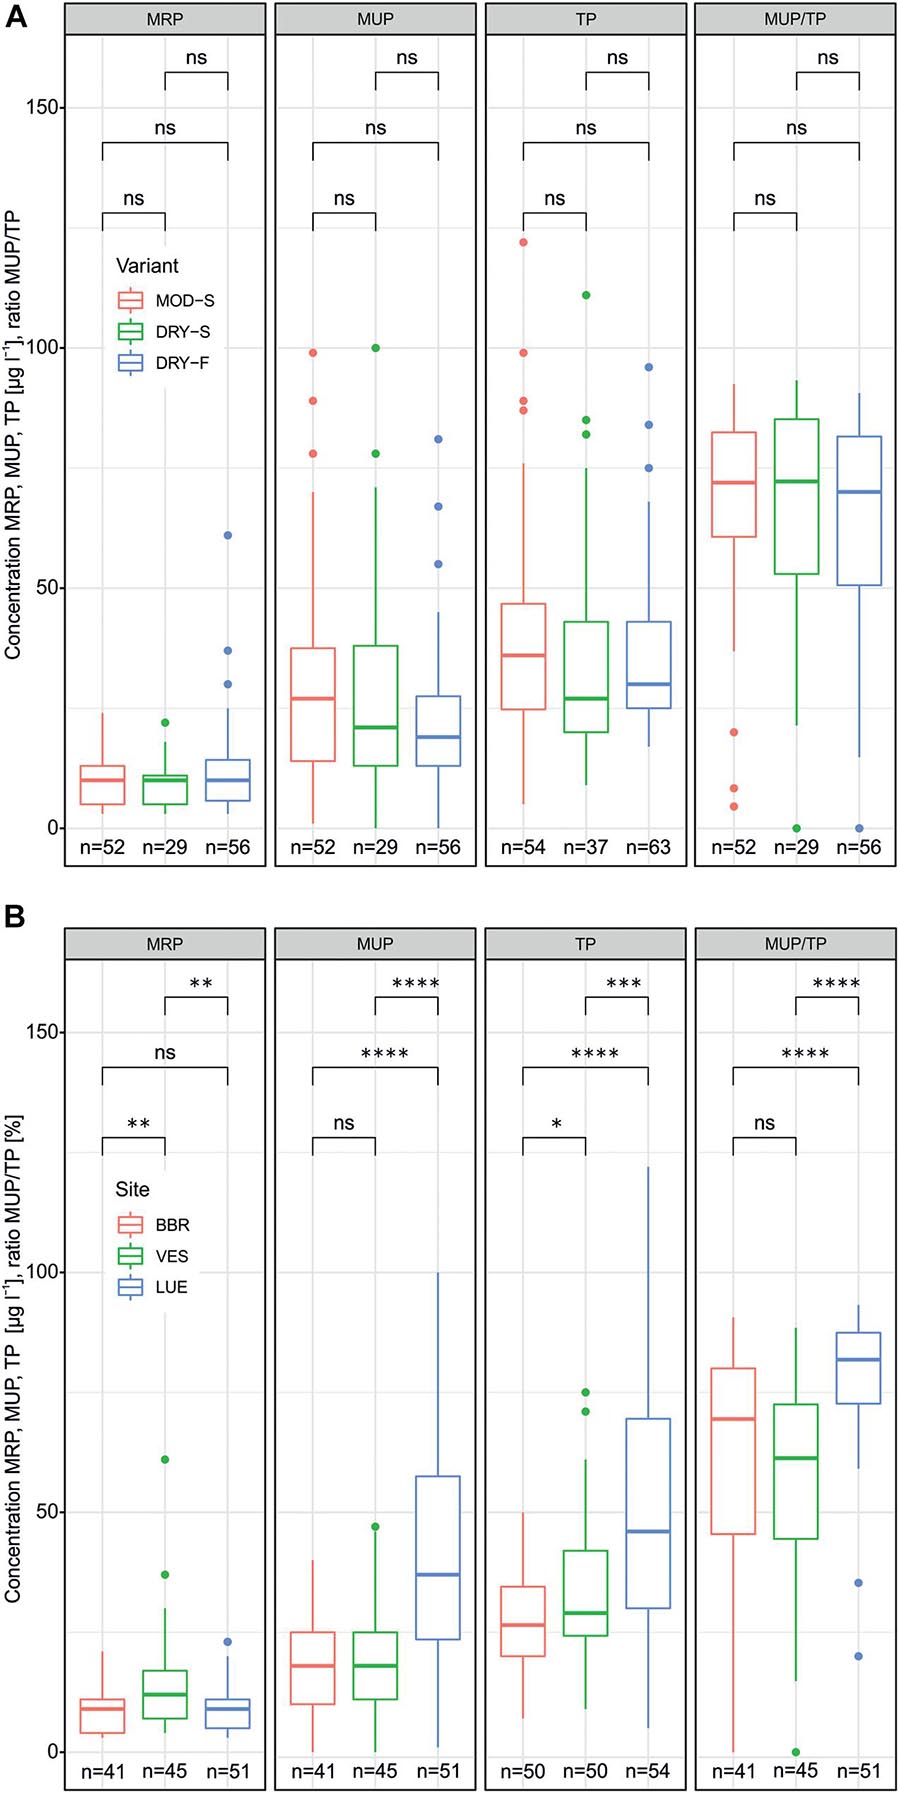
Figure 2. Leachate concentrations of molybdate reactive phosphorus (MRP), molybdate unreactive phosphorus (MUP), total phosphorus (TP) and MUP/TP ratios for the three different DRW variants (MOD-S, DRY-S, DRY-F on x-axis) (A) and the three sampling sites (BBR, VES, LUE on x-axis) (B). Asteriks indicate significance at *P < 0.05, **P < 0.01, ***P < 0.005, ***P < 0.001 (Wilcoxon test), ns indicates no significance.
In addition to the site related differences, concentrations and loads of both P fractions differed among the individual DRW cycles (see Supplementary Table 1). While, irrespective of site, MRP concentrations gradually declined continuously from the first to the fourth cycle, MUP and TP concentrations were minimum either in the second cycle (BBR, VES) or in the fourth cycle (LUE). The effects of the DRW cycle on our results was revealed in more detail by the boosted regression tree analysis, as described in the following.
Level I Boosted Regression Trees (BRTs) for P Concentrations in Soil Leachates
Basic BRT analysis, testing for the relative effects of the predictors site, drying intensity before rewetting, irrigation rate during rewetting, and DRW cycle, and visualized in partial dependence plots (Figure 3), revealed distinct differences between the behavior of MRP and MUP in leachates during rewetting. The DRW cycle had a dominant effect on MRP with a RI of 59.9% (Table 2), leading to a continuous decrease from the 1st to the last cycle (Figure 3, Supplementary Table 1). The RI of site was only 25.8% with higher MRP concentrations in VES leachates than BBR and LUE leachates (Figures 2, 3). By contrast, site had a somewhat higher RI on MUP, TP and MUP/TP (48.6, 44.3, and 49.5%, respectively; Table 2) than DRW cycle (37, 42.4, and 38.5%, respectively; Table 2). As also shown by rank testing (see above), leachates from LUE exhibited higher values of MUP, TP and MUP/TP than BBR and VES leachates (Figure 3). As shown for MRP, also the MUP and TP concentrations were maximum in the first DRW cycle. However, there was no continuous decrease during the following cycles, and the relative contribution of MUP was maximum in the last cycle (Figure 3).
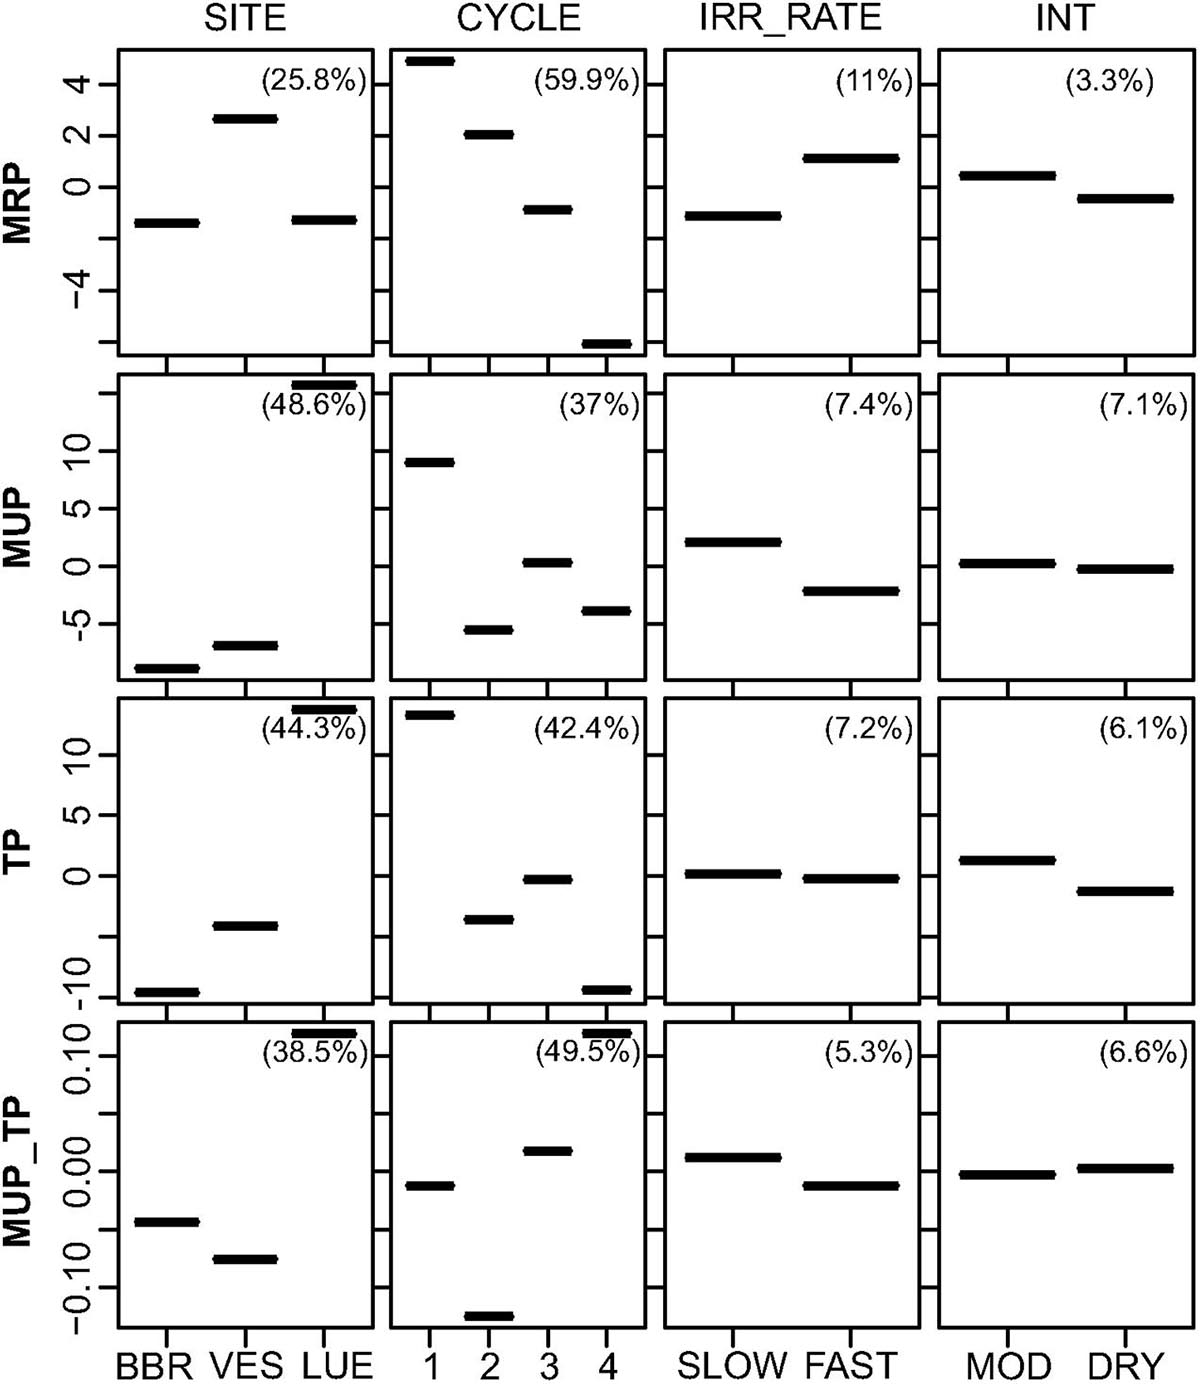
Figure 3. Partial dependence plots for Level I BRTs, showing fitted effects of predictor variables (IRR_RATE: irrigation rate, INT: drying intensity) on MRP, MUP, TP concentrations and MUP/TP ratios with all other predictor variables held at their mean. Percentages in plots list the relative influence of each predictor on the respective response variable. The response variables on the y-axis have been centered by subtracting their mean.
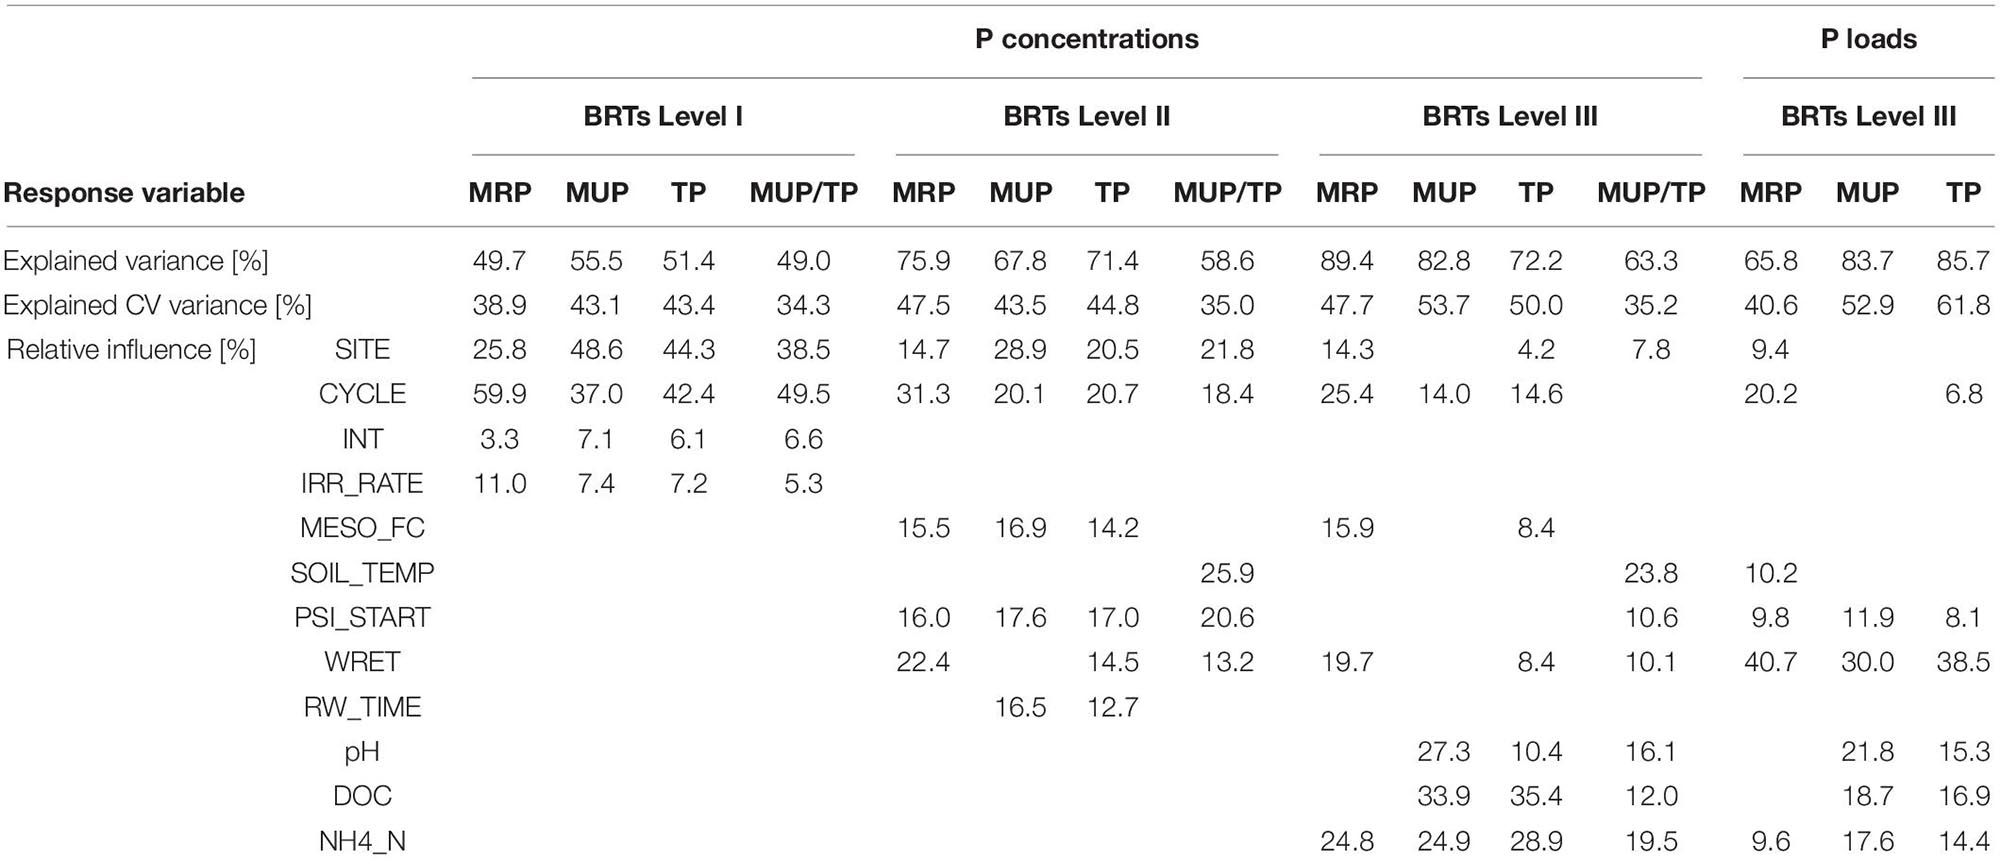
Table 2. Output from Boosted Regression Trees (BRTs); The explained (cross-validated, CV) variance of the models, and the relative influences of predictor variables (INT: Drying intensity, IRR_RATE: Irrigation rate, MESO_FC: Field capacity of mesocosm, SOIL_TEMP: Soil temperature, PSI_START: Matric potential before rewetting, WRET: Water retained during rewetting, RW_TIME: Duration of rewetting, DOC: Concentration of dissolved organic carbon, NH4_N: Concentration of ammonium-N) on concentrations of molybdate reactive phosphorus (MRP), molybdate unreactive phosphorus (MUP), total phosphorus (TP) and MUP/TP ratios (BRTs Level I, II, III), and the respective P loads (BRTs Level III). Blank fields indicate that the predictor was dropped during simplifying of the BRT model.
Neither drying intensity before rewetting (MOD, DRY; RI between 3.3 and 6.6%) nor irrigation rate during rewetting (SLOW, FAST; RI between 5.3 and 11%) had a strong effect on P leaching from the soil columns. The only noticeable effect were somewhat higher MRP concentrations (only in VES) and lower MUP concentrations (only in LUE) after fast than slow rewetting (see Supplementary Table 1, Figure 3).
Including DRW Parameters: Level II BRTs for Leachate P Concentrations
The partial dependence plots for level II BRTs are shown in Figure 4. These BRTs were performed with the predictors from level I BRTs (site, DRW cycle, etc.) and predictor variables specific to individual mesocosms (field capacity MESO_FC, water retention during rewetting WRET, soil temperature, desiccation intensity before rewetting PSI_START, duration of rewetting RW_TIME, etc.). PSI_START and RW_TIME replaced the “two-level” predictors intensity before rewetting and irrigation rate during rewetting from the level I BRTs. Site (RI between 14.7 and 28.9%) and DRW cycle number (RI between 18.4 and 31.3%; Table 2) remained strong predictors for all response variables also for Level II BRTs (Figure 4). However, also the newly included predictors exhibited strong effects. Concentrations of all P fractions were affected strongly by water retention during irrigation (RI between 14.5 and 22.4%) and field capacity (RI between 14.5 and 16.9%; Table 2), with concentrations decreasing with increasing water retention or field capacity (Figure 4). On the other hand, the relative proportion of MUP increased with increasing water retention to about 130 ml and decreased with further increasing water retention (RI 13.2%). Desiccation intensity prior to rewetting (PSI_START, RI between 16 and 20.6%; Table 2) was another influential predictor for all P fractions. MRP concentrations increased with increasing PSI_START in the moist range to about pF 2.5, decreased slightly with increasing dryness and increased again in the very dry range above pF 4 (Figure 4). By contrast, MUP and TP concentrations increased up to pF 2.2, and then decreased with increasing dryness. The relative proportion of MUP decreased steadily with increasing dryness. The MUP/TP ratio was the only parameter which in addition was strongly affected by soil temperature (RI 25.9%), showing a marked decrease with increasing soil temperature.
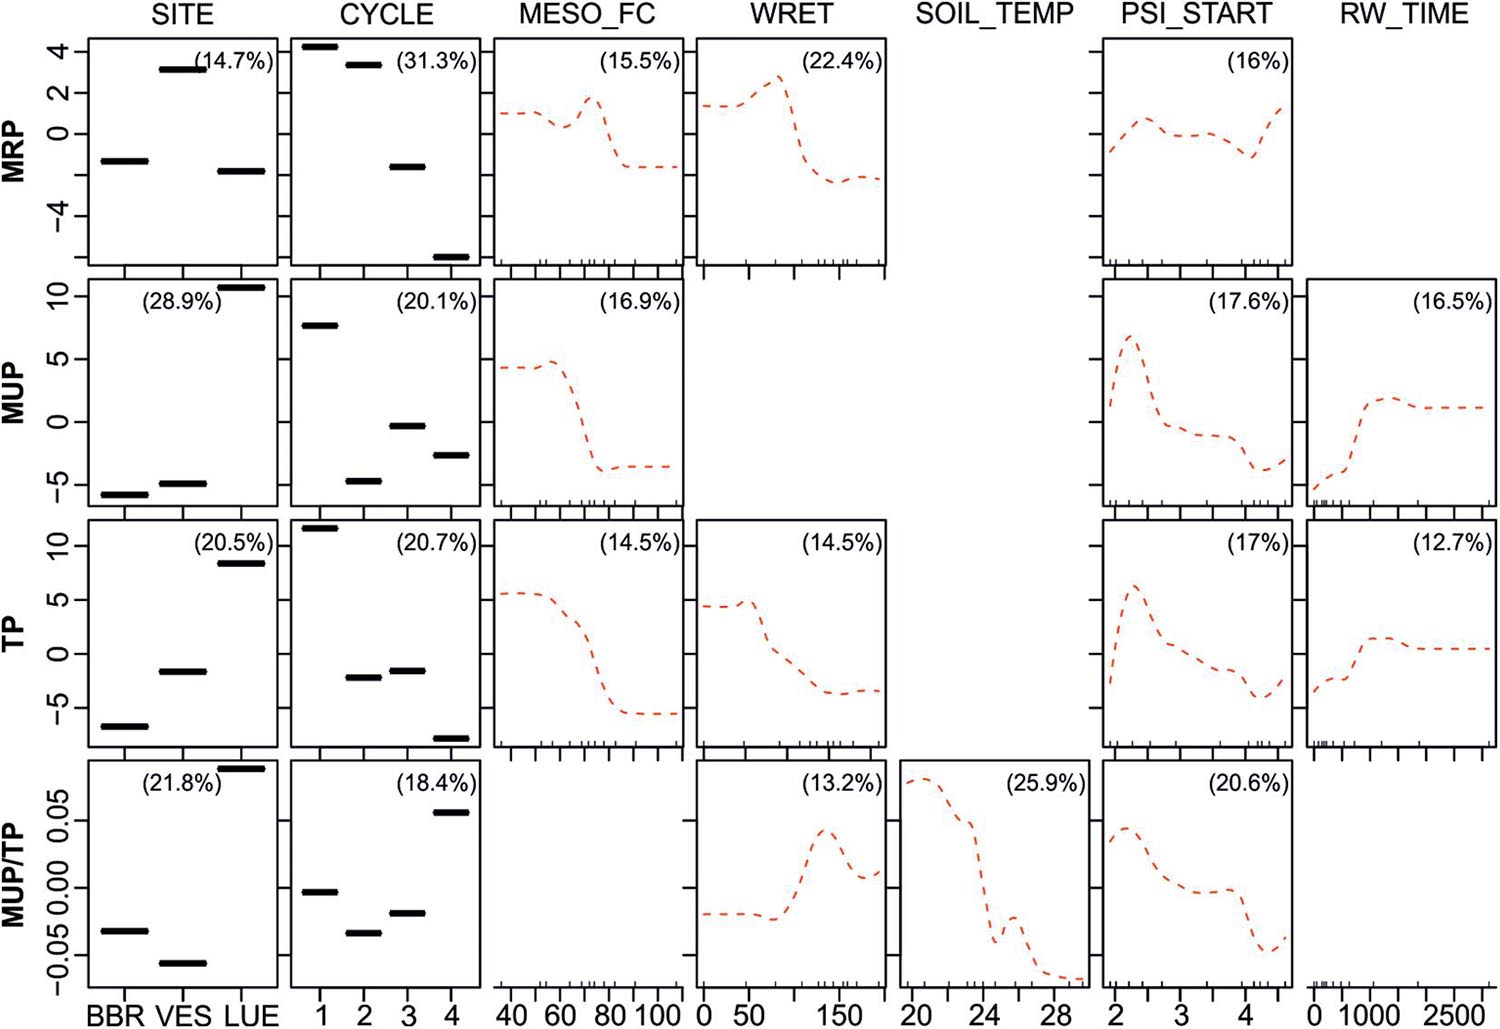
Figure 4. Partial dependence plots for Level II BRTs, showing fitted effects of predictor variables (MESO_FC: Field capacity of mesocosm [mm], WRET: Water retained during rewetting [ml], SOIL_TEMP: soil temperature [°C], PSI_START: Matric potential before rewetting [log10(hPa)], RW_TIME: duration of rewetting [min] on MRP, MUP, TP concentrations and MUP/TP ratios with all other predictor variables held at their mean. Red dotted lines are loess smoothed curves. Percentages in plots list the relative influence of each predictor on the respective response variable. The response variables on the y-axis have been centered by subtracting their mean. Blank fields indicate that the predictor was dropped during simplifying of the BRT model. Ticks at the base of the plots indicate the distribution, in deciles, of the predictor variable on the x-axis.
In strong contrast to the two-level predictor irrigation rate (see level I BRTs), the individual duration of rewetting (RW_TIME) was among the important predictors for TP and MUP (RI 12.7 and 16.5%, respectively; Table 2). However, an examination of the interactions between RW_TIME and SITE (data not shown) revealed that only for LUE samples TP and MUP concentrations increased with longer rewetting times.
Including Leachate Chemical Composition: Level III BRTs for Leachate P Concentrations and Loads
Including soil solution parameters (DOC and NH4_N concentrations, pH) as additional predictors in the BRTs reduced mainly the RI of the three-level predictor SITE, while one or more of the soil solution parameters became highly influential (see partial dependence plots in Figure 5). The concentrations of all P fractions as well as the relative proportion of MUP were strongly influenced by NH4_N concentrations (RI ranging from 19.5 to 28.9%), with P concentrations and ratios increasing with NH4_N up to a threshold of 0.5 μg l–1. Furthermore, MUP, TP and MUP/TP increased with increasing DOC concentrations (RI between 12 and 35.4%). Soil solution acidity (pH) showed a strong (RI 27.3%) but varying effect on MUP between pH 4.5 and 5.0, whereas the relative proportion of MUP decreased sharply between pH 4.0 and 4.5 (Figure 5).
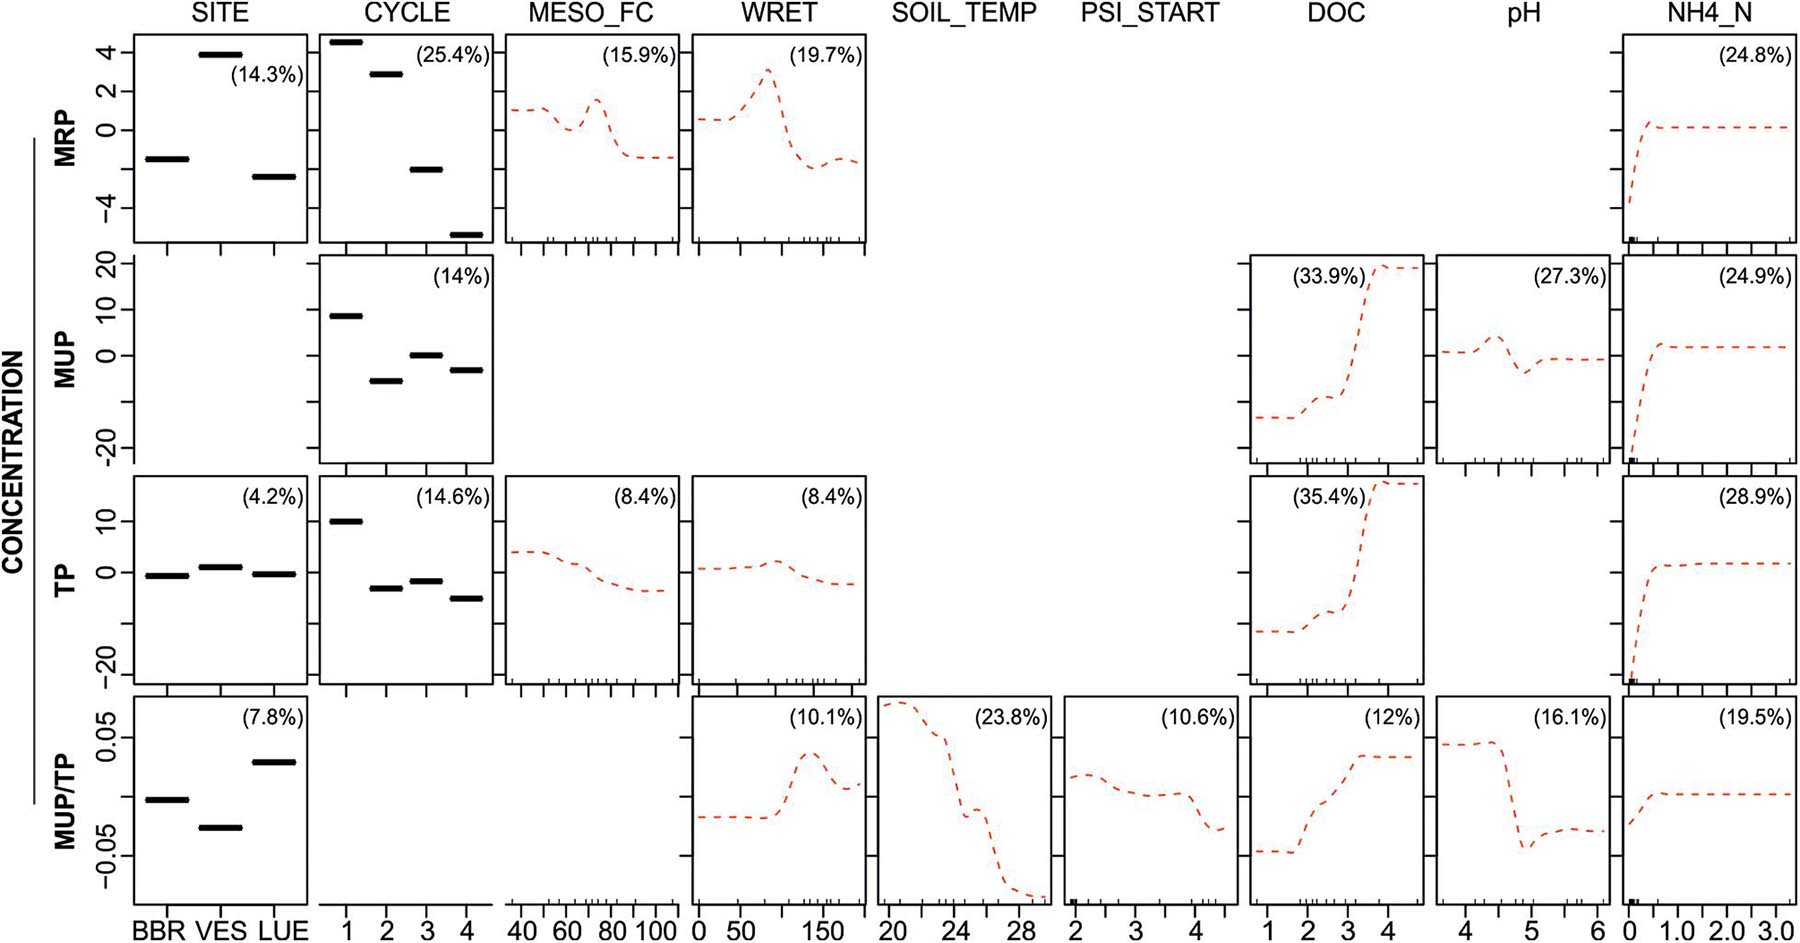
Figure 5. Partial dependence plots for Level III BRTs, showing fitted effects of predictor variables (MESO_FC: Field capacity of mesocosm [mm], WRET: Water retained during rewetting [ml], SOIL_TEMP: soil temperature [°C], PSI_START: Matric potential before rewetting [log10(hPa)], DOC: concentration of dissolved organic carbon (log-transformed), NH4_N: concentration of ammonium-nitrate (log-transformed)) on MRP, MUP, TP concentrations and MUP/TP ratios with all other predictor variables held at their mean. Red dotted lines are loess smoothed curves. Percentages in plots list the relative influence of each predictor on the respective response variable. The response variables on the y-axis have been centered by subtracting their mean. Blank fields indicate that the predictor was dropped during simplifying of the BRT model. Ticks at the base of the plots indicate the distribution, in deciles, of the predictor variable on the x-axis.
Interactive relations (not shown) between the predictor site and the predictors DOC, NH4_N and pH suggest that the predicted effects of DOC, NH4_N and soil acidity on the concentrations of P fractions are a reflection of inherent differences between LUE and the other two sites. The leachates from LUE (see Supplementary Table 1) exhibited varying concentrations of DOC (35.2 ± 29.8 mg l–1), that were, however, distinctly higher than DOC concentrations in leachates from BBR (8.5 ± 3.5 mg l–1) and VES (12.6 ± 6.6 mg l–1). The concentrations of NH4_N (3.5 ± 5.3 mg l–1) in LUE leachates were also higher than those in leachates from BBR and VES (both 1.1 ± 0.1 mg l–1). LUE leachates were also more acidic (mean pH 4.3) than leachates from VES (mean pH 5.0) and BBR (mean pH 5.7).
Since loads of leached P fractions were calculated by multiplying the leached volume of each rewetting phase with the respective concentrations of MRP, MUP and TP, all loads were reduced by an increasing water retention during rewetting (WRET) as the strongest predictor in the BRTs (RI between 30 and 40.7%; see partial dependence plots in Figure 6). Responses to most other predictor variables were similar to the respective P concentrations.
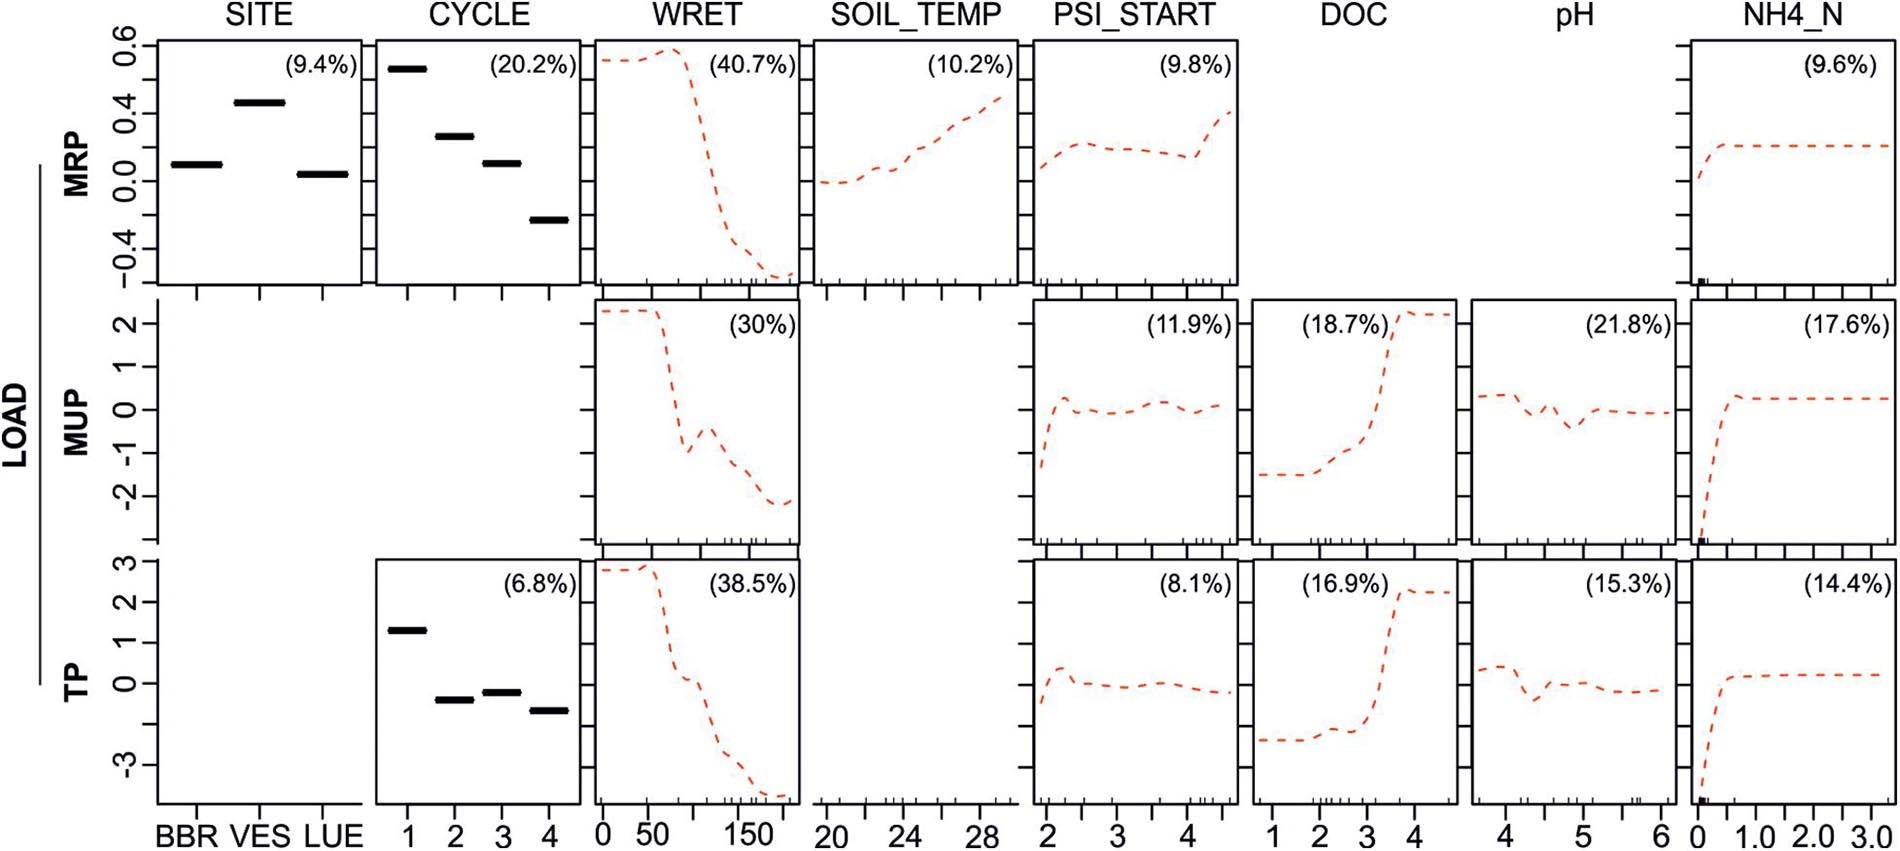
Figure 6. Partial dependence plots for Level III BRTs, showing fitted effects of predictor variables (WRET: Water retained during rewetting [ml], SOIL_TEMP: soil temperature [°C], PSI_START: Matric potential before rewetting [log10(hPa)], DOC (concentration of dissolved organic carbon (log-transformed), NH4_N: concentration of ammonium-nitrate (log-transformed)) on MRP, MUP and TP loads with all other predictor variables held at their mean. Red dotted lines are loess smoothed curves. Percentages in plots list the relative influence of each predictor on the respective response variable. The response variables on the y-axis have been centered by subtracting their mean. Blank fields indicate that the predictor was dropped during simplifying of the BRT model. Ticks at the base of the plots indicate the distribution, in deciles, of the predictor variable on the x-axis.
Discussion
P Leakage Decreases Over Time
The total P concentrations in leachates were in a similar range as in previous leachate studies examining the same sites (Holzmann et al., 2016; Makowski et al., 2020). Organic P dominated the leakage from all three sites (mean MUP/TP ratios ranging from 57 to 80%), which has also been observed by a number of other authors (e.g., Turner and Haygarth, 2001; Blackwell et al., 2010) and is explained by the greater affinity of MRP to the soil solid phase (Kaiser et al., 2003; George et al., 2018). However, our findings are in contrast with observations of Holzmann et al. (2016); Brödlin et al. (2019), and Makowski et al. (2020), where MRP dominated leachates from mineral soil. We found mean ratios of MUP/TP to be about a third higher in leachates from LUE than from BBR and VES, which is due to the thicker humus layer containing a higher share of organic P in LUE.
While leachate volumes remained approximately constant throughout the four DRW cycles, P concentrations in the leachates decreased steadily. The consecutive number of the DRW cycle was included in all BRT models for MUP, MRP and TP concentrations, as well as for MRP and TP loads. The steady decrease of MRP concentrations from the first to the fourth cycle points to a progressive depletion of the exchangeable inorganic P pool and its declining replenishment from organic matter mineralization. The strikingly higher MUP (and thus TP) concentrations in the first DRW cycle compared to subsequent cycles indicate a flushing of soil organic matter during the first rewetting (“Birch effect”). This is in line with observations of a distinct P flushing during the first hours of irrigation of desiccated soil in a field experiment by Makowski et al. (2020). The particularly low MUP concentrations in the second DRW cycle are possibly due to the higher soil temperatures (compared to the third and fourth cycle) that enhanced enzymatic depolymerization and mineralization of organic matter (e.g., Conant et al., 2011; Bailey et al., 2019). Since we did not observe a concomitant increase in MRP concentrations during the second cycle, the mineralized P was likely taken up by trees or microorganisms.
Drier Soil Does Not Leach More P Upon Rewetting
Our observations only partly confirm our hypothesis (1) that increasing intensity of desiccation would lead to higher P leakage upon rewetting. Contrary to our expectations, MUP and TP concentrations as well as MUP/TP ratios decreased in the leachates with increasing degree of drying, predominantly in the VES samples. MRP showed a tendency to increase after more intense desiccation, especially above pF 4. This is in agreement with the results of Khan et al. (2019), who observed increased leaching of dissolved inorganic P when soils were more desiccated prior to rewetting. Our results partially agree with findings of Brödlin et al. (2019), who observed (in organic and topsoil material from LUE and BBR) a considerably greater mobilization of inorganic, but also organic P after an initiate harsh dry spell (drying at 40°C for 72 h) compared to a subsequent moderate one (drying at 20°C for one month). While the potential effect of a first flush is not discussed by Brödlin et al. (2019), the authors argue that a harsher drying exerts higher osmotic stress on microorganisms and thereby affects drought-induced P release of primarily microbial origin. Our results suggest that a drying to a matric potential up to pF 4 does not affect P leaching, but losses of P increase above pF 4. This is also in line with Dinh et al. (2017), who found microbial P release under DRW to critically increase upon desiccation to above pF 4. Apart from the magnitude of desiccation (i.e., the achieved matric potential), the established drying phase in our experiment was possibly too short to induce a substantial release of P from microbial cell lysis. For example, Khan et al. (2019) found that after an intensive drying period of 14 days, rewetting released significantly more microbially derived P from soils than after two days of intensive drying. Lower survival of bacteria with increasing desiccation time was also observed by Meisner et al. (2015, 2017), while fungi probably survived desiccation better (Schimel, 2018). Overall, it appears that the microbial community in our experiment was able to largely outlast and recover from the desiccation phases (3 to 5 days for moderate and 5 to 8 days for intensive drying) (cf. Gao et al., 2020; Schimel, 2018). Parts of the bacterial community likely adapted to drought stress by developing epigenetical traits, e.g., by the production of extracellular polymeric substances during soil drying (Schimel, 2018). This may have altered soil repellency, decreased organic matter mobility (Barnard et al., 2020) and thereby hampered the leaching of soil organic P (George et al., 2018). Possibly, this process explains why desiccation to values below pF 4 did not further intensify P leaching in our experiment.
In addition to biotic processes, abiotic factors such as aggregate disruption (Bünemann et al., 2013) and desorption (Butterly et al., 2009) modify the response of soils to DRW cycles. However, the breakdown of soil aggregates by drying and rewetting is unlikely to have played a role in our experiment because it usually occurs only at very large rewetting magnitudes (Barnard et al., 2020). Accordingly, we found that in BBR and VES, which have loamy soils with a distinct soil structure, MRP (but not MUP) leaching was only slightly increased when subjected to harsher drying. The elevated leaching of MRP is possibly an effect of both, the release of adsorbed inorganic P in the mineral soil (Butterly et al., 2009) and microbial P release (Dinh et al., 2017).
Taken together, our results suggest that the upshock, i.e., the change in soil water potential between desiccation and rewetting achieved in our experiment, was not the main driver behind the stimulated P leaching and that site properties had a stronger influence. Future DRW experiments should investigate the individual effects of drying intensity and rewetting rate by more intense upshocks.
Fast Rewetting Does Not Affect P Leaching More Than Slow Rewetting
Based on our results, we must reject our hypothesis (2) that P concentrations in leachate are elevated after fast rewetting compared to slower rewetting. Overall, rewetting time had very little effect on the P leakage in BBR. In VES, faster rewetting was associated with slightly increased MRP leaching, but had no effect on MUP and TP. LUE samples had lower MUP and TP concentrations and slightly higher MRP concentrations under fast rewetting than under slow rewetting. The fact that organic P leaching reacted to the rewetting rate mainly in the LUE samples, where the organic layer and its potentially mobilizable organic P pool are larger than in BBR (Hauenstein et al., 2018) and VES (Lang et al., 2017), underlines the role of dissolved organic matter for the translocation of organic P. This was also reflected in the higher DOC concentrations in LUE leachates than in BBR and VES. The comparatively low response of the BBR samples to the rewetting intensity can be explained by the lower mineralization rate and the higher storage capacity for nutrients at this site.
During fast rewetting of dried soil, water is more likely to pass the soil via macropores and leach particulate P (Makowski et al., 2020). In the loamy soils from BBR and VES, matrix retention of the irrigation water was higher under slow rewetting, which indicates a rapid passage of the irrigation water through macropores under fast rewetting. However, contrary to our expectations, this was not associated with higher leachate P concentrations (except for slightly increased MRP leaching in VES). Despite the occurrence of macropore flow, the BBR and VES soils apparently retained phosphorus effectively in the soil matrix. The high clay and sesquioxide contents seemingly allow effective physical adsorption and ligand exchange at exchange sites (Kalbitz et al., 2000) despite the rapid water movement. In the sandy LUE samples, with no visible signs of soil aggregation, MRP was, in agreement with our hypothesis, higher under fast than under slow rewetting. Resaturation of the mesocosms was achieved on average after 83 ml of irrigation after slow rewetting, but only after 166 ml under fast rewetting, which hints at the occurrence of preferential flow also in the highly water-conductive LUE soil.
More P Is Released Upon Rewetting From Soils With Low Sorption Capacity
In agreement with hypothesis (3), soil solution MRP, MUP and TP concentrations differed significantly between the sites. LUE, the site with the smallest P stock and the lowest sorption capacity, had leachate MUP und TP concentrations that were about a factor of two higher than in VES and BBR. However, TP and MUP leaching did not differ between the other two sites, BBR and VES, despite higher soil P stocks and sorption capacities in BBR. MRP concentrations were comparably low in LUE and BBR, and highest in leachates from VES. The generally very low P leaching from BBR has been linked to low release of P from organic matter (Hauenstein et al., 2018; Brödlin et al., 2019). In addition, the higher sorption capacity as well as a reduced apatite solubility in the less acidic BBR soil (Holzmann et al., 2016) may explain the lower P leaching from BBR than from VES.
This contrasts the findings of Holzmann et al. (2016); Brödlin et al. (2019), and Makowski et al. (2020), where MRP dominates leachates of mineral soil solution. The concentrations of leached MRP were low at all three sites, and generally lower than MUP.
The higher MRP concentrations in the VES soil leachates agree with findings of Julich et al. (2017), who observed higher shares of inorganic labile P in TP in O and A horizons from VES compared to BBR and LUE. The soil matrix in VES contains less sesquioxides than in BBR (see Table 1), which, together with the lower pH, explains the less strong binding of inorganic P to the soil matrix. Another possible cause for the comparatively high MRP concentrations in VES is the higher biological activity and thus potentially higher mobilization of inorganic P at this site. This is reflected in higher P leaf concentrations, lower Cmic/Pmic ratios, larger Porg/TP ratios and higher C stocks in the mineral soil compared to BBR and LUE (Lang et al., 2017). In addition, the bacterial community in VES is more diverse and less dominated by specialized taxa than in BBR and LUE (Bergkemper et al., 2016), which may favor the mineralization of organically bound P.
According to the Level II BRTs, an increasing field capacity (MESO_FC) decreased the leachate concentrations of MUP and TP, especially in LUE. This confirms the expectation that sites with low water storage capacity have a higher risk of P loss because of the concomitant reduced ability to retain soluble organic nutrients there. DOC concentrations, which are three to four times higher in LUE than in BBR and VES, explained large parts of the observed variance in the leachate P concentrations. LUE leachates had higher C/P ratios, which likely results from higher C/P ratios of the mineral soil, the soil organic matter and the microbiome at this site (Lang et al., 2017). In our data, Al, Fe and DON were highly correlated with DOC (R2: 0.82, 0.80, and 0.73, respectively) and thus also positively related to MUP and TP concentrations in leachate, but not with MRP. This is in line with the generally acknowledged simultaneous dynamics of MUP/TP and DOC as reflections of dissolved organic matter release, which increases upon physico-chemical solubilization and microbial breakdown, and decreases with mineral sorption (e.g., Kalbitz et al., 2000; Kaiser et al., 2003; Zederer and Talkner, 2018; Brödlin et al., 2019; Wanek et al., 2019).
Conclusion
We subjected mesocosms with young beech trees growing in approximately 20 cm undisturbed mineral soil plus organic layer to four consecutive DRW cycles. P concentrations in leachates decreased with each cycle. Neither the intensity of drying nor the rewetting rate affected the P leaching as hypothesized: Intensive drying or fast rewetting did not generally enhance P release. We found that an increasing water retention capacity of the soils led to decreasing P concentrations in the leachates. At all sites, MUP contributed predominantly to TP and more MUP and TP leached from the sandy site LUE than from the loamy soils from BBR and VES. The release of MUP and TP was best explained by released DOC. This indicates that the solubilization of organic matter, to some extent enhanced by DRW events, entails the release and translocation of organic P. This mobilized organic P may be mineralized and taken up by plants, or leached from the soil. These losses may be especially high in soils with a coarse texture that are in addition often inherently nutrient poor and where biological processes are critical to maintain P supply. Our results confirm previous findings that leaching of organic P can be a relevant source of potential P losses from ecosystems.
Data Availability Statement
The datasets generated for this study are available on request to the corresponding author.
Author Contributions
HP, JL, and LG designed the study and wrote the manuscript, with input from MV. LG, HP, MV, and JL collected samples. LG set up the DRW experiment and conducted the experiment with support from HP. LG and HP performed data analysis. All authors contributed to the article and approved the submitted version.
Funding
This work was funded by the German Research Foundation (DFG) as a part of the Priority Program 1685 “Ecosystem Nutrition: Forest Strategies for limited Phosphorus Resources” (grant no. PU 405/1-1), as well as by the Swiss National Science Foundation (SNF, grant no. 200021E-171172).
Conflict of Interest
The authors declare that the research was conducted in the absence of any commercial or financial relationships that could be construed as a potential conflict of interest.
Acknowledgments
We thank Joshua Braun-Wimmer and Roland Hoch for indispensable support during field work and throughout the whole process of experimental and data handling work. We also thank the laboratory workers at the FVA Freiburg for their dedicated analytical work and support. We also thank the two reviewers whose comments and suggestions helped improving and clarify this manuscript.
Supplementary Material
The Supplementary Material for this article can be found online at: https://www.frontiersin.org/articles/10.3389/ffgc.2021.543037/full#supplementary-material
References
Achat, D. L., Augusto, L., Gallet-Budynek, A., and Bakker, M. R. (2012). Drying-induced changes in phosphorus status of soils with contrasting soil organic matter contents–Implications for laboratory approaches. Geoderma 187, 41–48. doi: 10.1016/j.geoderma.2012.04.014
Annaheim, K. E., Rufener, C. B., Frossard, E., and Bünemann, E. K. (2013). Hydrolysis of organic phosphorus in soil water suspensions after addition of phosphatase enzymes. Biol. Fertil. Soils 49, 1203–1213. doi: 10.1007/s00374-013-0819-1
Bailey, V. L., Pries, C. H., and Lajtha, K. (2019). What do we know about soil carbon destabilization? Environ. Res. Lett. 14:083004. doi: 10.1088/1748-9326/ab2c11
Barnard, R. L., Blazewicz, S. J., and Firestone, M. K. (2020). Rewetting of soil: revisiting the origin of soil CO2 emissions. Soil Biol. Biochem. 147:107819. doi: 10.1016/j.soilbio.2020.107819
Bergkemper, F., Welzl, G., Lang, F., Krüger, J., Schloter, M., and Schulz, S. (2016). The importance of C, N and P as driver for bacterial community structure in German beech dominated forest soils. J. Plant Nutr. Soil Sci. 179, 472–480. doi: 10.1002/jpln.201600077
Birch, H. F. (1958). The effect of soil drying on humus decomposition and nitrogen availability. Plant Soil 10, 9–31. doi: 10.1007/bf01343734
Blackwell, M., Brookes, P., de la Fuente-Martinez, N., Murray, P., Snars, K., Williams, J., et al. (2009). Effects of soil drying and rate of re-wetting on concentrations and forms of phosphorus in leachate. Biol. Fertil. Soils 45, 635–643. doi: 10.1007/s00374-009-0375-x
Blackwell, M., Carswell, A., and Bol, R. (2013). Variations in concentrations of N and P forms in leachates from dried soils rewetted at different rates. Biol. Fertil. Soils 49, 79–87. doi: 10.1007/s00374-012-0700-7
Blackwell, M. S. A., Brookes, P. C., de la Fuente-Martinez, N., Gordon, H., Murray, P. J., Snars, K. E., et al. (2010). “Phosphorus solubilization and potential transfer to surface waters from the soil microbial biomass following drying–rewetting and freezing–thawing,” in Advances in Agronomy, Vol. 106, ed. D. L. Sparks (Cambridge, MA: Academic Press), 1–35. doi: 10.1016/s0065-2113(10)06001-3
Bol, R., Julich, D., Brödlin, D., Siemens, J., Kaiser, K., Dippold, M. A., et al. (2016). Dissolved and colloidal phosphorus fluxes in forest ecosystems—an almost blind spot in ecosystem research. J. Plant Nutr. Soil Sci. 179, 425–438. doi: 10.1002/jpln.201600079
Brödlin, D., Kaiser, K., Kessler, A., and Hagedorn, F. (2019). Drying and rewetting foster phosphorus depletion of forest soils. Soil Biol. Biochem. 128, 22–34. doi: 10.1016/j.soilbio.2018.10.001
Bünemann, E. K., Keller, B., Hoop, D., Jud, K., Boivin, P., and Frossard, E. (2013). Increased availability of phosphorus after drying and rewetting of a grassland soil: processes and plant use. Plant Soil 370, 511–526. doi: 10.1007/s11104-013-1651-y
Buston, P. M., and Elith, J. (2011). Determinants of reproductive success in dominant pairs of clownfish: a boosted regression tree analysis. J. Anim. Ecol. 80, 528–538. doi: 10.1111/j.1365-2656.2011.01803.x
Butterly, C. R., Bünemann, E. K., McNeill, A. M., Baldock, J. A., and Marschner, P. (2009). Carbon pulses but not phosphorus pulses are related to decreases in microbial biomass during repeated drying and rewetting of soils. Soil Biol. Biochem. 41, 1406–1416. doi: 10.1016/j.soilbio.2009.03.018
Chen, H., Jarosch, K. A., Mészáros, É, Frossard, E., Zhao, X., and Oberson, A. (2021). Repeated drying and rewetting differently affect abiotic and biotic soil phosphorus (P) dynamics in a sandy soil: a 33P soil incubation study. Soil Biol. Biochem. 153:108079. doi: 10.1016/j.soilbio.2020.108079
Chen, H., Lai, L., Zhao, X., Li, G., and Lin, Q. (2016). Soil microbial biomass carbon and phosphorus as affected by frequent drying–rewetting. Soil Res. 54, 321–327. doi: 10.1071/sr14299
Conant, R. T., Ryan, M. G., Ågren, G. I., Birge, H. E., Davidson, E. A., Eliasson, P. E., et al. (2011). Temperature and soil organic matter decomposition rates–synthesis of current knowledge and a way forward. Global Change Biol. 17, 3392–3404. doi: 10.1111/j.1365-2486.2011.02496.x
R Core Team (2019). R: A Language and Environment for Statistical Computing. Vienna: R Foundation for Statistical Computing.
Coumou, D., and Rahmstorf, S. (2012). A decade of weather extremes. Nat. Clim. Change 2, 491–496. doi: 10.1038/nclimate1452
De’Ath, G. (2007). Boosted trees for ecological modeling and prediction. Ecology 88, 243–251. doi: 10.1890/0012-9658(2007)88[243:btfema]2.0.co;2
Derville, S., Constantine, R., Baker, C., Oremus, M., and Torres, L. (2016). Environmental correlates of nearshore habitat distribution by the critically endangered maui dolphin. Mar. Ecol. Prog. Ser. 551, 261–275. doi: 10.3354/meps11736
Dinh, M.-V., Guhr, A., Spohn, M., and Matzner, E. (2017). Release of phosphorus from soil bacterial and fungal biomass following drying/rewetting. Soil Biol. Biochem. 110, 1–7. doi: 10.1016/j.soilbio.2017.02.014
Dinh, M.-V., Schramm, T., Spohn, M., and Matzner, E. (2016). Drying–rewetting cycles release phosphorus from forest soils. J. Plant Nutr. Soil Sci. 179, 670–678. doi: 10.1002/jpln.201500577
Elith, J., and Leathwick, J. (2017). Boosted Regression Trees for Ecological Modeling. R Documentation. Available online: http://citeseerx.ist.psu.edu/viewdoc/download?doi=10.1.1.1068.3627&rep=rep1&type=pdf (accessed January 31, 2019).
Elith, J., Leathwick, J. R., and Hastie, T. (2008). A working guide to boosted regression trees. J. Anim. Ecol. 77, 802–813. doi: 10.1111/j.1365-2656.2008.01390.x
Forber, K. J., Ockenden, M. C., Wearing, C., Hollaway, M. J., Falloon, P. D., Kahana, R., et al. (2017). Determining the effect of drying time on phosphorus solubilization from three agricultural soils under climate change scenarios. J. Environ. Qual. 46, 1131–1136. doi: 10.2134/jeq2017.04.0144
Forsmann, D. M., and Kjaergaard, C. (2014). Phosphorus release from anaerobic peat soils during convective discharge—effect of soil Fe: P molar ratio and preferential flow. Geoderma 223, 21–32. doi: 10.1016/j.geoderma.2014.01.025
Friedman, J. H., and Meulman, J. J. (2003). Multiple additive regression trees with application in epidemiology. Stat. Med. 22, 1365–1381. doi: 10.1002/sim.1501
Frossard, E., Condron, L. M., Oberson, A., Sinaj, S., and Fardeau, J. (2000). Processes governing phosphorus availability in temperate soils. J. Environ. Qual. 29, 15–23. doi: 10.2134/jeq2000.00472425002900010003x
Gao, D., Bai, E., Li, M., Zhao, C., Yu, K., and Hagedorn, F. (2020). Responses of soil nitrogen and phosphorus cycling to drying and rewetting cycles: a meta-analysis. Soil Biol. Biochem. 148:107896. doi: 10.1016/j.soilbio.2020.107896
George, T. S., Giles, C. D., Menezes-Blackburn, D., Condron, L. M., Gama-Rodrigues, A. C., Jaisi, D., et al. (2018). Organic phosphorus in the terrestrial environment: a perspective on the state of the art and future priorities. Plant Soil 427, 191–208. doi: 10.1007/s11104-017-3391-x
Greenwell, B., Boehmke, B., Cunningham, J., and Developers, G. (2019). gbm: Generalized Boosted Regression Models. Available online at: https://CRAN.R-project.org/package=gbm (accessed October 22, 2019).
Greenwell, B. M. (2017). pdp: an R Package for constructing partial dependence plots. R J. 9, 421–436. doi: 10.32614/rj-2017-016
Hantschel, R. E., Flessa, H., and Beese, F. (1994). An automated microcosm system for studying soil ecological processes. Soil Sci. Soc. Am. J. 58, 401–404. doi: 10.2136/sssaj1994.03615995005800020023x
Hauenstein, S., Neidhardt, H., Lang, F., Krüger, J., Hofmann, D., Pütz, T., et al. (2018). Organic layers favor phosphorus storage and uptake by young beech trees (Fagus sylvatica L.) at nutrient poor ecosystems. Plant Soil 432, 289–301. doi: 10.1007/s11104-018-3804-5
Heathwaite, A., and Dils, R. (2000). Characterising phosphorus loss in surface and subsurface hydrological pathways. Sci. Total Environ. 251, 523–538. doi: 10.1016/s0048-9697(00)00393-4
Hijmans, R. J., Phillips, S., Leathwick, J., and Elith, J. (2017). dismo: Species Distribution Modeling. Available online at:https://cran.r-project.org/web/packages/dismo/index.html (accessed May 15, 2019).
Hildebrand, E. E. (1994). The heterogeneous distribution of mobile ions in the rhizosphere of acid forest soils: facts, causes and consequences. J. Environ. Sci. Health Part A 29, 1973–1992. doi: 10.1080/10934529409376159
Holzmann, S., Missong, A., Puhlmann, H., Siemens, J., Bol, R., Klumpp, E., et al. (2016). Impact of anthropogenic induced nitrogen input and liming on phosphorus leaching in forest soils. J. Plant Nutr. Soil Sci. 179, 443.–453. doi: 10.1002/jpln.201500552
Hömberg, A., and Matzner, E. (2017). Effects of drying and rewetting on soluble phosphorus and nitrogen in forest floors: an experiment with undisturbed columns. J. Plant Nutr. Soil Sci. 181, 177–184. doi: 10.1002/jpln.201700380
Horn, R., and Taubner, H. (1989). Effect of aggregation on potassium flux in a structured soil. Z. Pflanz. Bodenkunde 152, 99–104. doi: 10.1002/jpln.19891520118
Julich, D., Julich, S., and Feger, K.-H. (2017). Phosphorus in preferential flow pathways of forest soils in Germany. Forests 8:19. doi: 10.3390/f8010019
Kaiser, K., Guggenberger, G., and Haumaier, L. (2003). Organic phosphorus in soil water under a European beech (Fagus sylvatica L.) stand in northeastern Bavaria, Germany: seasonal variability and changes with soil depth. Biogeochemistry 66, 287–310. doi: 10.1023/B:BIOG.0000005325.86131.5f
Kalbitz, K., Solinger, S., Park, J.-H., Michalzik, B., and Matzner, E. (2000). Controls on the dynamics of dissolved organic matter in soils: a review. Soil Sci. 165, 277–304. doi: 10.1097/00010694-200004000-00001
Khan, S. U., Hooda, P. S., Blackwell, M. S. A., and Busquets, R. (2019). Microbial biomass responses to soil drying-rewetting and phosphorus leaching. Front. Environ. Sci. 7:00133. doi: 10.3389/fenvs.2019.00133
Lang, F., Bauhus, J., Frossard, E., George, E., Kaiser, K., Kaupenjohann, M., et al. (2016). Phosphorus in forest ecosystems: new insights from an ecosystem nutrition perspective. J. Plant Nutr. Soil Sci. 179, 129–135. doi: 10.1002/jpln.201500541
Lang, F., Krüger, J., Amelung, W., Willbold, S., Frossard, E., Bünemann, E. K., et al. (2017). Soil phosphorus supply controls P nutrition strategies of beech forest ecosystems in Central Europe. Biogeochemistry 136, 5–29. doi: 10.1007/s10533-017-0375-0
Makowski, V., Julich, S., Feger, K.-H., and Julich, D. (2020). Soil phosphorus translocation via preferential flow pathways: a comparison of two sites with different phosphorus stocks. Front. For. Glob. Change 3:00048. doi: 10.3389/ffgc.2020.00048
Malitz, G., and Ertel, H. (2015). KOSTRA-DWD-2010, Starkniederschlagshöhen für Deutschland (Bezugszeitraum 1951 bis 2010). Abschlussbericht, Deutscher Wetterdienst (DWD). Offenbach: Abteilung Hydrometeorologie.
Meier, I., and Leuschner, C. (2014). Nutrient dynamics along a precipitation gradient in European beech forests. Biogeochemistry 120, 51–69. doi: 10.1007/s10533-014-9981-2
Meisner, A., Leizeaga, A., Rousk, J., and Bååth, E. (2017). Partial drying accelerates bacterial growth recovery to rewetting. Soil Biol. Biochem. 112, 269–276. doi: 10.1016/j.soilbio.2017.05.016
Meisner, A., Rousk, J., and Bååth, E. (2015). Prolonged drought changes the bacterial growth response to rewetting. Soil Biol. Biochem. 88, 314–322. doi: 10.1016/j.soilbio.2015.06.002
Meller, S., Frossard, E., and Luster, J. (2019). Phosphorus allocation to leaves of beech saplings reacts to soil phosphorus availability. Front. Plant Sci. 10:744. doi: 10.3389/fpls.2019.00744
Messing, I., Joel, A., Wesström, I., and Strock, J. (2015). Influence of higher rain intensities on phosphorus movements in the upper half meter of macroporous clay soil. Acta Agri. Scand. B Soil Plant Sci. 65, 93–99. doi: 10.1080/09064710.2014.996588
Missong, A., Holzmann, S., Bol, R., Nischwitz, V., Puhlmann, H., von Wilpert, K., et al. (2018). Leaching of natural colloids from forest topsoils and their relevance for phosphorus mobility. Sci. Total Environ. 634, 305–315. doi: 10.1016/j.scitotenv.2018.03.265
Odum, E. P. (1969). The strategy of ecosystem development. Science 164, 262–270. doi: 10.1126/science.164.3877.262
Pezzolla, D., Cardenas, L. M., Mian, I. A., Carswell, A., Donovan, N., Dhanoa, M. S., et al. (2019). Responses of carbon, nitrogen and phosphorus to two consecutive drying–rewetting cycles in soils. J. Plant Nutr. Soil Sci. 182, 217–228. doi: 10.1002/jpln.201800082
Schimel, J. P. (2018). Life in dry soils: effects of drought on soil microbial communities and processes. Ann. Rev. Ecol. Evol. Syst. 49, 409–432. doi: 10.1146/annurev-ecolsys-110617-062614
Schlotter, D., Schack-Kirchner, H., Hildebrand, E. E., and von Wilpert, K. (2012). Equivalence or complementarity of soil-solution extraction methods. J. Plant Nutr. Soil Sci. 175, 236–244. doi: 10.1002/jpln.201000399
Sinaj, S., Stamm, C., Toor, G. S., Condron, L. M., Hendry, T., Di, H. J., et al. (2002). Phosphorus exchangeability and leaching losses from two grassland soils. J. Environ. Qual. 31, 319–330. doi: 10.2134/jeq2002.3190
Sohrt, J., Lang, F., and Weiler, M. (2017). Quantifying components of the phosphorus cycle in temperate forests. Wiley Interdiscip. Rev. Water 4:e1243. doi: 10.1002/wat2.1243
Sutcliffe, P. R., Mellin, C., Pitcher, C. R., Possingham, H. P., and Caley, M. J. (2013). Regional-scale patterns and predictors of species richness and abundance across twelve major tropical inter-reef taxa. Ecography 37, 162–171. doi: 10.1111/j.1600-0587.2013.00102.x
Thaysen, E. M., Jessen, S., Ambus, P., Beier, C., Postma, D., and Jakobsen, I. (2014). Technical note: mesocosm approach to quantify dissolved inorganic carbon percolation fluxes. Biogeosciences 11, 1077–1084. doi: 10.5194/bg-11-1077-2014
Trenberth, K. E. (2011). Changes in precipitation with climate change. Clim. Res. 47, 123–138. doi: 10.3354/cr00953
Turner, B. L., Driessen, J. P., Haygarth, P. M., and Mckelvie, I. D. (2003). Potential contribution of lysed bacterial cells to phosphorus solubilisation in two rewetted Australian pasture soils. Soil Biol. Biochem. 35, 187–189. doi: 10.1016/s0038-0717(02)00244-4
Turner, B. L., and Haygarth, P. M. (2001). Biogeochemistry: phosphorus solubilization in rewetted soils. Nature 411:258. doi: 10.1038/35077146
Turner, B. L., and Haygarth, P. M. (2003). Changes in bicarbonate-extractable inorganic and organic phosphorus by drying pasture soils. Soil Sci. Soc. Am. J. 67, 344–350. doi: 10.2136/sssaj2003.3440
Uhlig, D., and von Blanckenburg, F. (2019). How slow rock weathering balances nutrient loss during fast forest floor turnover in montane, temperate forest ecosystems. Front. Earth Sci. 7:159. doi: 10.3389/feart.2019.00159
Vogt, R., and Matschonat, G. (1997). Patterns of soil solution composition in acid forest soils: differences between undisturbes and bulk samples. Z. Pflanz. Bodenkunde 160, 549–554. doi: 10.1002/jpln.19971600505
Wanek, W., Zezula, D., Wasner, D., Mooshammer, M., and Prommer, J. (2019). A novel isotope pool dilution approach to quantify gross rates of key abiotic and biological processes in the soil phosphorus cycle. Biogeosciences 16, 3047–3068. doi: 10.5194/bg-16-3047-2019
Weihrauch, C., and Opp, C. (2018). Ecologically relevant phosphorus pools in soils and their dynamics: the story so far. Geoderma 325, 183–194. doi: 10.1016/j.geoderma.2018.02.047
WRB (2015). World Reference Base for Soil Resources 2014, Update 2015: International Soil Classification System for Naming Soils and Creating Legends for Soil Maps. Rome: FAO, 192.
Wu, J., and Brookes, P. C. (2005). The proportional mineralisation of microbial biomass and organic matter caused by air-drying and rewetting of a grassland soil. Soil Biol. Biochem. 37, 507–515. doi: 10.1016/j.soilbio.2004.07.043
Zavišić, A., and Polle, A. (2017). Dynamics of phosphorus nutrition, allocation and growth of young beech (Fagus sylvatica L.) trees in P-rich and P-poor forest soil. Tree Physiol. 38, 37–51. doi: 10.1093/treephys/tpx146
Zederer, D. P., and Talkner, U. (2018). Organic P in temperate forest mineral soils as affected by humus form and mineralogical characteristics and its relationship to the foliar P content of European beech. Geoderma 325, 162–171. doi: 10.1016/j.geoderma.2018.03.033
Zwiers, F. W., Alexander, L. V., Hegerl, G. C., Knutson, T. R., Kossin, J. P., Naveau, P., et al. (2013). “Climate extremes: challenges in estimating and understanding recent changes in the frequency and intensity of extreme climate and weather events,” in Climate Science for Serving Society: Research, Modeling and Prediction Priorities, eds G. R. Asrar and J. W. Hurrell (Dordrecht: Springer Netherlands), 339–389. doi: 10.1007/978-94-007-6692-1_13
Keywords: phosphorus leaching, drying-rewetting, temperate beech forest, undisturbed soil columns, mesocosm, dissolved organic carbon, boosted regression trees
Citation: Gerhard L, Puhlmann H, Vogt M and Luster J (2021) Phosphorus Leaching From Naturally Structured Forest Soils Is More Affected by Soil Properties Than by Drying and Rewetting. Front. For. Glob. Change 4:543037. doi: 10.3389/ffgc.2021.543037
Received: 15 March 2020; Accepted: 19 April 2021;
Published: 13 May 2021.
Edited by:
Sebastian Loeppmann, Christian-Albrechts-Universität zu Kiel, GermanyReviewed by:
Antra Boca, Latvia University of Agriculture, LatviaPer Marten Schleuss, University of Bayreuth, Germany
Copyright © 2021 Gerhard, Puhlmann, Vogt and Luster. This is an open-access article distributed under the terms of the Creative Commons Attribution License (CC BY). The use, distribution or reproduction in other forums is permitted, provided the original author(s) and the copyright owner(s) are credited and that the original publication in this journal is cited, in accordance with accepted academic practice. No use, distribution or reproduction is permitted which does not comply with these terms.
*Correspondence: Lukas Gerhard, bC5nZXJoYXJkQHBvc3Rlby5kZQ==