 Alexis Garretson
 Rebecca E. Forkner
- 1Department of Biology, George Mason University, Fairfax, VA, United States
- 2Graduate School of Biomedical Sciences, Tufts University, Boston, MA, United States
- 3The Jackson Laboratory, Bar Harbor, ME, United States
Recent studies suggest climate-related delays in the timing of leaf coloration and abscission in maple trees but lack baseline data prior to the late 20th century. To better understand how autumn foliar phenology and late-season damage risks have changed for this genus over the past century, we evaluated 2,972 digitized herbaria specimens of red and sugar maple collected between 1826 and 2016 for the presence of leaves, autumn leaf coloration, and pathogen or herbivore damage. We found that the onset (first appearance) of colored leaves has shifted 0.26 days later each year, leading to a delay of more than a month in autumn phenology since 1880. We find that these shifts are related to precipitation regimes in both the fall and summer seasons and that more severe droughts are associated with higher probabilities of colored leaves. Moreover, we found that the probability of both herbivory and pathogen damage has increased significantly over the study period. In particular, we find a strong association between increasing summer drought conditions and increased probability of herbivory. Furthermore, the presence of foliar damage increased the probability of leaf coloration on herbaria specimens. However, the end-of-season abscission date (last appearance of leaves) was strongly associated with herbivory and climate in a contrary direction: Increasing yearly drought, higher fall temperatures, and the presence of herbivory were associated with earlier abscission. In fact, the last leaf dates for specimens with herbivory were nearly 2 weeks earlier than specimens without herbivore damage. Our study documents significant changes in maple senescence over the last 150 years and suggests that incorporating herbivory into models may improve our ability to predict forest responses to climate shifts.
Introduction
Consistently, scientists find that climate change has lengthened the growing season of deciduous forests by advancing spring leaf out (Badeck et al., 2004; Wolfe et al., 2005; Menzel et al., 2006; Polgar and Primack, 2011; Wolkovich et al., 2012; Ellwood et al., 2013). However, findings for autumn phenology have varied, with some suggesting temperature-related advancements in leaf senescence and abscission (Zani et al., 2020), while others report delays (Norby et al., 2003; Chen et al., 2020). The length of individual studies may contribute to different findings. Short term experiments show a delay of autumnal leaf senescence and abscission for some species, such as maple, in response to soil warming and increasing ambient temperatures (Norby et al., 2003; Wheeler et al., 2016). Remote sensing studies also document a later end to the vegetation growing season of approximately 5 days since the 1980s (Liu et al., 2016). However, remote sensing-derived vegetation data are not available prior to the late 20th century (National Research Council, 2008; Ustin and Gamon, 2010), limiting the utility of these methods to elucidate long-term trends. In addition, long-term ecological studies of phenology are still relatively rare, so current field studies may not be able to detect slowly developing environmental changes (Magnuson, 1990; Hobbie et al., 2003). Because of the limited temporal scope of studies, many questions remain about the responses of forest ecosystems, including how long climate stress has been influencing forest phenology and if the rate is increasing in current years.
Because a significant number of herbaria and museum specimens were collected before the intensification of anthropogenic climate change, such specimens can provide a baseline for investigating the impacts of environmental change on trends of plant phenology (Primack et al., 2004; Everill et al., 2014; Yost et al., 2018) and species interactions (Coleman and Seybold, 2011; Beauvais et al., 2017; Meineke et al., 2019). Preserved specimens provide an opportunity to look at a longer, more detailed time series of plant phenology than remote-sensing data. For example, they may provide species-specific information missing from satellite measures that estimate the phenology of the canopy tree community as a whole. Studies using preserved specimens to investigate phenological changes are increasing as digitization enables access to large volumes of preserved specimens (Calinger et al., 2013; Davis et al., 2015; Besnard et al., 2018; Garretson, 2021). However, published studies focus on spring and summer flowering times and only a handful address autumn phenology (Forkner, 2013; Gallinat et al., 2015; Zani et al., 2020) and species interactions (Lavoie, 2013; Jones and Daehler, 2018; Meineke et al., 2018; Heberling and Isaac, 2019; Lang et al., 2019). Highly detailed studies that have examined leaf senescence have been limited to a few recent years (Panchen et al., 2015).
Herbaria specimens may confirm patterns of change but can also provide additional information missing from historical data by documenting insect and pathogen damage or plant morphological change. Thus, herbaria specimens can help in an overlooked area of phenology: the role of biotic factors and species interactions in augmenting or offsetting abiotic drivers. Insect damage, for instance, can cause greenfall or advance senescence (Forkner, 2013). Warming is generally expected to increase insect abundance, growth, and survival, particularly in temperate and boreal climates (Bale et al., 2002; Deutsch et al., 2008; Kingsolver et al., 2013) and, thus, also insect damage. However, at lower latitudes and in areas with higher average temperatures, summer temperatures may exceed insect thermal optima and reduce fitness or abundance (Deutsch et al., 2008). Furthermore, increasing summer and winter temperatures may have counteracting impacts on insect populations depending on the timing of insect life-history traits such as diapause, pupation, overwintering stage, or egg hatch. Winter temperatures have increased more than other seasons, which may be critical in changing insect survival and fitness (Bale et al., 2002; Elad and Pertot, 2014). Climate change studies of insects of forest trees have focused primarily on invasive species, outbreaking insects that can cause full-scale tree species loss, and on insect population dynamics. These studies rarely investigate insects as drivers of plant phenological processes. Like drought and high temperature, herbivory stress may alter plant physiology in ways that may impact autumn phenology. We do not have precise predictions because there are few experimental studies of this phenomenon (Belovsky and Slade, 2000; Forkner, 2013), but there is evidence from herbaria specimens that insect damage is increasing on plants (Meineke et al., 2019).
Climate change is also likely to alter plant viral, fungal, and bacterial epidemics in a variety of ways. Studies show more intense pathogen outbreaks depending on pathogen-specific and host-specific characteristics (Ayres and Lombardero, 2000; Dale et al., 2001; Dukes et al., 2009; Jones and Barbetti, 2012; Jactel et al., 2012). Because host plants, insects, and pathogens will each be impacted differently by climate change, ecologists expect significant regional and species-specific changes in the type, intensity, and spatial distribution of plant damage (Shaw and Osborne, 2011; West et al., 2012; Chakraborty, 2013; Juroszek and von Tiedemann, 2013; Elad and Pertot, 2014; Garrett et al., 2016). Regardless of the type of damage, however, deciduous trees may prematurely abscise damaged leaves, change the timing of leaf maturation or bud or shoot production, or increase autumn pigmentation in response to damage (Williams-Linera and Baltazar, 2001; Forkner, 2013; Zvereva and Kozlov, 2014).
The impacts of interactions between abiotic and biotic forces on autumn phenology are likely to be complex. Difficulties in predicting separate impacts and their consequences complicate efforts to forecast changes in forest phenology. Specific trends in drought persistence and frequency are unclear (Dai et al., 2004; Huntington, 2006; Sheffield et al., 2012; Dai, 2013; Trenberth et al., 2014). Continued climate change will likely lead to increased drought (Cook et al., 2015; Touma et al., 2015) and, thus, to water stress in forest trees. Autumn coloration in deciduous trees may be delayed in response to summer drought stress (Xie et al., 2018b), while autumn drought leads to more species-specific responses. In one study, drought delayed peak coloration for A. rubrum but advanced autumn color in A. saccharum (Xie et al., 2018a). Drought and general changes in precipitation frequency and amount also influence mortality and morbidity of trees due to subsequent changes in herbivory and pathogen damage (Dale et al., 2001; Jactel et al., 2012; Marquis et al., 2019). Moderate water stress may benefit some herbivores, including leaf chewers or specialist leaf miners (Gely et al., 2020). Outcomes vary for particular pathogens, with some pathogens decreasing with drought and others increasing (Desprez-Loustau et al., 2006). Estimates of the impacts of drought on leaf senescence, the impacts of herbivores and pathogens on senescence, and the interactions of these factors are necessary to model future changes in tree autumn phenology.
To establish long-term patterns for both abiotic and biotic stressors on autumn phenology and determine whether insect and pathogen damage have changed with climate warming, we examined herbaria specimens of red and sugar maples collected over the past two centuries. Here we investigate associations of temperature, drought, herbivory, and pathogen damage on the timing of leaf abscission and senescence for maples in the eastern United States between 1826 and 2016. We documented changes in the leaf area removed and other types of damage on herbaria specimens and related these to abiotic factors over the collection dates to determine if herbivory and damage were associated with alterations in the magnitude and direction of shifts in autumn phenology.
Materials and Methods
Study Species
Acer rubrum and Acer saccharum (Sapindaceae) are ideal species to evaluate long term climate changes, herbivory, and pathogens using herbaria specimens because they (1) are widespread, abundant, and native to much of the eastern and central United States, (2) have unmistakable leaf shapes that reduce errors of identification and facilitate identification of herbivore damage, and (3) are well represented in herbaria collections in most months. Additionally, the tendency of these species to have red (anthocyanin and carotenoid) autumn coloration meant a higher likelihood of detecting this phenophase compared to other autumn colors, as dried specimens tend to brown, not produce red or orange color, after collection. Both species are medium to tall (20 to 40 meters) deciduous hardwoods with lifespans of 200 to 400 years (Loehle, 1988; Lorimer et al., 2004). Both have distinct, early season flowering and fruiting phenologies, producing flowers and samaras from March to April. Acer rubrum is one of the earliest flowering hardwoods and is more tolerant than A. saccharum of wet soils and high temperatures. The species show slight differences in autumn coloration timing, with A. saccharum senescing slightly later than A. rubrum (Archetti et al., 2013). Both show yellow to orange-red or bright red autumn color, with research suggesting phenotypic variation in the red intensity related to temperature (Xie et al., 2018a) and foliar nitrogen (Schaberg et al., 2003) for A. saccharum. Pathogens of A. rubrum and A. saccharum include tar spot fungi (Rhytisma spp.) and several fungi that cause anthracnose or other fungal rot (e.g., Colletotrichum, Discula, Kabatiella, and Phyllosticta). While the diversity of maples herbivores is lower than that of other dominant deciduous trees of the region, such as white oak (Quercus alba) (Marquis et al., 2019), several Lepidoptera of varying phenology cause notable chewing damage, including early season Tortricidae (Archips, Choristoneura, and Sparganothis) and Lasiocampidae (Malacosoma disstria Hübner), early and mid-season Geometridae and Noctuidae, and late-season Noctuidae (Acronicta and Morrisonia), Notodontidae (Heterocampa and Symmerista), and Saturniidae (Dryocampa rubicunda Fabricius). However, of note for this study is that damage by one Hymenoptera, the maple eyespot gall [Acericecis ocellaris (Osten Sacken), Cecidomyiidae] was difficult to distinguish from fungal spot pathogens in older herbaria specimens.
Herbaria Data
We queried the Southeast Regional Network of Expertise and Collections (SERNEC; Gries et al., 2014; Zomlefer et al., 2017) for digitized specimens of A. rubrum and A. saccharum from the Central and North Eastern United States. Our query yielded 3,214 records distributed across 644 counties in Connecticut, Delaware, the District of Columbia, Illinois, Indiana, Kentucky, Maine, Maryland, Massachusetts, New Hampshire, New Jersey, New York, North Carolina, Ohio, Pennsylvania, Rhode Island, Tennessee, Vermont, Virginia, and West Virginia (Figure 1). These specimens were sourced from 50 collections: ALA, APSC, AVCH, BCWS, BOON, CHIC, CMC, CONV, DBG:KHD, DEK, DES, DOV, DSC, EIU, EKY, F:Botany, FLAS, FSU, FUGR, GEO, GMUF:Plants, GSW, HCHM, iNaturalist, IND, KNK, LSU:Vascular Plants, LYN, MARY, MO, MOR, MUHW, NCSC, NCU, NY, SWMT, TENN, UCAC, UNCC, UNM, USCH, USCS, USMS, USU:UTC, UT:Botany, UTM, UWFP, VPI, VSC, and WCUH. Specimen dates ranged from 1826 to 2016. We then visually examined each record to verify the databased metadata using the specimen label data, focusing specifically on verifying the species, county of collection, and collection date. We excluded specimens without a month or year of collection, as well as specimens without a documented collection state or county of collection, from further analysis. We then georeferenced all points to the county centroid because only 17 specimens (0.5%) had exact GPS points at the time of data export. The number of records per county ranged from 1 to 41 specimens, with an average of 4.5 records per county (Figure 1). Additionally, we excluded specimens without visible pressed plants (e.g., those that included only seed packets or envelope preparations) or specimens with too poor an image quality to be characterized. Finally, we excluded specimens that mentioned being grown in a greenhouse or cultivated specimens to focus on wild specimens.
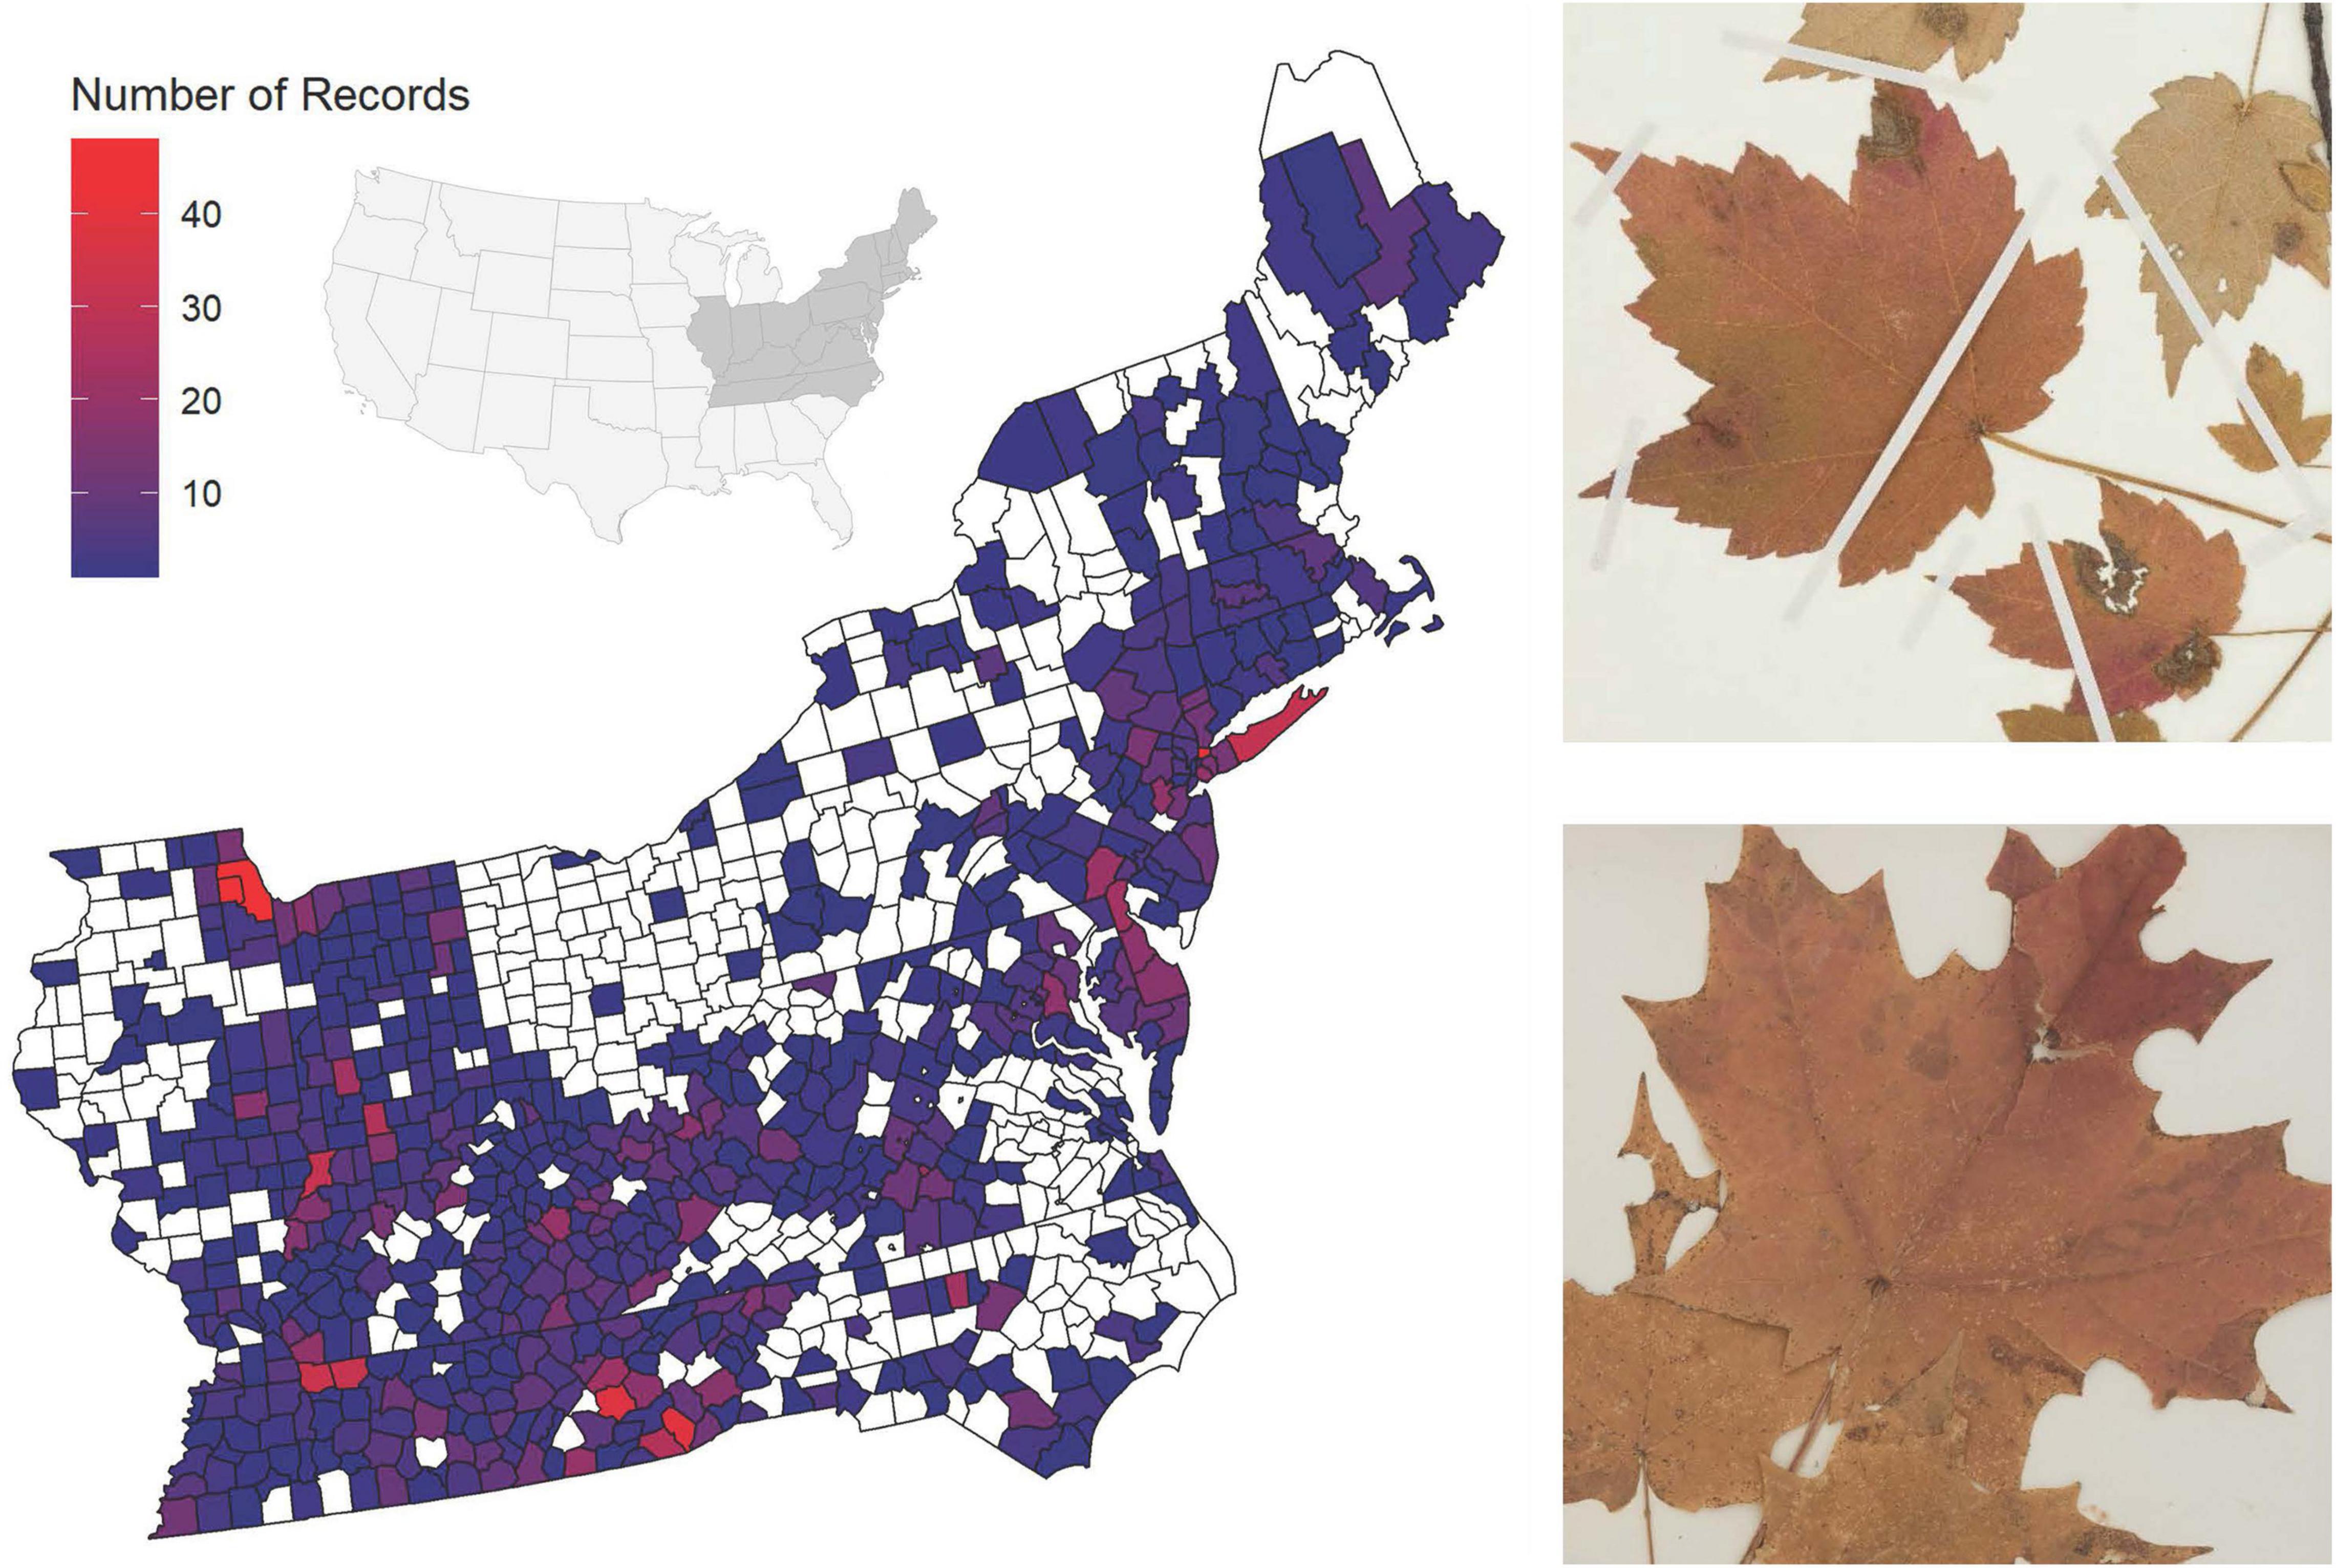
Figure 1. (Left) Map of the eastern United States with counties colored by the number of herbaria specimens of Acer rubrum or Acer saccharum collected. The inset map details the location of the sampled states (dark gray) in the greater United States. White counties indicate counties with no specimens. (Right) representative images of a specimen with colored leaves and other damage from 1915 (top) and a specimen of colored leaves with herbivore chewing damage from 1891 (bottom).
We visually annotated the remaining images for the presence or absence of leaves and colored leaves following the Nature’s Notebook protocols for species-specific phenophase definitions and protocols described by Denny et al. (2014; Figure 1). These were developed for observations made on living plants, so phenophases are often excluded from analyses if the target plant part is dried or wilted. However, drying and wilting occur in the preservation of herbaria specimens, so we did not exclude these specimens in our scoring protocol. In our protocols, we annotated all evidence of red, yellow, or orange coloration as “colored leaves,” and any evidence of leaves as “leaves,” regardless of the collection date as the retention of leaves over winter could not be differentiated, and all efforts were taken not to bias phenophase assignment by the collection date. Described in Denny et al. (2014), the definition for colored leaves was: “One or more leaves show some of their typical late-season color (red, yellow, or orange) due to drought or other stresses. Do not include small spots of color due to minor leaf damage.” The definition for leaves was: “One or more live, unfolded leaves are visible on the plant. A leaf is considered unfolded once its entire length has emerged from a breaking bud, stem node or growing stem tip, so that the leaf stalk (petiole) or leaf base is visible at its point of attachment to the stem.” We also evaluated each specimen for the presence of leaf area removal caused by chewing damage by herbivores with mandibles, likely including primarily larval sawflies, butterflies, and moths (Hymenoptera and Lepidoptera), grasshoppers and allies (Orthoptera and Phasmid), and beetles (Coleoptera) (Figure 1). Leaf area removal was assessed because it is the most common type of herbivory easily recorded from herbaria specimens (Meineke and Davies, 2019; Meineke et al., 2019) and because it is the subject of most ecological studies on herbivory (Turcotte et al., 2014). Additionally, we annotated specimens for evidence of other pathogen damage, including bacterial, fungal, viral, or herbivore damage other than leaf area removal, but excluding damage due to pressing or tearing of leaves that may occur in the preservation of specimens.
We also excluded specimens from the same location, date, and collector with the same phenological and damage status to prevent overrepresentation bias based on collecting trips. Using a bias detection method similar to Meineke et al. (2019), we analyzed a subset of our data including only specimens from collectors that collected five or more specimens, a total of 62 collectors, and tested the effect of the collector on coloration, herbivory, and other damage using ANOVA. We found no evidence of collector bias in coloration collection patterns (F = 1.19, P = 0.153), but contrary to Meineke et al. (2019), we did find limited evidence of collector bias in the collection of damaged specimens. While changes to collection practices over time could confound assessments of foliar damage over time, we found this bias in collectors was not related to the mean year in which they collected or focused in earlier or later collectors, but rather was related to their season of collection. Specifically, collectors who differentially collected damaged specimens had later mean collection dates, and collectors who had differential collected undamaged specimens had earlier mean collection days of year. Regardless, we do not expect variation in collection preferences to vary by the variables of interest (e.g., we do not expect collectors in different localities or climates to show different biases), but as collectors are known to prefer collecting perfect specimens, our analyses likely show conservative or underestimates total foliar damage.
Climate Data
For specimens collected after 1895, we extracted mean annual and maximum fall (September to November) temperatures and precipitation at the county centroid from the Parameter-elevation Regressions on Independent Slopes Model (PRISM) Climate Data Explorer (PRISM Climate Group, 2020) for the year of collection. The annual temperatures included both daytime and nighttime data in mean temperature determinations. If the specimen was collected before September, the temperatures and precipitations were used from the fall of the prior year. Additionally, for each of the 644 counties included in the specimen dataset, 30-year normals (1981–2010) were extracted. We compared actual rainfall over the course of the year and specifically during the summer months to the yearly and summer rainfall normals by calculating The Standardized Precipitation Index (SPI; McKee et al., 1993). The SPI is the number of standard deviations by which the observed cumulative precipitation deviates from the climatological average. Positive values indicate wetter conditions compared to previous years, whereas negative values indicate drier years. As the baseline, we used county-specific average monthly precipitation values over the 75 years from 1895–1970, as a comparison period of greater than 50 years is recommended (Guttman, 1999). As part of the PRISM export, we also extracted elevations for each of the locations. We excluded a total of 78 specimens collected before 1895 from climate-related analyses because PRISM does not have stable climate data available before 1895, and we excluded an additional 13 specimens that could not be georeferenced to county-level.
Statistical Analysis
We performed all analyses in R (version 4.0.2, R Core Team, 2016) with RStudio (version 1.2.5033, RStudio Team, 2020). Because phenology is a cyclical phenomenon that spans the end of the calendar year, evaluating phenophases at the end of the year linearly can lead to unintuitive results (Morellato et al., 2010; Pabon-Moreno et al., 2020). Because we are focused on autumn phenology, we shifted dates occurring before the approximate spring equinox (day 79, March 20th) to the end of the time series by adding 365, creating a new time series spanning from day of year 79 to 444. This modification allows for end dates of fall phenophases to extend into the following year without circular disruption (Figure 2).
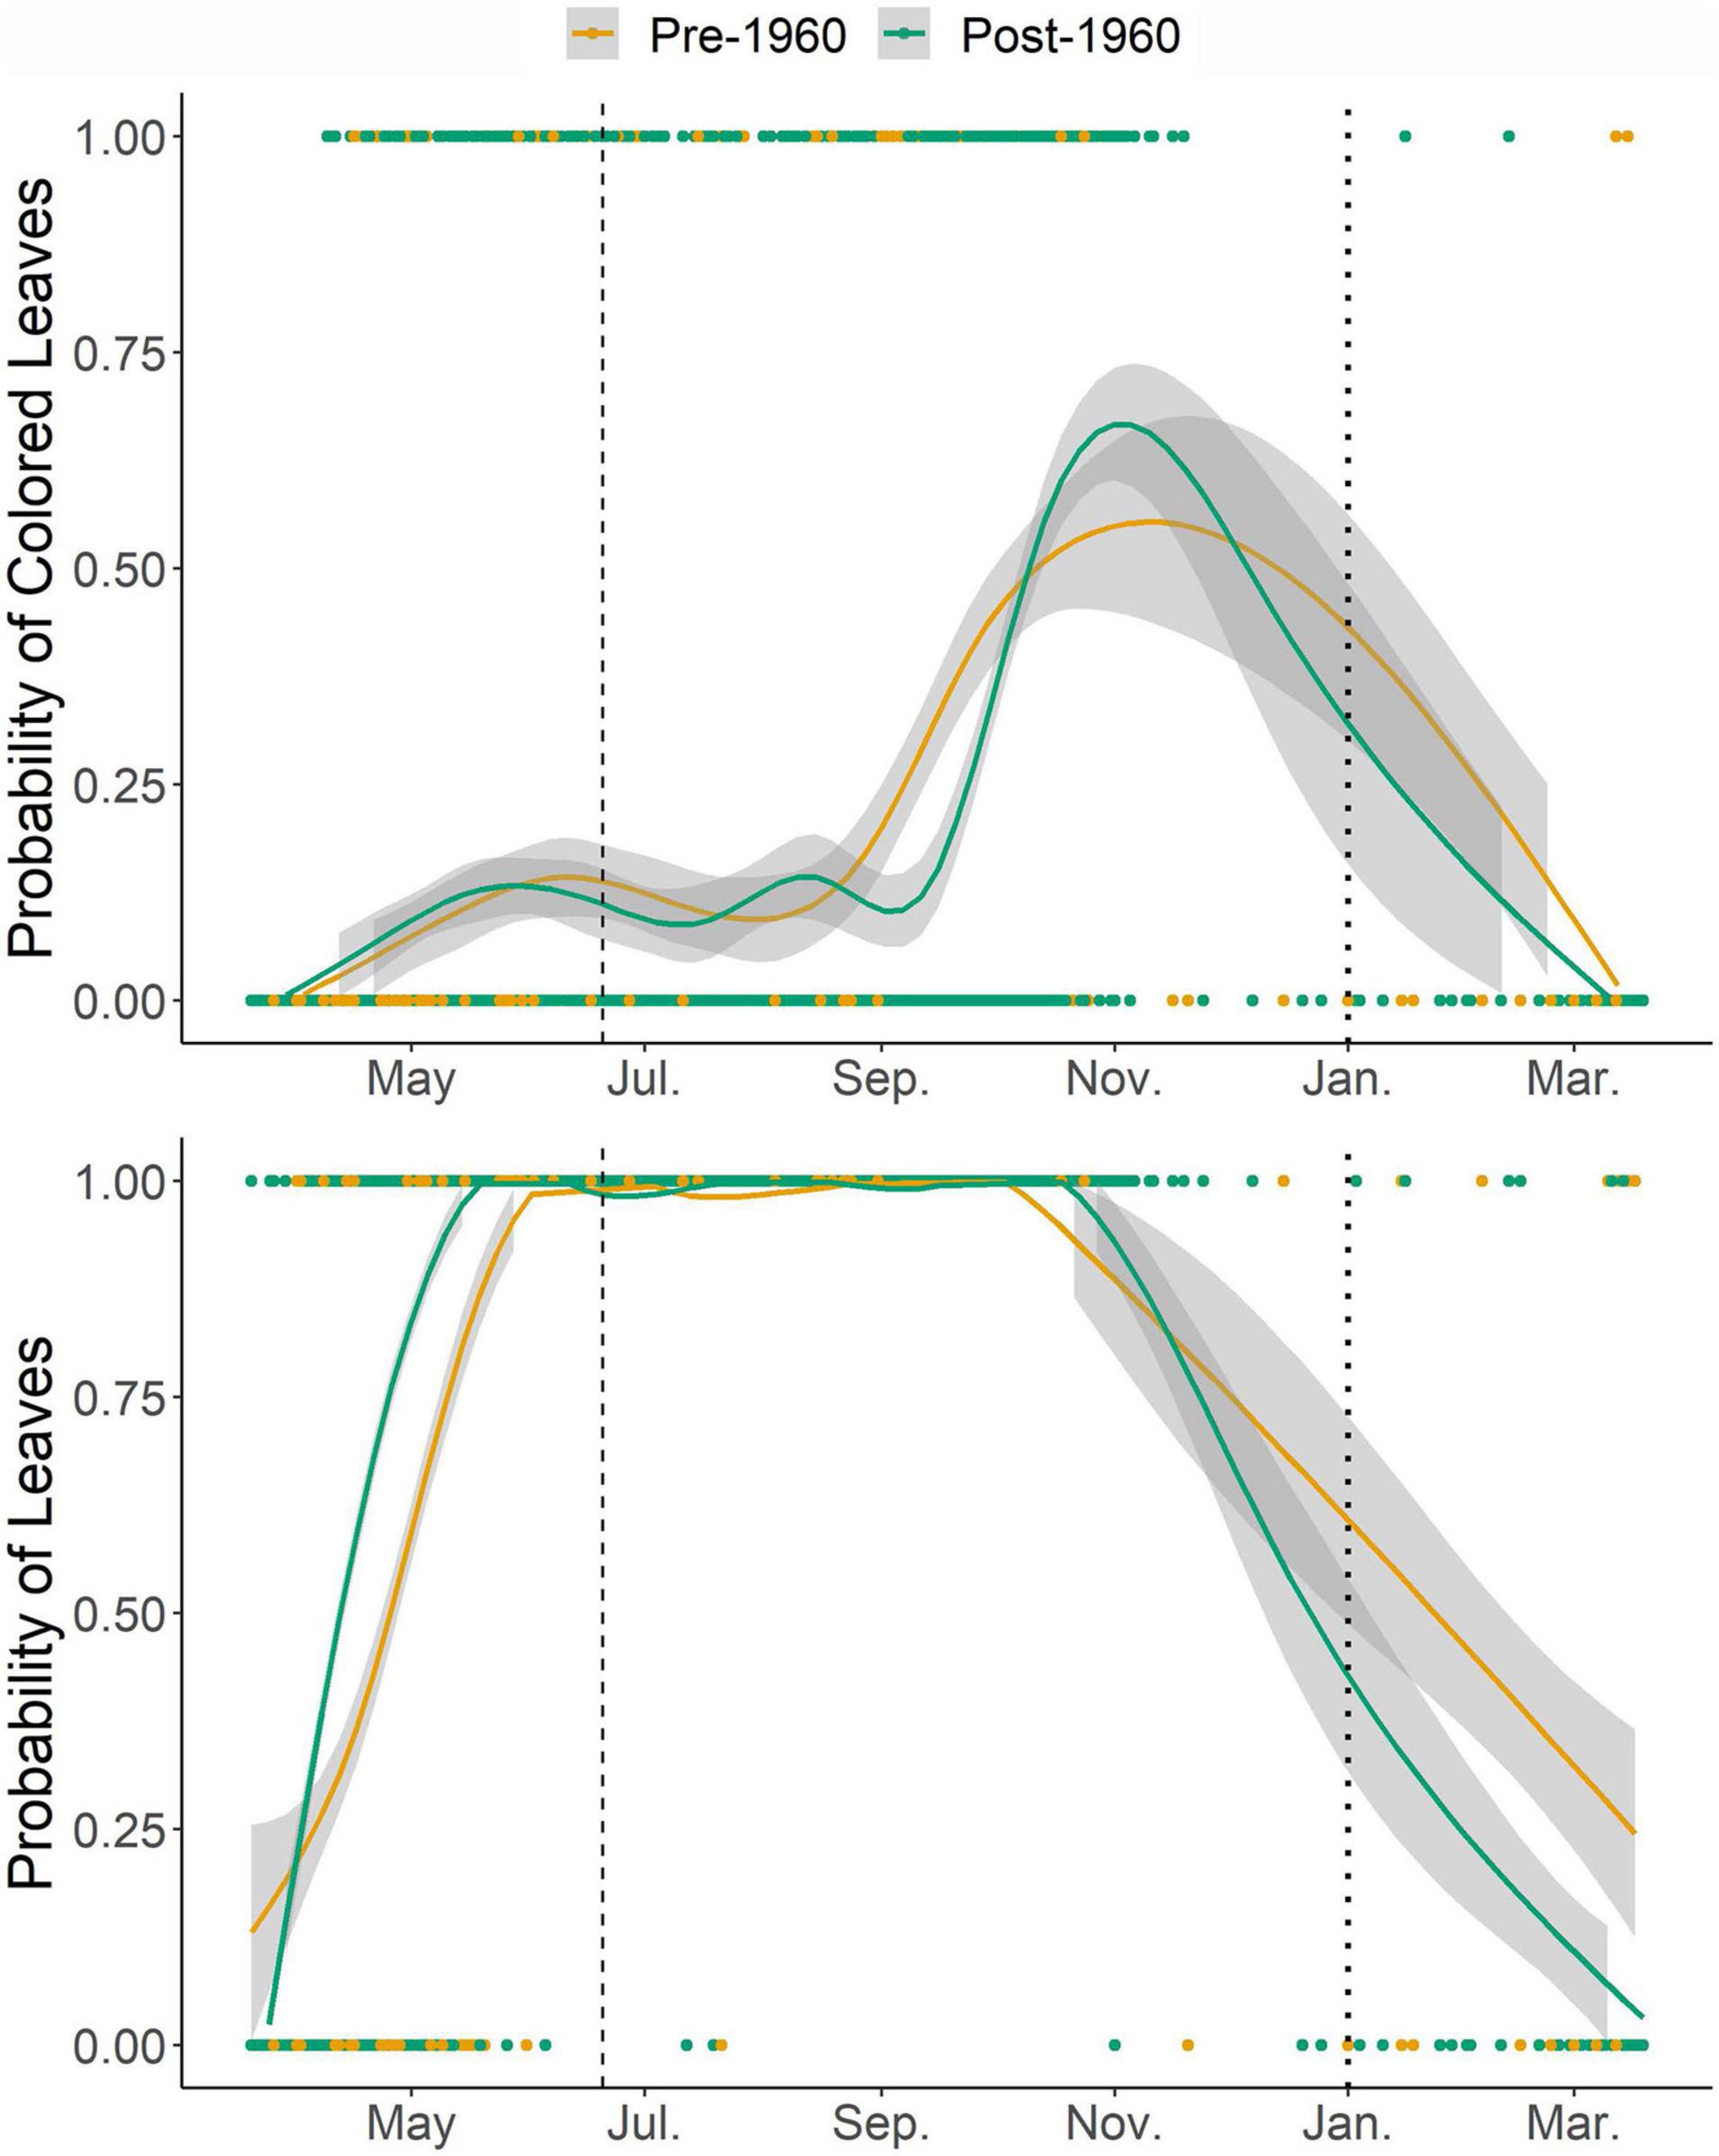
Figure 2. Plot of the probability of a given specimen collected on a particular day of year containing colored leaves (top) or leaves (bottom). Points are colored by whether the specimen was collected prior to 1960 or after 1960, and lines are LOWESS best fit curves with a shaded area showing 95% confidence intervals. The vertical dashed line is at the approximate summer solstice (day of year 115). To prevent circularity in the analyses, we shifted all dates prior to the approximate spring equinox (day of year 79) to the end of the year by adding 365 days, so the dotted vertical line marks the new location of January 1st. Data were not analyzed as pre- and post-1960 but are graphed as such to visualize shifts in phenology over the time period.
To identify shifts in the timing of abscission and coloration, we analyzed the last day of year in each year in which any specimen showed the presence of leaves (a measure of end of the growing season) and the first day of year in each year with any specimen with presence of colored leaves (a measure of onset of senescence). We realize these first- and last-day phenophase metrics are finer-scale metrics than those typically used, such as peak or average phenophase. However, analyses suggest little difference in conclusions drawn from finer-scale stages in phenology models (Ellwood et al., 2019). Because immature leaves in both species can display red coloration, we omitted dates prior to the approximate summer solstice (day of year 171) and dates after the approximate winter solstice (day of year 355) to restrict onset dates to dates surrounding the autumn season.
Before testing more comprehensive models, we used simple linear regressions to identify shifts in the timing of the last date with recorded leaves over time and the first date with recorded colored leaves over time. Because presence/absence outcome variables are binary, we used logistic regressions to assess changes in the presence/absence of damage categories and colored leaves in specimen records over time. These less complex models provide baseline estimates of changes in these phenomena over time, prior to accounting for climate-related or spatial variability.
We used General Additive Models (GAMs) to evaluate the relationship between these dates and smoothed environmental conditions (the SPI of the collection year and the summer preceding collection; the fall precipitation and minimum and maximum temperatures), geospatial features (latitude, longitude, and elevation), the species, the year of collection, and damage (the presence of leaf area removal or other damage), and points were weighted by the number of specimens collected during that year. An additive model incorporates smooth functions of predictive variables, allowing us to reveal and estimate non-linear relationships between predictors and response variables (Yee and Mitchell, 1991). This modeling approach also allows for the simultaneous modeling of latitude and longitude as a two-dimensional smooth curve to account for spatial autocorrelation. In all models, temporal features (year in both models and day of year in the binary GAMs), elevation, and factors (species identity or the presence of damage) were modeled as parametric linear predictors. Location (as latitude and longitude) and climate variables were modeled as smoothed functions. We expect non-linear relationships over space, as there may be local adaptation, and with climate variables because extremely high and low levels of precipitation and temperature may be outside an organism’s climatic niche. We tested for concurvity of the smoothed predictors with an estimated threshold of 0.8. These models were implemented using the mgcv R library (version 1.8-33; Wood, 2004, 2011, 2017; Wood et al., 2016) and visualized using mgcViz (version 0.1.6; Fasiolo et al., 2020) and the tidyverse suite of packages (version 1.3.0; Wickham et al., 2019; Wickham and RStudio, 2019).
We then explored the relationship between senescence and several variables – environmental conditions (the SPI of the collection year and the summer preceding collection; the fall precipitation and maximum temperatures), geospatial features (latitude, longitude, and elevation), the species, the year of specimen collection, the day of year of specimen collection, and damage (the presence of leaf area removal or other damage) – using a binary GAM fit to the presence or absence of colored leaves on each herbaria specimen. We used a Locally Weighted Scatterplot Smoothing (LOWESS, Trexler and Travis, 1993) regression to visualize the probability of leaves on a specimen. However, neither a logistic regression nor binary GAM were computed because of a low number of specimens without leaves and an extended period during the year with a 0% chance of specimens without leaves (Figure 2). Similarly, we fit two binary GAMs to the presence or absence of (1) leaf area removal and (2) other damage on herbaria specimen to explore the relationship between damage and geospatial features (longitude and elevation), the species identity, the year of collection, the day of year of collection (as the probability of damage increases the longer a leaf is on a tree), environmental conditions (the SPI of the collection year and the summer preceding collection, the annual total precipitation, and annual mean temperature), and the presence of the non-target damage category. In contrast to the model for leaf senescence, because damage can occur before the fall season, we used the mean yearly temperature and the total annual precipitation instead of fall-specific climate. In these models, location (as latitude and longitude), elevation, and climate variables were modeled as smooth functions. For these classification models (the binary GAMs), we report the area under the receiver operating characteristic curve (AUC), which is a measure of classification performance that ranges from 0, indicating a model with 100% incorrect prediction, and 1, a perfect classification model, and we calculated this metric using the pROC R library (version 1.17.0.1; Robin et al., 2011).
Results
A total of 2,972 herbaria records were included in our resulting dataset (Figure 1). The two study species were approximately equally represented with 55% (n = 1,640) A. rubrum and 45% (n = 1,337) A. saccharum. The majority of specimens (70%, n = 2,100, Figure 2) included preserved green leaves, while the preservation of colored leaves was less frequent (15%, n = 447, numbers do not sum to 100% because some specimens contained only stems with buds, Figure 2). As would be expected, the probability of leaves and colored leaves varied over the yearly cycle (Figure 2) and showed seasonal patterns of occurrence. Leaf area removal was documented on 52% (n = 1,568) of specimens, while 35% (n = 1,063) of specimens had evidence of other damage (fungal, viral, bacterial, or gall spots). The resulting data are available in the Environmental Data Initiative repository under identifier edi.713 (Garretson and Forkner, 2021).
Shifts in Phenophase Timing
The results of a simple linear regression of the year of collection with the timing of leaf-offset (last day of year with leaves) showed a significant change over time with an estimated delay of 0.43 ± 0.09 days per year (P < 0.0001), leading to a total estimated delay of approximately 84 days between 1826 and 2016 (Figure 3). However, the fit of the simple model was low, with R2 = 0.09, justifying the exploration of relationships with climate and damage features. The General Additive Model with expanded predictors explained 43.4% of the deviance in the last observation date of leaves (Table 1 and Supplementary Figure 1). We observed non-linear relationships with the location of collection (edf = 19.16, F = 3.44, P < 0.0001). In particular, we observed earlier last leaf dates in more northern areas but delays in the central Ohio region (Figure 4A). Higher elevation was associated with earlier dates of last leaves, with each meter associated with 0.14 ± 0.04 day earlier last leaf dates (t = −3.92 P = 0.0001, Figure 4B). Leaf area removal was associated with an earlier last observation of leaves date. Specimens with damage were on average 19.26 ± 8.11 days earlier than specimens without damage (t = −2.37, P = 0.02, Figure 4C). Additionally, we observe relationships between last leaf dates and the yearly SPI (edf = 1.00, F = 9.15, P = 0.003) and maximum fall temperatures (edf = 2.46, F = 3.10, P = 0.026). Non-linearity was particularly evident in the relationship with the maximum fall temperature: at temperatures higher than approximately 25°C, there was no marked change from the average dates, but as the maximum temperature increased from 17.8 to 25°C, there was a negative relationship between the temperature and the last leaves date, with the last leaves date moving closer to the average date (Figure 4D). Increasing drought was associated with earlier last leaf dates, while increasing wetness relative to historical averages was associated with later last leaf dates (Figure 4E). These differences were quite large, with an SPI of −2 (severe drought) associated with last leaf dates nearly 30 days earlier than average and an SPI of 3 (extremely wet) associated with last leaves dates nearly 40 days later than the average (Figure 4E).
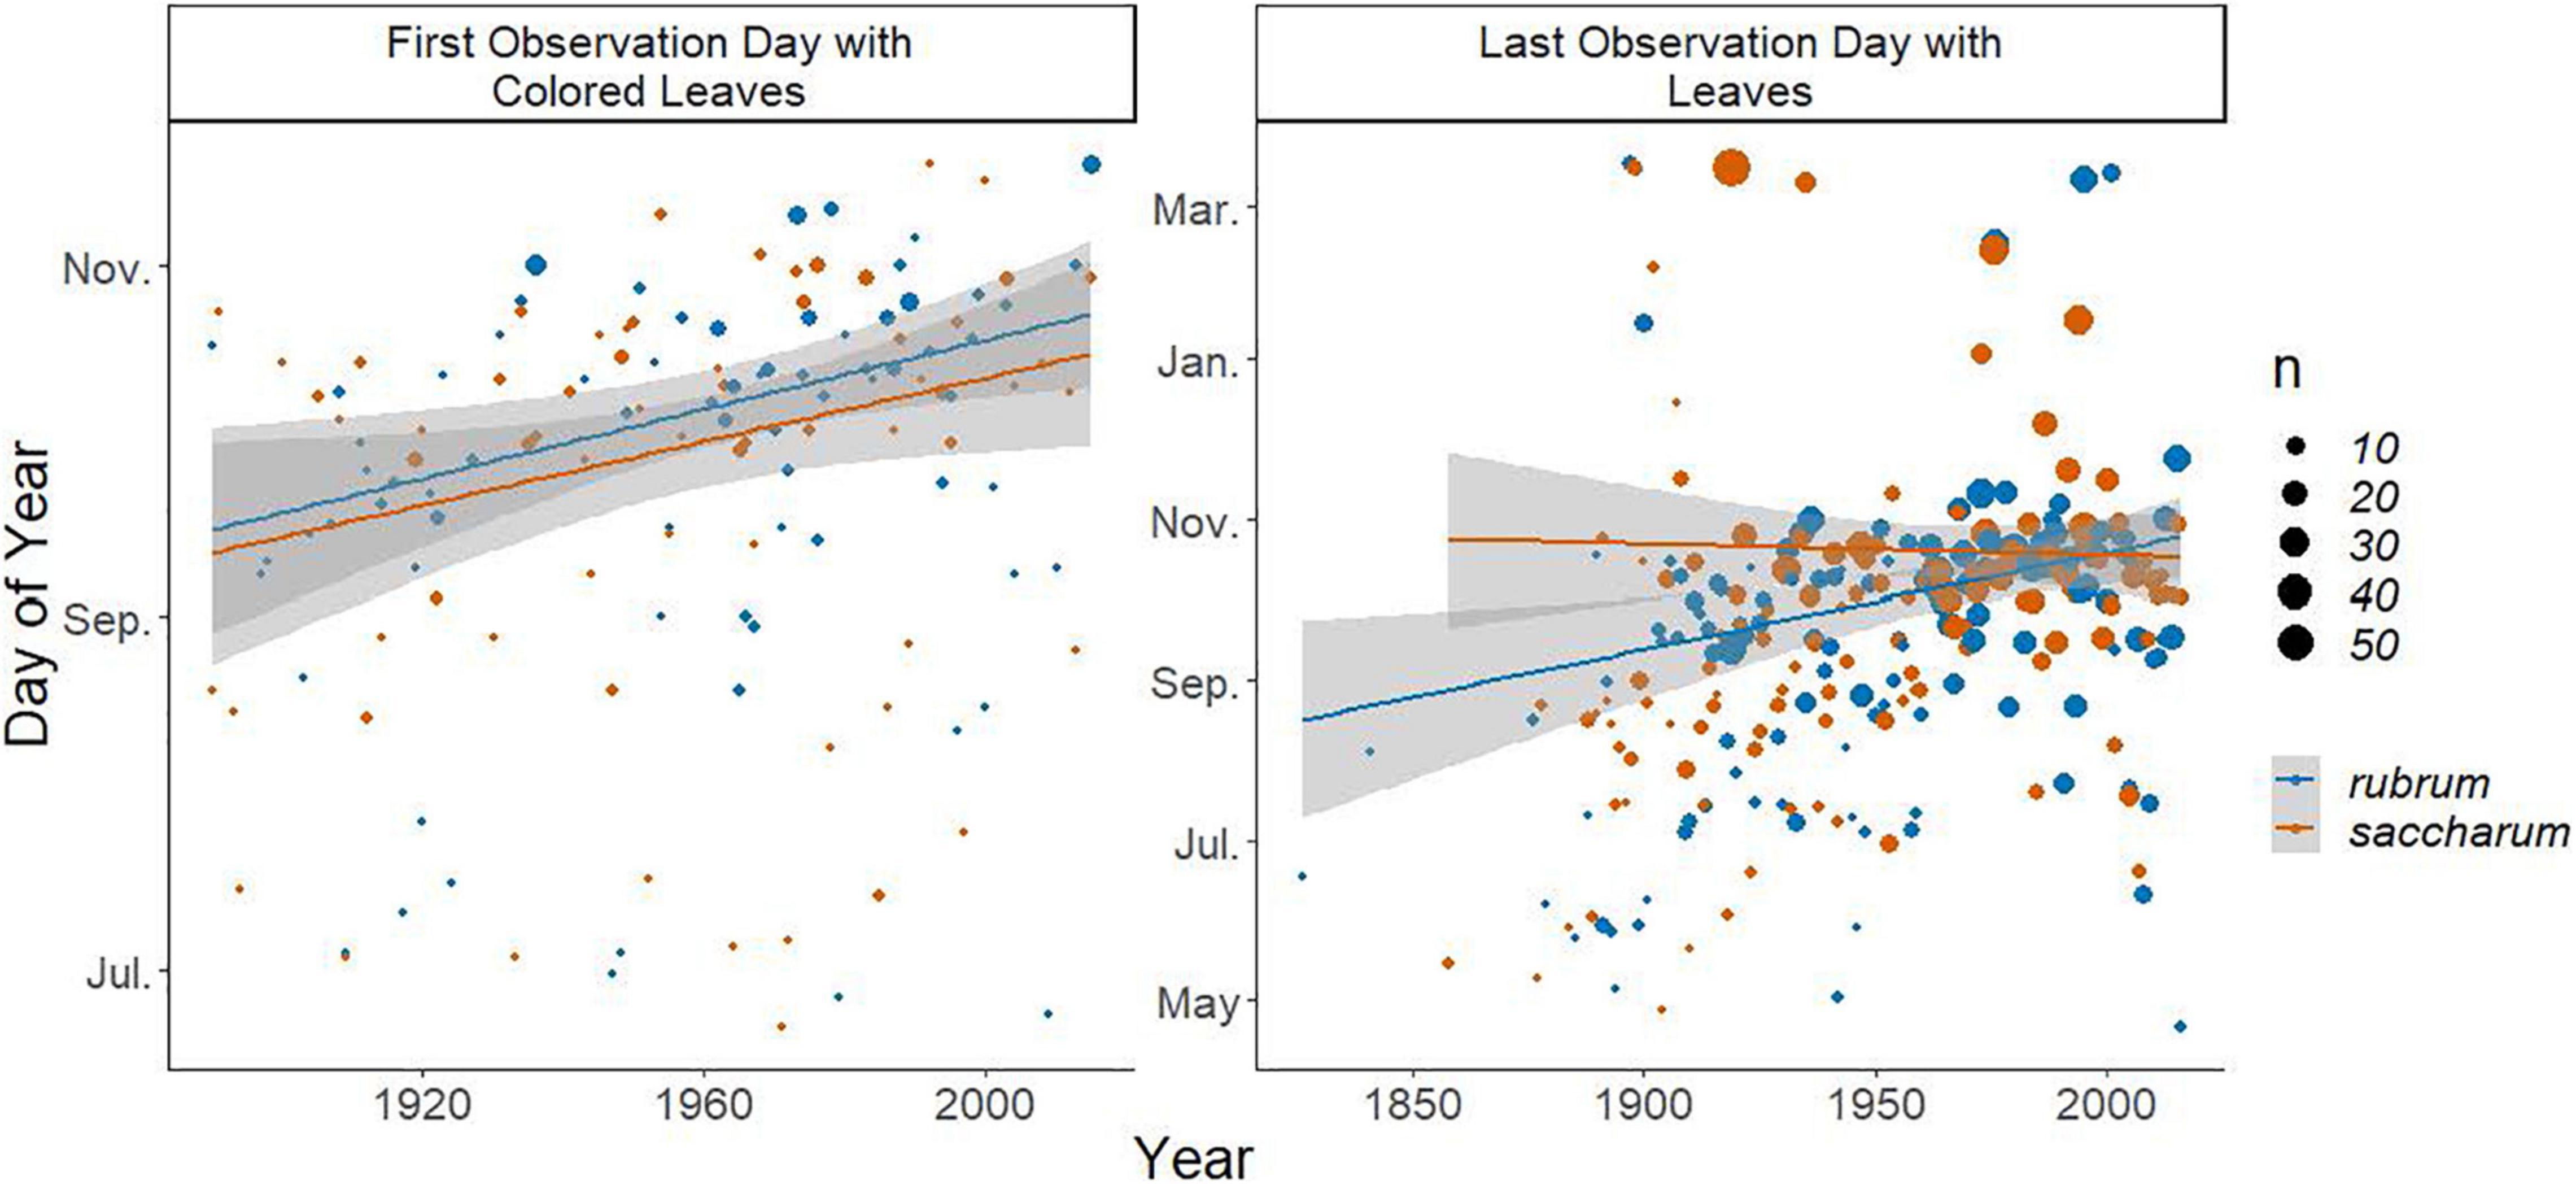
Figure 3. Scatter plots of the first day of year between the approximate summer and approximate fall solstice when a specimen was recorded with colored leaves (left) and the last day of year from the spring equinox to the spring equinox of the following year when a specimen was recorded with leaves (right). Points are colored by the species and sized by the number of specimens collected during that period. Lines are best fit linear regressions with a shaded area indicating the 95% confidence interval and are fit independently to each species.
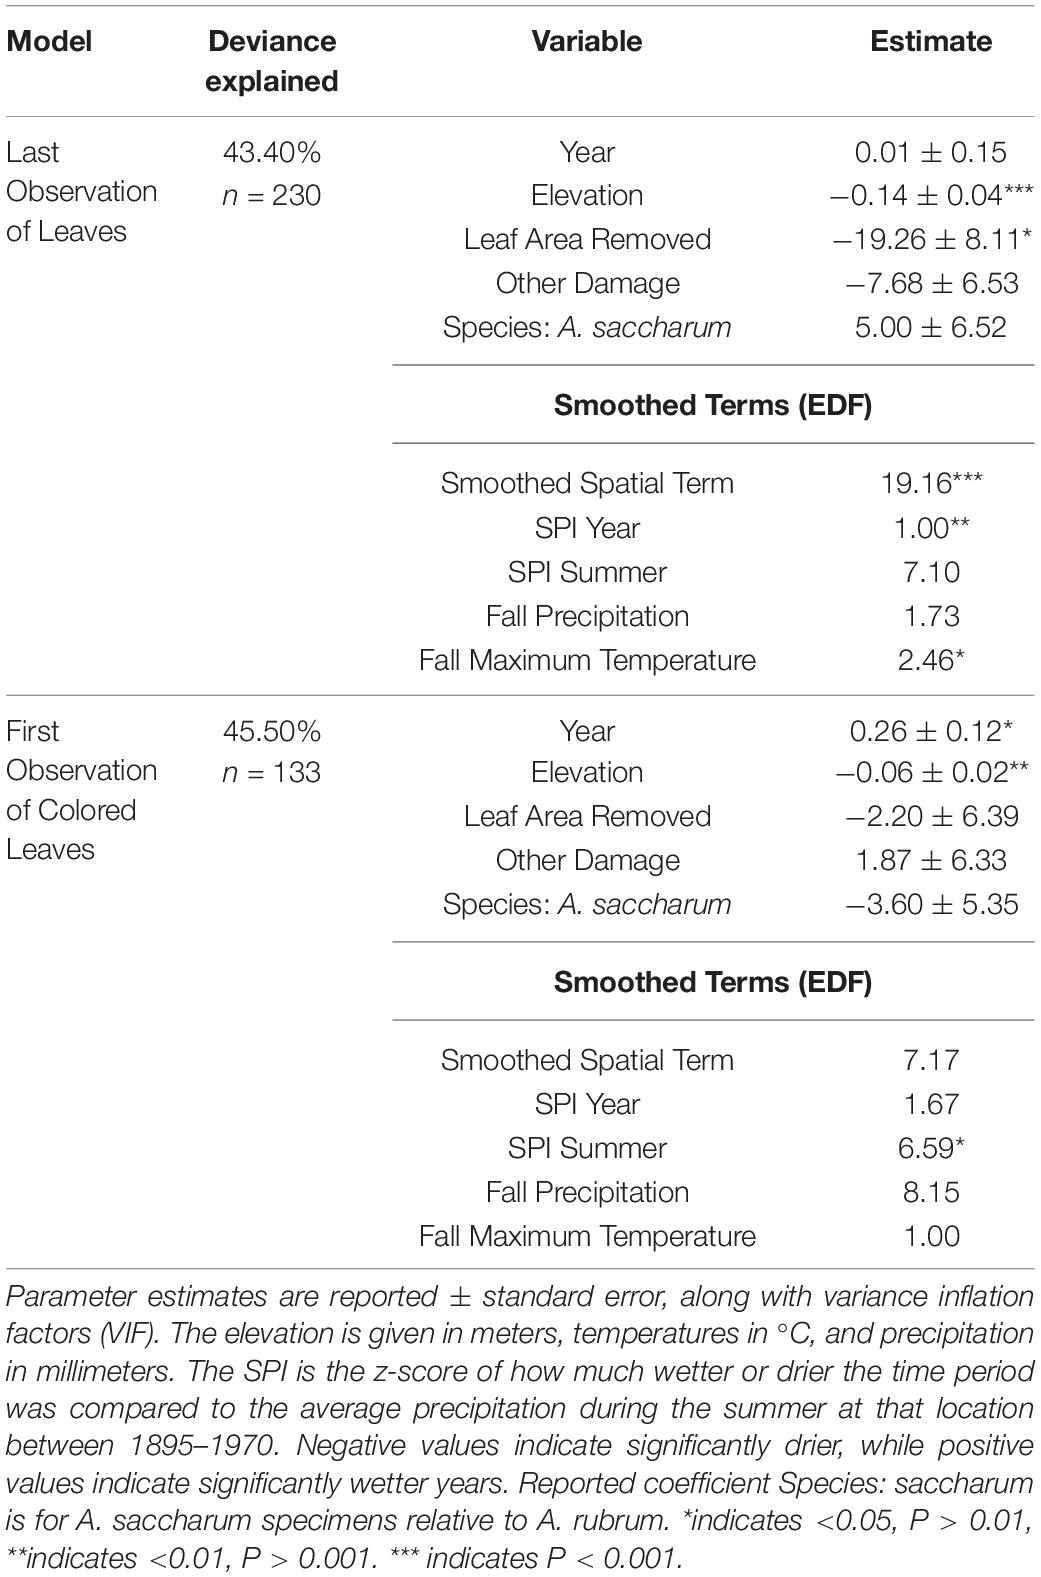
Table 1. Results of linear regression of the last specimen date with leaves for each year and the first observation date of colored leaves after the summer solstice, weighted by the number of specimens.
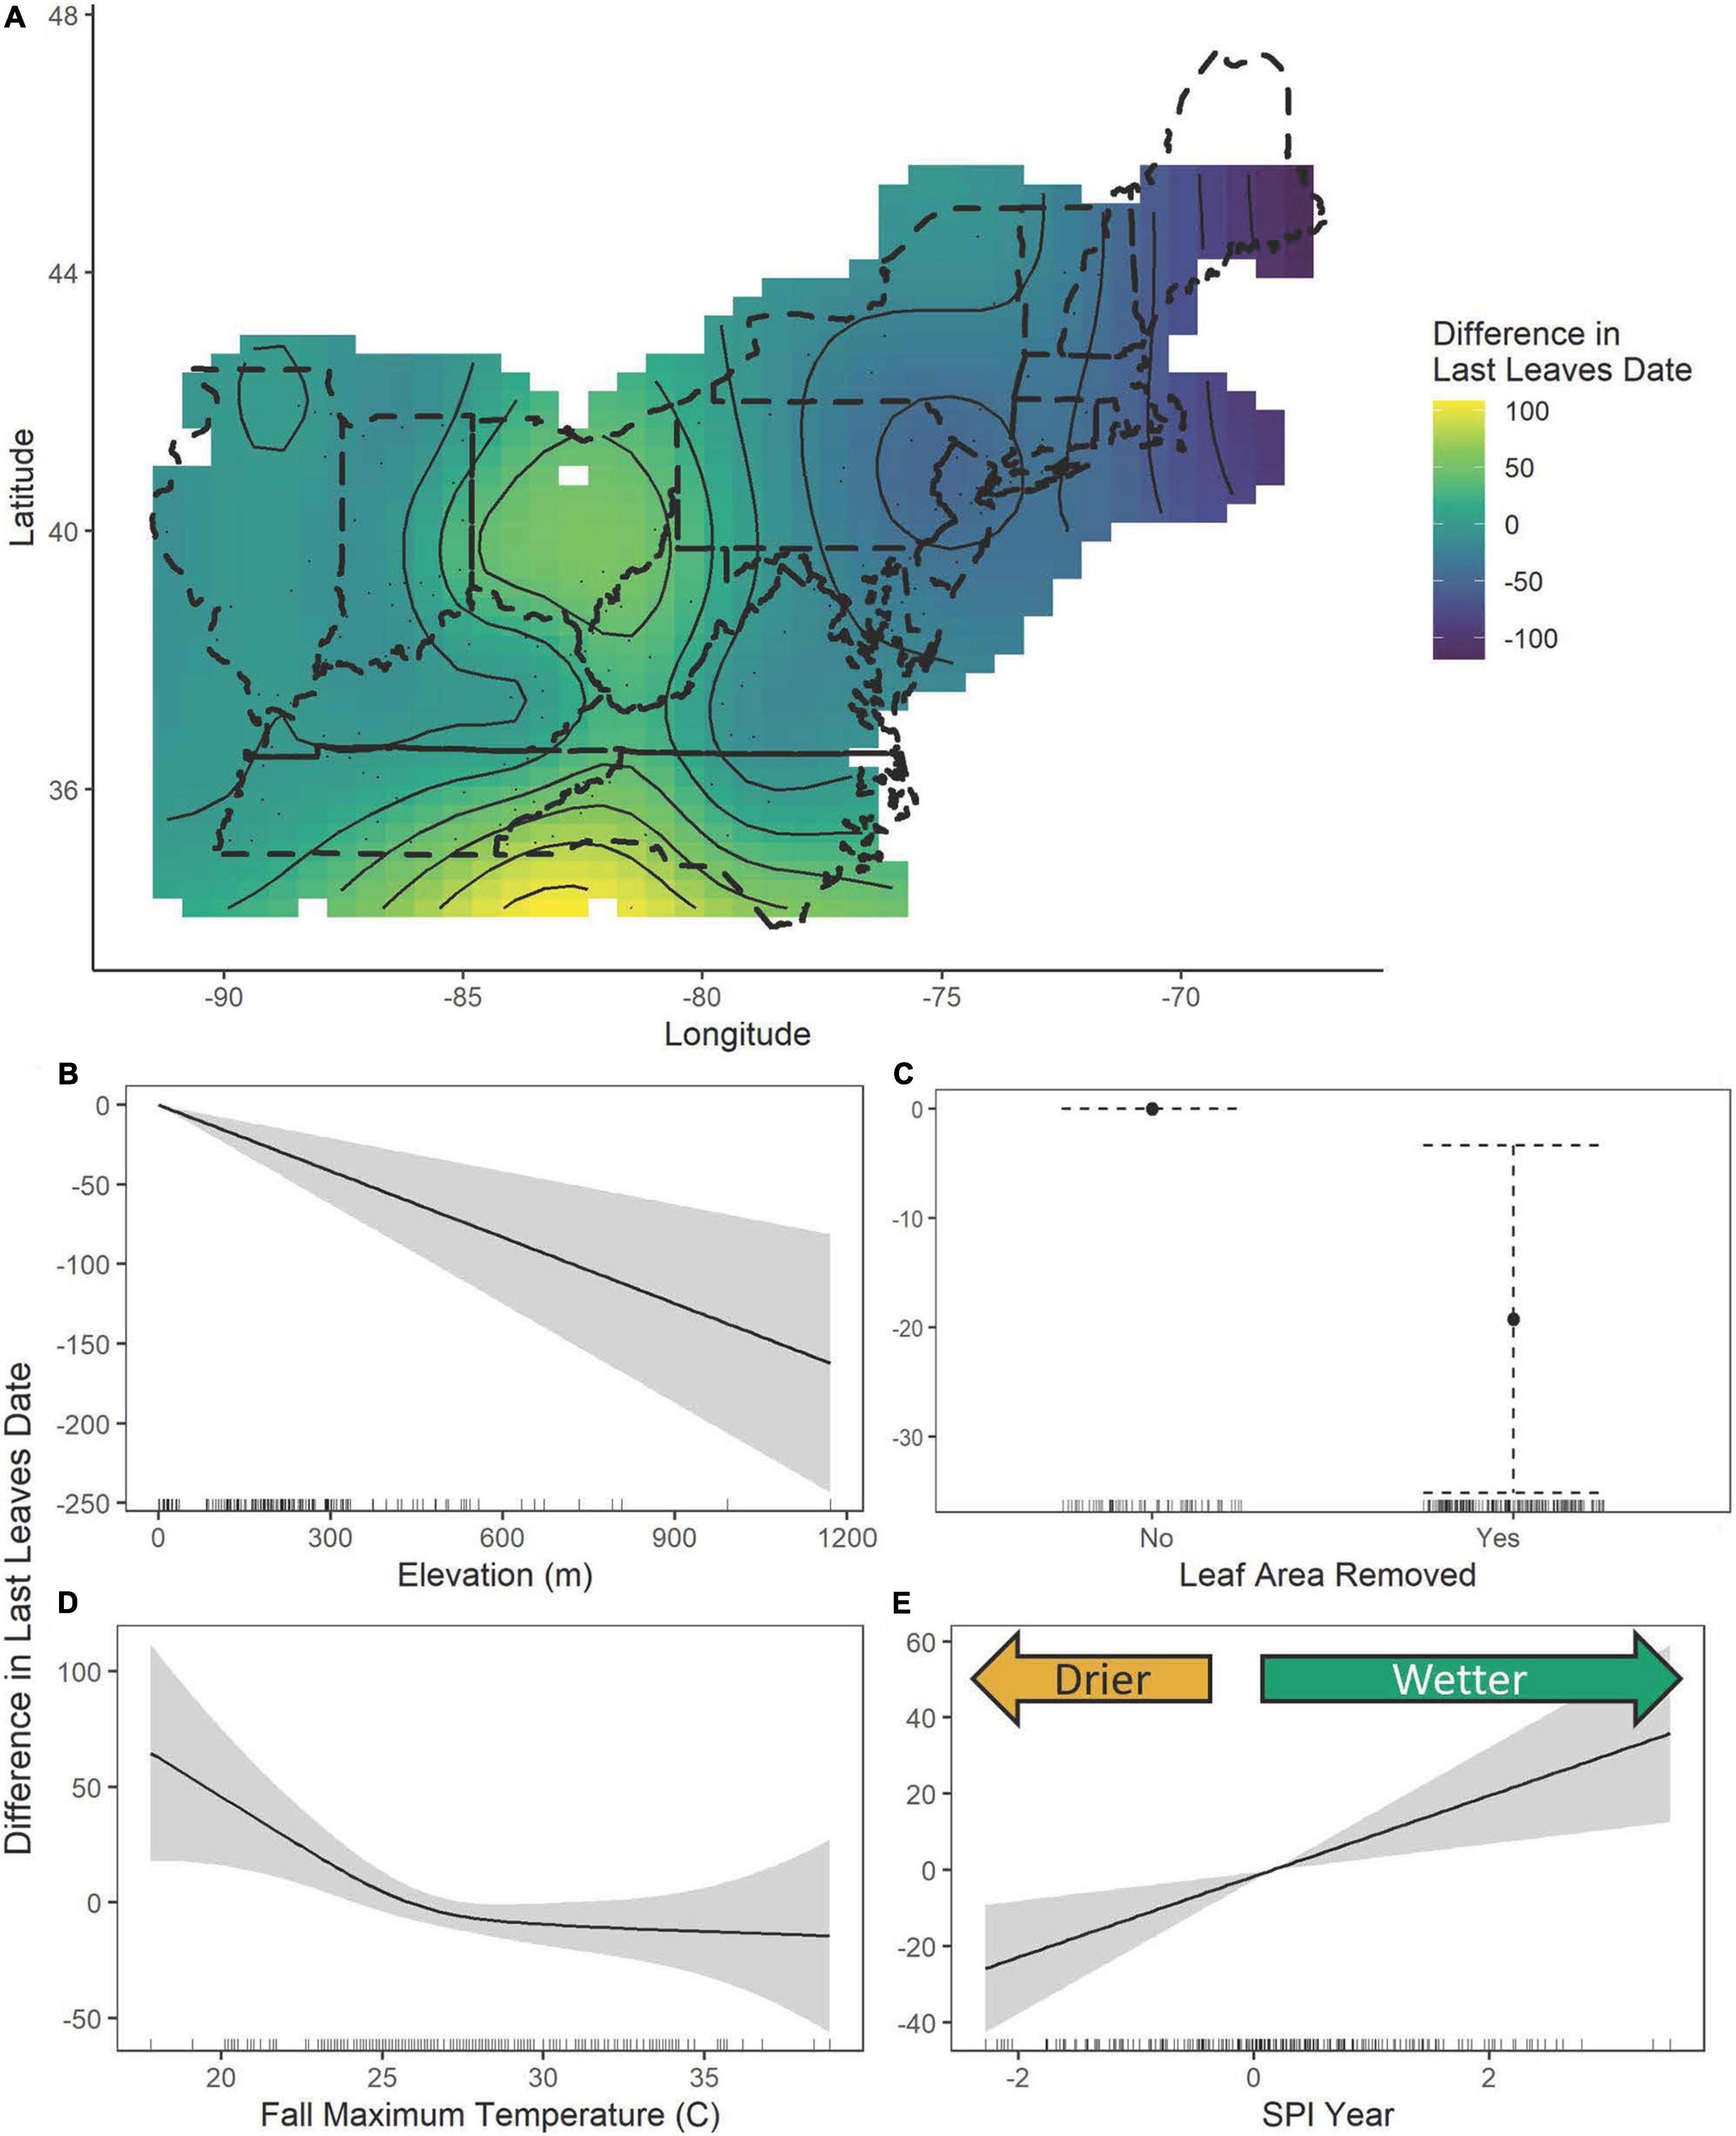
Figure 4. The estimated contributions of latitude and longitude (A), elevation (B), leaf area removed (C), maximum fall temperatures (D), and the SPI of the year of collection (E) from the general additive model of the last date with preserved leaves. In figure (A), the dashed lines show the United States state boundaries in the included regions, while the solid lines show the fitted smoothed curves output from the GAMs overlaid with the fitted contour showing spatial differences in last leaf dates. In figures (B,D,E) the solid curve while the gray regions or dotted whiskers represent the 95% confidence interval and in figure (C) the solid point shows the estimated contribution while the dotted lines show the 95% confidence interval. Tick marks along the x-axis indicate the density of specimens.
A simple linear regression of the year of collection with coloration onset (the first day of year with colored leaves) also revealed a significant delay of approximately 0.21 ± 0.89 days per year, suggesting a total delay of approximately 26 days between 1890 and 2015 (Figures 2, 3). As with the model of abscission, the model fit with only the year of collection as an explanatory factor was very low, with an R2 of only 0.03, again justifying more complex models. Comparably, the model fit of the GAM with expanded predictors for the first appearance of colored leaves explained 45.5% of the deviance (Table 1 and Supplementary Figure 2). There was evidence of non-linear relationships with the summer SPI (edf = 6.59, F = 2.57, P = 0.01, Figure 5A). In years where rainfall was higher than average, coloration was delayed, until rainfall exceeded two standard deviations from the mean and coloration occurred much earlier. In years when rainfall was lower than average, coloration onset was later (Figure 5A). The first appearance of colored leaves in autumn was delayed by 0.26 ± 0.12 days per year over the study period (t = 2.22, P = 0.029, Figure 3). Importantly, including additional predictors suggested that the simple model provided an underestimate of the total shifts in coloration timing. Finally, as elevation increased, coloration was advanced by 0.06 ± 0.02 days (t = −2.83, P = 0.006, Figure 5B).
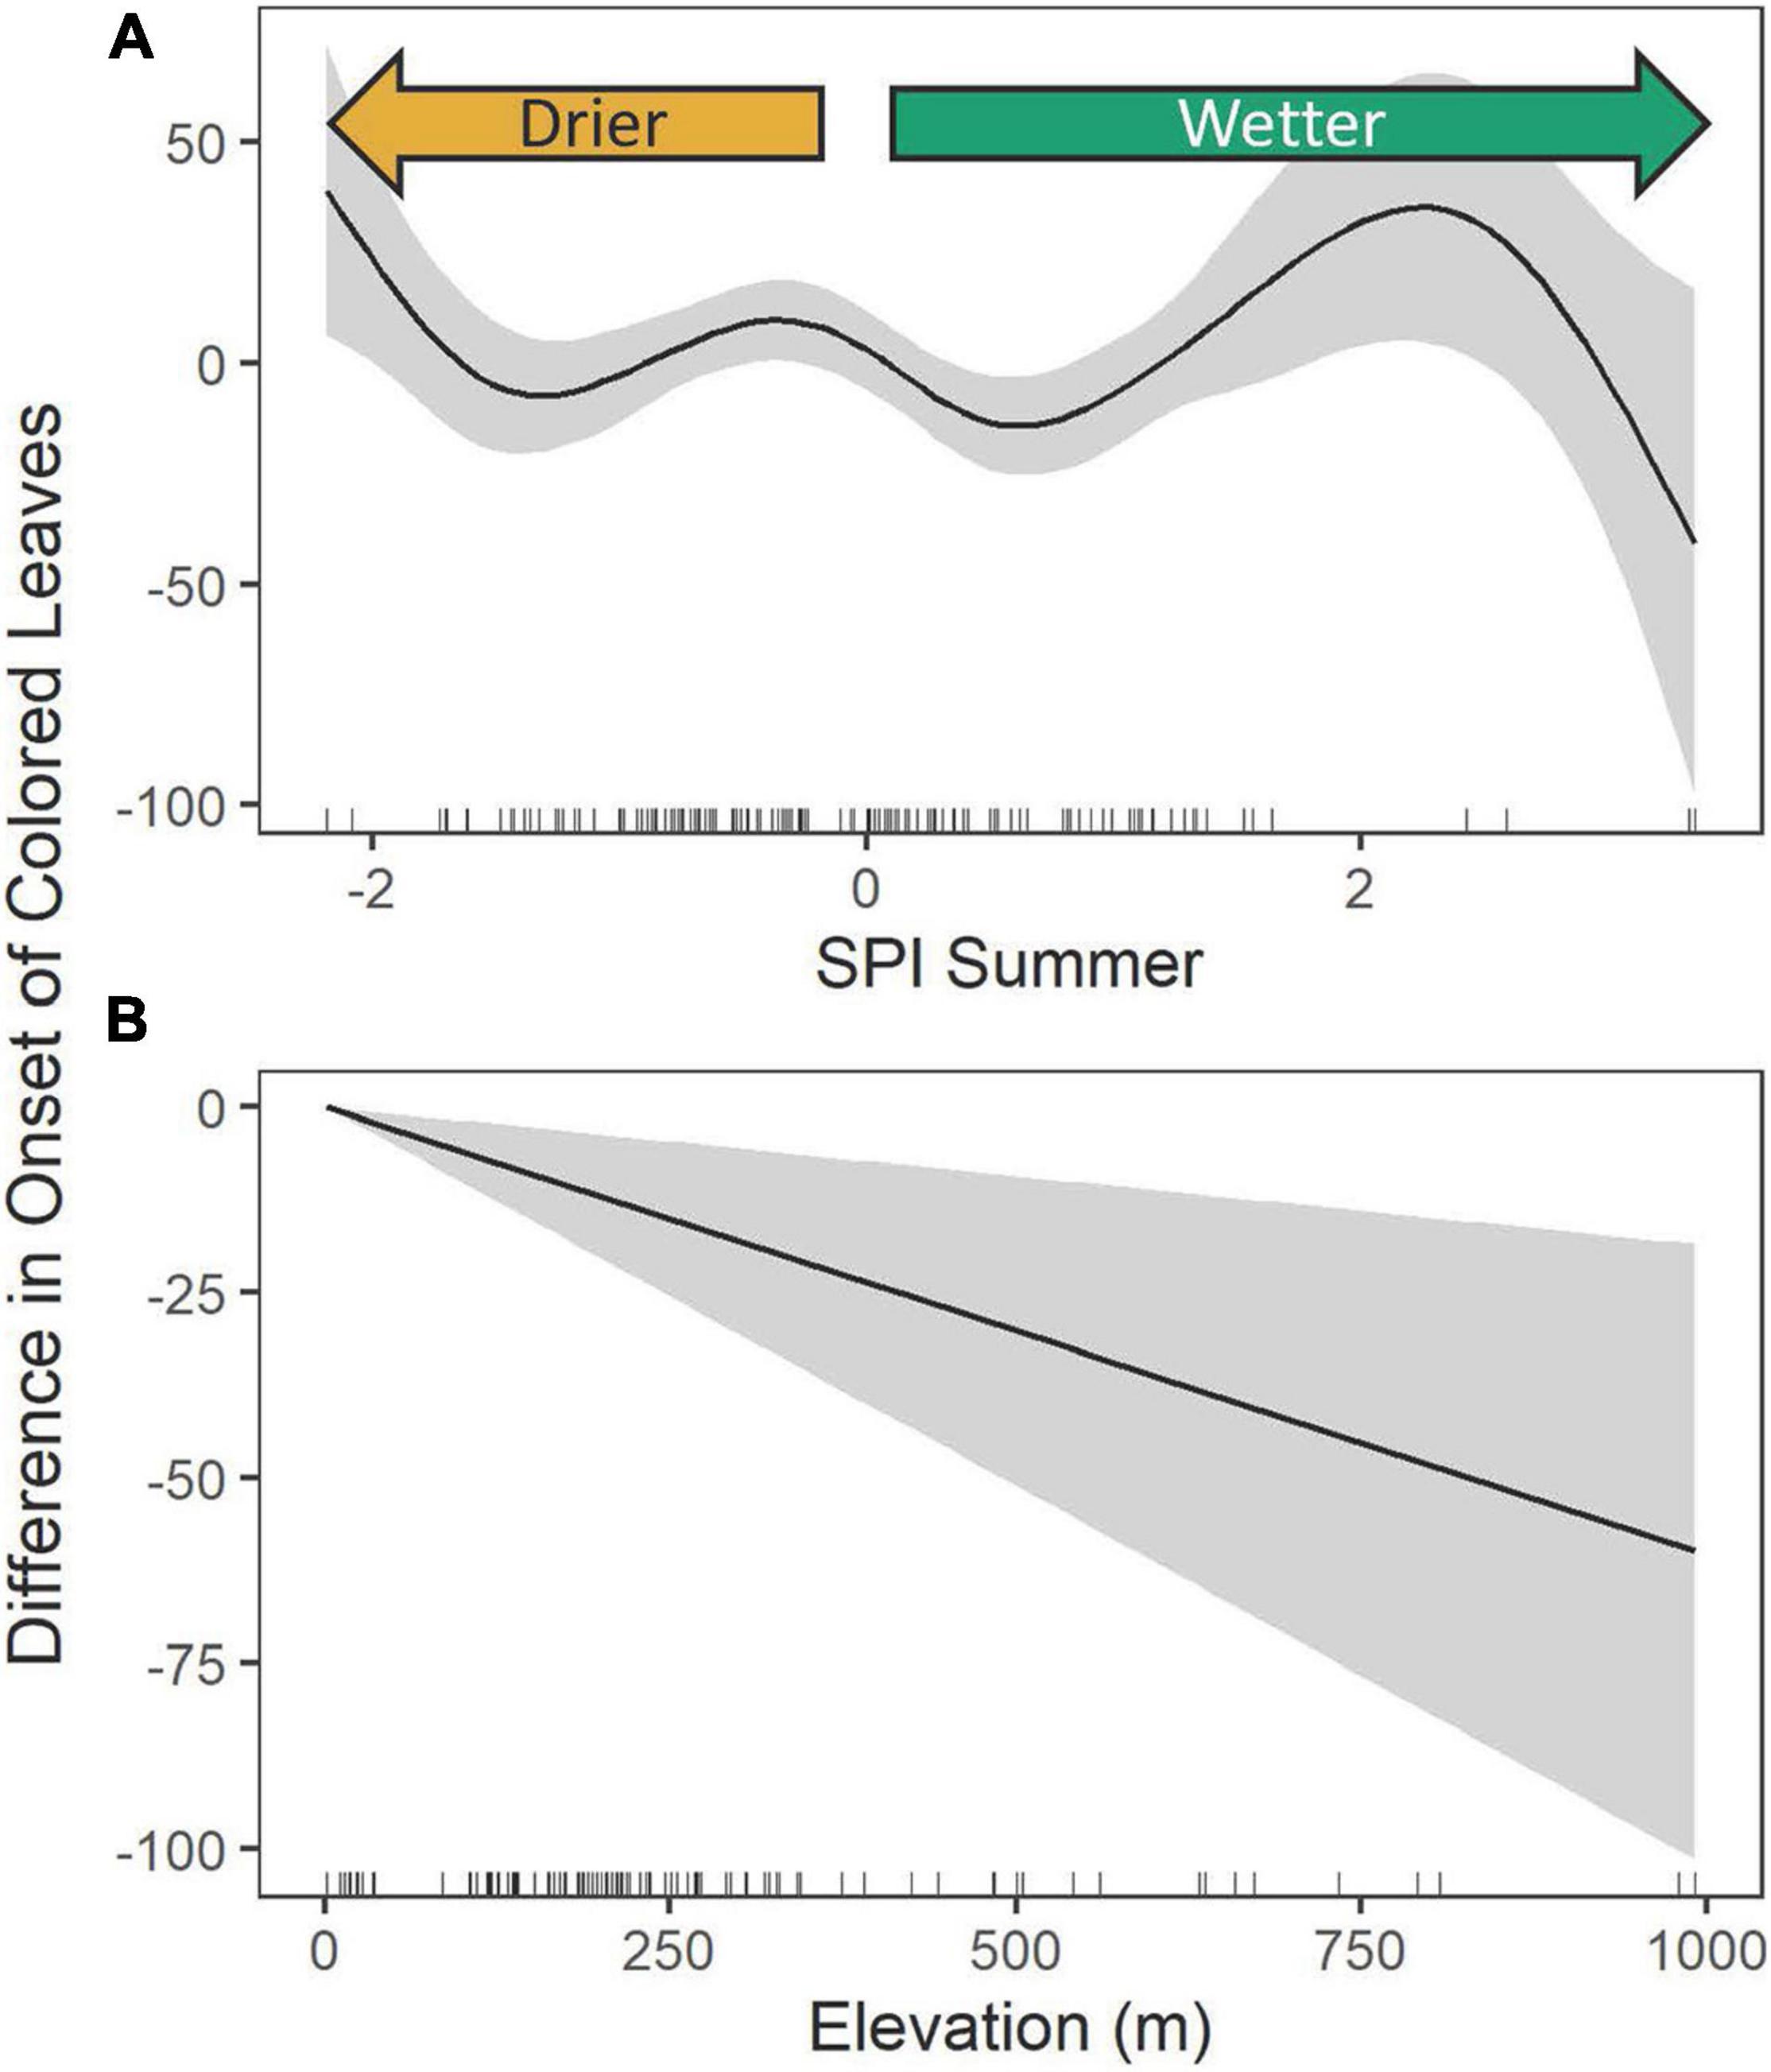
Figure 5. The estimated contributions of the Summer SPI (A) and the elevation (B) for the General Additive Model of onset of colored leaves. The solid curve is the estimated contribution while the gray regions represent the 95% confidence interval, tick marks along the x-axis indicate the density of specimens.
Probability of Coloration
A simple logistic regression showed that the likelihood of coloration on collected specimens did not significantly vary over time (P = 0.3). However, GAMs revealed that the probability that a specimen possessed colored leaves was related to the summer SPI (edf = 1.29, χ2 = 4.29, P = 0.048, Figure 6A), following the trends seen in the timing of coloration (Table 2 and Supplementary Figure 3). Because coloration is a phenophase that primarily occurs in the autumn, as expected, there was a significant positive relationship between the adjusted ordinal day of year and the probability that a specimen contains colored leaves (β = 0.008 ± 0.001, z = 10.11, P < 0.0001, Figure 6B). Additionally, we find a strong relationship to damage metrics (Table 2 and Figures 6C,D). Both leaf area removal (β = 0.36 ± 0.13, z = 2.84, P = 0.005, Figure 6C) and other damage (β = 0.27 ± 0.12, z = 2.23, P = 0.026, Figure 6D) were associated with an increase in the probability that a specimen included colored leaves. Additionally, relative to A. rubrum, there was a lower probability that A. saccharum specimens contained colored leaves on a given date (β = −0.62 ± 0.12, z = −5.18, P < 0.0001, Figure 6E). The area under the curve (AUC) for this model was 0.72, meaning this model performed significantly better than chance in predicting the coloration status of any given specimen.
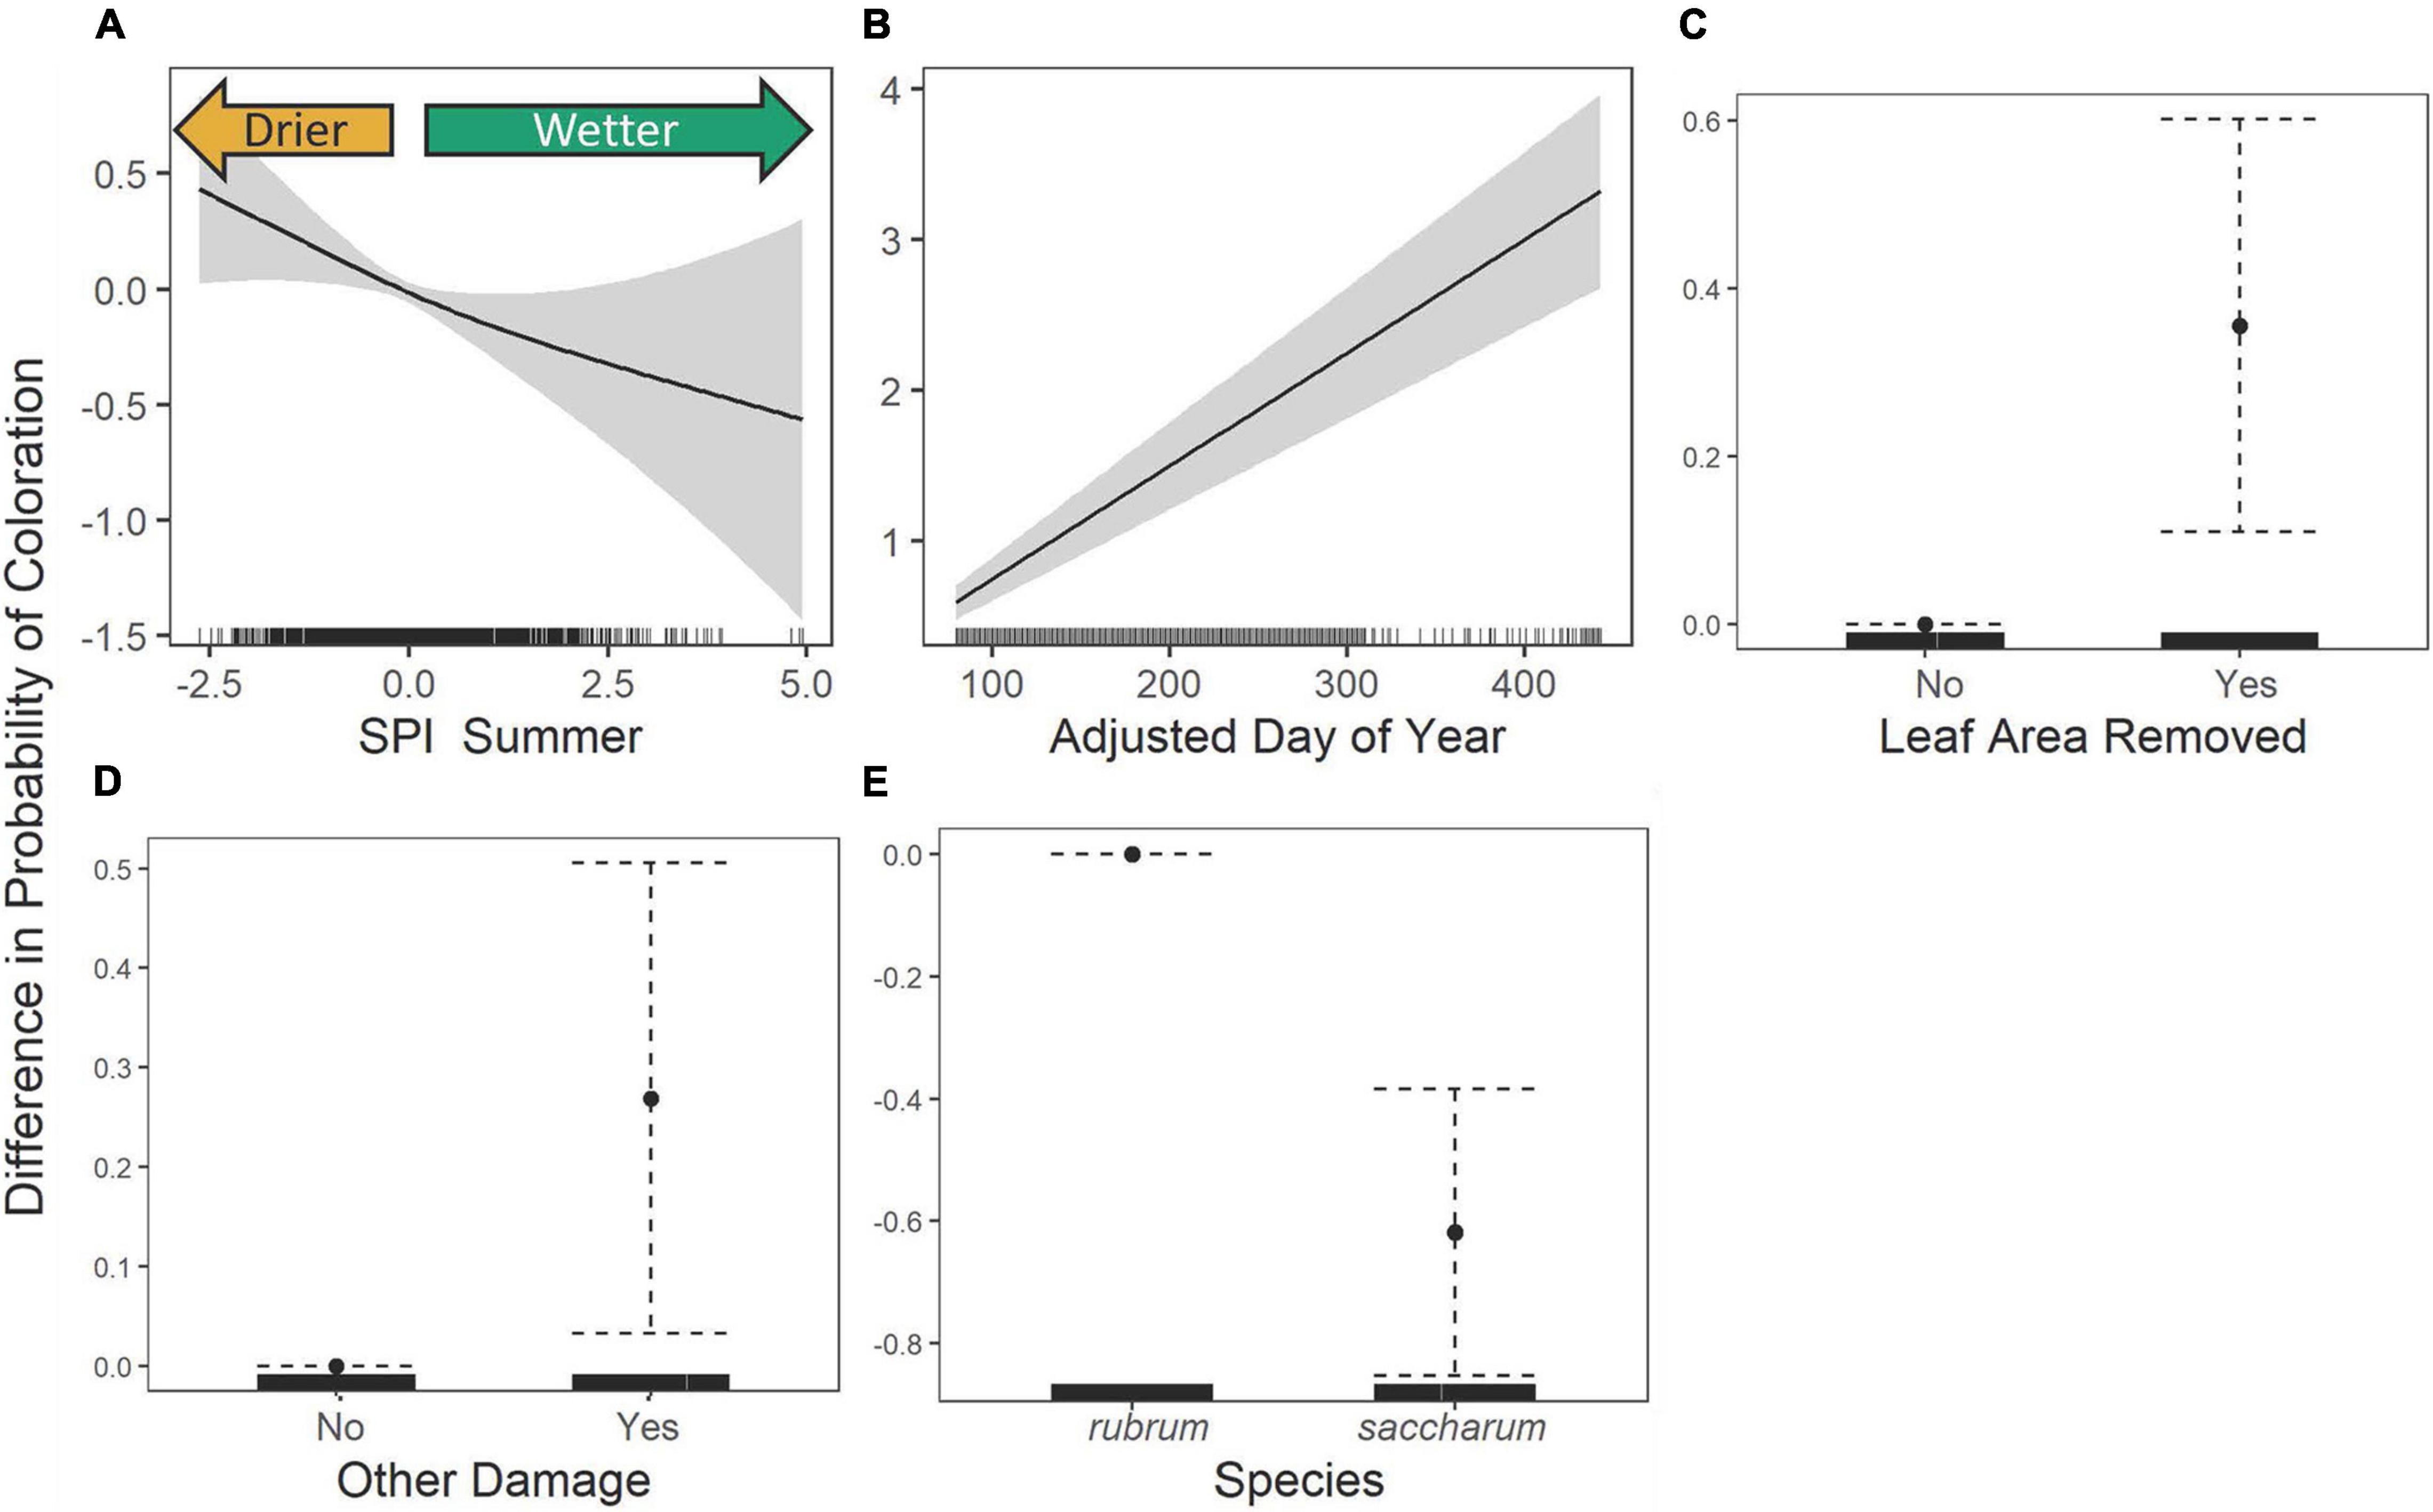
Figure 6. The estimated contribution of General Additive Model SPI Summer (A), the adjusted day of year (B), leaf area removal (C), other damage (D), and species (E) to the probability of colored leaves. The solid curve or point is the estimated contribution while the gray regions or dotted whiskers represent the 95% confidence interval, tick marks along the x-axis indicate the density of specimens. In figures (A,B), the solid curve while the gray regions or dotted whiskers represent the 95% confidence interval and in figure (C–E) the solid point shows the estimated contribution while the dotted lines show the 95% confidence interval.
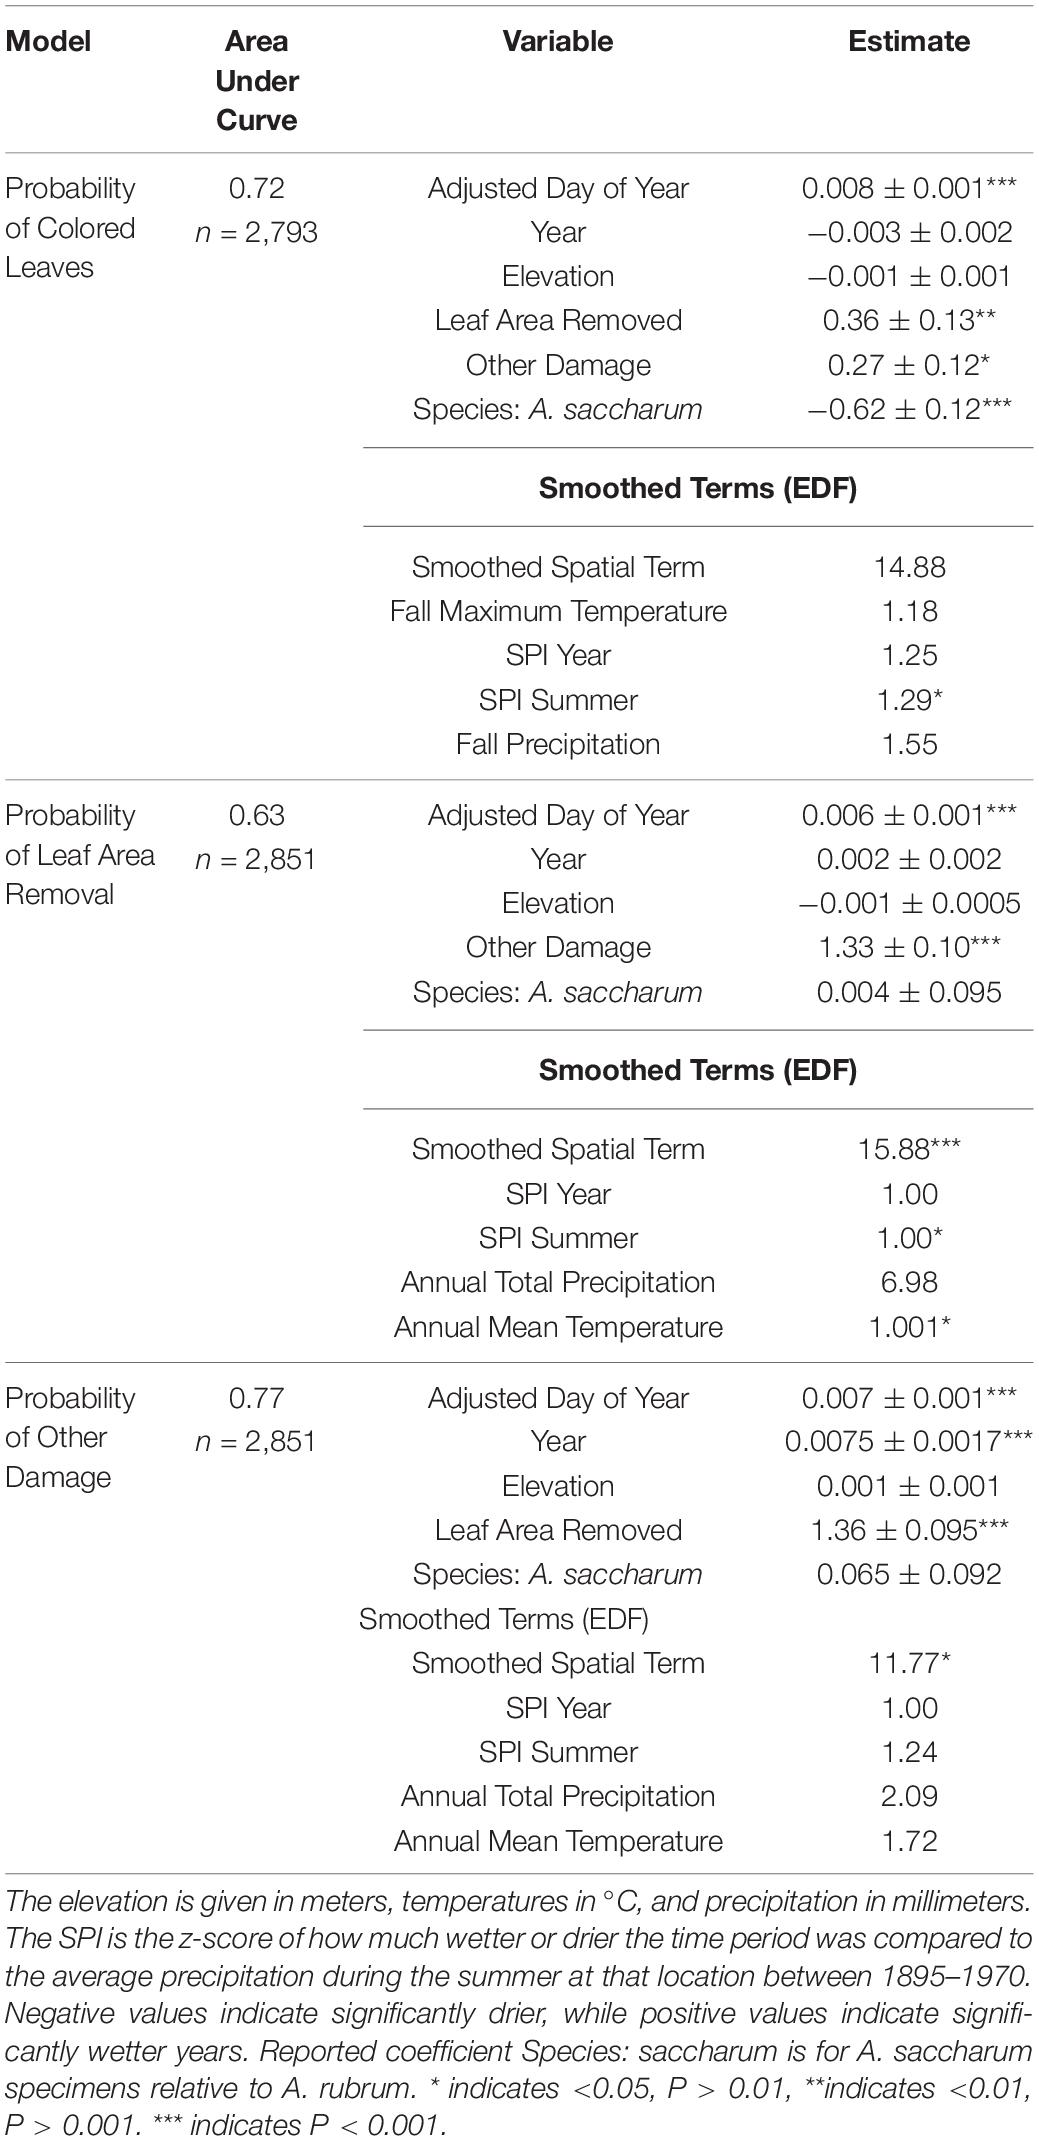
Table 2. Results of a logistic regression relating environmental variables to whether a specimen had colored leaves, leaf area removal, or other damage. Parameter estimates are reported ± standard error, along with variance inflation factors (VIF).
Probability of Damage
The results of a simple logistic regression using only year as a covariate show that without accounting for climate variation, the probability of both damage categories appearing on a specimen increased significantly over the study period (Leaf area removed: β = 0.004 ± 0.001, P < 0.0001; Other damage: β = 0.008 ± 0.001, P < 0.0001, Figure 7). With an expanded model including spatial and climate variation (Table 2 and Supplementary Figures 4, 5), we find that increasing herbivory is strongly related to summer drought and annual temperatures, which drive the interannual variation over the past 100 years (Figure 8). Conversely, the probability of other pathogen damage retained the year as a predictive term, indicating the selected climate variables do not account for the interannual variation and observed increasing trends. This finding suggests factors not included in our model but increasing over time (e.g., urbanization, pollution, or introduced species proliferation) may play a prominent role in the drivers of pathogen damage increases (Figure 9). The predictive capabilities of these models were relatively high, with an AUC of 0.63 for the probability of herbivory and an AUC of 0.77 for the probability of other damage. Thus, the models performed significantly better than chance at predicting the damage status of the observations. As expected, damage was also positively associated with the day of year: as the year progressed, the probability of damage increased (Leaf area removed: β = 0.006 ± 0.001, z = 10.55, P < 0.0001, Figure 8B; Other damage: β = 0.007 ± 0.001, z = 10.33, P < 0.0001, Figure 9B). For both categories of damage, the presence of the alternative damage on the specimen significantly increased the probability of the other damage category, which suggests that herbivory increases susceptibility to other pathogen damage or vice versa (Leaf area removed: β = 1.33 ± 0.95, z = 13.99, P < 0.0001, Figure 8C; Other damage: β = 1.36 ± 0.95, z = 14.39, P < 0.0001, Figure 9C).
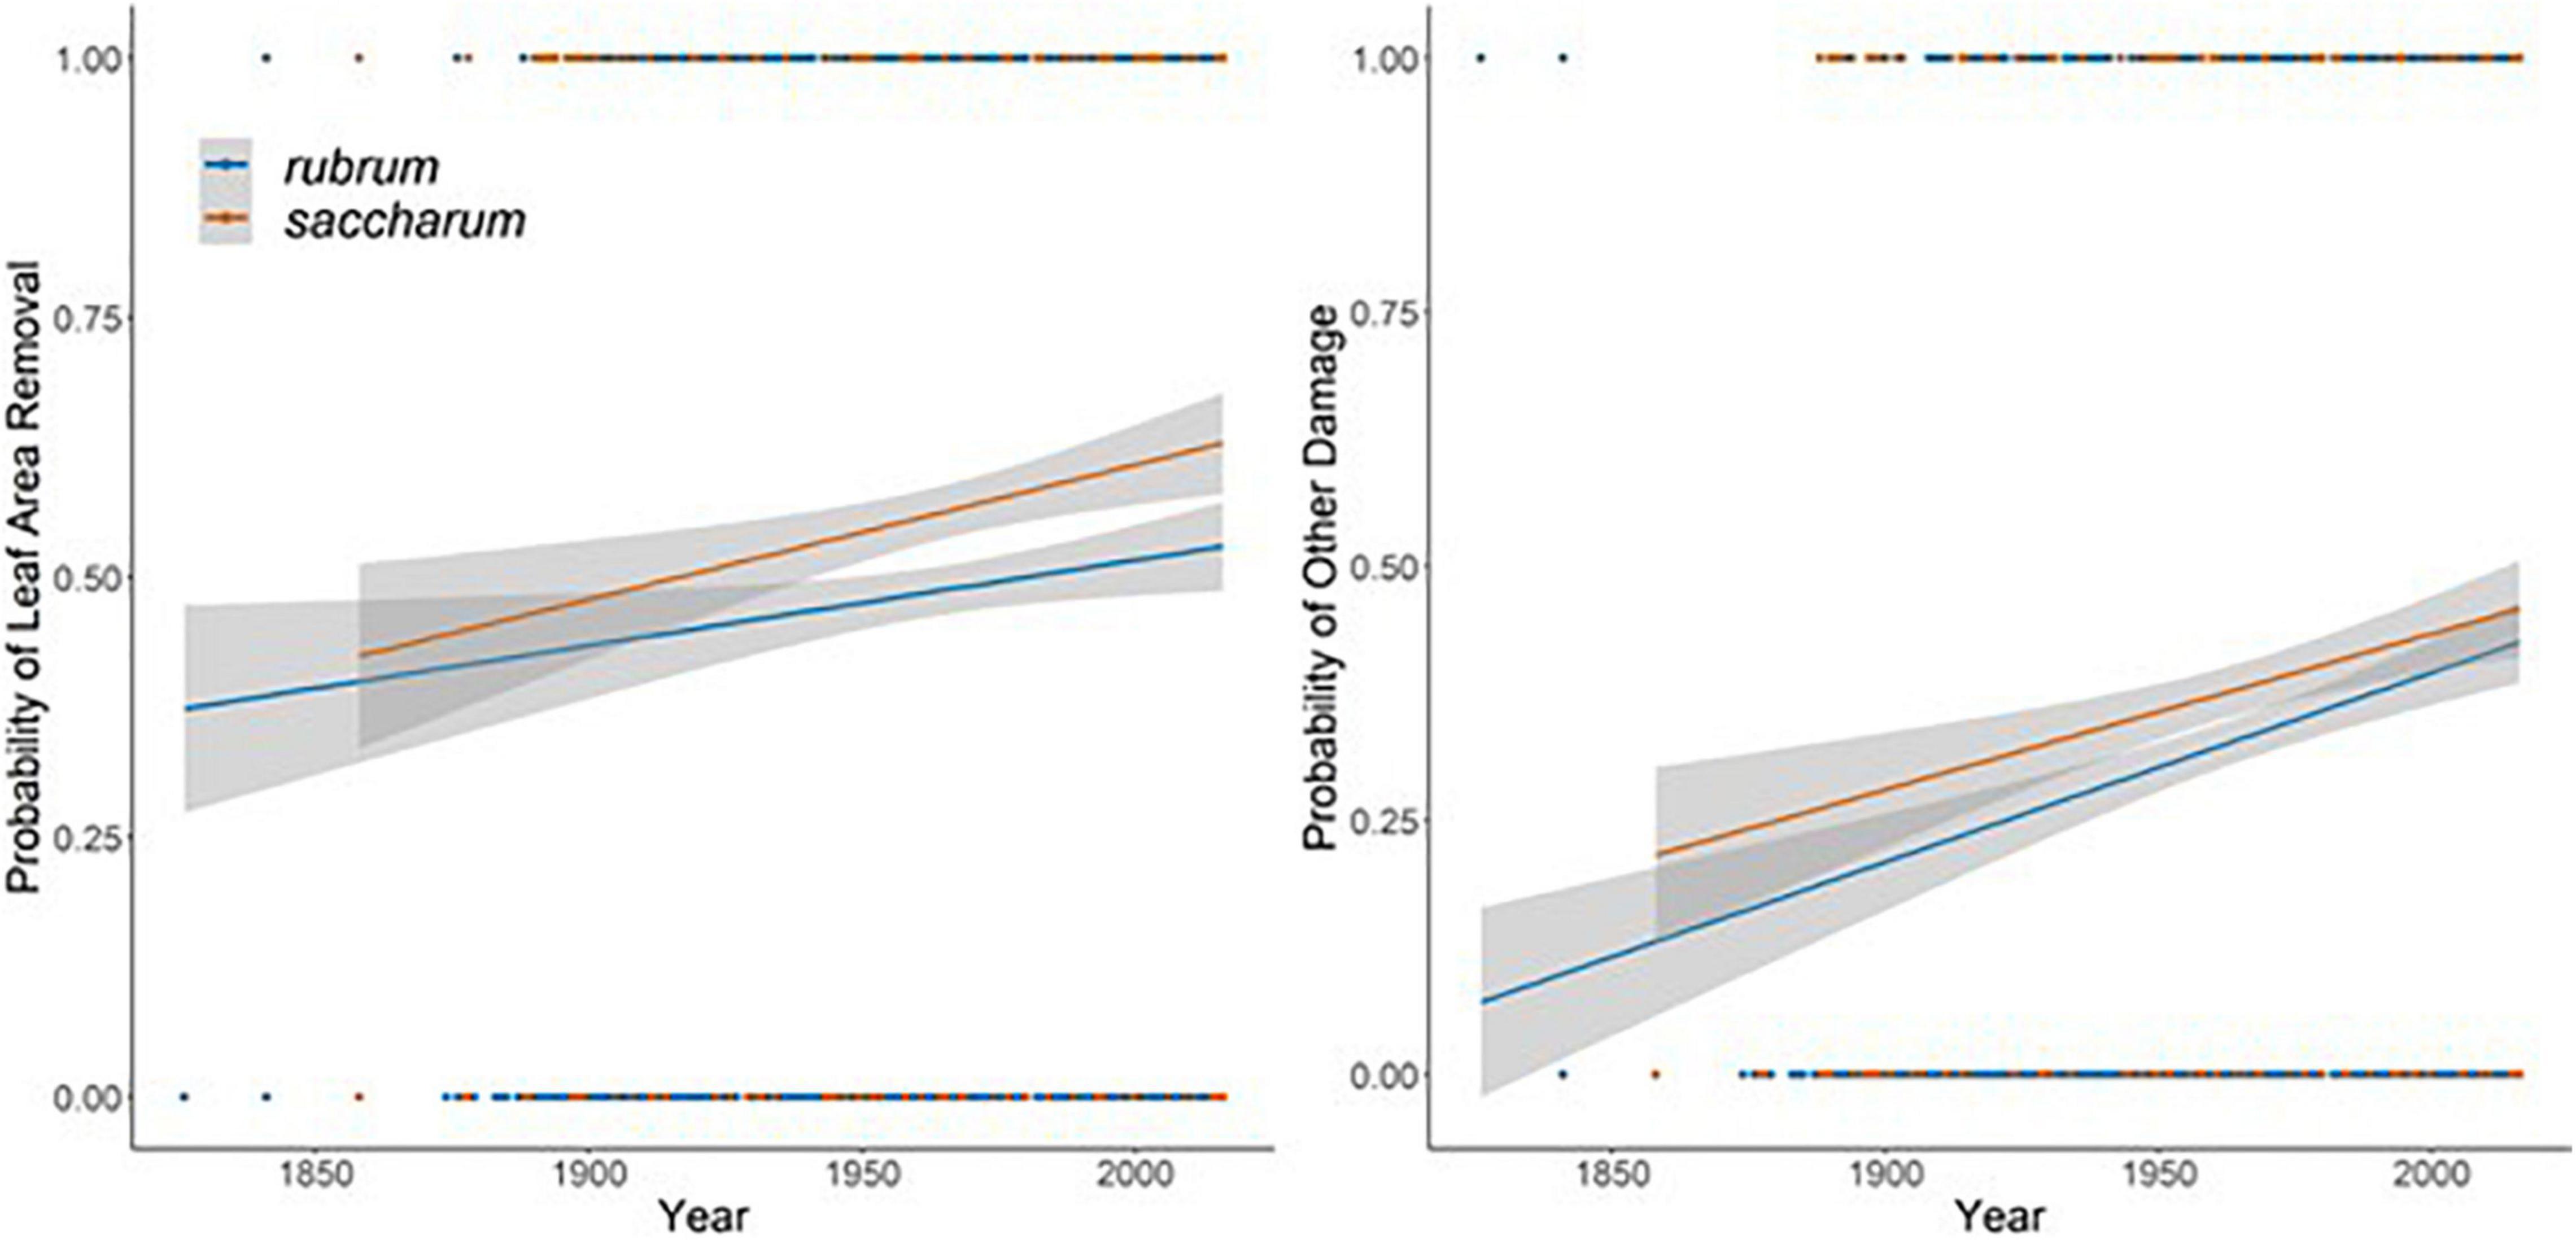
Figure 7. The probability of a specimen showing evidence of leaf area removal (left) and other damage (right) by year of collection. Lines are best fit logistic regressions with shaded areas indicating the 95% confidence interval and fit independently to each species.
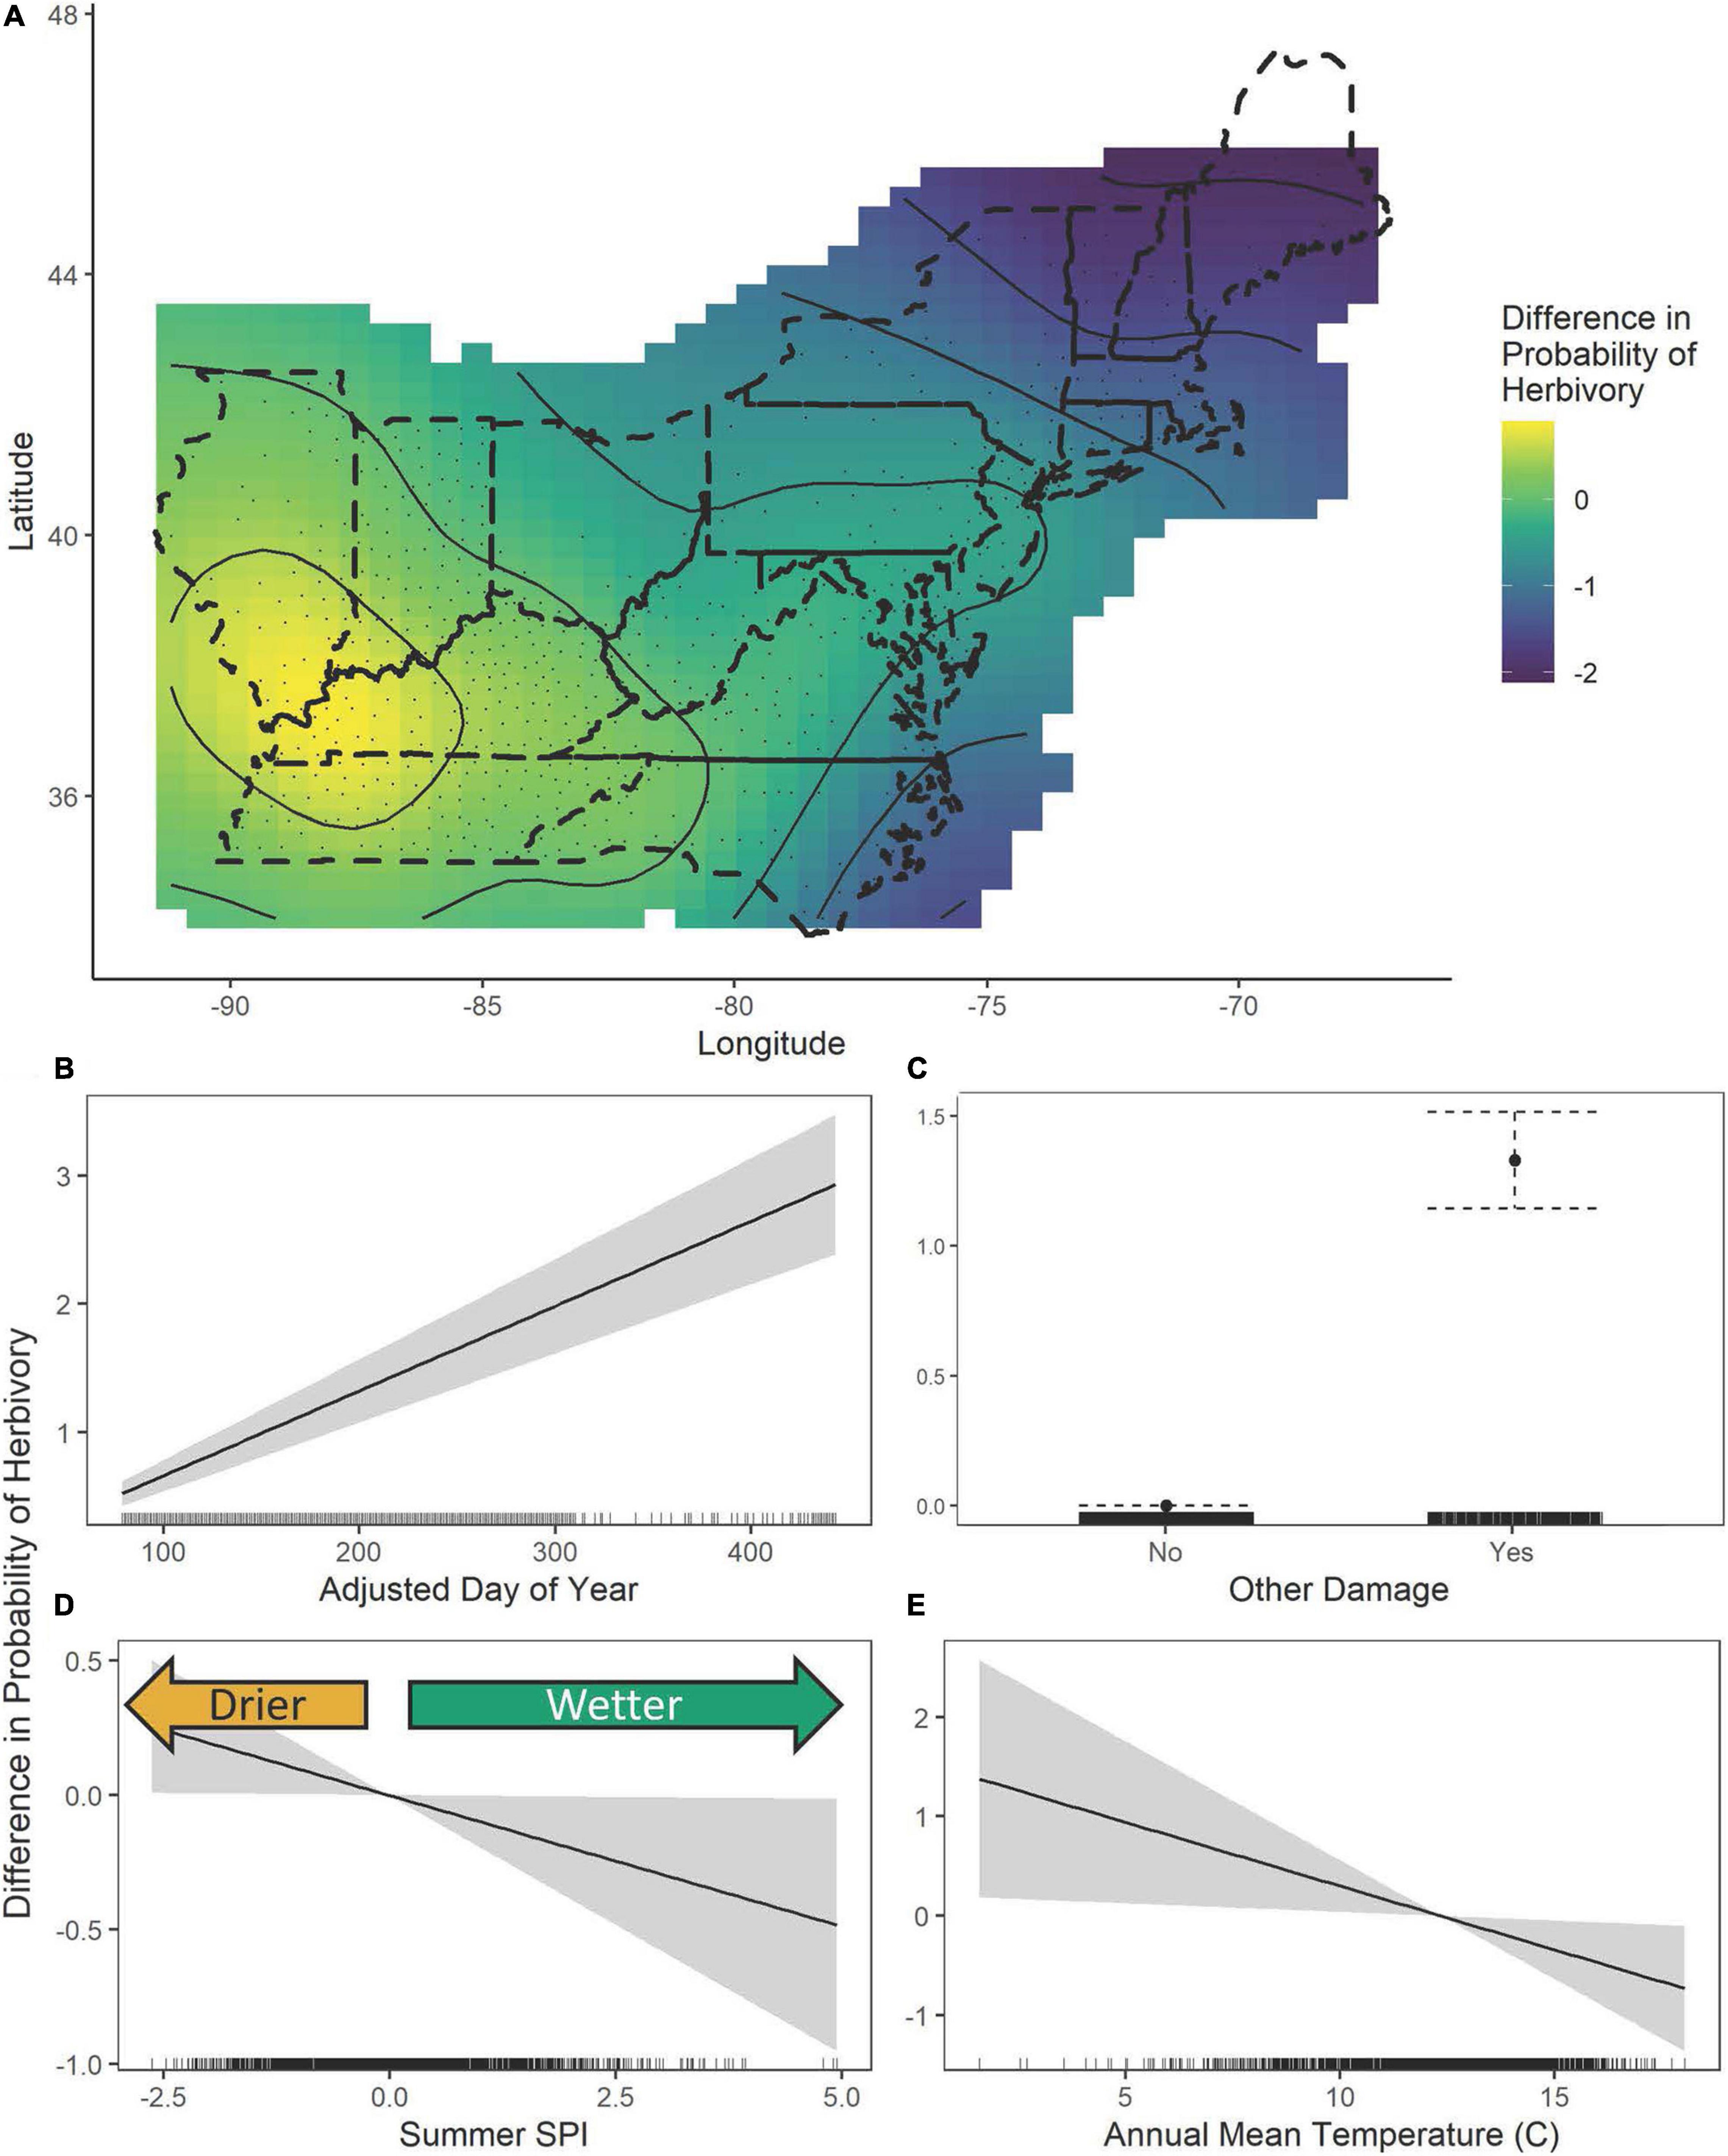
Figure 8. The estimated contributions of the fitted smooths of latitude and longitude (A), the adjusted day of year (B), other damage (C), SPI summer (D), and the annual mean temperature (E) to the General Additive Model of the probability of herbivore damage. In figure (A), the dashed lines show the United States state boundaries in the included regions, while the solid lines show the fitted smoothed curves output from the GAMs overlaid with the fitted contour showing spatial differences in the probability of herbivory. In figures (B,D,E) the solid curve while the gray regions or dotted whiskers represent the 95% confidence interval and in figure (C) the solid point shows the estimated contribution while the dotted lines show the 95% confidence interval. tick marks along the x-axis indicate the density of specimens.
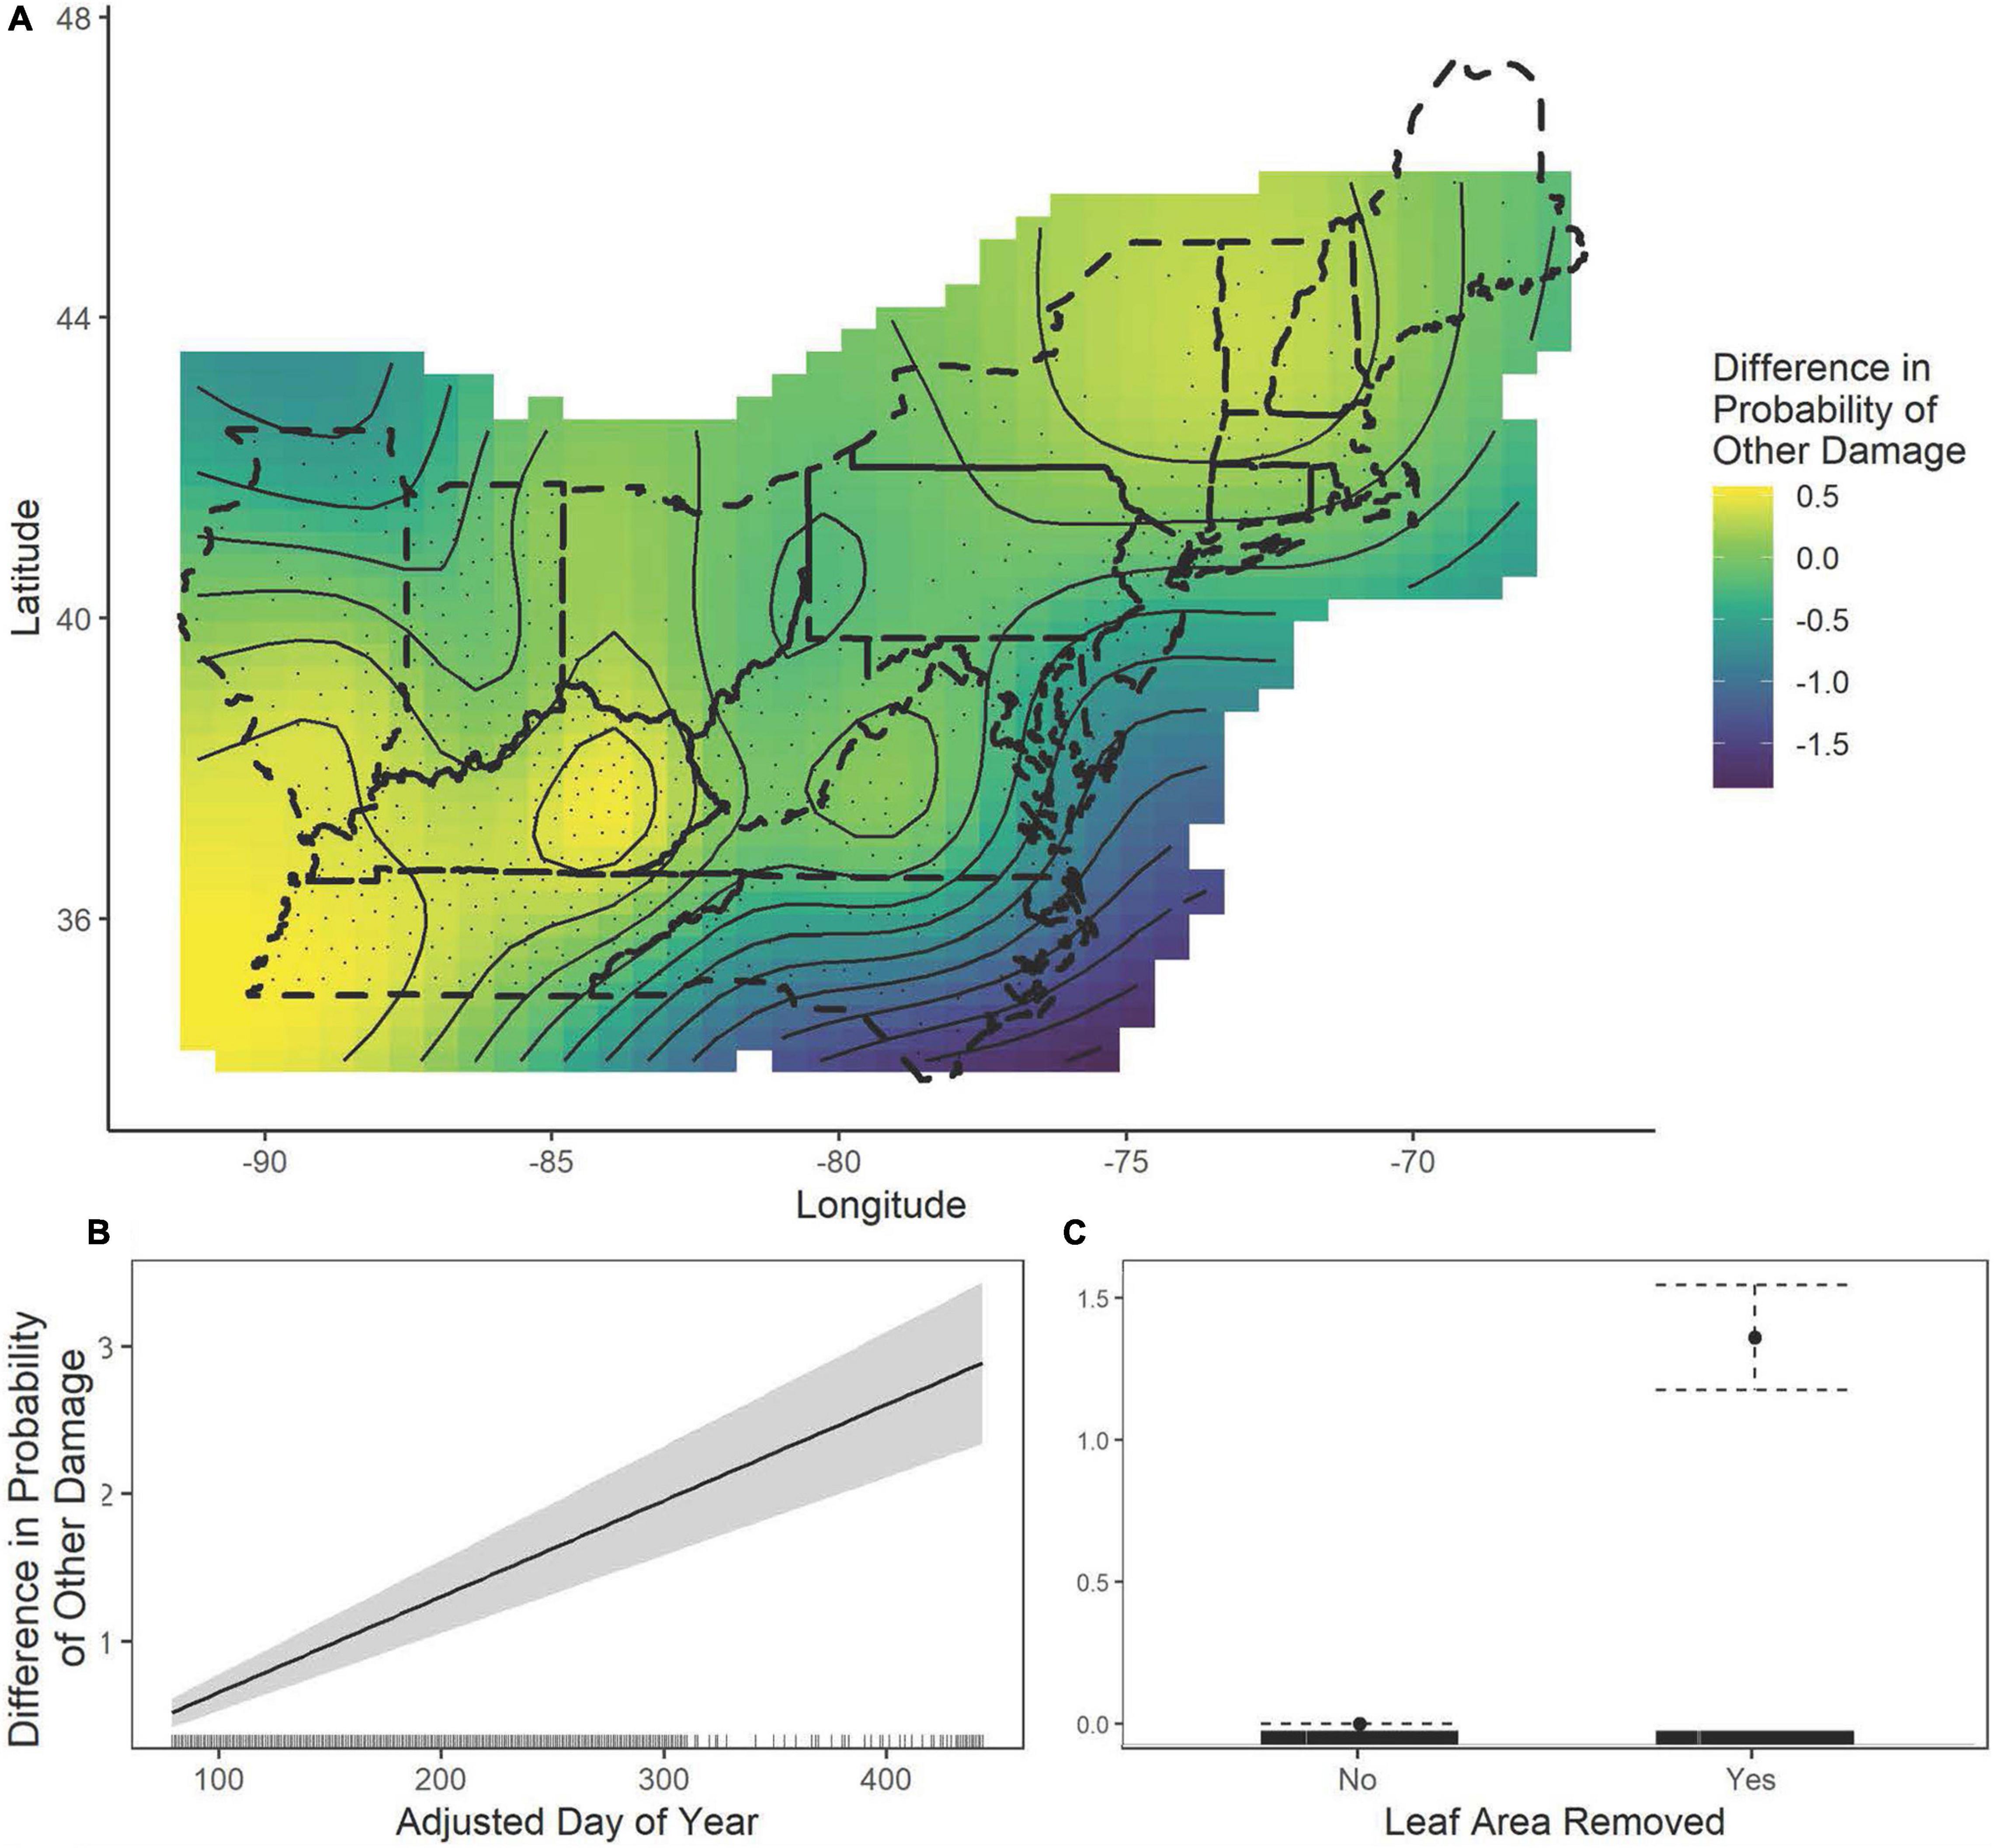
Figure 9. The estimated contributions of the fitted smooths of latitude and longitude (A), the adjusted day of year (B) and leaf area removal (C) to the General Additive Model of the probability of damage other than leaf chewing. In figure (A), the dashed lines show the United States state boundaries in the included regions, while the solid lines show the fitted smoothed curves output from the GAMs overlaid with the fitted contour showing spatial differences. In figure (B), the solid curve while the gray regions or dotted whiskers represent the 95% confidence interval and in figure (C) the solid point shows the estimated contribution while the dotted lines show the 95% confidence interval. Tick marks along the x-axis indicate the density of specimens.
The probability of leaf area removal varied spatially (edf = 15.88, χ2 = 94.34, P < 0.0001, Figure 8A). The pattern of spatial variation in leaf area removal showed lower probabilities of herbivory in more northern and coastal regions (Figure 8A). The probability of herbivory was also associated with the summer SPI (edf = 1.0, χ2 = 4.09, P = 0.043, Figure 8D) and the annual mean temperatures (edf = 1.0, χ2 = 5.13, P = 0.024, Figure 8E), with increasing drought associated with a higher probability of herbivory and increasing wetness associated with decreased probability of herbivory. Lower average annual temperatures were associated with a higher probability of damage, but higher annual temperatures were associated with decreased probability of herbivory. Unlike herbivory, other damage did not display strong associations with climate variation. However, there were patterns of spatial variation (edf = 17.45, χ2 = 64.45, P < 0.0001), with northern and inland regions showing higher probabilities of other damage (Figure 9A).
Discussion
Our analyses of red and sugar maple phenology suggest that autumn coloration has been delayed by approximately 0.26 days/year since 1826, leading to a delay of more than a month in recent decades (Figures 2, 3). We find that the probability of coloration and the timing of fall color is related to drought severity, with more severe droughts increasing the probability of colored leaves (Figure 6A). Additionally, we find signals of increasing herbivory and pathogen damage recorded on herbarium specimens (Figure 7). These changes in foliar damage were associated with both the probability of coloration and the timing of maple leaf abscission. Foliar damage, both herbivory and pathogen damage, was associated with a significantly higher probability that a specimen showed autumn coloration (Table 2). Herbivory was also associated with a nearly three-week earlier abscission date compared to undamaged specimens. Together, these results indicate that foliar damage by insect herbivores and pathogens is a critical biotic determinant of the timing and expression of autumnal phenophases, and that in some cases it may counteract climate-driven delays.
We find that drought and precipitation regimes play a vital role in the timing of abscission and autumn coloration in maples. We find that more severe drought was associated with significantly earlier last leaf observation dates. Specifically, an SPI two standard deviations drier than historical averages was associated with a last leaf date 25 days earlier than average (Figure 4E). Wetter conditions significantly delayed the last observation date, with conditions three standard deviations wetter than historical averages associated with last leaf dates more than a month later (Figure 4E). In conjunction with a positive but non-linear relationship with temperature, this could indicate an important role of evapotranspiration in modifying abscission dates and lengthening the growing season. Some previous studies found that daytime warming in autumn was associated with earlier abscission because higher daytime evapotranspiration without a corresponding increase in precipitation increases tree water stress (Chen et al., 2020). The first observation of colored leaves also showed a strong association with drought (Figure 5A), as did the probability that a specimen contained colored leaves (Figure 6A). Global climate change is projected to increase the variance of precipitation, increasing the risk of both floods and droughts (Meehl and Tebaldi, 2004; Trenberth et al., 2014; Hubbart et al., 2016). Under future climate scenarios, the combined effects of temperature, drought, wetness, and leaf damage may stress trees and negatively affect forest health and phenological timing.
Our finding of a 19-day advance in the last observation day of leaves when specimens were damaged by foliar herbivores is consistent with experimental manipulations of A. rubrum that showed earlier abscission on trees with high levels of simulated herbivory (Forkner, 2013) and with previous studies demonstrating shorter leaf lifespans in herbivore-damaged leaves (Risley and Crossley, 1988). The probability of leaf coloration was also increased with the probability of both herbivory and other damage (Table 2). Red leaf coloration has been proposed as a signal to protect against excessive herbivory, particularly in immature leaves (Karageorgou and Manetas, 2006; Karageorgou et al., 2008; Green et al., 2015), and some red coloration may be related to fungal pathogens (Coley and Aide, 1989). Experimentally, red maples have been shown to prematurely color damaged leaves (Forkner, 2013). Damage may, therefore, be working in opposition to climate-related delays, and increased herbivory over the past century could offset observed extensions of the growing season. Because abscission was earlier as drought and herbivory increased, these stressors may reduce the predicted lengthening of the growing season based on models using remotely sensed data.
Changes in herbivory probabilities were associated with drought conditions and temperature, with more severe drought associated with higher probabilities of herbivory damage and higher temperatures associated with lower probabilities of herbivory damage (Figure 8D). The direction and magnitude of temperature impacts on insect herbivores are known to vary by species (Lemoine et al., 2014). Increasing temperatures are generally expected to increase insect survival (Meineke et al., 2013; Dale and Frank, 2017), but extremely high temperatures can decrease insect survival and increase developmental time (Rocha et al., 2017). Both insect and pathogen damage increased over the time period of the study, with leaf area removal associated with an increase in the probability of other pathogen damage on a specimen and vice versa (Table 2). Experimental studies have demonstrated that some insect herbivores can be attracted to diseased host plants if infection increases the nutritional quality of the plant or alters chemical defenses (Stout et al., 2006; Srisakrapikoop et al., 2020). Herbivory also causes wounding of plant foliar tissue, which can introduce microbial pathogens or cause further damage (Savatin et al., 2014).
Increases in the probability of pathogen damage over time were not solely explained by climate variability, suggesting that other changing forest features over the past two centuries may be responsible. This might include the introduction of invasive species, land-use changes, and urbanization (Meineke et al., 2013, 2014; Dale and Frank, 2017). However, because of the observed relationship between herbivory and pathogen damage, pathogen damage may show similar patterns with drought and temperature in more detailed studies. Wetter years are associated with many fungal plant pathogens (Desprez-Loustau et al., 2007; Giauque and Hawkes, 2016; Hubbart et al., 2016), but other fungal, viral, and bacterial diseases can be more successful in attacking stressed plants during droughts (Dale et al., 2001; Desprez-Loustau et al., 2007; Jactel et al., 2012). Therefore, future studies may benefit from explicitly investigating the identities of pathogens causing damage, as fungal, viral, and bacterial diseases may have different climate relationships. Additionally, explaining the observed spatial patterns is challenging because they may be confounded by urbanization, deforestation, changes in deciduous tree species composition, and invasive species introductions over the time span of our analysis. Accordingly, we further suggest that future studies using herbaria specimens incorporate measures of forest management and urbanization over time in models of phenological change to improve our understanding of spatial variability in phenology and foliar damage over time.
In summary, our results imply that increasing damage may mask shifts in the timing of coloration onset and may partially offset end-of-season delays in the future. Although sample sizes were relatively small in this study, as digitization efforts increase the availability of specimens, our ability to detect relationships between climate and phenological timing using herbaria will improve (Beaman and Cellinese, 2012; Soltis, 2017; Giraud et al., 2018). Clearly, heat, water, insect, and pathogen stressors collectively impact autumn phenology, and models of future forest growth may need to incorporate all three for improved predictions. Our study indicates that under some conditions, later coloration and earlier abscission may mean shorter autumns overall.
Data Availability Statement
The datasets presented in this study can be found in online repositories. The names of the repository/repositories and accession number(s) can be found below: https://portal.edirepository.org/nis/mapbrowse?scope=edi&identifier=713.
Author Contributions
AG and RF contributed to the conceptualization, methodology of the article, and analyzed and annotated herbaria specimens. AG curated and analyzed the data and wrote the original draft. RF administered the project, provided supervision, and provided additional writing, review, and editing. Both authors contributed to the article and approved the submitted version.
Funding
This project was supported in part by a National Science Foundation grant to RF (DEB-1354665). Additionally, AG was supported by the National Science Foundation Graduate Research Fellowship Program (DGE-1842191). SERNEC was funded by an RCN Grant from the National Science Foundation in 2006–2012 and an ADBC grant in 2014–2018. Publication of this article was funded in part by the George Mason University Libraries Open Access Publishing Fund.
Conflict of Interest
The authors declare that the research was conducted in the absence of any commercial or financial relationships that could be construed as a potential conflict of interest.
Publisher’s Note
All claims expressed in this article are solely those of the authors and do not necessarily represent those of their affiliated organizations, or those of the publisher, the editors and the reviewers. Any product that may be evaluated in this article, or claim that may be made by its manufacturer, is not guaranteed or endorsed by the publisher.
Acknowledgments
We gratefully acknowledge the work of the numerous herbaria collectors, curators, and digitization staff in enabling this research. We are grateful to the institutions and herbaria who provided specimens: ALA, APSC, AVCH, BCWS, BOON, CHIC, CMC, CONV, DBG:KHD, DEK, DES, DOV, DSC, EIU, EKY, F:Botany, FLAS, FSU, FUGR, GEO, GMUF:Plants, GSW, HCHM, iNaturalist, IND, KNK, LSU:Vascular Plants, LYN, MARY, MO, MOR, MUHW, NCSC, NCU, NY, SWMT, TENN, UCAC, UNCC, UNM, USCH, USCS, USMS, USU:UTC, UT:Botany, UTM, UWFP, VPI, VSC, and WCUH. This article was developed in fulfillment of AG’s B.S. and M.S. in biology. We thank Lorelei D. Crerar and Rebecca Dikow, as well as Rachel A. Keuler and Alexandra Duffy, for comments on the manuscript and analyses. We also thank Andrea Weeks, Director of the Ted R. Bradley Herbarium at GMU, for advice when starting the project. Additionally, we acknowledge Kadiera S. Ingram for her initial assistance. Finally, AG thanks Geraldine Grant and the Biology Research Semester participants for their comments on the development of the project.
Supplementary Material
The Supplementary Material for this article can be found online at: https://www.frontiersin.org/articles/10.3389/ffgc.2021.664763/full#supplementary-material
References
Archetti, M., Richardson, A. D., O’Keefe, J., and Delpierre, N. (2013). Predicting climate change impacts on the amount and duration of autumn colors in a New England forest. PLoS One 8:e57373. doi: 10.1371/journal.pone.0057373
Ayres, M. P., and Lombardero, M. J. (2000). Assessing the consequences of global change for forest disturbance from herbivores and pathogens. Sci. Total Environ. 262, 263–286.
Badeck, F.-W., Bondeau, A., Böttcher, K., Doktor, D., Lucht, W., Schaber, J., et al. (2004). Responses of spring phenology to climate change. New Phytol. 162, 295–309.
Bale, J. S., Masters, G. J., Hodkinson, I. D., Awmack, C., Bezemer, T. M., Brown, V. K., et al. (2002). Herbivory in global climate change research: direct effects of rising temperature on insect herbivores. Glob. Change Biol. 8, 1–16. doi: 10.1046/j.1365-2486.2002.00451.x
Beaman, R. S., and Cellinese, N. (2012). Mass digitization of scientific collections: new opportunities to transform the use of biological specimens and underwrite biodiversity science. Zookeys 209, 7–17. doi: 10.3897/zookeys.209.3313
Beauvais, M.-P., Pellerin, S., Dubé, J., and Lavoie, C. (2017). Herbarium specimens as tools to assess the impact of large herbivores on plant species. Botany 95, 153–162. doi: 10.1139/cjb-2016-0206
Belovsky, G. E., and Slade, J. B. (2000). Insect herbivory accelerates nutrient cycling and increases plant production. Proc. Natl. Acad. Sci. U.S.A. 97, 14412–14417. doi: 10.1073/pnas.250483797
Besnard, G., Gaudeul, M., Lavergne, S., Muller, S., Rouhan, G., Sukhorukov, A. P., et al. (2018). Herbarium-based science in the twenty-first century. Bot. Lett. 165, 323–327. doi: 10.1080/23818107.2018.1482783
Calinger, K. M., Queenborough, S., and Curtis, P. S. (2013). Herbarium specimens reveal the footprint of climate change on flowering trends across north-central North America. Ecol. Lett. 16, 1037–1044. doi: 10.1111/ele.12135
Chakraborty, S. (2013). Migrate or evolve: options for plant pathogens under climate change. Glob. Change Biol. 19, 1985–2000. doi: 10.1111/gcb.12205
Chen, L., Hänninen, H., Rossi, S., Smith, N. G., Pau, S., Liu, Z., et al. (2020). Leaf senescence exhibits stronger climatic responses during warm than during cold autumns. Nat. Clim. Change 10, 777–780. doi: 10.1038/s41558-020-0820-2
Coleman, T. W., and Seybold, S. J. (2011). Collection history and comparison of the interactions of the goldspotted oak borer, Agrilus auroguttatus Schaeffer (Coleoptera: Buprestidae), with host oaks in Southern California and Southeastern Arizona, USA. Coleopt. Bull. 65, 93–108. doi: 10.1649/072.065.0224
Coley, P. D., and Aide, T. M. (1989). Red coloration of tropical young leaves: a possible antifungal defence? J. Trop. Ecol. 5, 293–300. doi: 10.1017/S0266467400003667
Cook, B. I., Ault, T. R., and Smerdon, J. E. (2015). Unprecedented 21st century drought risk in the American Southwest and Central Plains. Sci. Adv. 1:e1400082. doi: 10.1126/sciadv.1400082
Dai, A. (2013). Increasing drought under global warming in observations and models. Nat. Clim. Change 3, 52–58. doi: 10.1038/nclimate1633
Dai, A., Trenberth, K. E., and Qian, T. (2004). A global dataset of palmer drought severity index for 1870–2002: relationship with soil moisture and effects of surface warming. J. Hydrometeorol. 5, 1117–1130. doi: 10.1175/JHM-386.1
Dale, A. G., and Frank, S. D. (2017). Warming and drought combine to increase pest insect fitness on urban trees. PLoS One 12:e0173844. doi: 10.1371/journal.pone.0173844
Dale, V. H., Joyce, L. A., McNulty, S., Neilson, R. P., Ayres, M. P., Flannigan, M. D., et al. (2001). Climate change and forest disturbances: climate change can affect forests by altering the frequency, intensity, duration, and timing of fire, drought, introduced species, insect and pathogen outbreaks, hurricanes, windstorms, ice storms, or landslides. Bioscience 51, 723–734.
Davis, C. C., Willis, C. G., Connolly, B., Kelly, C., and Ellison, A. M. (2015). Herbarium records are reliable sources of phenological change driven by climate and provide novel insights into species’ phenological cueing mechanisms. Am. J. Bot. 102, 1599–1609. doi: 10.3732/ajb.1500237
Denny, E. G., Gerst, K. L., Miller-Rushing, A. J., Tierney, G. L., Crimmins, T. M., Enquist, C. A. F., et al. (2014). Standardized phenology monitoring methods to track plant and animal activity for science and resource management applications. Int. J. Biometeorol. 58, 591–601. doi: 10.1007/s00484-014-0789-5
Desprez-Loustau, M.-L., Marçais, B., Nageleisen, L.-M., Piou, D., and Vannini, A. (2006). Interactive effects of drought and pathogens in forest trees. Ann. For. Sci. 63, 597–612. doi: 10.1051/forest:2006040
Desprez-Loustau, M.-L., Robin, C., Reynaud, G., Déqué, M., Badeau, V., Piou, D., et al. (2007). Simulating the effects of a climate-change scenario on the geographical range and activity of forest-pathogenic fungi. Can. J. Plant Pathol. 29, 101–120. doi: 10.1080/07060660709507447
Deutsch, C. A., Tewksbury, J. J., Huey, R. B., Sheldon, K. S., Ghalambor, C. K., Haak, D. C., et al. (2008). Impacts of climate warming on terrestrial ectotherms across latitude. Proc. Natl. Acad. Sci. U.S.A. 105, 6668–6672. doi: 10.1073/pnas.0709472105
Dukes, J. S., Pontius, J., Orwig, D., Garnas, J. R., Rodgers, V. L., Brazee, N., et al. (2009). Responses of insect pests, pathogens, and invasive plant species to climate change in the forests of northeastern North America: what can we predict? This article is one of a selection of papers from NE forests 2100: a synthesis of climate change impacts on forests of the Northeastern US and Eastern Canada. Can. J. For. Res. 39, 231–248. doi: 10.1139/X08-171
Elad, Y., and Pertot, I. (2014). Climate change impacts on plant pathogens and plant diseases. J. Crop Improv. 28, 99–139. doi: 10.1080/15427528.2014.865412
Ellwood, E. R., Primack, R. B., Willis, C. G., and HilleRisLambers, J. (2019). Phenology models using herbarium specimens are only slightly improved by using finer-scale stages of reproduction. Appl. Plant Sci. 7:e01225. doi: 10.1002/aps3.1225
Ellwood, E. R., Temple, S. A., Primack, R. B., Bradley, N. L., and Davis, C. C. (2013). Record-breaking early flowering in the eastern United States. PLoS One 8:e53788. doi: 10.1371/journal.pone.0053788
Everill, P. H., Primack, R. B., Ellwood, E. R., and Melaas, E. K. (2014). Determining past leaf-out times of New England’s deciduous forests from herbarium specimens. Am. J. Bot. 101, 1293–1300. doi: 10.3732/ajb.1400045
Fasiolo, M., Nedellec, R., Goude, Y., and Wood, S. N. (2020). Scalable visualization methods for modern generalized additive models. J. Comput. Graph. Stat. 29, 78–86.
Forkner, R. E. (2013). Simulated herbivory advances autumn phenology in Acer rubrum. Int. J. Biometeorol. 58, 499–507.
Gallinat, A. S., Primack, R. B., and Wagner, D. L. (2015). Autumn, the neglected season in climate change research. Trends Ecol. Evol. 30, 169–176. doi: 10.1016/j.tree.2015.01.004
Garretson, A. (2021). Institutional differences in the stewardship and research output of United States Herbaria. bioRxiv [Preprint]. doi: 10.1101/2021.01.07.425759
Garretson, A., and Forkner, R. E. (2021). Data from Herbarium Specimens Reveal Delays in Autumn Maple Coloration in the Northeastern United States Over the Past 150 Years. Environmental Data Initiative. doi: 10.6073/PASTA/FA6ECC44FA123E83DFF8F169A8CEA230
Garrett, K. A., Nita, M., De Wolf, E. D., Esker, P. D., Gomez-Montano, L., and Sparks, A. H. (2016). “Chapter 21 – Plant pathogens as indicators of climate change,” in Climate Change, 2nd Edn. ed. T. M. Letcher (Boston, MA: Elsevier), 325–338. doi: 10.1016/B978-0-444-63524-2.00021-X
Gely, C., Laurance, S. G. W., and Stork, N. E. (2020). How do herbivorous insects respond to drought stress in trees? Biol. Rev. 95, 434–448. doi: 10.1111/brv.12571
Giauque, H., and Hawkes, C. V. (2016). Historical and current climate drive spatial and temporal patterns in fungal endophyte diversity. Fungal Ecol. 20, 108–114. doi: 10.1016/j.funeco.2015.12.005
Giraud, M., Groom, Q., Bogaerts, A., de Smedt, S., Saarenmaa, H., Wijkamp, N., et al. (2018). Best Practice Guidelines for Imaging of Herbarium Specimens. Innovation and Consolidation for Large Scale Digitization of Natural Heritage.
Green, J. P., Foster, R., Wilkins, L., Osorio, D., and Hartley, S. E. (2015). Leaf colour as a signal of chemical defence to insect herbivores in wild cabbage (Brassica oleracea). PLoS One 10:e0136884. doi: 10.1371/journal.pone.0136884
Gries, C., Gilbert, E., and Franz, N. (2014). Symbiota – a virtual platform for creating voucher-based biodiversity information communities. Biodivers. Data J. 2:e1114. doi: 10.3897/BDJ.2.e1114
Guttman, N. B. (1999). Accepting the standardized precipitation index: a calculation algorithm. JAWRA J. Am. Water Resour. Assoc. 35, 311–322. doi: 10.1111/j.1752-1688.1999.tb03592.x
Heberling, J. M., and Isaac, B. L. (2019). iNaturalist as a tool to expand the research value of museum specimens. Plant J. 6:e01193. doi: 10.1002/aps3.1193
Hobbie, J. E., Carpenter, S. R., Grimm, N. B., Gosz, J. R., and Seastedt, T. R. (2003). The US long term ecological research program. Bioscience 53, 21–32.
Hubbart, J. A., Guyette, R., and Muzika, R.-M. (2016). More than drought: precipitation variance, excessive wetness, pathogens and the future of the western edge of the Eastern Deciduous forest. Sci. Total Environ. 566–567, 463–467. doi: 10.1016/j.scitotenv.2016.05.108
Huntington, T. G. (2006). Evidence for intensification of the global water cycle: review and synthesis. J. Hydrol. 319, 83–95. doi: 10.1016/j.jhydrol.2005.07.003
Jactel, H., Petit, J., Desprez-Loustau, M.-L., Delzon, S., Piou, D., Battisti, A., et al. (2012). Drought effects on damage by forest insects and pathogens: a meta-analysis. Glob. Change Biol. 18, 267–276. doi: 10.1111/j.1365-2486.2011.02512.x
Jones, C. A., and Daehler, C. C. (2018). Herbarium specimens can reveal impacts of climate change on plant phenology; a review of methods and applications. PeerJ 6:e4576. doi: 10.7717/peerj.4576
Jones, R., and Barbetti, M. J. (2012). Influence of climate change on plant disease infections and epidemics caused by viruses and bacteria. CAB Rev. Perspect. Agric. Vet. Sci. Nutr. Nat. Resour. 7, 1–33. doi: 10.1079/PAVSNNR20127022
Juroszek, P., and von Tiedemann, A. (2013). Plant pathogens, insect pests and weeds in a changing global climate: a review of approaches, challenges, research gaps, key studies and concepts. J. Agric. Sci. 151, 163–188. doi: 10.1017/S0021859612000500
Karageorgou, P., Buschmann, C., and Manetas, Y. (2008). Red leaf color as a warning signal against insect herbivory: honest or mimetic? Flora Morphol. Distrib. Funct. Ecol. Plants 203, 648–652. doi: 10.1016/j.flora.2007.10.006
Karageorgou, P., and Manetas, Y. (2006). The importance of being red when young: anthocyanins and the protection of young leaves of Quercus coccifera from insect herbivory and excess light. Tree Physiol. 26, 613–621. doi: 10.1093/treephys/26.5.613
Kingsolver, J. G., Diamond, S. E., and Buckley, L. B. (2013). Heat stress and the fitness consequences of climate change for terrestrial ectotherms. Funct. Ecol. 27, 1415–1423. doi: 10.1111/1365-2435.12145
Lang, P. L. M., Willems, F. M., Scheepens, J. F., Burbano, H. A., and Bossdorf, O. (2019). Using herbaria to study global environmental change. New Phytol. 221, 110–122. doi: 10.1111/nph.15401
Lavoie, C. (2013). Biological collections in an ever changing world: herbaria as tools for biogeographical and environmental studies. Perspect. Plant Ecol. Evol. Syst. 15, 68–76. doi: 10.1016/j.ppees.2012.10.002
Lemoine, N. P., Burkepile, D. E., and Parker, J. D. (2014). Variable effects of temperature on insect herbivory. PeerJ 2:e376. doi: 10.7717/peerj.376
Liu, Q., Fu, Y. H., Zhu, Z., Liu, Y., Liu, Z., Huang, M., et al. (2016). Delayed autumn phenology in the Northern Hemisphere is related to change in both climate and spring phenology. Glob. Change Biol. 22, 3702–3711. doi: 10.1111/gcb.13311
Loehle, C. (1988). Tree life history strategies: the role of defenses. Can. J. For. Res. 18, 209–222.
Lorimer, C. G., Dahir, S. E., and Nordheim, E. V. (2004). Tree mortality rates and longevity in mature and old-growth hemlock-hardwood forests. J. Ecol. 89, 960–971. doi: 10.1111/j.1365-2745.2001.00619.x
Magnuson, J. J. (1990). Long-term ecological research and the invisible present. Bioscience 40, 495–501. doi: 10.2307/1311317
Marquis, R. J., Lill, J. T., Forkner, R. E., Le Corff, J., Landosky, J. M., and Whitfield, J. B. (2019). Declines and resilience of communities of leaf chewing insects on Missouri oaks following spring frost and summer drought. Front. Ecol. Evol. 7:396. doi: 10.3389/fevo.2019.00396
McKee, T. B., Doesken, N. J., and Kleist, J. (1993). “The relationship of drought frequency and duration to time scales,” in Proceedings of the 8th Conference on Applied Climatology (Boston, MA), 179–183.
Meehl, G. A., and Tebaldi, C. (2004). More intense, more frequent, and longer lasting heat waves in the 21st century. Science 305, 994–997. doi: 10.1126/science.1098704
Meineke, E. K., and Davies, T. J. (2019). Museum specimens provide novel insights into changing plant–herbivore interactions. Philos. Trans. R. Soc. B: Biol. Sci. 374, 20170393. doi: 10.1098/rstb.2017.0393
Meineke, E. K., Classen, A. T., Sanders, N. J., and Davies, T. J. (2019). Herbarium specimens reveal increasing herbivory over the past century. J. Ecol. 107, 105–117. doi: 10.1111/1365-2745.13057
Meineke, E. K., Davis, C. C., and Davies, T. J. (2018). The unrealized potential of herbaria for global change biology. Ecol. Monogr. 88, 505–525. doi: 10.1002/ecm.1307
Meineke, E. K., Dunn, R. R., and Frank, S. D. (2014). Early pest development and loss of biological control are associated with urban warming. Biol. Lett. 10:20140586. doi: 10.1098/rsbl.2014.0586
Meineke, E. K., Dunn, R. R., Sexton, J. O., and Frank, S. D. (2013). Urban warming drives insect pest abundance on street trees. PLoS One 8:e59687. doi: 10.1371/journal.pone.0059687
Menzel, A., Sparks, T. H., Estrella, N., Koch, E., Aasa, A., Ahas, R., et al. (2006). European phenological response to climate change matches the warming pattern. Glob. Change Biol. 12, 1969–1976. doi: 10.1111/j.1365-2486.2006.01193.x
Morellato, L. P. C., Alberti, L. F., and Hudson, I. L. (2010). “Applications of circular statistics in plant phenology: a case studies approach,” in Phenological Research: Methods for Environmental and Climate Change Analysis, eds I. L. Hudson and M. R. Keatley (Dordrecht: Springer Netherlands), 339–359. doi: 10.1007/978-90-481-3335-2_16
National Research Council (2008). Earth Observations from Space: The First 50 Years of Scientific Achievements. Washington, DC: National Academies Press.
Norby, R. J., Hartz-Rubin, J. S., and Verbrugge, M. J. (2003). Phenological responses in maple to experimental atmospheric warming and CO2 enrichment. Glob. Change Biol. 9, 1792–1801. doi: 10.1111/j.1365-2486.2003.00714.x
Pabon-Moreno, D. E., Musavi, T., Migliavacca, M., Reichstein, M., Römermann, C., and Mahecha, M. D. (2020). Ecosystem physio-phenology revealed using circular statistics. Biogeosciences 17, 3991–4006. doi: 10.5194/bg-17-3991-2020
Panchen, Z. A., Primack, R. B., Gallinat, A. S., Nordt, B., Stevens, A.-D., Du, Y., et al. (2015). Substantial variation in leaf senescence times among 1360 temperate woody plant species: implications for phenology and ecosystem processes. Ann. Bot. 116, 865–873. doi: 10.1093/aob/mcv015
Polgar, C. A., and Primack, R. B. (2011). Leaf-out phenology of temperate woody plants: from trees to ecosystems. New Phytol. 191, 926–941. doi: 10.1111/j.1469-8137.2011.03803.x
Primack, D., Imbres, C., Primack, R. B., Miller-Rushing, A. J., and Del Tredici, P. (2004). Herbarium specimens demonstrate earlier flowering times in response to warming in Boston. Am. J. Bot. 91, 1260–1264.
PRISM Climate Group (2020). PRISM Data Explorer. Oregon State University. Available online at: http://www.prism.oregonstate.edu/ (accessed June 10, 2020).
R Core Team (2016). R: A Language and Environment for Statistical Computing. Vienna: R Foundation for Statistical Computing.
Risley, L. S., and Crossley, D. A. (1988). Herbivore-caused greenfall in the southern Appalachians. Ecology 69, 1118–1127. doi: 10.2307/1941266
Robin, X., Turck, N., Hainard, A., Tiberti, N., Lisacek, F., Sanchez, J.-C., et al. (2011). pROC: an open-source package for R and S+ to analyze and compare ROC curves. BMC Bioinformatics 12:77. doi: 10.1186/1471-2105-12-77
Rocha, S., Kerdelhué, C., Jamaa, M. L. B., Dhahri, S., Burban, C., and Branco, M. (2017). Effect of heat waves on embryo mortality in the pine processionary moth. Bull. Entomol. Res. 107, 583–591. doi: 10.1017/S0007485317000104
Savatin, D. V., Gramegna, G., Modesti, V., and Cervone, F. (2014). Wounding in the plant tissue: the defense of a dangerous passage. Front. Plant Sci. 5:470. doi: 10.3389/fpls.2014.00470
Schaberg, P. G., van den Berg, A. K., Murakami, P. F., Shane, J. B., and Donnelly, J. R. (2003). Factors influencing red expression in autumn foliage of sugar maple trees. Tree Physiol. 23, 325–333. doi: 10.1093/treephys/23.5.325
Shaw, M. W., and Osborne, T. M. (2011). Geographic distribution of plant pathogens in response to climate change. Plant Pathol. 60, 31–43. doi: 10.1111/j.1365-3059.2010.02407.x
Sheffield, J., Wood, E. F., and Roderick, M. L. (2012). Little change in global drought over the past 60 years. Nature 491, 435–438. doi: 10.1038/nature11575
Srisakrapikoop, U., Pirie, T. J., and Fellowes, M. D. E. (2020). Meta-analysis suggests differing indirect effects of viral, bacterial, and fungal plant pathogens on the natural enemies of insect herbivores. Insects 11:765. doi: 10.3390/insects11110765
Stout, M. J., Thaler, J. S., and Thomma, B. P. H. J. (2006). Plant-mediated interactions between pathogenic microorganisms and herbivorous arthropods. Annu. Rev. Entomol. 51, 663–689. doi: 10.1146/annurev.ento.51.110104.151117
Touma, D., Ashfaq, M., Nayak, M. A., Kao, S.-C., and Diffenbaugh, N. S. (2015). A multi-model and multi-index evaluation of drought characteristics in the 21st century. J. Hydrol. 526, 196–207. doi: 10.1016/j.jhydrol.2014.12.011
Trenberth, K. E., Dai, A., van der Schrier, G., Jones, P. D., Barichivich, J., Briffa, K. R., et al. (2014). Global warming and changes in drought. Nat. Clim. Change 4, 17–22. doi: 10.1038/nclimate2067
Trexler, J. C., and Travis, J. (1993). Nontraditional regression analyses. Ecology 74, 1629–1637. doi: 10.2307/1939921
Turcotte, M. M., Thomsen, C. J. M., Broadhead, G. T., Fine, P. V. A., Godfrey, R. M., Lamarre, G. P. A., et al. (2014). Percentage leaf herbivory across vascular plant species. Ecology 95, 788–788. doi: 10.1890/13-1741.1
Ustin, S. L., and Gamon, J. A. (2010). Remote sensing of plant functional types. New Phytol. 186, 795–816. doi: 10.1111/j.1469-8137.2010.03284.x
West, J. S., Townsend, J. A., Stevens, M., and Fitt, B. D. L. (2012). Comparative biology of different plant pathogens to estimate effects of climate change on crop diseases in Europe. Eur. J. Plant Pathol. 133, 315–331. doi: 10.1007/s10658-011-9932-x
Wheeler, J. A., Gonzalez, N. M., and Stinson, K. A. (2016). Red hot maples: Acer rubrum first-year phenology and growth responses to soil warming. Can. J. For. Res. 47, 159–165. doi: 10.1139/cjfr-2016-0288
Wickham, H., Averick, M., Bryan, J., Chang, W., McGowan, L. D., François, R., et al. (2019). Welcome to the Tidyverse. J. Open Source Softw. 4:1686. doi: 10.21105/joss.01686
Wickham, H., and RStudio (2019). tidyverse: Easily Install and Load the “Tidyverse”. Available online at: https://CRAN.R-project.org/package=tidyverse (accessed July 1, 2020).
Williams-Linera, G., and Baltazar, A. (2001). Herbivory on young and mature leaves of one temperate deciduous and two tropical evergreen trees in the understory and canopy of a Mexican cloud forest. Selbyana 22, 213–218.
Wolfe, D. W., Schwartz, M. D., Lakso, A. N., Otsuki, Y., Pool, R. M., and Shaulis, N. J. (2005). Climate change and shifts in spring phenology of three horticultural woody perennials in northeastern USA. Int. J. Biometeorol. 49, 303–309.
Wolkovich, E. M., Cook, B. I., Allen, J. M., Crimmins, T. M., Betancourt, J. L., Travers, S. E., et al. (2012). Warming experiments underpredict plant phenological responses to climate change. Nature 485, 494–497. doi: 10.1038/nature11014
Wood, S. N. (2004). Stable and efficient multiple smoothing parameter estimation for generalized additive models. J. Am. Stat. Assoc. 99, 673–686.
Wood, S. N. (2011). Fast stable restricted maximum likelihood and marginal likelihood estimation of semiparametric generalized linear models. J. R. Stat. Soc. Ser. B Stat. Methodol. 73, 3–36. doi: 10.1111/j.1467-9868.2010.00749.x
Wood, S. N. (2017). Generalized Additive Models: An Introduction With R, 2nd Edn. Boca Raton, MA: CRC Press.
Wood, S. N., Pya, N., and Säfken, B. (2016). Smoothing parameter and model selection for general smooth models. J. Am. Stat. Assoc. 111, 1548–1563. doi: 10.1080/01621459.2016.1180986
Xie, Y., Wang, X., Wilson, A. M., and Silander, J. A. (2018b). Predicting autumn phenology: how deciduous tree species respond to weather stressors. Agric. For. Meteorol. 250–251, 127–137. doi: 10.1016/j.agrformet.2017.12.259
Xie, Y., Civco, D. L., and Silander, J. A. (2018a). Species-specific spring and autumn leaf phenology captured by time-lapse digital cameras. Ecosphere 9:e02089. doi: 10.1002/ecs2.2089
Yee, T. W., and Mitchell, N. D. (1991). Generalized additive models in plant ecology. J. Veg. Sci. 2, 587–602. doi: 10.2307/3236170
Yost, J. M., Sweeney, P. W., Gilbert, E., Nelson, G., Guralnick, R., Gallinat, A. S., et al. (2018). Digitization protocol for scoring reproductive phenology from herbarium specimens of seed plants. Appl. Plant Sci. 6:e1022. doi: 10.1002/aps3.1022
Zani, D., Crowther, T. W., Mo, L., Renner, S. S., and Zohner, C. M. (2020). Increased growing-season productivity drives earlier autumn leaf senescence in temperate trees. Science 370, 1066–1071. doi: 10.1126/science.abd8911
Zomlefer, W. B., Giannasi, D. E., and Hughes, S. (2017). SERNEC Data Portal: University of Georgia Herbarium (GA). Southeast Regional Network of Expertise and Collections (SERNEC).
Keywords: climate change, drought, abscission, phenology, forest pathogens, Acer, museum specimens, autumn
Citation: Garretson A and Forkner RE (2021) Herbaria Reveal Herbivory and Pathogen Increases and Shifts in Senescence for Northeastern United States Maples Over 150 Years. Front. For. Glob. Change 4:664763. doi: 10.3389/ffgc.2021.664763
Received: 06 February 2021; Accepted: 01 November 2021;
Published: 30 November 2021.
Edited by:
Shin Nagai, Japan Agency for Marine-Earth Science and Technology (JAMSTEC), JapanReviewed by:
Yanjun Du, Hainan University, ChinaYingying Xie, Northwestern University, United States
Copyright © 2021 Garretson and Forkner. This is an open-access article distributed under the terms of the Creative Commons Attribution License (CC BY). The use, distribution or reproduction in other forums is permitted, provided the original author(s) and the copyright owner(s) are credited and that the original publication in this journal is cited, in accordance with accepted academic practice. No use, distribution or reproduction is permitted which does not comply with these terms.
*Correspondence: Alexis Garretson, YWxleGlzLmdhcnJldHNvbkB0dWZ0cy5lZHU=