 Cathleen Wigand1*
 Meagan Eagle2
 Benjamin L. Branoff3
 Stephen Balogh1Kenneth M. Miller4Rose M. Martin1,5Alana Hanson1
 Autumn J. Oczkowski1Evelyn Huertas6Joseph Loffredo1,5Elizabeth B. Watson7
- 1U.S. EPA, Atlantic Coastal Environmental Sciences Division, Narragansett, RI, United States
- 2U.S. Geological Survey, Woods Hole Coastal and Marine Science Center, Woods Hole, MA, United States
- 3U.S. EPA, Gulf Ecosystem Measurement and Modeling Division, Gulf Breeze, FL, United States
- 4General Dynamics Information Technology, Alexandria, VA, United States
- 5Oak Ridge Institute for Science and Education Participant, Oak Ridge, TN, United States
- 6U.S. EPA, Caribbean Environmental Protection Division, Guaynabo, PR, United States
- 7Department of Biodiversity, Earth and Environmental Sciences and The Academy of Natural Sciences, Drexel University, Philadelphia, PA, United States
Mangroves sequester significant quantities of organic carbon (C) because of high rates of burial in the soil and storage in biomass. We estimated mangrove forest C storage and accumulation rates in aboveground and belowground components among five sites along an urbanization gradient in the San Juan Bay Estuary, Puerto Rico. Sites included the highly urbanized and clogged Caño Martin Peña in the western half of the estuary, a series of lagoons in the center of the estuary, and a tropical forest reserve (Piñones) in the easternmost part. Radiometrically dated cores were used to determine sediment accretion and soil C storage and burial rates. Measurements of tree dendrometers coupled with allometric equations were used to estimate aboveground biomass. Estuary-wide mangrove forest C storage and accumulation rates were estimated using interpolation methods and coastal vegetation cover data. In recent decades (1970–2016), the highly urbanized Martin Peña East (MPE) site with low flushing had the highest C storage and burial rates among sites. The MPE soil carbon burial rate was over twice as great as global estimates. Mangrove forest C burial rates in recent decades were significantly greater than historic decades (1930–1970) at Caño Martin Peña and Piñones. Although MPE and Piñones had similarly low flushing, the landscape settings (clogged canal vs forest reserve) and urbanization (high vs low) were different. Apparently, not only urbanization, but site-specific flushing patterns, landscape setting, and soil fertility affected soil C storage and burial rates. There was no difference in C burial rates between historic and recent decades at the San José and La Torrecilla lagoons. Mangrove forests had soil C burial rates ranging from 88 g m–2 y–1 at the San José lagoon to 469 g m–2 y–1 at the MPE in recent decades. Watershed anthropogenic CO2 emissions (1.56 million Mg C y–1) far exceeded the annual mangrove forest C storage rates (aboveground biomass plus soils: 17,713 Mg C y–1). A combination of maintaining healthy mangrove forests and reducing anthropogenic emissions might be necessary to mitigate greenhouse gas emissions in urban, tropical areas.
Introduction
Mangrove forests globally sequester significant volumes of organic carbon (i.e., “blue carbon”) because of the long-term burial associated with their high primary production and anoxic sediments, which slow or prevent carbon (C) remineralization (Donato et al., 2011; McLeod et al., 2011; Kauffman et al., 2020). Additionally, mangrove forests are thought to store substantially more C per unit area than the world’s other major forest types (Donato et al., 2011; Alongi, 2014). In addition to providing C sequestration, tropical mangrove wetlands act as a physical barrier protecting coastal areas and communities from floods and storm surges; act as a nutrient and wastewater filter; provide habitat to fish, shellfish, and wildlife; and provide esthetic appeal and shade for people and infrastructure (Ewel et al., 1998; Gómez-Baggethun et al., 2013; Marois and Mitsch, 2015). However, the sustainability of mangrove forests is uncertain. Long-term trends in deforestation for development (e.g., aquaculture; timber) and the emerging threat of climate change, which is causing accelerated sea-level rise and increased storm intensities, are all expected to impact mangrove C sequestration (Valiela et al., 2001; Donato et al., 2011; Saintilan et al., 2020). Urbanization is also a globally pervasive stressor to tropical and subtropical mangrove forests, as it is associated with extractive pressures, increasing levels of impervious surfaces, commercial and industrial development, and geomorphic changes (Bosire et al., 2014; Lugo et al., 2014; Ochoa-Gómez et al., 2019). Human alterations of the landscape and the natural geomorphology (e.g., canalization; dredging) can increase the exposure of mangrove forests to wastewater, nutrients, and toxicants (Bosire et al., 2014; Lugo et al., 2014; Branoff, 2020b). In some peri-urban (i.e., adjacent to a city) mangrove systems (e.g., Mombasa and Kenya) extractive pressures (i.e., illegal wood extraction) are still a dominant cause for degradation (Bosire et al., 2014), while in other mangrove wetlands located next to urban areas (e.g., Puerto Rico), legal protections have reduced extractive pressures and allowed for mangrove expansion (Martinuzzi et al., 2009).
Now, in the Anthropocene Epoch, with its associated stressors such as global climate change, it is more important than ever to examine the effects of local urbanization on C sequestration in coastal mangroves (Bosire et al., 2014; Ochoa-Gómez et al., 2019). The global trends in peri-urban mangrove forests show nitrogen (N) enrichment due to human watershed activities and significantly lower C to N ratios in mangrove biomass (Branoff, 2017, 2019). In a global review of 66 dated mangrove cores, Pérez et al. (2018) reported that mangrove ecosystems receiving domestic or aquaculture effluents had sediment accretion and organic carbon accumulation rates twofold and fourfold, respectively, higher than mangrove systems in conserved sedimentary environments. Mangrove systems may play an important role in effectively sequestering nutrient inputs and carbon in urbanized coastal areas.
As the economy of Puerto Rico shifted from agriculture toward industry in the 1940s, people abandoned rural areas and migrated to the coastal lowlands, such as the San Juan Metropolitan Area where commerce, industry, and transportation were rapidly developing (Martinuzzi et al., 2009). Today, the economy is shifting away from light industry, which was mainly pharmaceutical production to commercial services (Feliciano, 2018). Population has decreased in San Juan since the early 2000s. Despite the population decline, the San Juan Bay Estuary (SJBE) watershed currently has the densest human population on the island, ∼1,850 people km–2, primarily located in the urban municipalities (i.e., San Juan, Carolina, and Bayamón) associated with the city of San Juan, Puerto Rico (U.S. Census Bureau, 2017). The mangrove forests in Puerto Rico’s SJBE are located along a well-established, west to east urbanization gradient (Oczkowski et al., 2020a, b; Figure 1). The western canals of the densely populated SJBE are heavily contaminated by sewage with fecal coliform concentrations exceeding 2 × 10⁶ cfu 100 ml–1 (Puerto Rico health standards are 200 cfu 100 ml–1; Army Corps, 2016) and are exposed to large amounts of urban runoff including wastewater and pump station stormwater discharges. In contrast, the easternmost part of the gradient consists primarily of a forest reserve with the least disturbed habitat in the SJBE (Pérez-Villalona et al., 2015; Oczkowski et al., 2020a, b).
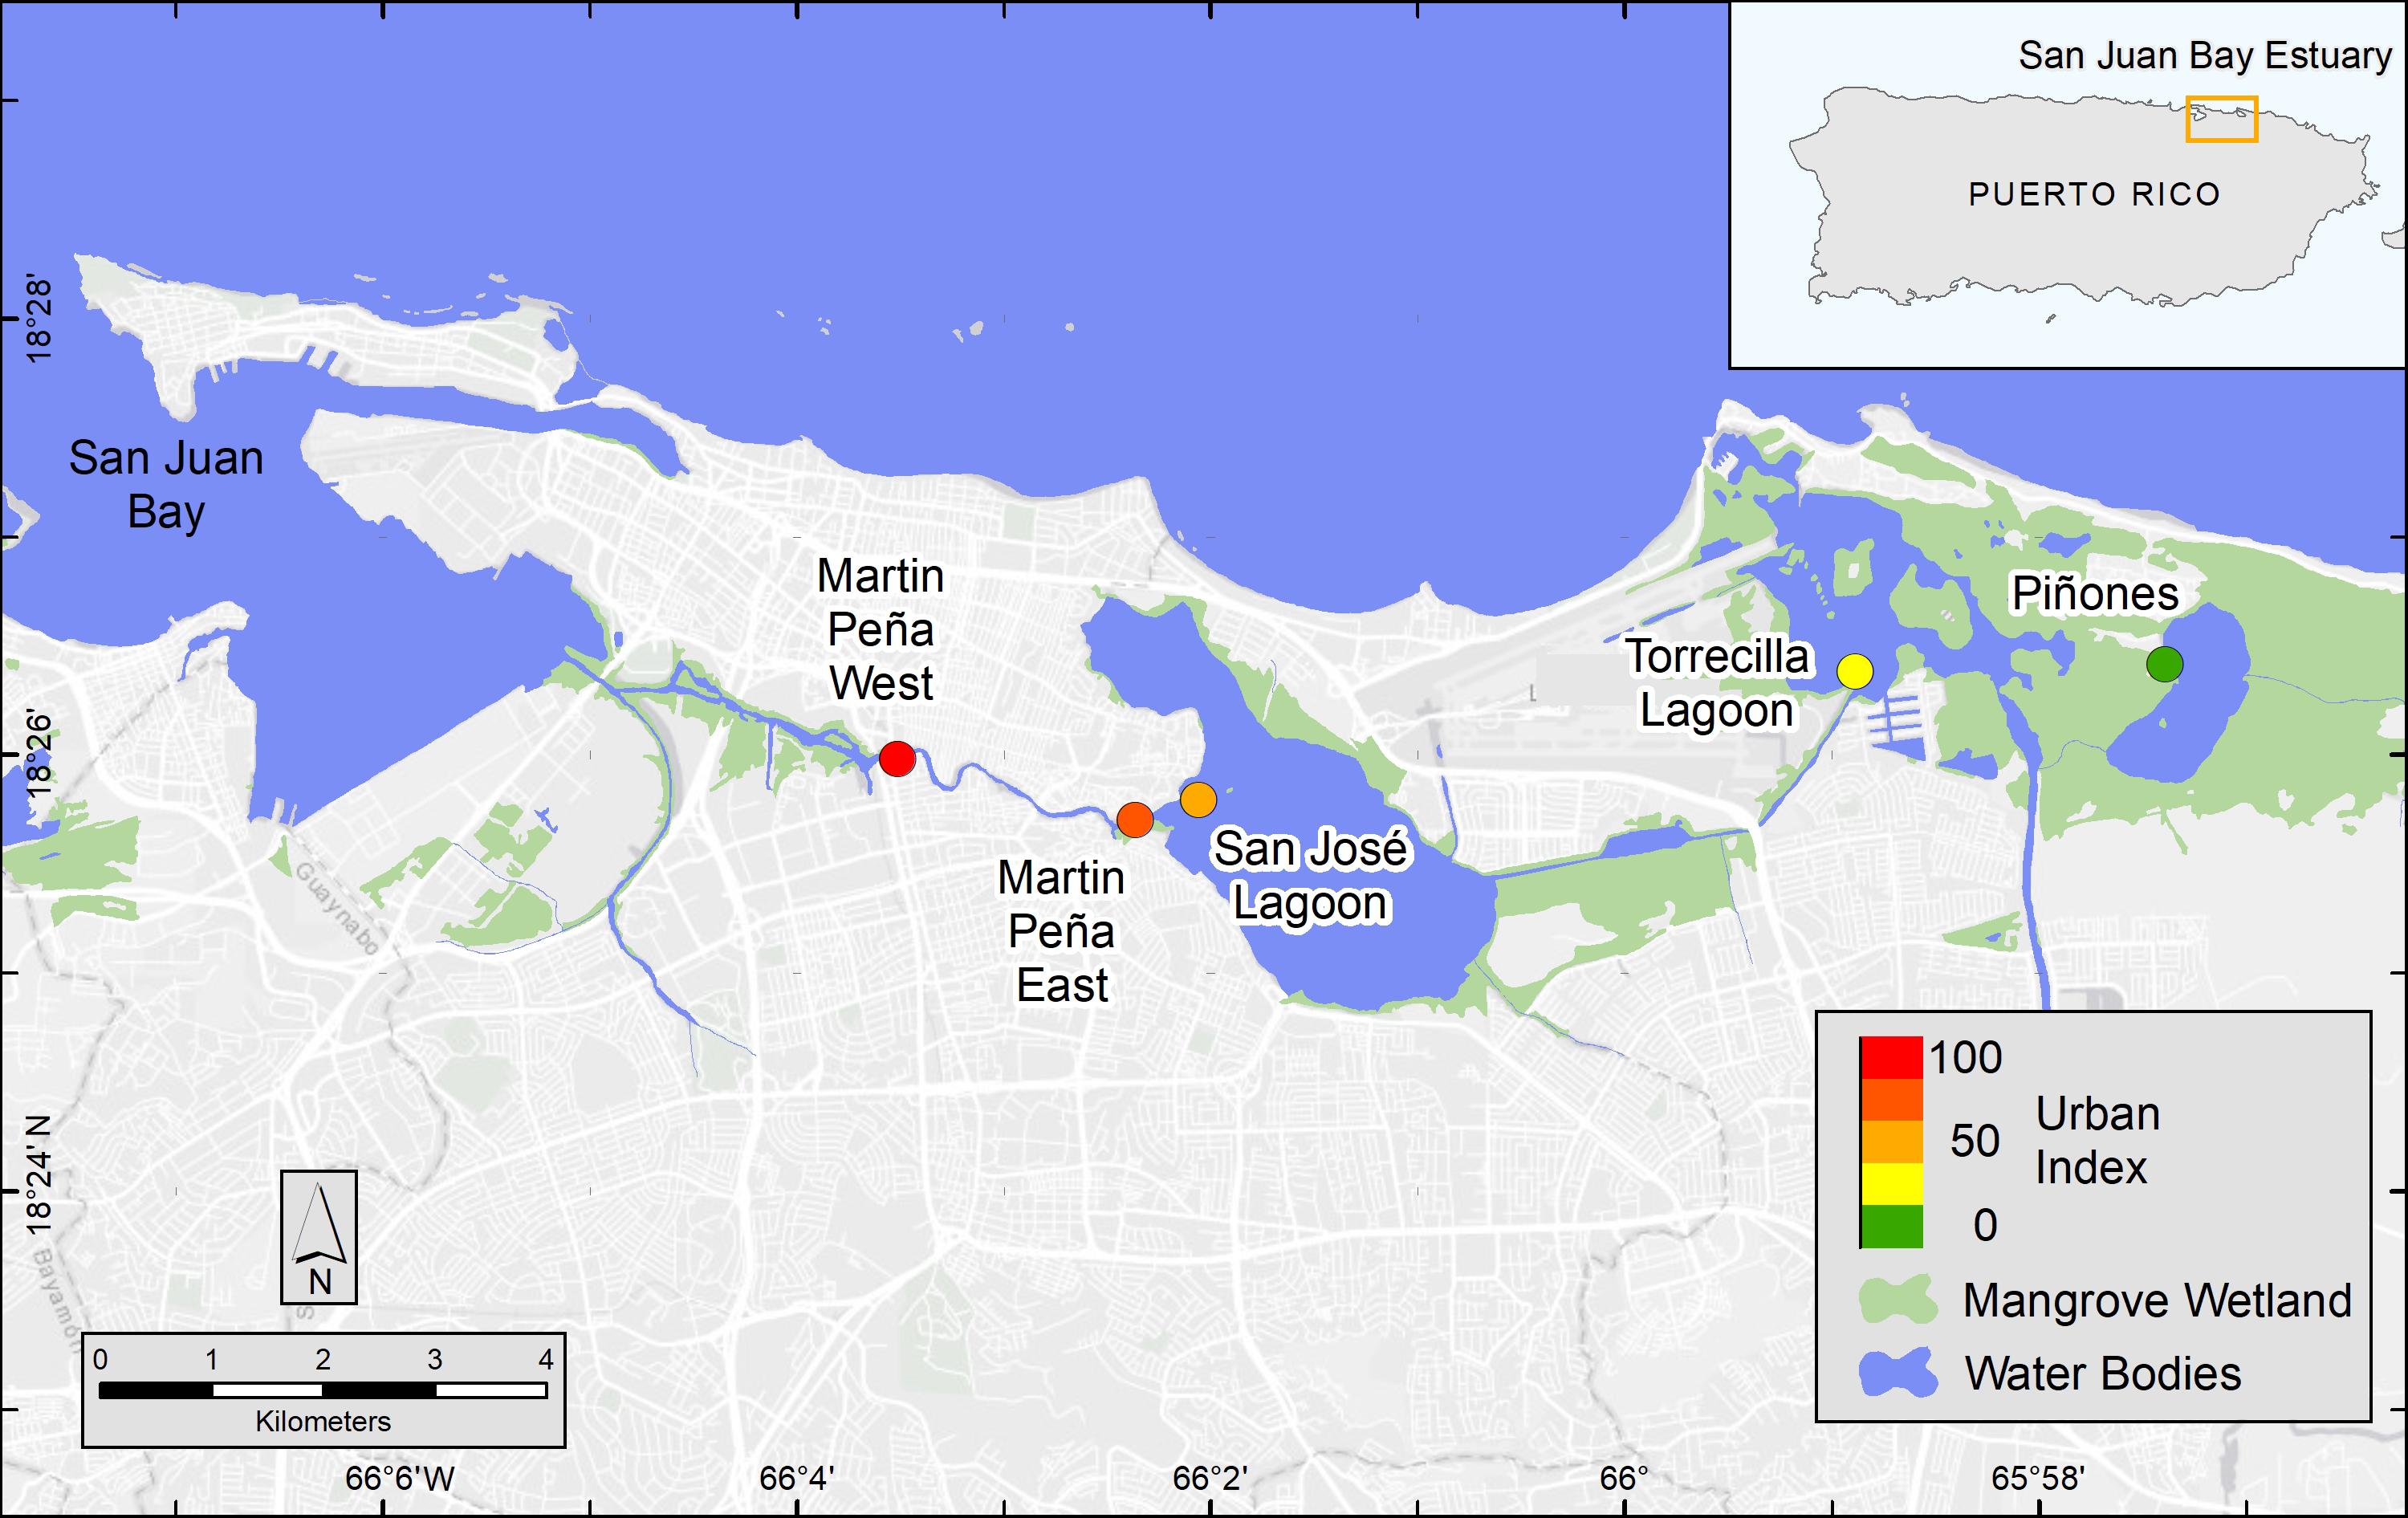
Figure 1. Map of San Juan Bay Estuary mangrove study sites and urbanization score (colored circles). The Urban Index was scored on a scale from 1 to 100 and based on surrounding coverage of mangrove wetland, non-mangrove vegetation and open water, urban land, population density, and road density, which were determined in a 500 m buffer from the approximate center of the mangrove site. National Wetland Inventory data were used to map mangrove wetlands, which included estuarine, intertidal, forest and scrub shrub, broad-leaved evergreen habitats (U.S. Fish and Wildlife Service, 2018).
Tidal connectivity, flushing, temperature, salinity, and nutrient inputs are known to influence primary productivity and C sequestration in mangroves (Krauss et al., 2006; Lugo and Medina, 2014; Lugo et al., 2014). These parameters in the urbanized SJBE have been heavily altered by bridge building, canalization, dredging, filling, and extensive shoreline development for more than two centuries (Ellis, 1976; Cerco et al., 2003; Branoff, 2020a). At the western end of the SJBE, repeated dredging of a portion of the Caño Martin Peña since the 1920s allowed for improved exchange between San Juan Bay and the western end of the canal, but the clogged eastern end of the canal [Martin Peña East (MPE)] prevents tidal connectivity into the eastern lagoonal systems of the SJBE. The dredging of the Suárez Canal in the 1960s somewhat improved tidal exchange between San José Lagoon (SJ) and La Torrecilla Lagoon (Torr), and the dredging of La Torrecilla Inlet to the sea in the late 1960s and early 1970s enhanced the tidal exchange. At the easternmost end of the SJBE, the mature Piñones Forest (Pin) is a relatively isolated inland lagoon displaying a weak hydrologic connection with the rest of the estuary and only limited exchange with the sea (Ellis, 1976; Lugo et al., 2011).
Mangrove forests in the SJBE were composed of Red (Rhizophora mangle L), White [Laguncularia racemosa (L.) C.F. Gaertn], Black [Avicennia germinans (L.) L.], and Button [Conocarpus erectus (L.)] mangrove species, and numbered over five million trees (with diameter at breast height ≥2.54 cm) in 2011 (Brandeis et al., 2014). Mangrove C storage and accumulation rates were determined from tree density and above and belowground biomass, which was estimated from allometric equations and above/belowground ratios. Carbon accumulation rates of mangroves in the SJBE in 2011 were estimated to be ∼11,262 Mg y–1 (Brandeis et al., 2014). In the present study we update and expand on the 2011 estimates of C storage rates in the urban SJBE mangroves, previously based only on biomass estimates, by examining the mangrove aboveground production as well as the C burial in the soils at five mangrove forest sites spanning the SJBE from west to east.
The study aims to elucidate the historic (1930–1970) and recent (1970–2016) decadal mangrove forest C storage and burial rates along an urbanization gradient in the SJBE. Using radiometrically (210Pb, 137Cs) dated cores from the mangrove study sites we account for recent and historic decadal soil accretion rates. We estimate the mangrove forest C sequestration (aboveground plus soils) at the scale of the local mangrove forest and the entire estuary. For comparative purposes we examine the magnitude of the estuary-wide mangrove forest C sequestration relative to watershed CO2 emission rates due to human activities (vehicular, residential, industrial, and commercial use). Using percent C, soil bulk density, and accretion rates we describe C storage and burial rates. We examine C stable isotope and C/N ratios in the soils to identify dominant sources of C. We hypothesize that accretion and carbon burial rates (CBRs) are greater in more urban watersheds and in more recent decades (1970–2016) compared with earlier decades (1930–1970), attributable to increases in human activities (e.g., wastewater inputs; filling in with debris) and alterations associated with rapid urbanization (e.g., dredging activities; damming of rivers). We discuss how site-specific differences in landscape setting, soil fertility, and flushing patterns may affect C storage and accumulation rates in the mangrove forests.
Materials and Methods
Site Description
The coastal extent of the tropical, urban SJBE is over 21,658 ha and includes highly developed and dredged areas, clogged canals, lagoons, and a relatively undeveloped mangrove forest reserve (Cerco et al., 2003; Brandeis et al., 2014; Oczkowski et al., 2020b). The locations of the mangrove stands we sampled included the Caño Martin Peña in the western half of the estuary, a series of lagoons in the center of the estuary, and the easternmost part of the estuary, that is the largest remaining contiguous mangrove forest in Puerto Rico (Figure 1; see Oczkowski et al., 2020a for a more detailed description of the study sites). We classify the relative flushing, landscape setting, and degree of urbanization among the different sites based on previous reports which included water level observations sampled throughout 2016–2018, assessments of the landscape geomorphology, and detailed analyses of hydrology and watershed land use (Branoff, 2020b; Martin et al., 2020). The Urban Index was previously reported for the SJBE mangrove sites and was derived from five spatial variables: (1) surrounding coverage of mangrove vegetation, (2) non-mangrove vegetation and open water, (3) urban land, (4) population density, and (5) road density, which were calculated within a 500 m buffer from the approximate center of the mangrove site (Martin et al., 2020; Table 1). The index was a relative metric of the level of urbanization with a score of 100 being the most disturbed and 1 being the least disturbed (Branoff, 2019, 2020b). The Caño Martin Peña, located in the western half of the estuary, was associated with high population density, impervious surfaces, commercial and industrial development, and had a high Urban Index (88–100), while the expansive Pin in the easternmost part was scored 1 (Martin et al., 2020; Table 1).

Table 1. Categorical factors (landscape setting, flushing, and Urban Index) and the location (latitude/longitude) of the sampling sites.
Core Collections and Analyses
Mangrove sediment cores, two from each site, ∼1 m apart, were collected in March 2016 in the Martin Peña West (MPW), MPE, SJ, Torr, and Pin with a Russian peat sampler to a maximum depth of 50 cm depending upon ability to penetrate coarse mangrove rhizomes. Core depths ranged from 37–50 cm. One core collected from MPW was damaged during air transport to the United States mainland and was not radiometrically dated. The other nine cores were sliced in one cm increments at the surface (0–3 cm) and then every 2 cm to the bottom of the core (unless otherwise indicated). Soil subsamples were used for radiometric dating, stable isotope, percent C, N, dry bulk density (DBD), and sediment accretion analyses as described below. However, only one of the two replicates from the SJ was processed for DBD due to human error, so DBD values from one SJ core were used in calculations of C storage and burial rates for both replicates from that site.
Processing for Bulk Density, C Stable Isotopes, and Percent C, N
Soil subsamples were dried at 60°C for at least 48 h. The soils were not sieved so the belowground samples included live and decomposing roots. One portion of the dried soils was used to determine DBD (g cm–3) and the other portion was ground to a fine powder using a mortar and pestle. The dried, ground material was used for determining C stable isotopes and percent C. Samples were fumigated prior to analyses with 12 M HCl following the method of Harris et al. (2001) to remove carbonates. The C isotope compositions were determined using an Elementar Vario Micro elemental analyzer connected to a continuous flow Isoprime 100 isotope ratio mass spectrometer (IRMS) (Elementar Americas, Mt. Laurel, NJ, United States). Replicate analyses of isotopic standard reference materials USGS 40 (δ13C = −26.39‰) and USGS 41 (δ13C = 37.63‰) were used to normalize isotopic values of working standards to Vienna Pee Dee Belemnite (δ13C) scales (Paul et al., 2007).
Stable isotope values are expressed in δ notation following the formula δX (‰) = [(Rsample/Rstandard) − 1] × 103, where X is the less common isotope and R is ratio of the less common to more common isotope (13C/12C). Working standards were analyzed every 24 samples to monitor instrument performance and check data normalization. The precision of the laboratory standards was better than ±0.3‰ for δ13C. The % C and % N were calculated by comparing the peak area of the unknown sample to a standard curve of peak area vs the C or N content of a known standard.
Potential organic matter sources were examined by plotting sediment molar C/N ratio vs sediment C stable isotopes in core sediments relative to potential organic matter sources. The source δ13C and C/N ratios associated with seagrass, marine algae, particulate organic matter (POM), and mangrove plant matter was based on literature values (Khan et al., 2019; Branoff, 2019; Oczkowski et al., unpublished data). Ranges of C/N ratios and δ13C for mangrove-derived source material was separated into roots and leaves (green only), and further characterized by dominant species, Red (R. mangle L.), White [L, racemosa (L.) C.F. Gaertn.], and Black [A. germinans (L.) L.] species (based on Khan et al., 2019; Branoff, 2019).
Radiometric Dating
Gamma analysis was performed on 10–20 samples that spanned each sediment core. One to ten grams of homogenized sediment were sealed for 3 weeks and counted on a planar-type gamma counter for 24–48 h to measure 137Cs, 210Pb, and 226Ra at 661.6, 46.5, and 352 KeV energies respectively (Canberra Inc., United States). Activities of 137Cs and 210Pb were decay corrected to time of collection; suppression of low energy peaks by self-adsorption was corrected according to Cutshall et al. (1983). Age models were developed using Plum (Aquino-López et al., 2018; Blaauw et al., 2020) version 0.1.4 in R version 4.0.0 (R Core Team, 2020). Plum is an age-depth model that utilizes 210Pb and is based on the same Bayesian chronology statistical treatment as Bacon, a widely used model with 14C ages (Blaauw and Christen, 2011). Plum uses distributions of prior environmental parameters that impact the 210Pb profile, including 210Pb deposition rates, supported 210Pb (i.e., 226Ra) and accretion rates, with posterior distributions providing realistic uncertainty estimates. A major benefit of Plum over the commonly used analytical solution to the continuous rate of supply model (Appleby and Oldfield, 1978) is that chronologies can be calculated even if radioisotopes have not been analyzed for the entire core. Furthermore, this model yields more than one accretion rate estimate, unlike the constant initial concentration model (Goldberg, 1963) which is normally used for cores with discontinuous 210PB profiles. Total 210Pb data were input into Plum, with supported 210Pb (i.e., 226Ra) estimated within the model framework from the deepest samples. We broadened the priors from default settings within Plum. We simulated means (50%) and the lower (2.5%) and upper confidence limits (97.5%) for each 1 cm depth in the sediment cores. We report means and 95% confidence intervals in the age-depth profiles for each core. Sediment accretion rates (SAR) were obtained from each chronology using the “accrate depth” function in Plum at 1 cm depth intervals. Age-depth models such as these constrain accretion relative to the sediment surface at the time of collection; thus, interpretations of absolute elevation gain within a fixed framework, such as sea level, is not possible without further measurements, such as from sediment elevation tables (Cahoon et al., 2002). However, these age-depth models are useful for constraining potential maximal elevation changes.
Calculations of Estuary-Wide C Storage and Accumulation Rates in Mangrove Forest
To estimate estuary-wide mangrove forest C storage and accumulation rates, we interpolated aboveground biomass and belowground soil measurements onto a grid of 2 × 2 m mangrove areas represented by the “estuarine forested wetlands” class in the NOAA C-CAP dataset (Office for Coastal Management, 2017). This estimate combined both short-term (years to decades) C sequestered in aboveground biomass with long-term (decades to century) C sequestered in the soils of mangrove forest. Belowground soil measurements were estimated from the nine cores collected in the present study and aboveground biomass measurements were from Branoff and Martinuzzi (2020) for C storage and Branoff (2020a) for C accumulation, assuming 44% C content in aboveground biomass (Rodrigues et al., 2015). Aboveground biomass measurements were taken prior to the hurricane season in 2017 (Branoff, 2020a). Interpolation was computed as an inverse distance weighting (Shepard, 1968) through the idw function of the phylin package in R (Tarroso et al., 2015), in which values from all known locations were incorporated into the interpolation but the geographically closest known measurements were given higher weight. To incorporate the known variability in the field measurements, interpolation was bootstrapped for 100 iterations, with known values randomly drawn from right skewed normal distributions of the same mean, standard deviation, and 95% confidence intervals as the measured values. Distributions were simulated through the rsnorm function of the fGarch package in R (Wuertz et al., 2020). Watershed-wide estimates were then calculated by summing the mean values for each mangrove area and each C component (aboveground, recent soils, and historic soils) from the bootstrapped iterations, with mean and standard errors of these iterations reported.
Calculation of Emissions by People in the SJBE Watersheds
To estimate the local CO2 emissions by people and their activities, we characterized the land cover and estimated the human population, households, and vehicles owned in the SJBE watershed in ArcGIS using landscape datasets (Hamilton and Casey, 2016; Office for Coastal Management, 2017) and U.S. Census Bureau (2017). These land class areas and demographic data were used to estimate annual CO2 emissions from industrial ecology methods (Ngo and Pataki, 2008; Kennedy et al., 2010). Specifically, we calculated per-household CO2 emissions by multiplying the number of occupied households in the watershed by residential, commercial, and industrial electricity consumption factors derived from energy consumption data reported in the published literature (Supplementary Table 1a). For personal automobile emissions, we multiplied the number of vehicles in the watershed by the average annual vehicle-miles traveled by residents on the island and the average fuel efficiency (Supplementary Table 1a). We tallied electricity and gasoline consumption for the watershed and converted to CO2 emissions by multiplying by EPA emissions factors (U.S. Environmental Protection Agency, 2014). We report the magnitude of the watershed anthropogenic CO2 emissions relative to the magnitude of the mangrove forest C sequestration rates (aboveground plus soils) for comparative purposes and to inform management efforts assessing anthropogenic impacts and mangrove forest blue carbon value (McLeod et al., 2011). We did not measure actual mangrove atmospheric/canopy fluxes.
Site and Time Period Statistical Comparisons
Mean SAR, DBD, % C, and δ13C were calculated within two identified time periods: recent decades, approximately the 1970s to present-day (i.e., 2016, date of collection) and historic decades (1930s to 1970s). The historic decades represent a period of mangrove recovery following over a century of intense agricultural activity (e.g., conversion of lands to sugar cane fields and pastures) in the 1800s (Martinuzzi et al., 2009). The recent decades represent a period characterized by rapid urbanization with watershed land development and increases in population, but also by legal protection of all mangroves on the island in 1972 (Martinuzzi et al., 2009).
Defined time periods were determined from the simulated means in the age-depth models generated by radiometric dating and Plum models. We used a bootstrap approach to generate means and 95% confidence bounds for each parameter within sites, cores, and specific time periods. The bootstrap analysis generated 1,000 sets of randomly selected data from the reported values for the specific time period in a given core (Efron and Tibshirani, 1993). The mean of those 1,000 values was used as the overall mean estimate for the parameter, and the 2.5th and 97.5th percentiles of those 1,000 values were the upper and lower confidence bounds.
Using the SAR, DBD, and % C parameters we calculated mangrove accretion rates (MARs), CBRs, C density, and C storage for each time period (see Supplementary Table 2 for formulas). To better encompass the propagation of variability resulting from each individual measurement included in the calculation of these parameters, the bootstrap generated 1,000 sets of randomly selected pairings of the variables going into the calculation. For example, the C density calculation was based on randomly selecting a DBD and a % C value from combined cores from a specific site in a specific time period, but not necessarily with each value coming from the same depth. The means and 2.5th and 97.5th percentiles of the 1,000 sets of calculated values would be the overall mean and confidence bounds, as with the other parameters.
For examination of spatial comparisons among mangrove sites the 1,000 bootstrap estimates from both core replicates from a specific site were combined to calculate site specific means and bounds. The mean of those 2,000 values was used as the overall mean estimate for the parameter, and the 2.5th and 97.5th percentiles of those 2,000 values were the upper and lower confidence bounds. The site-specific bounds generated by combining the bootstrap estimates tended to be wider than the individual core-specific bounds when the variability among the two cores was large. However, comparisons made based on these site bounds will enable more meaningful evaluations of spatial differences.
For temporal comparisons, because core variability can mask changes over time within individual core locations, we examined whether significant differences existed between recent vs historic time period means using the bounds generated based on each of the 1,000 core-specific bootstrap estimates. For example, the historic period mean and bounds generated from the 1,000 bootstrap runs for core PIN1 would be compared to the recent period mean and bounds generated from PIN1, while a separate comparison would be done using the PIN2 data and bootstrap bounds.
For both the spatial and temporal comparisons, significant differences were evaluated based on whether bootstrap bounds (2.5th and 97.5th percentiles) overlapped. For C storage comparisons between recent (1970–2016) and historic time periods (1930–1970), values were normalized to account for the difference in range between time periods (46 vs 40 years); however, the statistical differences in C storage results between time periods did not change whether the data were normalized or not.
Results
Soil C Burial and Storage Rates
We report age means and 95% confidence intervals in the age-depth profiles for each core and use these estimates to calculate SAR (Figure 2). The raw radiometric and associated C, N data from this study are available in a USGS data release (Eagle et al., 2021). The site mean SAR ranged from 1.96 mm y–1 at SJ to 3.76 mm y–1 at Pin in historic decades, and there was no significant difference among sites. Piñones (5.52 mm y–1), MPE (4.91 mm y–1), and Martin PeñaWest (5.47 mm y–1) had similar SAR site means in recent decades, and these were significantly greater than the SARs at La Torrecilla (2.68 mm y–1) and San José (2.02 mm y–1) lagoons (Table 2 and Supplementary Table 3). SARs in the Caño Martin Peña and Piñones cores were significantly greater in recent than historic times. In the lagoonal cores, SJ1 and Torr1, the recent SARs were less than the historic SARs (Supplementary Table 4).
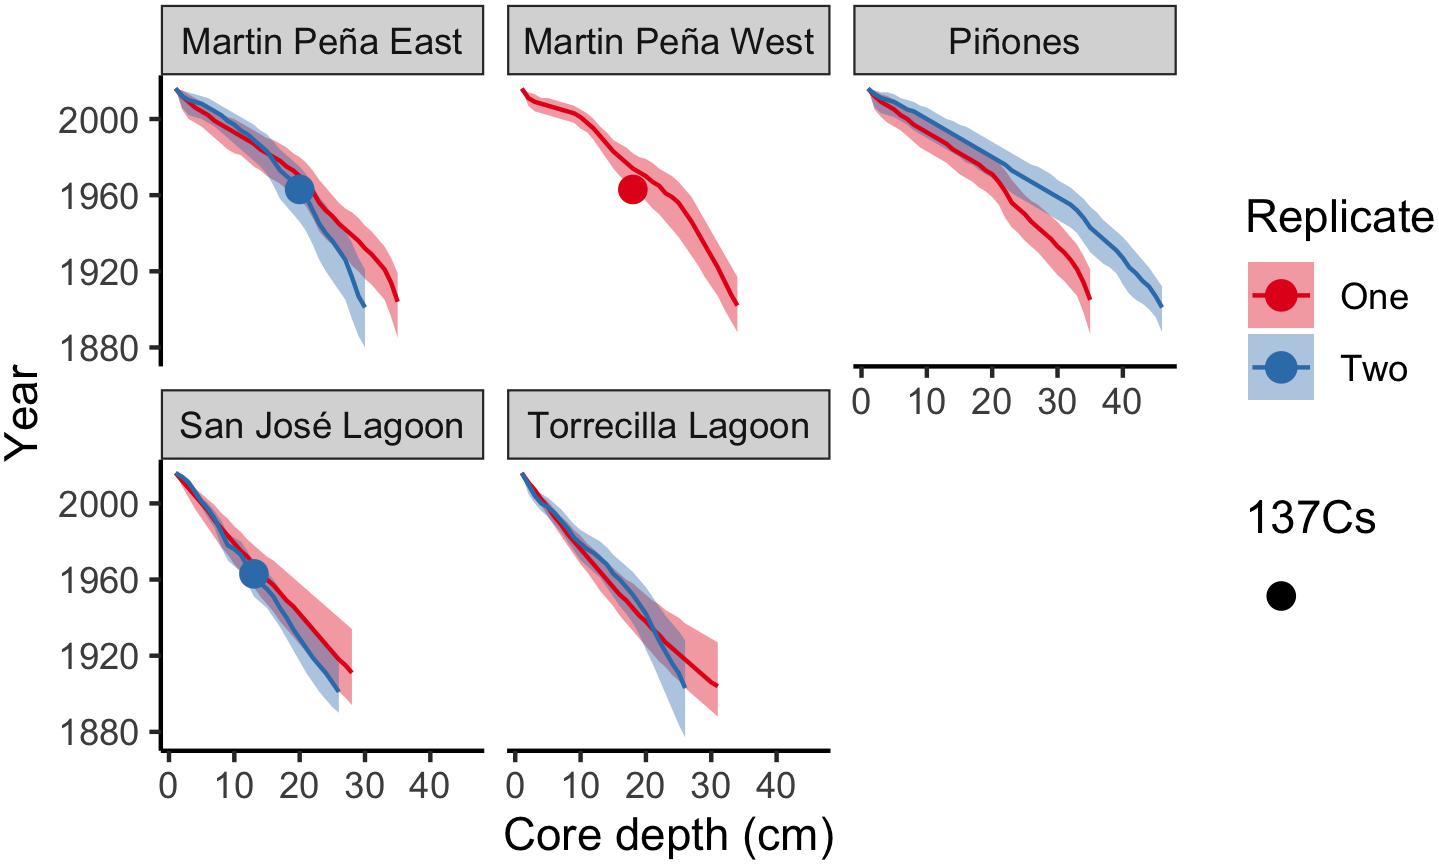
Figure 2. Core age-depth profiles using the Plum model (Aquino-López et al., 2018) estimated sediment year with depth in each core. Means (solid line) and 95% confidence intervals are depicted for each core. Cores with detectable 137Cs peaks are indicated with circles.
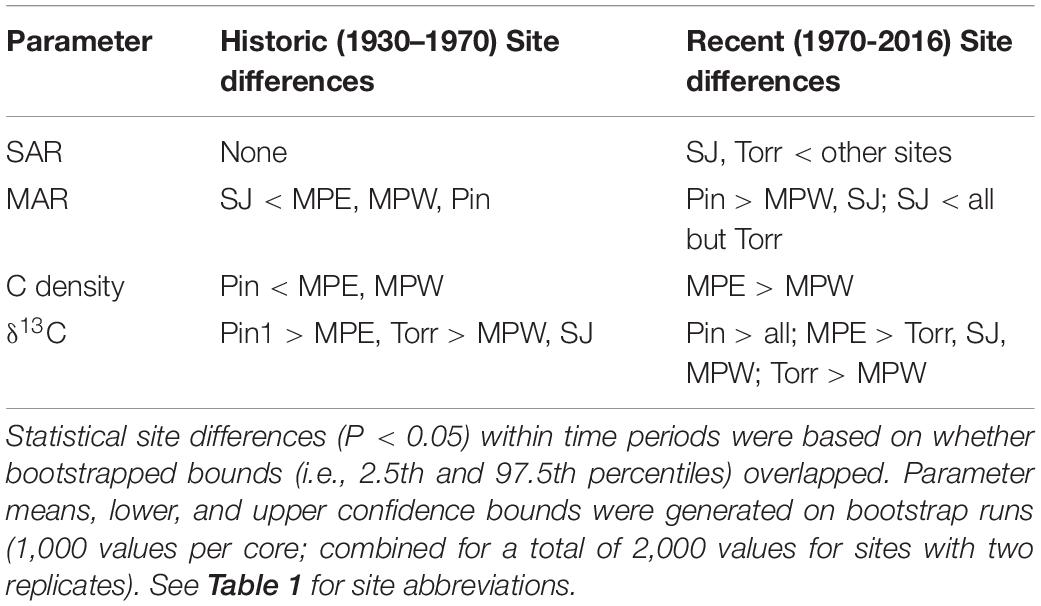
Table 2. Site comparisons of sediment accretion rate (SAR), mangrove accretion rate (MAR), carbon (C) density, and C stable isotope ratio (δ13C) within either the historic or recent time period.
Soil C burial rates were not significantly different among sites in historic decades (Figure 3A). In recent decades, the highly developed MPE with low flushing had the highest soil C burial rates (mean: 469 g m–2 y–1; 95% bounds: 205–803 g m–2 y–1). These rates were significantly greater than C burial rates at San José, but not statistically different than La Torrecilla, Piñones, or MPW (Figure 3A). Although the SJ cores had significantly higher % C than all the other sites in historic and recent decades (Supplementary Table 5), the sediments were characterized by low DBDs and low SARs that resulted in generally low CBRs (Figure 3A and Supplementary Tables 4, 5). Soil C burial rates in recent decades were significantly greater than historic decades for each core within MPE and Piñones. Although Piñones and MPE had similarly low flushing, the landscape settings (forest reserve vs clogged canal) and urbanization (lowest vs high) were not similar (Table 1), suggesting the importance of flushing in affecting C burial. For all other sites, there was no statistical difference in CBR between historic and recent decades.
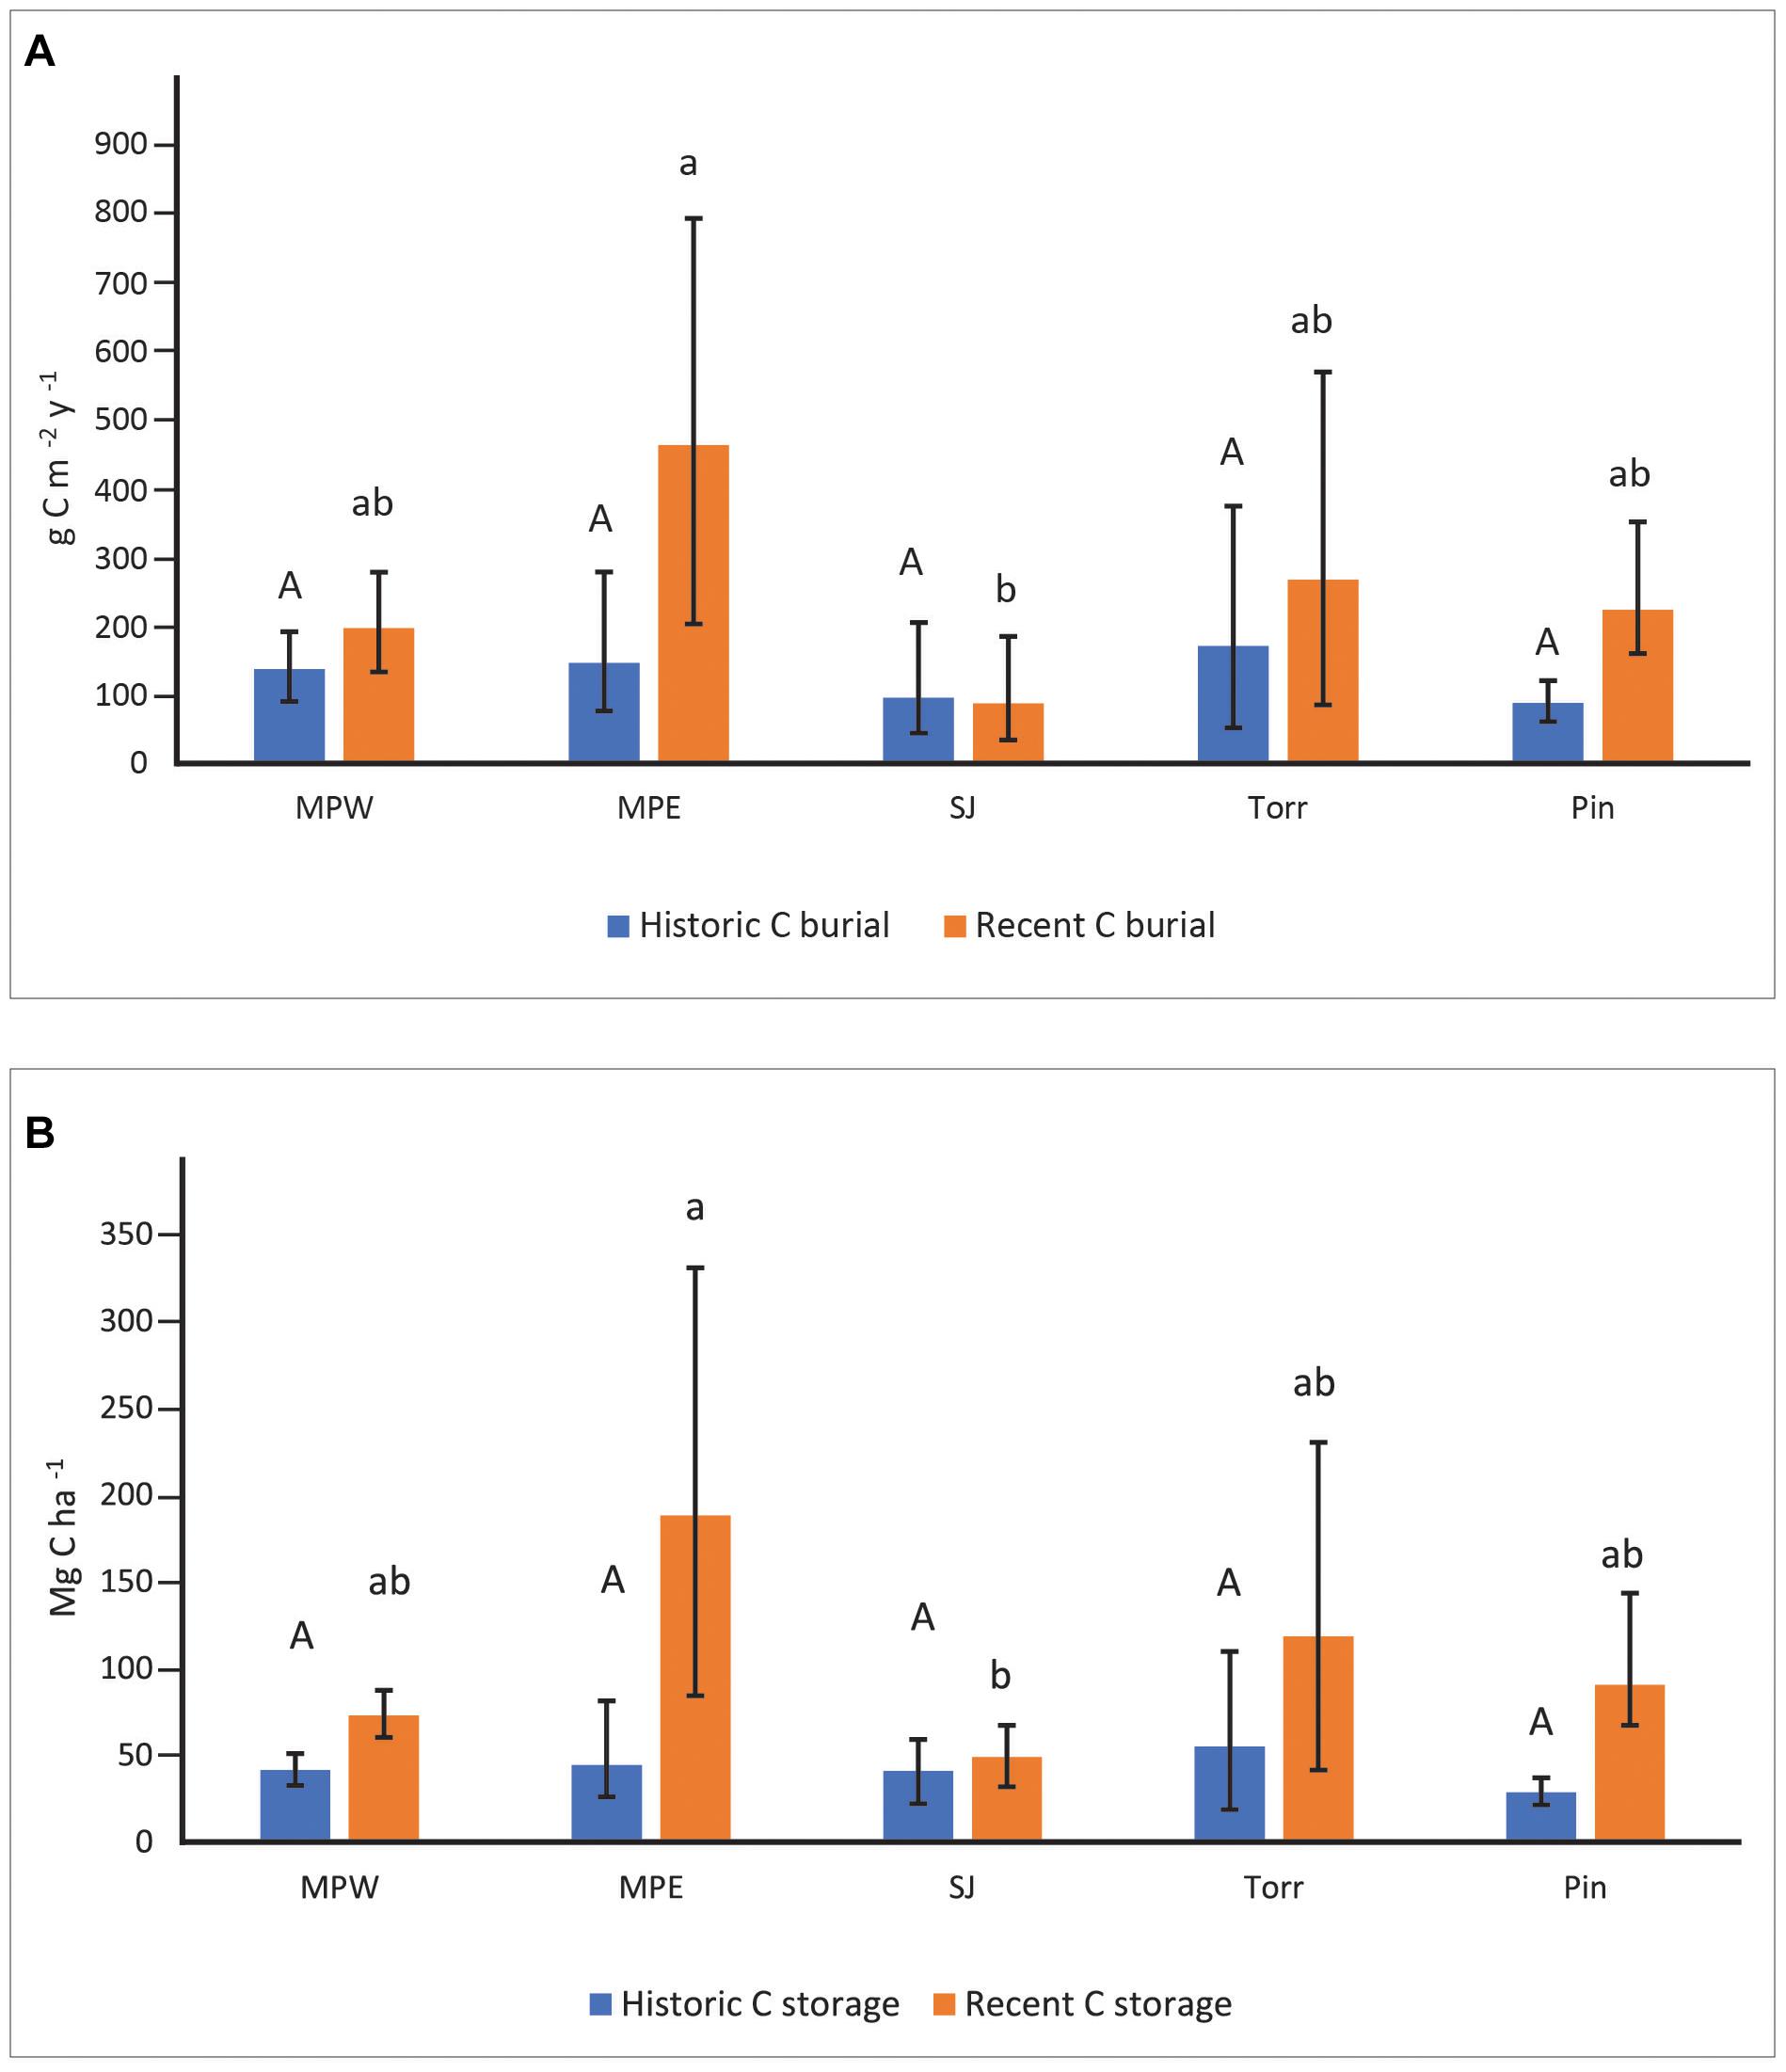
Figure 3. Soil carbon burial rates (A) and soil carbon storage (B) at the mangrove sites in recent (1970–2016) and historic (1930–1970) decades. Upper-case letters were used to describe site comparisons within historic decades and lower-case letters to describe site comparisons within recent decades. Mangrove sites that do not share letters within a specific time period had significantly different (P < 0.05) values. Statistical site differences within time periods were based on whether bootstrapped bounds (i.e., 2.5th and 97.5th percentiles) overlapped. Parameter means, lower, and upper confidence bounds were generated on bootstrap runs (1,000 bootstrap values per core; combined for a total of 2,000 values for sites with two replicates). Sites listed from high to low urbanization index (see Table 1 for site abbreviations).
Soil C storage ranged from 28.71–55.19 Mg ha–1 among mangrove forest sites in historic decades, and there was no significant difference among forests (Figure 3B). In recent decades, MPE had the highest soil C storage (187.90 Mg ha–1), but it was not significantly different than soil C storage in La Torrecilla (118.56 Mg ha–1), Piñones (90.50 Mg ha–1), or MPW (72.97 Mg ha–1) (Figure 3B). Soil C storage at MPE was significantly greater than C storage at SJ (48.85 Mg ha–1). Greater soil C storage in recent decades as compared to historic decades was evident in all SJBE mangrove cores except three lagoonal cores: SJ1, SJ2, and Torr1. Having similar DBD and % C in both historic and recent time periods (Supplementary Table 5), resulted in no significant difference in C storage between time periods in these three lagoonal cores. Cores collected from Torr had the highest variability in DBD, with the DBD of Torr2 about 4–8 times greater than Torr1 (Supplementary Table 5).
The MAR is dependent upon the DBD and SAR of the soil, and in historic and recent decades the SJ (historic: 309.77 g m–2 y–1; recent: 291.80 g m–2 y–1) had significantly lower MAR than the Caño Martin Peña sites (historic: 1,531.33 g m–2 y–1; recent: 2,855.81 g m–2 y–1) and Pin (historic: 1,926.93 g m–2 y–1; recent: 3,770.30 g m–2 y–1) (Table 2 and Supplementary Table 3). There were no differences in MAR between historic and recent decades in most SJBE cores, except for cores MPE2 and Pin 1, in which recent MAR was significantly greater than historic MAR. Similar to MAR, there were no differences in C density between historic and recent decades in most SJBE cores, except for cores MPE1, Pin 1, and Pin2, in which recent C density was significantly greater than historic C density (Supplementary Table 4). In historic decades the Caño Martin Peña sites (0.053 g cm–3) had significantly higher C density than Piñones (0.024 g cm–3), while in recent decades the MPE (0.096 g cm–3) had significantly greater C density than MPW (0.036 g cm–3). All other sites had similar C densities as the Caño Martin Peña in recent decades (Table 2 and Supplementary Table 3).
Carbon Sources
Use of stable C isotopes and C/N ratios suggest that most of the SJBE mangrove soils contained mangrove root and leaf sources of organic matter (Figure 4). The leaves of different mangrove species and root matter had overlapping C/N and δ13C ranges making it difficult to separate out specific mangrove species as sources in most cases. The Piñones sediment showed evidence that POM supplemented mangrove plant matter in the soil as the C/N ratios and C isotopes were intermediate between POM and mangrove-derived sources. Among the different mangrove sources, Piñones soil most reflected Black [A. germinans (L.) L.] mangrove (Figure 4). The site mean δ13C at Piñones was significantly more enriched than all other sites in both historic (−25.4‰) and recent (−25.7‰) decades (Table 2 and Supplementary Table 3). In recent decades the site mean δ13C of SJ (−28.4‰), Torr (−28.2‰), and MPW (−28.8‰) were significantly less enriched than MPE (−27.3‰) and Piñones (Table 2 and Supplementary Table 3). We observed that the soil δ13C was significantly more enriched in historic than recent decades in the Caño Martin Peña cores, La Torrecilla cores, and in Pin2 (Supplementary Table 5).
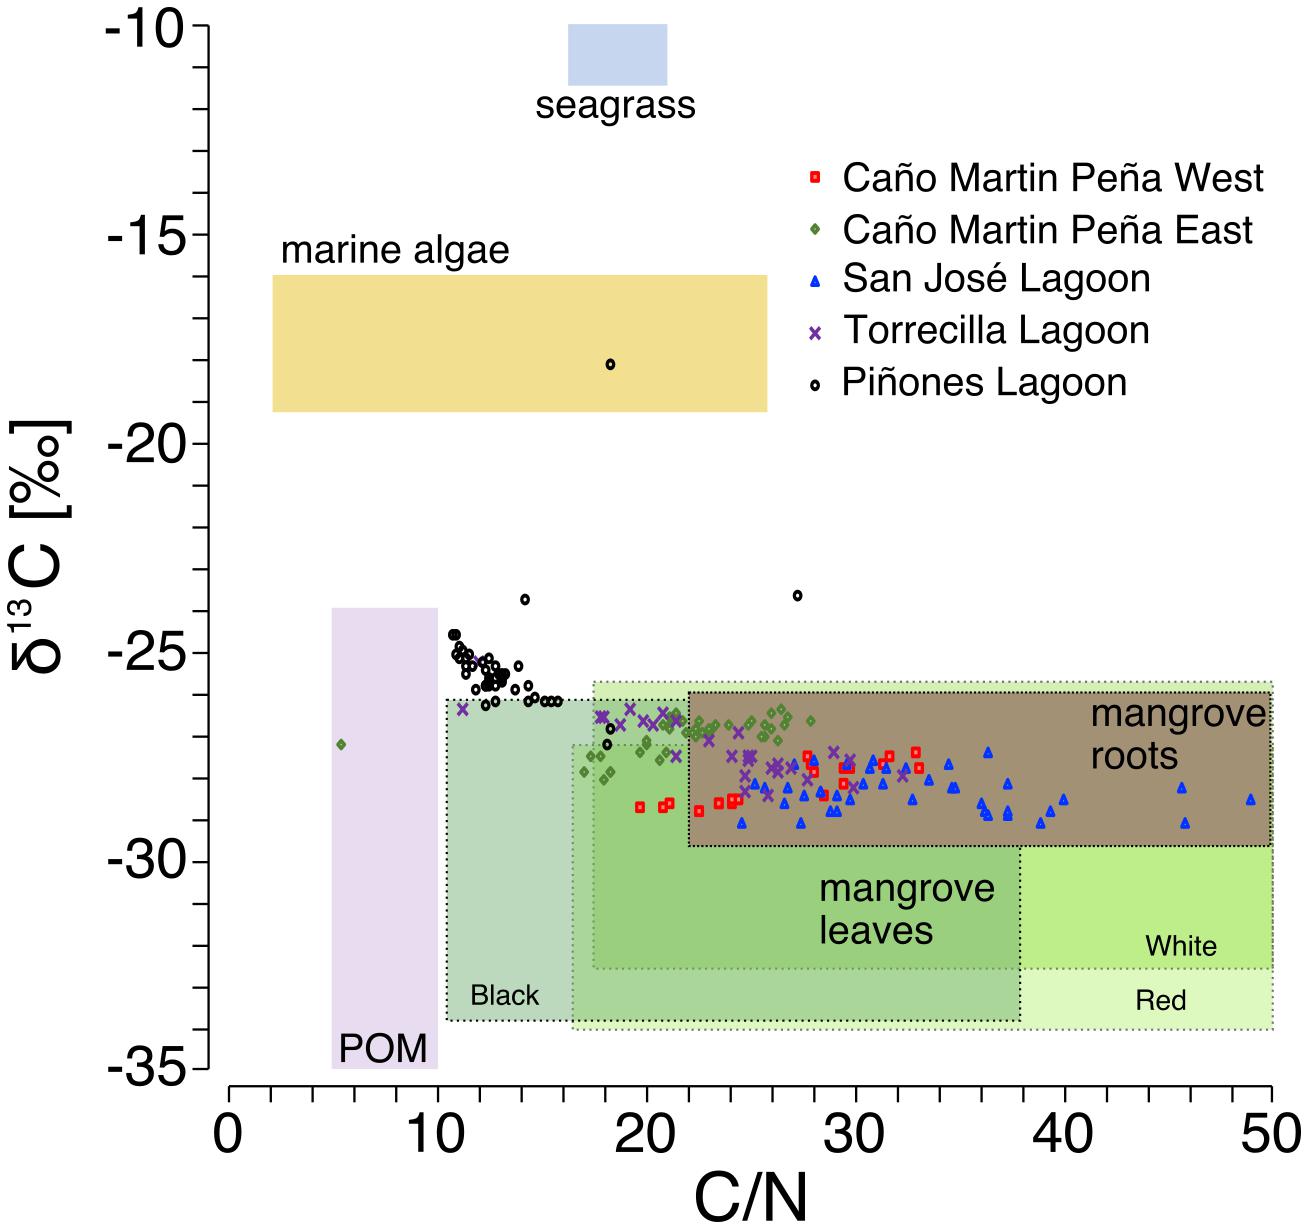
Figure 4. Bi-plot of sediment molar C/N ratio vs sediment C stable isotopes in core sediments relative to potential organic matter sources [source δ13C, C/N ratios, and particulate organic matter (POM) based on Khan et al., 2019; Branoff, 2019; Oczkowski et al., unpublished data). Mangrove-derived material was separated into roots and green leaves. Mangrove leaves are further characterized by ranges of C/N ratios and δ13C in Red (Rhizophora mangle L.), White [Laguncularia racemosa (L.) C.F. Gaertn.], and Black [Avicennia germinans (L.) L.] species.
Estuary-Wide Mangrove Forest C Storage and Accumulation Rates
Aboveground mangrove C storage was estimated at 208,308 Mg and 90.1 Mg ha–1 with a C accumulation rate of 5.2 Mg ha–1 y–1 for the entire SJBE (Figure 5). Belowground C storage was 240,904 Mg and 104 Mg ha–1 in recent decades and 92,013 Mg and 40 Mg ha–1 in historic decades (Figure 5). Soil C accumulation rates were estimated at 2.49 Mg ha–1 y–1 in recent decades and 1.26 Mg ha–1 y–1 in historic decades.
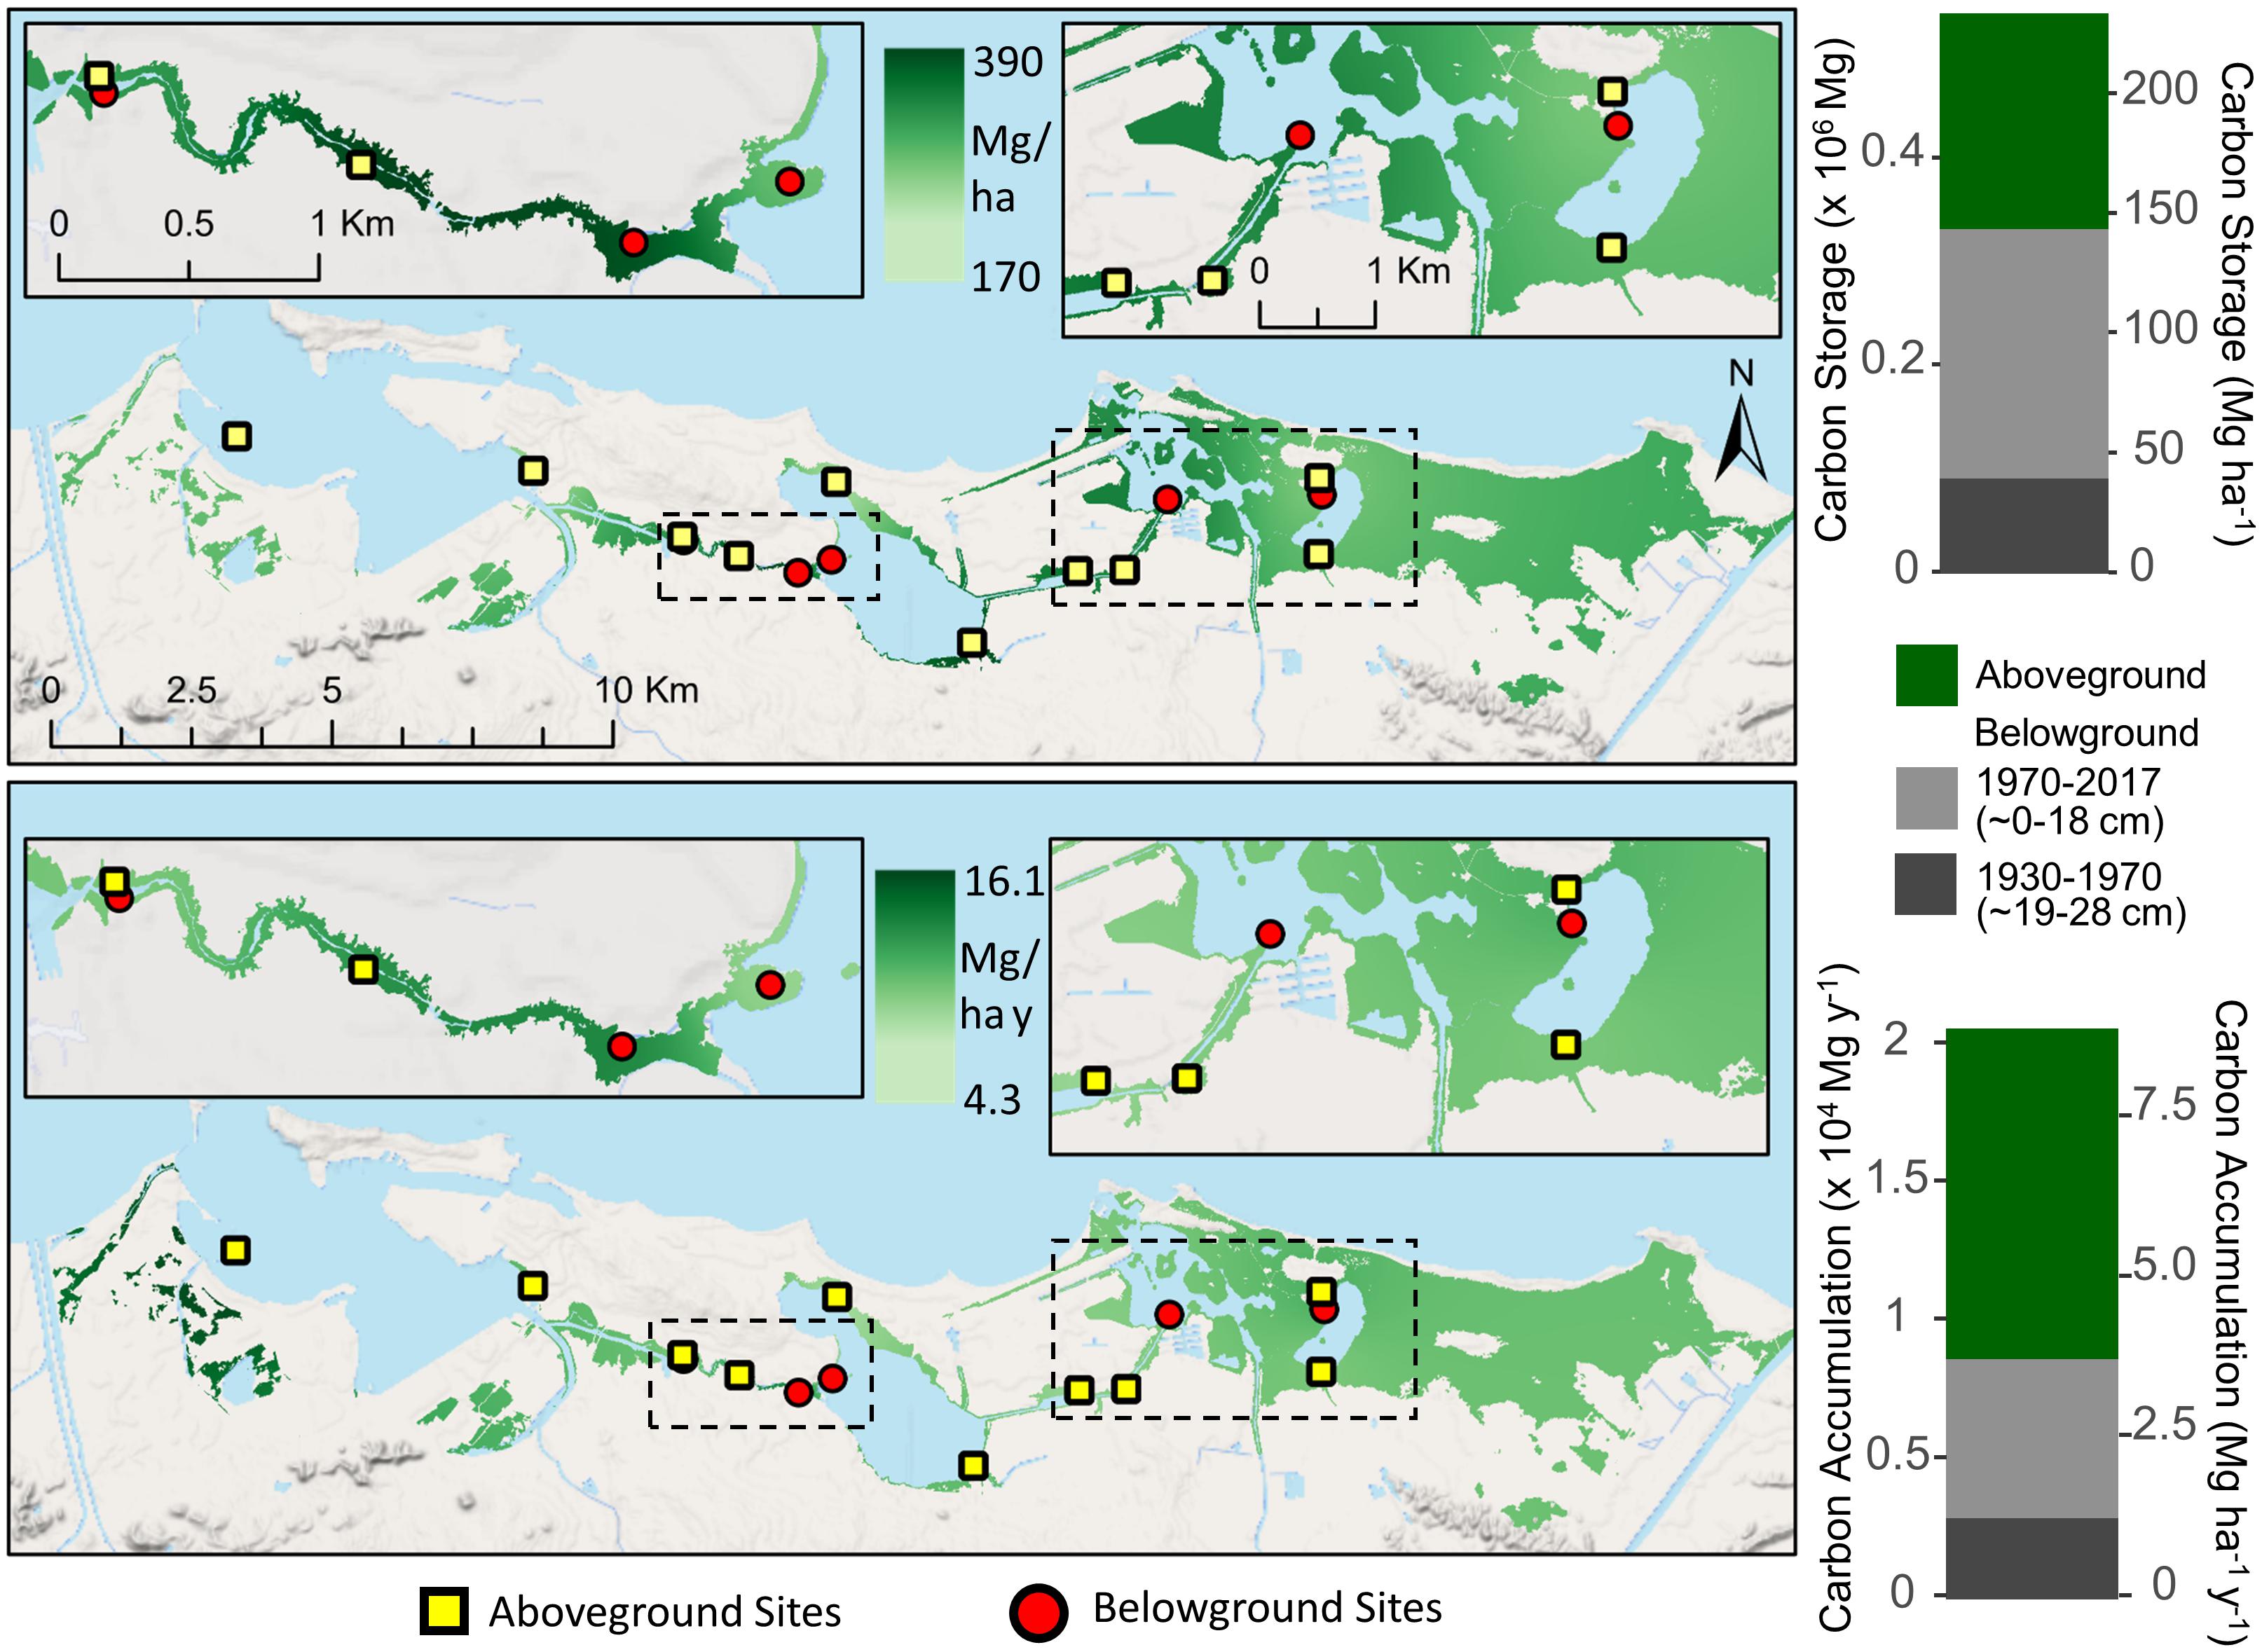
Figure 5. Interpolated mangrove forest carbon storage (top) and accumulation rates (bottom) for both aboveground and belowground soil (<28 cm) components in the San Juan Bay Estuary. Map values represent distance weighted interpolations between known measurements at site locations. Bar graphs represent sums of all mangrove areas across the watershed. Aboveground mangrove sites (Branoff and Martinuzzi, 2020) are denoted by squares and belowground sites (this study) by circles.
Anthropogenic Emission Analysis
Anthropogenic emissions were attributed to a population of 769,000 (∼1,850 people km–2) and occupied households of 296,589 in the SJBE watershed (U.S. Census Bureau, 2017; Supplementary Table 1b). Annual emissions per household were 1.2 Mg C y–1 (equivalent to 4.6 metric tons of CO2) plus attributed commercial and industrial electricity use of 2.2 Mg C y–1 (equivalent to 7.9 metric tons of CO2; Supplementary Table 1c). The per vehicle annual emissions were 1.85 Mg C y–1 (equivalent to 6.79 metric tons of CO2; Supplementary Table 1c). Residential, commercial, and industrial electricity and vehicular use attributed to total households and persons summed to 1.56 million Mg C y–1 (Supplementary Table 1b). We estimated the watershed-wide anthropogenic emission rate at approximately 37.4 Mg C ha–1 y–1 (watershed area: 41,572 ha). The estuary-wide mangrove forest C sequestration rate (aboveground biomass plus belowground soil: 7.7 Mg C ha–1 y–1) was 20.6% or about one fifth of the watershed anthropogenic emission rates.
Discussion
Hydrological alterations (e.g., dredging; canalization; damming), land development, and human activities (e.g., wastewater inputs; filling in) associated with the urbanization of the SJBE in recent decades had direct and indirect effects on soil fertility, hydrology, plant productivity, and sediment deposition. Although there was a distinct urbanization gradient from west to east with the Caño Martin Peña in the west being most urbanized and the Pin the least urbanized, site characteristics such as flushing, landscape setting, and other environmental factors played a role in the C storage and burial rates at the mangrove forest sites. Causes for elevated sediment accretion, C storage, and C accumulation varied among mangrove forest sites in the SJBE.
Accretion Rates
Mean SAR among the different mangrove forest sites in the SJBE ranged from 1.96–3.76 mm y–1 in historic decades and 2.01–5.52 mm y–1 in recent decades. Tide gages at San Juan, PR (NOAA station #9755371) and Magueyes Island, PR (NOAA station #9759110) have long-term sea-level rise trends of 2.09 ± 0.37 mm y–1 (1962–2020) and 1.90 ± 0.30 mm y–1 (1955–2020), indicating mangrove forest accretion rates from the 210Pb age models were at or exceeded long-term sea-level rise rates, although the historic period in this study is not covered fully by the water level records. While the SJBE accretion rates in the historic decades were similar to the global median for mangrove forests (2.8 mm y–1, 95% confidence interval 1.9–3.9 mm y–1; Breithaupt et al., 2012), the accretion rates in recent decades were nearly twice the global median at the most urbanized Caño Martin Peña sites (5.19 mm y–1) and least urbanized Pin (5.52 mm y–1). Recent SAR and % organic matter at Caño Martin Peña were significantly greater in recent decades compared with historic decades. Such an increase in accretion has been observed in other mangrove forests, coincident with accelerations in sea-level rise (Breithaupt et al., 2020), though, local factors such as anthropogenic wastewater inputs, vegetation cover, and flooding frequency can also affect SAR, especially in peri-urban mangrove systems (Pérez et al., 2018). Elevated accretion rates at the Caño Martin Peña in recent decades may be explained by increased anthropogenic inputs such as raw sewage into the clogged canal; similarly elevated sediment accretion and C accumulation were observed for other urbanized mangrove forests receiving wastewater inputs (Sanders et al., 2014; Pérez et al., 2018, 2020).
Carbon Storage and Burial Rates
We observed different C storage and burial rates at the western and eastern ends of the urbanized Caño Martin Peña. In the dredged western portion of the canal (MPW), the C burial rates were 58% lower and the C storage 61% lower than the clogged eastern portion (MPE) in recent decades. The site differences in C burial rates and storage between MPW and MPE may be reflective of increased flushing in the MPW in recent times, which might have lowered particulate deposition and C storage. In the eastern clogged end of the Martin Peña, the build-up of autochthonous (i.e., mangrove litterfall and roots) and allochthonous C inputs (e.g., raw sewage and storm runoff) might have contributed to high SAR and C storage. However, the C stable isotope ratios suggest that refractory mangrove litterfall and roots were the apparent C source in the soils (Figure 4). High emissions of carbon dioxide and methane gases measured at the Caño Martin Peña forest and adjoining waters in an earlier report may have been fueled by the more labile allochthonous (e.g., raw sewage) inputs (Martin et al., 2020), diminishing their contributions to long term C storage. The fate of allochthonous inputs and their contributions to C storage needs further study.
Accretion rates and C storage were also high in the low flushed and least urbanized Pin. The Piñones mangrove soils were acidic, had significantly lower porewater pH (4.7), and higher porewater salinities (62–73 ppt) than the other mangrove sites in the SJBE (Martin et al., 2020). Acidic soils are characteristic of organic matter decay and high sulfur oxidation in mature mangrove forests (Alongi et al., 2004; Marchand et al., 2004). Conservation and recycling of nutrients in the Pin would support high productivity and C accumulation in the system. The expansive root system of the multi-species Pin can trap autochthonous C (e.g., litterfall; plant parts) and possibly allochthonous sediments during storm and flooding events (Pérez et al., 2018; Breithaupt et al., 2020). Future studies in the SJBE might be designed to examine the pulse effect of hurricanes and storms on sediment deposition and/or disturbance to mangrove forests (Smith et al., 2009).
Carbon recycling and elevated porewater salinities may in part explain the shift to a more enriched δ13C at Piñones, relative to the other SJBE sites. Following the damming of the Río Grande de Loíza in 1953, the Piñones lagoon no longer received water through a series of drainage and navigation canals from the Río Grande de Loíza (Webb and Gómez-Gómez, 1998; Cordero, 2015), resulting in a mostly hydrologically isolated system. Elevated porewater salinities have been reported to significantly decrease intercellular CO2 concentrations in mangrove leaves and cause lower C isotopic discrimination and higher transpiration efficiency, resulting in a more enriched δ13C (Lin and Sternberg, 1992; Medina and Francisco, 1997). In addition, overland flow of C-4 plant particulates derived from surrounding agricultural lands (e.g., sugarcane) likely contributed to mangrove soils and in part explain a shift to more enriched δ13C at Piñones (Spain and Le Feuvre, 1997).
Mangrove soil cores collected from MPE and Torr had the highest within-site variability in DBD, C storage, and C burial rates. Human activities (e.g., filling in with debris; raw sewage inputs) at the clogged MPE site likely increased spatial heterogeneity of the mangrove soils (e.g., particle size, bulk density, and % organic matter). In the 1960s and early 1970s, largescale dredging activities in the northwest inlet connecting Torr with the sea altered the hydrology, distribution and settling of sediment (Oczkowski et al., 2020a). Indirect effects of dredging could also cause high spatial heterogeneity of the mangrove soils in the SJBE.
Our estimate for the estuary-wide mangrove soil C burial rate of 188 g m–2 y–1 across time periods was similar in magnitude to the global average (174 ± 23 g m–2 y–1, ±SE; Alongi, 2014) and the global geometric mean (163 g m–2 y–1, 95% confidence interval 131–202 g m–2 y–1; Breithaupt et al., 2012). However, the recent decadal time period (1970–2016) did exhibit a greater mean soil C burial rate of 249 g m–2 y–1, which may reflect some of the disturbances in parts of the SJBE that have been hypothesized to be responsible for extreme C burial rates in other highly impacted sites in Brazil, India, and China (600–1,100 g m–2 y–1; Alongi, 2014; Sanders et al., 2014; Pérez et al., 2018). In fact, in the highly urbanized and clogged MPE, arguably one of the most disturbed mangrove forests in the SJBE, the recent C burial rate (469 g m–2 y1) was over twice as great as the global soil C burial estimates.
Brandeis et al. (2014) estimated mangrove forest (above plus belowground biomass) accumulated C at a rate of 11,262 Mg y–1 for the SJBE. Dividing by the extant mangrove forest (1,486 ha) reported by Brandeis et al. (2014), would result in a C sequestration rate of 7.6 Mg ha–1 y–1. In the present study (∼5 years later), the sum of mangrove aboveground C accumulation (5.2 Mg ha–1 y–1) and belowground C burial (2.5 Mg ha–1 y–1) was 7.7 Mg ha–1 y–1, remarkably similar to the Brandeis et al. (2014) mangrove forest C sequestration rates for the SJBE. Elevated greenhouse gas emissions from SJBE mangrove sediments and adjoining waters, especially in more urbanized areas (e.g., Caño Martin Peña), may partially offset sequestered C in the system (Martin et al., 2020). Rosentreter et al. (2018) determined that global methane emissions from mangrove sediment and waters have the potential to offset C burial rates on average by 20% (using the methane 20-year global warming potential). Therefore, greenhouse gas emissions associated with mangrove systems, which include forest soils, mudflats, and waters, need to be accounted in addition to C accumulation in plant biomass and soils when assessing the importance of mangrove ecosystems in blue carbon inventories. In addition, lateral export of dissolved inorganic and organic C and particulate organic C to oceanic waters may represent a significant C sink, perhaps even greater than the C sequestered in mangrove forest soils, and should also be accounted for in blue C inventories in the future (Maher et al., 2018).
When examining the changes in C burial with depth and time (Figure 6), the SJBE in the mid-20th Century exhibited soil C burial rates that more closely resembled the current global average. Other studies have noted changes in hydrology, mangrove coverage, and settling dynamics throughout the various waterbodies of the SJBE over the last half of the twentieth century (Bunch et al., 2000; Martinuzzi et al., 2009; Branoff, 2020b), all of which likely contributed to the observed increases in C burial in recent decades in addition to the constant press of sea-level rise, which has been shown to increase C burial in mangroves (Breithaupt et al., 2020). For mangrove belowground C storage, our estuary-wide estimate of 143 Mg ha–1 was less than half of the 382, 419, and 370 Mg ha–1 averages for other Caribbean mangroves in the United States, Dominican Republic, and Mexico, respectively (Atwood et al., 2017); however, these averages represent the first 1 m of soil, whereas our SJBE measurements included only the first 18–30 cm. Extrapolating the SJBE C storage values to 1 m (Figure 6) suggested that about 45% of the C was stored in the first 25 cm. Thus, total C storage within the top meter for the whole estuary was estimated at 334 ± 29 Mg ha–1 (±SD) which was more similar to other Caribbean mangrove forests and the global soil C stock of 283 ± 193 Mg ha–1 (± SD) (Atwood et al., 2017).
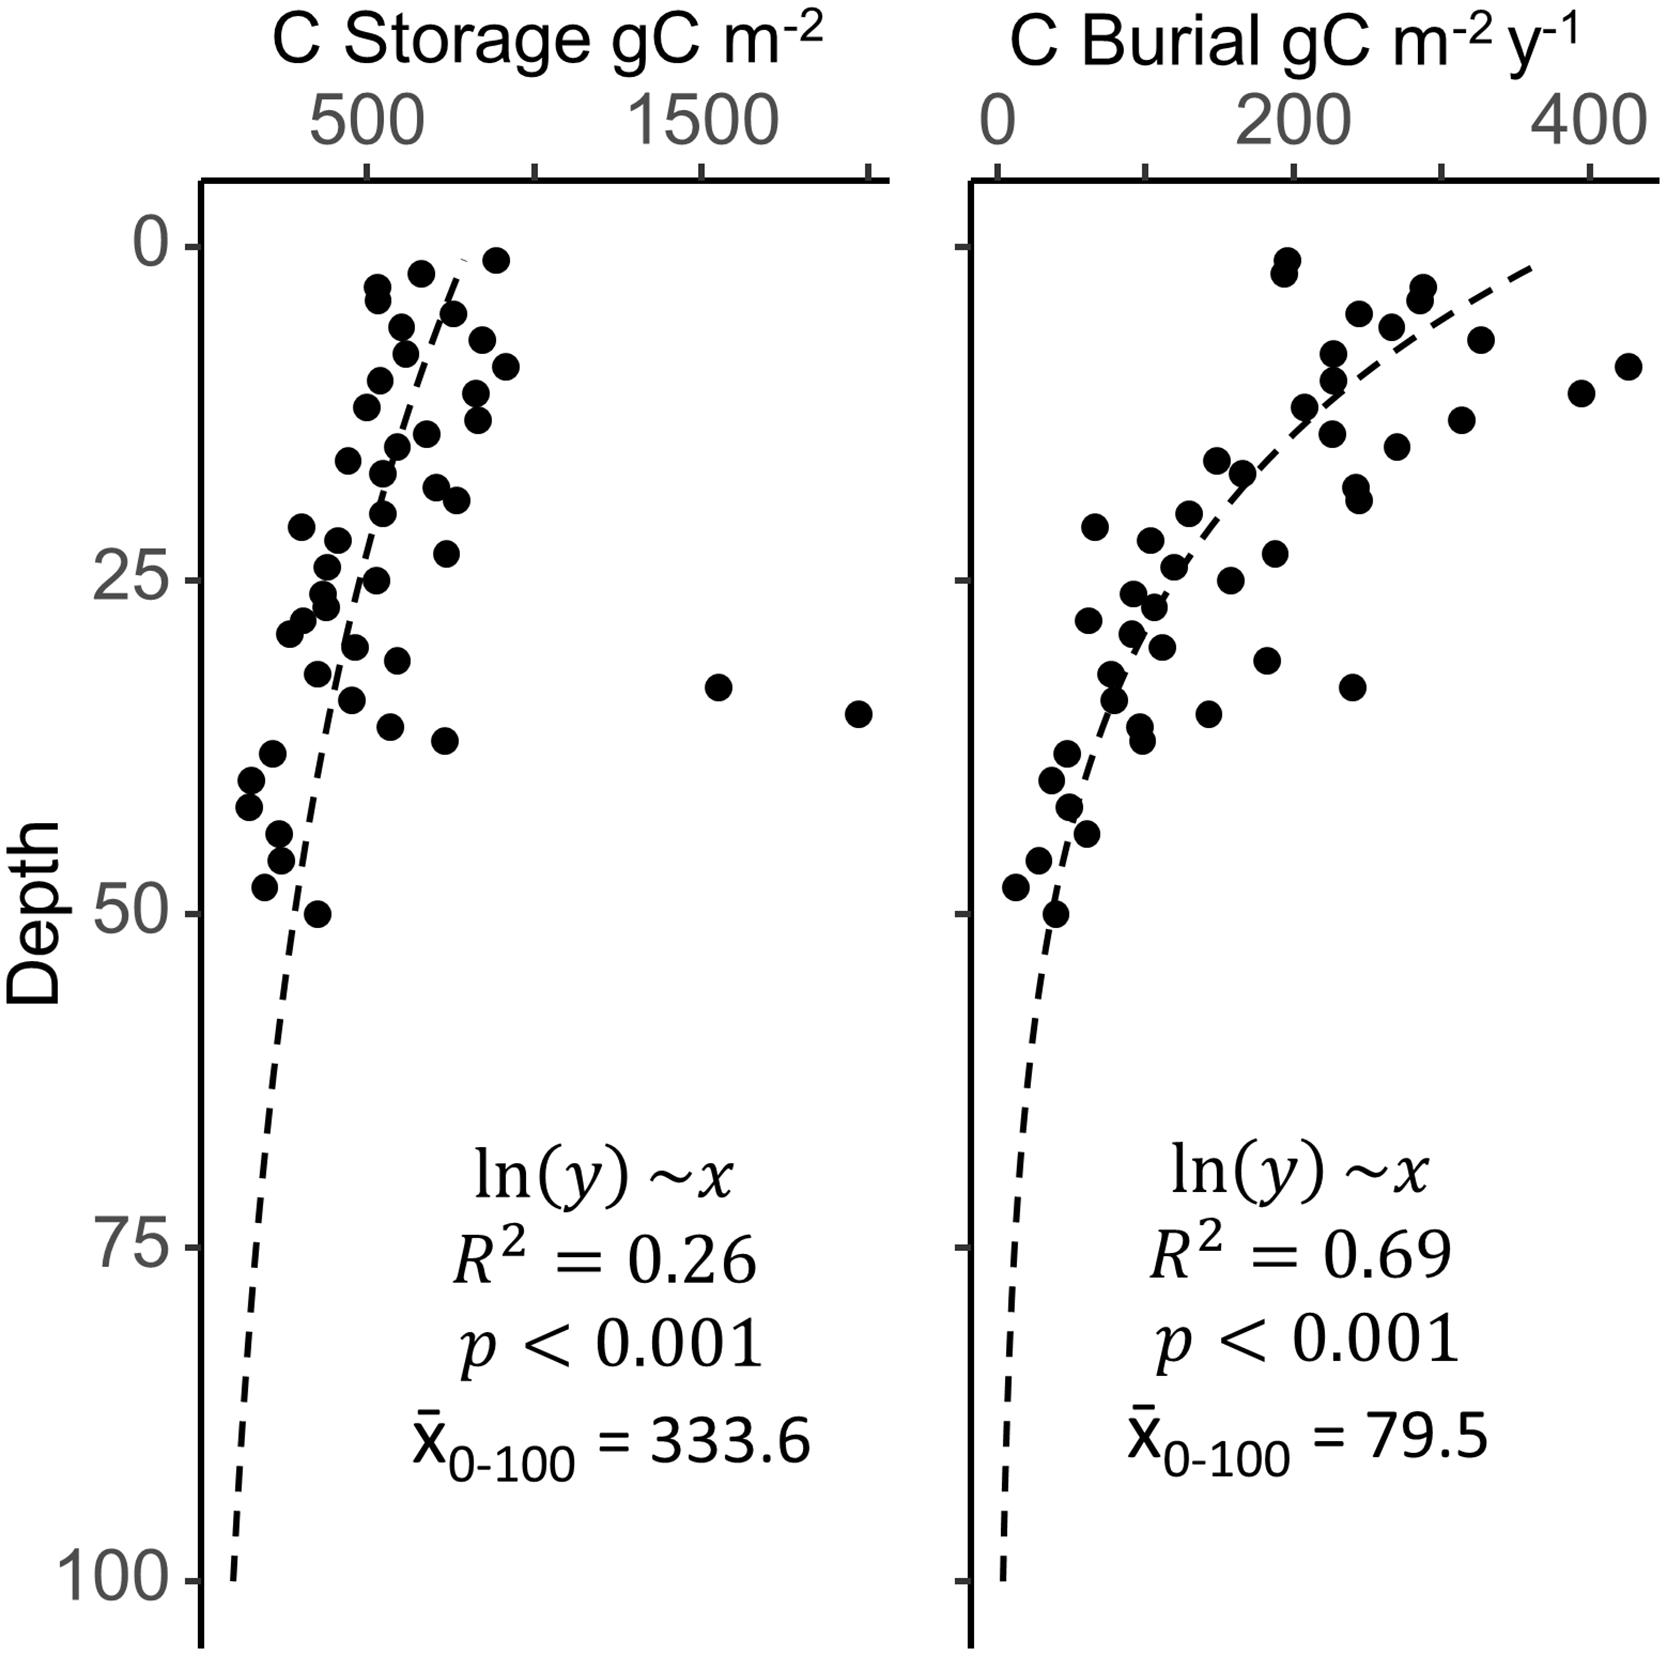
Figure 6. Mean depth profiles for carbon (C) storage and burial across all sites, with the deepest layers approximated by extrapolation of a log transformed linear model (x̄0–100 is the mean of modeled values from 0 to 100 cm of depth). Filled circles are combined mangrove soil data from nine San Juan Bay Estuary cores. Site specific depth profiles (not shown) varied greatly and may not necessarily follow the estuary-wide generalizations.
Regional Anthropogenic Carbon Emissions
On an annual basis, the estimated C emissions from watershed households and their vehicles (1.56 million Mg y–1) were over 85 times greater than the C sequestered by mangroves (17,713 Mg y–1). While the amount of C sequestered by mangrove forests in aboveground biomass and soils was less than that emitted by households each year in the watershed, the C sequestration that mangroves provide is an essential ecosystem service. On an annual basis for every 1.2 Mg C sequestered by mangroves, one household’s electricity use can be offset, and it would take an additional 2.2 Mg C to offset the household’s attributed commercial and industrial electricity use. Similarly, 1.85 Mg C sequestered by mangroves can offset one vehicle’s annual emissions. Thus, the amount of C annually sequestered by SJBE mangroves (17,713 Mg y–1) could offset the annual emissions associated with the electricity usage of around 14,800 households or 9,600 vehicles. If we accounted for commercial and industrial activities in addition to household electricity, then the offset would be about 5,200 households. It is not unusual that the emissions from human activity exceed the annual C sequestration from natural processes, as cities are consumptive entities (Odum, 2007). Indeed, in temperate locations, Hall (2011) found that respiration from the burning of fossil fuels exceeded net primary production by 200–700 times depending on the affluence of the neighborhood. At the county level, Balogh et al. (2016) found that respiration exceeded production by 2:1 to 9:1 over the history of a temperate city. Our study focused specifically on coastal mangrove forest C sequestration, and further research might examine how other terrestrial vegetation in the SJBE watershed might offset additional anthropogenic emissions.
Conclusion
Globally, mangroves provide shelter, flood protection, food, and fiber to millions of people in addition to their high C sequestration rates that can mitigate greenhouse gas emissions (Kauffman et al., 2020; Lovelock, 2020). Delivery of these ecosystem services is threatened by land-use conversion, anthropogenic inputs (e.g., urban runoff and sewage), increase in storms, and sea-level rise (Valiela et al., 2001; Bosire et al., 2014). Indeed, land-use change has resulted in substantial reductions in both biomass and soil C stocks (Sasmito et al., 2019), while sea-level rise is predicted to further stress such systems when ecogeomorphic feedbacks do not keep up with rising waters (Saintilan et al., 2020). If mangrove forests persist, they have the potential to help mitigate greenhouse gas emissions, as demonstrated in this study.
In most mangrove forest cores spanning the SJBE, greater soil C storage was measured in recent decades (1970–2016) as compared to historic decades (1930–1970), except for two cores from the SJ and one core from Torr. The mangrove sites in the present study had belowground C burial rates ranging from 88 g m–2y–1 in the SJ to 469 g m–2 y–1 in MPE in recent decades. Belowground C burial rates in recent decades were significantly greater than historic decades at the most urbanized Caño Martin Peña and least urbanized Piñones. Not only urbanization, but site-specific flushing patterns, landscape setting, and soil characteristics affected soil C burial rates, and these might be considered when modeling C sequestration in tropical and anthropogenically altered mangrove systems. The watershed anthropogenic CO2 emissions (1.56 million Mg C y–1) were over 85 times greater than the annual SJBE mangrove forest C storage rates (aboveground biomass plus soils: 17,713 Mg y–1). In order to mitigate greenhouse gas emissions in urban, tropical areas, a combination of maintaining healthy mangrove forests, as well as strategies to reduce anthropogenic emissions might be necessary.
Data Availability Statement
The datasets presented in this study can be found in online repositories. The names of the repository/repositories and accession number(s) can be found in the article/Supplementary Material.
Author Contributions
CW, RM, and AO conceived the ideas and designed the study with critical suggestions from ME, BB, EH and AH. RM, AH, AO, EH, and CW collected the samples and field data. CW, ME, JL, AH, and RM processed the samples in the laboratory. CW, ME, KM, BB, EW, and SB analyzed the data and carried out the modeling. CW led the writing of the manuscript with assistance from ME, BB, SB, and KM. All authors critically reviewed the drafts and gave final approval for publication.
Conflict of Interest
KM was employed by the company General Dynamics Information Technology, Inc.
The remaining authors declare that the research was conducted in the absence of any commercial or financial relationships that could be construed as a potential conflict of interest.
Acknowledgments
Emily Santos and Katelyn Szura assisted in processing sediments and Rick McKinney in analyzing stable carbon isotopes in the laboratory. Susan Yee provided leadership in organizing the larger EPA-sponsored research effort in Puerto Rico. The research in this study was made possible because of the cooperation and assistance of The Corporación del Proyecto ENLACE del Caño Martín Peña (ENLACE) and the San Juan Bay Estuary Program. Patricia DeCastro and Mike Charpentier helped create graphics. The views expressed in this article are those of the authors and do not necessarily reflect the views or policies of the U.S. Environmental Protection Agency (EPA). The EPA does not endorse any commercial products, services, or enterprises. Any use of trade, firm or product names is for descriptive purposes only and does not imply endorsement by the U.S. Government. This report is ORD Tracking Number ORD-040298, and it has been reviewed technically by the U.S. EPA’s Office of Research and Development, Center for Environmental Measurement and Monitoring, Atlantic Coastal Environmental Sciences Division.
Supplementary Material
The Supplementary Material for this article can be found online at: https://www.frontiersin.org/articles/10.3389/ffgc.2021.676691/full#supplementary-material
References
Alongi, D. M. (2012). Carbon sequestration in mangrove forests. Carbon Manag. 3, 313–322. doi: 10.4155/cmt.12.20
Alongi, D. M. (2014). Carbon cycling and storage in mangrove forests. Ann. Rev. Mar. Sci. 6, 195–219. doi: 10.1146/annurev-marine-010213-135020
Alongi, D. M., Wattayakorn, G., Tirendi, F., and Dixon, P. (2004). Nutrient capital in different aged forests of the mangrove Rhizophora apiculate. Botanica Mar. 47, 116–124.
Appleby, P. G., and Oldfield, F. (1978). The calculation of lead-210 dates assuming a constant rate of supply of unsupported 210Pb to the sediment. CATENA 5, 1–8. doi: 10.1016/S0341-8162(78)80002-2
Aquino-López, M. A., Blaauw, M., Christen, J. A., and Sanderson, N. K. (2018). Bayesian analysis of 210 Pb dating. J. Agricul. Biol. Environ. Statist. 23, 317–333. doi: 10.1007/s13253-018-0328-7
Army Corps (2016). Final Environmental Impact Statement Caño Martin Peña Ecosystem Restoration Project San Juan, Puerto Rico. Prepared by the Corporacio ´n del Proyecto ENLACE del Caño Martin Peña and its consultants Atkins Caribe, LLP, Atkins North America, and Estudios Tecnicos, Inc., for review by the U.S. Washington, DC: Army Corps of Engineers.
Atwood, T. B., Connolly, R. M., Almahasheer, H., Carnell, P., Duarte, C. M., Lewis, C. J. E., et al. (2017). Global patterns in mangrove soil carbon stocks and losses. Nat. Clim. Change 7, 523–528.
Autoridad de Energía Eléctrica de Puerto Rico (2015). Datos publicados por la Autoridad de Energía Eléctrica de Puerto Rico en Cumplimiento con la Ley de Transformación y Alivio Energético de Puerto Rico. San Juan: Autoridad de Energía Eléctrica de Puerto Rico.
Balogh, S., Hall, C. A., Gamils, D. V., Popov, A. M., and Rose, R. T. (2016). Examining the historical and present energy metabolism of a Rust Belt City: Syracuse, NY 1840–2005. Urban Ecosyst. 19, 1499–1534. doi: 10.1007/s11252-013-0342-z
Barbier, E. B., Hacker, S. D., Kennedy, C., Koch, E. W., Stier, A. C., and Silliman, B. R. (2011). The value of estuarine and coastal ecosystem services. Ecol. Monographs 81, 169–193.
Blaauw, M., and Christen, J. A. (2011). Flexible paleoclimate age-depth models using an autoregressive gamma process. Bayesian Anal. 6, 457–474. doi: 10.1214/11-BA618
Blaauw, M., Christen, J. A., Aquino-López, M. A., Esquivel-Vazquez, J., Gonzalez, V. O. M., Belding, T., et al. (2020). rplum: Bayesian Age-Depth Modelling of Cores Dated by Pb-210. R package version 0.1.4. https://cran.r-project.org/web/packages/rplum/index.html.
Bosire, J. O., Kaino, J. J., Olagoke, A. O., Mwihaki, L. M., Ogendi, G. M., and Kairo, J. G. (2014). Mangroves in peril: unprecedented degradation rates of peri-urban mangroves in Kenya. Biogeosciences 11, 2623–2634. doi: 10.5194/bg-11-2623-2014
Brandeis, T. J., Escobedo, F. J., Staudhammer, C. L., Nowak, D. J., and Zipperer, W. C. (2014). San Juan Bay Estuary watershed urban forest inventory. Asheville, NC: USDA-Forest Service Southern Research Station.
Branoff, B. L. (2017). Quantifying the influence of urban land-use on mangrove biology and ecology: a meta-analysis. Global Ecol. Biogeography 26, 1339–1356. doi: 10.1111/geb.12638
Branoff, B. L. (2019). Quantifying the Influence of Urbanization on Puerto Rico’s Mangrove Ecosystems. Dissertation, San Juan.: University of Puerto Rico-Rio Piedras.
Branoff, B. L. (2020a). Mangrove disturbance and response following the 2017 hurricane season in Puerto Rico. Estuaries Coasts 43, 1248–1262. doi: 10.1007/s12237-019-00585-3
Branoff, B. L. (2020b). The role of urbanization in the flooding and surface water chemistry of Puerto Rico’s mangroves. Hydrol. Sci. J. 65, 132–1343.
Branoff, B. L., and Martinuzzi, S. (2020). The structure and composition of Puerto Rico’s urban mangroves. Forests 11:1119. doi: 10.3390/f11101119
Breithaupt, J. L., Smoak, J. M., Bianchi, T. S., Vaughn, D. R., Sanders, C. J., and Radabaugh, K. R. (2020). Increasing rates of carbon burial in Southwest Florida coastal wetlands. J. Geophys. Res. Biogeosci. 125:e2019JG005349.
Breithaupt, J. L., Smoak, J. M., Smith, T. J., Sanders, C. J., and Hoare, A. (2012). Organic carbon burial rates in mangrove sediments: strengthening the global budget, global biogeochem. Cycles 26:GB3011. doi: 10.1029/2012GB004375
Bunch, B. W., Cerco, C. F., Dortch, M. S., Johnson, B., Kim, K. W., et al. (2000). Hydrodynamic and Water Quality Model Study of San Juan Bay Estuary. Vickburg, MS: U.S. Army Engineer Research and Development Center.
Cahoon, D. R., Lynch, J. C., Perez, B. C., Segura, B., Holland, R. D., Stelly, C., et al. (2002). High precision measurements of wetland sediment elevation: II. the rod surface elevation table. J. Sedimentary Res. 72, 734–739. doi: 10.1306/020702720734
Cerco, C., Bunch, B., Dortch, M., Johnson, B., and Kim, K. (2003). Eutrophication and pathogen abatement in the San Juan Bay Estuary. J. Environ. Eng. 129, 318–327. doi: 10.1061/(asce)0733-9372(2003)129:4(318)
Cordero, J. G. (2015). Trabajo y vida en el mangle: “Madera negra” y carbón en Piñones (Loíza), Puerto Rico (1880–1950). Caribbean Stud. 43, 3–71. doi: 10.1353/crb.2015.0001
Cutshall, N. H., Larsen, I. L., and Olsen, C. R. (1983). Direct analysis of 210Pb in sediment samples: self-absorption corrections. Nuclear Instruments Methods Phys. Res. 206, 309–312. doi: 10.1016/0167-5087(83)91273-5
Donato, D. C., Kauffman, J. B., Murdiyarso, D., Kurnianto, S., Stidham, M., and Kanninen, M. (2011). Mangroves among the most carbon-rich forests in the tropics. Nat. Geosci. 4, 293–297. doi: 10.1038/ngeo1123
Eagle, M. J., Wigand, C., Branoff, B., Balogh, S., Miller, K. M., Martin, R. M., et al. (2021). Collection, Analysis, and Age-dating of Sediment Cores from Mangrove Wetlands, San Juan Bay Estuary Puerto Rico, 2016. Virginia, VA: U.S. Geological Survey data release, doi: 10.5066/P97CAF30
Efron, B., and Tibshirani, R. (1993). An Introduction to the Bootstrap. Boca Raton, FL: Chapman & Hall/CRC.
El Instituto de Estadísticas de Puerto Rico (n.d.). Ventas de gasolina en Puerto Rico años naturales 1986 - 2011. San Juan: El Instituto de Estadísticas de Puerto Rico.
Ellis, S. R. (1976). History of dredging and filling of lagoons in the San Juan area, Puerto Rico. Virginia, VA: U.S. Geological Survey. Water-Resources Investigations Report 76-38.
Ewel, K., Twilley, R., and Ong, J. I. N. (1998). Different kinds of mangrove forests provide different goods and services. Global Ecol. Biogeography Lett. 7, 83–94. doi: 10.2307/2997700
Feliciano, Z. M. (2018). IRS Section 936 and the Decline of Puerto Rico’s manufacturing. Centro J. 30, 30–42.
Goldberg, E. D. (1963). “Geochronology with 210Pb,” in Proceedings of the International Atomic Energy Agency Symposium Proceedings Radioactive Dating, (Athens).
Gómez-Baggethun, E., Gren, Å, Barton, D. N., Langemeyer, J., McPhearson, T., O’Farrell, P., et al. (2013). “Urban ecosystem services,” in Urbanization, Biodiversity and Ecosystem Services: Challenges and Opportunities, eds. Elmqvist T. et al. (Berlin: Springer), 175–251.
Hall, M. H. (2011). A preliminary assessment of socio-ecological metabolism for three neighborhoods within a rust belt urban ecosystem. Ecol. Modell. 223, 20–31. doi: 10.1016/j.ecolmodel.2011.08.018
Hamilton, S., and Casey, D. (2016). Creation of a high spatiotemporal resolution global database of continuous mangrove forest cover for the 21st Century (CGMFC-21). Global Ecol. Biogeography 25, 729–738. doi: 10.1111/geb.12449
Harris, D., Horwarth, W. R., and van Kessel, C. (2001). Acid fumigation of soils to remove carbonates prior to total organic carbon or carbon-13 isotopic analysis. Soil Sci. Soc. Am. J. 65, 1853–1856. doi: 10.2136/sssaj2001.1853
Kauffman, J. B., Adame, M. F., Arifanti, V. B., Schile-Beers, L. M., Bernardino, A. F., Bhomia, R. K., et al. (2020). Total ecosystem carbon stocks of mangroves across broad global environmental and physical gradients. Ecol. Monographs 90. doi: 10.1002/ECM.1405
Kennedy, C., Steinberger, J., Gasson, B., Hansen, Y., Hillman, T., Havránek, M., et al. (2010). Methodology for inventorying greenhouse gas emissions from global cities. Energy Pol. 38, 4828–4837. doi: 10.1016/j.enpol.2009.08.050
Khan, N. S., Vane, C. H., Engelhart, S. E., Kendrick, C., and Horton, B. P. (2019). The application of δ13C, TOC and C/N geochemistry of mangrove sediments to reconstruct Holocene paleoenvironments and relative sea levels, Puerto Rico. Mar. Geol. 415:105963. doi: 10.1016/j.margeo.2019.105963
Krauss, K. W., Doyle, T. W., Twilley, R. R., Rivera-Monroy, V. H., and Sullivan, J. K. (2006). Evaluating the relative contributions of hydroperiod and soil fertility on growth of south Florida mangroves. Hydrobiologia 569, 311–324. doi: 10.1007/s10750-006-0139-7
Li, S., Chen, P., Huang, J., Hsueh, M., Hsieh, L., Lee, C., et al. (2018). Factors regulating carbon sinks in mangrove systems. Global Change Biol. 24, 4195–4210. doi: 10.1111/gcb.14322
Lin, G. H., and Sternberg, L. D. S. L. (1992). Effect of growth form, salinity, nutrient and sulfide on photosynthesis, carbon isotope discrimination and growth of red mangrove (Rhizophora mangle L.). Funct. Plant Biol. 19, 509–517. doi: 10.1071/pp9920509
Lovelock, C. E. (2020). Blue carbon from the past forecasts the future. Science 368, 1050–1052. doi: 10.1126/science.abc3735
Lugo, A. E., and Medina, E. (2014). Mangrove forests. Encyclopedia of Natural Resources. New York, NY: Taylor & Francis, 343–352.
Lugo, A. E., Medina, E., and McGinley, K. (2014). Issues and challenges of mangrove conservation in the Anthropocene. Madera y Bosques. 20, 11–38. doi: 10.21829/myb.2014.200146
Lugo, A. E., Ramos, O., and Rodriguez, C. (2011). The Río Piedras Watershed and its Surrounding Environment. Washington, D.C: U.S. Department of Agriculture, Forest Service, International Institute of Tropical Forestry.
Maher, D. T., Call, M., Santos, I. R., and Sanders, C. J. (2018). Beyond burial: lateral exchange is a significant atmospheric carbon sink in mangrove forests. Biol. Lett. 14:20180200. doi: 10.1098/rsbl.2018.0200
Marchand, C., Baltzer, F., Lallier-Vergès, E., and Albéric, P. (2004). Pore-water chemistry in mangrove sediments: relationship with species composition and developmental stages. (French Guiana). Mar. Geol. 208, 361–381. doi: 10.1016/j.margeo.2004.04.015
Marois, D. E., and Mitsch, W. J. (2015). Coastal protection from tsunamis and cyclones provided by mangrove wetlands–a review. Int. J. Biodiversity Sci. Ecosystem Serv. Manag. 11, 71–83. doi: 10.1080/21513732.2014.997292
Marois, D. E., and Mitsch, W. J. (2017). A mangrove creek restoration plan utilizing hydraulic modeling. Ecol. Eng. 108, 537–546. doi: 10.1016/j.ecoleng.2017.06.063
Martin, R. M., Wigand, C., Oczkowski, A., Hanson, A., Balogh, S., Branoff, B., et al. (2020). Greenhouse gas fluxes of mangrove soils and adjacent coastal waters in an urban, subtropical estuary. Wetlands 40, 1469–1480. doi: 10.1007/s13157-020-01300-w
Martinuzzi, S., Gould, W. A., Lugo, A. E., and Medina, E. (2009). Conversion and recovery of Puerto Rican mangroves: 200 years of change. Forest Ecol. Manag. 257, 75–84. doi: 10.1016/j.foreco.2008.08.037
McLeod, E., Chmura, G. L., Bouillon, S., Salm, R., Bjork, M., Duarte, C. M., et al. (2011). A blueprint for blue carbon:toward an improved understanding of the role of vegetated coastal habitats in sequestering CO2. Front. Ecol. Environ. 9:552–560. doi: 10.1890/110004
Medina, E., and Francisco, M. (1997). Osmolality and δ13C of leaf tissues of mangrove. Estuarine Coastal Shelf Sci. 45, 337–344. doi: 10.1006/ecss.1996.0188
Ngo, N. S., and Pataki, D. E. (2008). The energy and mass balance of Los Angeles county. Urban Ecosystems 11, 121–139. doi: 10.1007/s11252-008-0051-1
Ochoa-Gómez, J. G., Lluch-Cota, S. E., Rivera-Monroy, V. H., Lluch-Cota, D. B., Troyo-Dieguez, E., Oechel, W., et al. (2019). Mangrove wetland productivity and carbon stocks in an arid zone of the Gulf of California (La Paz Bay, Mexico). Forest Ecol. Manag. 442, 135–147. doi: 10.1016/j.foreco.2019.03.059
Oczkowski, A., Santos, E., Gray, A., Miller, K., Huertas, E., Hanson, A., et al. (2020a). Tracking the dynamic ecological history of a tropical urban estuary as it responds to human pressures. Ecosystems 23, 231–245. doi: 10.1007/s10021-019-00399-1
Oczkowski, A. J., Santos, E. A., Martin, R. M., Gray, A. B., Hanson, A. R., Watson, E. B., et al. (2020b). Unexpected nitrogen sources in a tropical urban estuary. J. Geophys. Res. Biogeosci. 125:e2019JG005502.
Odum, H. T. (2007). Environment, Power, and Society for the Twenty-first Century: the Hierarchy of Energy. New York, NY: Columbia University Press.
Office for Coastal Management (2017). Office for Coastal Management. C-Cap Land Cover, Puerto Rico, 2010 from 15 June 2010 to 15 August 2018. Available online at: https://inport.nmfs.noaa.gov/inport/item/48301 (accessed on October 9, 2020).
Paul, D., Skrzypek, G., and Fórizs, I. (2007). Normalization of measured stable isotopic compositions to isotope reference scales – a review. Rapid Commun. Mass Spectrometry 21, 3006–3014. doi: 10.1002/rcm.3185
Pendleton, L., Donato, D. C., Murray, B. C., Crooks, S., Jenkins, W. A., et al. (2012). Estimating global “Blue Carbon” emissions from conversion and degradation of vegetated coastal ecosystems. PLoS One 7:e43542. doi: 10.1371/journal.pone.0043542
Pérez, A., Libardoni, B. G., and Sanders, C. J. (2018). Factors influencing organic carbon accumulation in mangrove systems. Biol. Lett. 14:20180237. doi: 10.1098/rsbl.2018.0237
Pérez, A., Machado, W., Gutierrez, D., Smoak, J. M., Breithaupt, J. L., Saldarriaga, M. S., et al. (2020). Carbon and nutrient accumulation in mangrove sediments affected by multiple environmental changes. J. Soils Sediments 20, 2504–2509. doi: 10.1007/s11368-020-02612-4
Pérez-Villalona, H., Cornwell, J. C., Ortiz-Zayas, J. R., and Cuevas, E. (2015). Sediment denitrification and nutrient fluxes in the San José Lagoon, a tropical lagoon in the highly urbanized San Juan Bay Estuary, Puerto Rico. Estuaries Coasts 38, 2259–2278. doi: 10.1007/s12237-015-9953-3
R Core Team (2020). R: A Language and Environment for Statistical Computing. Vienna: R Foundation for Statistical Computing.
Rodrigues, D. P., Hamacher, C., Estrada, G. C. D., and Soares, M. L. G. (2015). Variability of carbon content in mangrove species: effect of species, compartments and tidal frequency. Aquatic Botany 120, 346–351. doi: 10.1016/j.aquabot.2014.10.004
Rosentreter, J. A., Maher, D. T., Erler, D. V., Murray, R. H., and Eyre, B. D. (2018). Methane emissions partially offset “blue carbon” burial in mangroves. Sci. Sci. Adv. 4:eaao4985. doi: 10.1126/sciadv.aao4985
Saintilan, N., Khan, N. S., Ashe, E., Kelleway, J. J., Rogers, K., Woodroffe, C. D., et al. (2020). Thresholds of mangrove survival under rapid sea level rise. Science 368, 1118–1121. doi: 10.1126/science.aba2656
Sanders, C. J., Eyre, B. D., Santos, I. R., Machado, W., Luiz-Silva, W., Smoak, J. M., et al. (2014). Elevated rates of organic carbon, nitrogen, and phosphorus accumulation in a highly impacted wetland. Geophys. Res. Lett. 41, 2475–2480. doi: 10.1002/2014GLO59789
Sasmito, S. D., Sillanpaa, M., Hayes, M. A., Bachri, S., Saragi-Sasmito, M. F., Sidak, F., et al. (2020). Mangrove blue carbon stocks and dynamics are controlled by hydrogeomorphic settings and land-use change. Global Change Biol. 26, 3028–3039. doi: 10.1111/gcb.15056
Sasmito, S. D., Taillardat, P., Clendenning, J. N., Cameron, C., Friess, D. A., Murdiyarso, D., et al. (2019). Effect of land-use and land-cover change on mangrove blue carbon: a systematic review. Global Change Biol. 25, 4291–4302. doi: 10.1111/gcb.14774
Shepard, D. (1968). “A two-dimensional interpolation function for irregularly-spaced data,” in Proceedings of the 1968 23rd ACM National Conference, (New York, NY: ACM).
Smith, T. J., Anderson, G. H., Balentine, K., Tiling, G., Ward, G. A., and Whelan, K. R. T. (2009). Cumulative impacts of hurricanes on florida mangrove ecosystems: sediment deposition, storm surges and vegetation. Wetlands 29, 24–34. doi: 10.1672/08-40.1
Spain, A., and Le Feuvre, R. (1997). Stable C and N isotope values of selected components of a tropical Australian sugarcane ecosystem. Biol. Fertil. Soils. 24, 118–122. doi: 10.1007/s003740050218
Tarroso, P., Velo-Antón, G., and Carvalho, S. B. (2015). PHYLIN: an R package for phylogeographic interpolation. Mol. Ecol. Resources 15, 349–357. doi: 10.1111/1755-0998.12312
U.S. Census Bureau (2017). American Community Survey Census Tract Estimates for Puerto Rico. Suitland, MD: U.S. Census Bureau.
U.S. Environmental Protection Agency (2014). Emission Factors for Greenhouse Gas Inventories. Washington, DC: U.S. Environmental Protection Agency.
U.S. Fish and Wildlife Service (2018). National Wetlands Inventory website. Washington, DC: U.S. Department of the Interior, Fish and Wildlife Service.
Valiela, I., Bowen, J. L., and York, J. K. (2001). Mangrove forests: one of the world’s threatened major tropical environments. BioScience 51, 807–815. doi: 10.1641/0006-3568(2001)051[0807:mfootw]2.0.co;2
Webb, R. M. T., and Gómez-Gómez, F. (1998). Synoptic Survey of Water Quality and Bottom Sediments, San Juan Bay Estuary System, Puerto Rico, December 1994-July 1995. Washington, DC: U.S. Department of the Interior.
Wuertz, D., Setz, T., Chalabi, Y., Boudt, C., Chausse, P., and Miklovac, M. (2020). fGarch: Rmetrics – Autoregressive Conditional Heteroskedastic Modelling. R package version 3042.83.2. https://CRAN.R-project.org/package=fGarch.
Keywords: mangrove, urbanization, tropical forest, soil carbon burial, CO2 emissions, carbon accumulation, carbon storage, peri-urban mangrove
Citation: Wigand C, Eagle M, Branoff BL, Balogh S, Miller KM, Martin RM, Hanson A, Oczkowski AJ, Huertas E, Loffredo J and Watson EB (2021) Recent Carbon Storage and Burial Exceed Historic Rates in the San Juan Bay Estuary Peri-Urban Mangrove Forests (Puerto Rico, United States). Front. For. Glob. Change 4:676691. doi: 10.3389/ffgc.2021.676691
Received: 05 March 2021; Accepted: 12 May 2021;
Published: 07 June 2021.
Edited by:
Daniel Friess, National University of Singapore, SingaporeReviewed by:
Victor Rivera-Monroy, Louisiana State University, United StatesFernanda Adame, Griffith University, Australia
Copyright © 2021 Wigand, Eagle, Branoff, Balogh, Miller, Martin, Hanson, Oczkowski, Huertas, Loffredo and Watson. This is an open-access article distributed under the terms of the Creative Commons Attribution License (CC BY). The use, distribution or reproduction in other forums is permitted, provided the original author(s) and the copyright owner(s) are credited and that the original publication in this journal is cited, in accordance with accepted academic practice. No use, distribution or reproduction is permitted which does not comply with these terms.
*Correspondence: Cathleen Wigand, d2lnYW5kLmNhdGhsZWVuQGVwYS5nb3Y=