Abstract
If we better understand how fungal responses to global change are governed by their traits, we can improve predictions of fungal community composition and ecosystem function. Specifically, we can examine trade-offs among traits, in which the allocation of finite resources toward one trait reduces the investment in others. We hypothesized that trade-offs among fungal traits relating to rapid growth, resource capture, and stress tolerance sort fungal species into discrete life history strategies. We used the Biolog Filamentous Fungi database to calculate maximum growth rates of 37 fungal species and then compared them to their functional traits from the funfun database. In partial support of our hypothesis, maximum growth rate displayed a negative relationship with traits related to resource capture. Moreover, maximum growth rate displayed a positive relationship with amino acid permease, forming a putative Fast Growth life history strategy. A second putative life history strategy is characterized by a positive relationship between extracellular enzymes, including cellobiohydrolase 6, cellobiohydrolase 7, crystalline cellulase AA9, and lignin peroxidase. These extracellular enzymes were negatively related to chitosanase 8, an enzyme that can break down a derivative of chitin. Chitosanase 8 displayed a positive relationship with many traits that were hypothesized to cluster separately, forming a putative Blended life history strategy characterized by certain resource capture, fast growth, and stress tolerance traits. These trait relationships complement previously explored microbial trait frameworks, such as the Competitor-Stress Tolerator-Ruderal and the Yield-Resource Acquisition-Stress Tolerance schemes.
Introduction
Fungi perform essential ecosystem processes such as decomposition and nutrient cycling (Dighton, 2003). However, it is challenging to predict how microbial communities will respond to global change and how ecosystem function will be affected (Bradford et al., 2016). For example, shifts in microbial community composition in response to a changing environment can alter carbon cycling (Allison and Martiny, 2008; Allison et al., 2013). A better understanding of relationships among fungal traits may allow us to improve predictions of carbon dynamics under global change (Allison, 2012). For example, frequently disturbed soil can provide new resources for exploitation by fast-growing fungi (Pugh and Boddy, 1988). If fast-growing fungi tend to be poor decomposers, then decomposition rates in frequently disturbed soils may be slower than otherwise expected.
Examining trade-offs among fungal traits is one approach to link community composition to ecosystem processes (Wallenstein and Hall, 2012; Crowther et al., 2014). Trade-offs occur when an allocation of finite resources toward one trait reduces investment in others. For example, fungi maximizing investment in melanin production to withstand desiccation may in turn display a decreased growth rate (Siletti et al., 2017). Yet, trade-offs between fungal growth rate and other traits are under-investigated. Here we examine trade-offs between fungal growth rate and other fungal traits related to resource capture and stress tolerance. In addition, we determine how these trade-offs structure fungal traits into various life history strategies.
The first challenge in predicting fungal responses to climate change is identifying which fungal functional traits are important for ecosystem functions (Krause et al., 2014). Functional traits are defined as measurable properties that are of physiological, morphological, or genetic origin (Crowther et al., 2014), that influence an organism’s fitness, and that provide a link between fundamental biological processes and community dynamics (McGill et al., 2006). Maximum potential growth rate is a defining feature of organisms and is thought to be an emergent feature of genomic traits. For example, an increased number of rRNA copies allows for an increase in protein synthesis, supporting rapid growth (Cox, 2003; Scott et al., 2014). Ecologists have used growth rates to predict nutrient cycling in ecosystems (Elser et al., 1996). However, predictions have primarily focused upon macroscopic organisms (Caraco et al., 1997; Allison and Vitousek, 2004; Lovett et al., 2006). Here, we quantified fungal growth rates for 653 fungal species and determined their relationships with other functional traits where possible.
To link fungal traits to ecosystem processes, it can be useful to identify principle microbial life history strategies, each composed of distinct functional traits (Malik et al., 2020). Microbial strategies or lifestyles are characterized by suites of traits which may be simultaneously selected under specific environmental conditions. While originally devised for plants, Grime’s well-known Competitor-Stress Tolerator-Ruderal (CSR) scheme has been applied to mycelial fungi (Grime, 1977; Pugh, 1980; Treseder and Lennon, 2015). Here, three life history strategies exist based on the occurrence of environmental stress or disturbance (Grime, 1977). Ruderal organisms are often the first to colonize an area after a disturbance and do so with a rapid growth rate (Pugh, 1980). As RNA and protein synthesis is needed to support rapid growth, traits relating to the uptake of phosphate, amino acids, and nitrogen are expected to coincide with a ruderal life history strategy (Versaw and Metzenberg, 1995; Elser et al., 1996; Slot et al., 2007; Cappellazzo et al., 2008). Stress tolerating organisms can persist in environments that may be particularly hot, cold, or dry (Pugh, 1980). The production of osmolytes, β 1,3-glucan, and melanin can reduce desiccation during drought conditions (Acharya et al., 2004; Bowman and Free, 2006; Warren, 2014). Competing organisms are predicted to persist in low stress and low disturbance environments (Pugh, 1980). They outcompete other fungi via superior resource capture (Boddy, 2000). One method is through the production of extracellular enzymes such as lignin peroxidases and cellulases, which degrade complex forms of carbon (Lynd et al., 2002; Martínez et al., 2009). Although recent studies have taken a trait-based approach toward describing bacterial communities, further research is needed to apply these schemes to fungal traits as well (Ho et al., 2013; Krause et al., 2014; Fierer, 2017; Wood et al., 2018; Ramin and Allison, 2019).
In this study, we asked (1) if there are trade-offs among fungal traits relating to fast growth, resource capture, and stress tolerance and (2) if trade-offs sort fungal traits into life history strategies, such as CSR. We hypothesized that trade-offs would occur between traits related to fungal growth rate, resource capture, and stress tolerance. Accordingly, we predicted negative relationships between these traits. To test this, we compared growth rate measurements from the Biolog Filamentous Fungi database with traits from funfun, a fungal functional traits database.
Materials and Methods
Fungal Growth Rates
To calculate fungal growth rates, we used the Biolog Filamentous Fungi (FF) database (BIOLOG, Inc., Hayward, CA, United States; Biolog, 2017). This database includes optical density (OD) readings for various fungal species growing in a specified carbon source. Biolog measured OD at 750 nm with readings recorded at 24, 48, 72, 96, and 168 h of incubation. These OD readings indicate turbidity of the liquid culture, which is positively correlated with fungal abundance (Langvad, 1999; Meletiadis et al., 2001; Biolog, 2017). These measurements were scaled from 0 to 100, with 100 representing the maximum possible OD value. Of the various carbon sources within the database, we chose the simple sugar α-D-glucose to calculate maximum growth rate, as not all fungi possess the capacity to breakdown more complex forms of carbon, such as cellulose (Ganesan and Nellaiappan, 2014; Hu et al., 2016). To quantify growth rate for each species, we determined the change in OD between sequential incubation time points and divided by the incubation period (hours). We then chose the maximum growth rate on α-D-glucose for each species for further analysis. For species represented by multiple strains, we averaged the maximum growth rate across strains. In total, we recorded maximum growth rates for 653 fungal strains, including clinically or environmentally important fungi, plant pathogens, and indoor or food-borne fungi (Supplementary Table 1).
Fungal Trait Database
We used funfun, a functional trait database for fungi, to identify continuous fungal traits that may be associated with resource capture, stress tolerance, or growth rate (Table 1; Flores-Moreno et al., 2018). Specifically, we used gene frequencies from the fungal genomics program of the Joint Genome Institute of the Department of Energy and the 1,000 Fungal Genomes Project that were present in the database (Grigoriev et al., 2014). Genome sizes vary widely in fungi, so gene frequency was calculated as the count of a given gene per 10,000 genes in each genome. While the possession of a gene does not guarantee that it will be expressed, it indicates the genetic potential for a given trait and is useful toward identifying associations among traits (Wilmes and Bond, 2006; Myrold et al., 2014). We then merged the fungal trait data from funfun with growth rate data from Biolog for all overlapping species (Supplementary Tables 2, 3; Flores-Moreno et al., 2018). This resulted in 37 fungal species from Ascomycota, Basidiomycota, and Mucoromycota to be further analyzed (Table 2). The growth forms of these species included 24 filamentous fungi and 13 yeasts. Furthermore, classification of their trophic modes resulted in 12 pathotrophs, 11 saprotrophs, 1 symbiotroph, and 13 species with mixed ecologies.
TABLE 1
| Proposed life history strategy | Fungal trait(s) | funfun trait name | Function(s) |
| Resource capture life history strategy (a.k.a. competitor or resource acquisition) | Invertase | Invertase 32 | Breakdown of sucrose (Boddy et al., 1993) |
| α-Glucosidase | α-Glucosidase 15; α-Glucosidase 31 | Breakdown of starch (Nakamura et al., 1997) | |
| Amylase | Amylase 88 | Breakdown of starch (Korman et al., 1990) | |
| β-Xylosidase | β-Xylosidase 43 | Breakdown of hemicellulose (Semenova et al., 2009) | |
| β-Glucosidases | β-Glucosidase 1 | Breakdown of cellulose (Znameroski et al., 2012) | |
| Cellobiohydrolases | Cellobiohydrolase 6; Cellobiohydrolase 7 | Breakdown of cellulose (Ilmén et al., 1997) | |
| Endoglucanases | Endoglucanase 9; Endoglucanase 12 | Breakdown of cellulose (Rungrattanakasin et al., 2018) | |
| α-Mannosidase | Glycoprotein synthesis 92; α-mannanase 76 | Breakdown of mannose (Nakajima et al., 1976; Maruyama et al., 1994) | |
| Crystalline cellulase | Crystalline cellulase AA9 | Breakdown of cellulose (Langston et al., 2011) | |
| Lignin peroxidase | Lignin peroxidase | Breakdown of lignin (Ruiz-Dueñas et al., 2009) | |
| Chitosanase | Chitosanase 8 | Breakdown of chitosan (Shimosaka et al., 1993) | |
| Chitinase | Chitinase | Breakdown of chitin (Seidl et al., 2005) | |
| Endo-β-D-1,3-glucanase Endo-β-N-acetylglucosaminidase | Glucosidase 81 Glycopeptidase 85 | Breakdown of β 1,3-glucan (Reese and Mandels, 1959) Breakdown of glycoproteins (Huang et al., 2018) | |
| Stress tolerator life history strategy | β 1,3-Glucan synthase | β-Glucan synthase | Strengthens cell wall, reduces water loss (Mazur et al., 1995) |
| Trehalase | Trehalase | Protection from desiccation, freeze damage, thermotolerance (Singer and Lindquist, 1998) | |
| Cold shock protein | Cold shock protein | Protection from cold stress (Homma et al., 2003; Murata et al., 2006) | |
| Heat shock protein | Heat shock protein | Protection from temperature, osmotic, pH stress (Lamoth et al., 2012) | |
| Fast growth life history strategy (a.k.a. ruderal) | Fast growth | Allows rapid colonization (Siletti et al., 2017) | |
| Amino acid permease; Phosphate, nitrate, and ammonium transporters | Amino acid permease; Phosphate transporter; Nitrate transporter; Ammonium transporter | Augments uptake of N and P to support growth (Nehls et al., 1999; Wipf et al., 2002; Mitsuzawa, 2006; Slot et al., 2007; Cappellazzo et al., 2008; Sengottaiyan et al., 2013) | |
| Acid phosphatase | Acid phosphatase | P mineralization (Nelson et al., 1976; Han et al., 1987) |
Potential fungal traits associated with each life history strategy within the Competitor-Stress Tolerator-Ruderal scheme.
TABLE 2
| Fungal species |
| Aspergillus clavatus |
| Aspergillus fischeri |
| Aspergillus flavus |
| Aspergillus fumigatus |
| Aspergillus niger |
| Aspergillus ruber |
| Aspergillus terreus |
| Aureobasidium pullulans |
| Beauveria bassiana |
| Botrytis cinerea |
| Chaetomium globosum |
| Debaryomyces hansenii |
| Dekkera bruxellensis |
| Fusarium fujikuroi |
| Fusarium graminearum |
| Fusarium oxysporum |
| Fusarium solani |
| Kluyveromyces lactis |
| Komagataella pastoris |
| Neurospora crassa |
| Penicillium chrysogenum |
| Penicillium digitatum |
| Penicillium oxalicum |
| Pesotum piceae |
| Phanerodontia chrysosporium |
| Rhizopus arrhizus |
| Rhizopus microsporus |
| Saccharomyces cerevisiae |
| Schizosaccharomyces octosporus |
| Schizosaccharomyces pombe |
| Torulaspora delbrueckii |
| Trichoderma parceramosum |
| Trichoderma reesei |
| Trichoderma virens |
| Ustilago maydis |
| Yarrowia lipolytica |
| Zygosaccharomyces rouxii |
List of fungal species analyzed in this study.
Statistics
To examine relationships between each pairwise combination of traits, we used phylogenetic independent contrasts (PIC). PICs were appropriate here because they accounted for the phylogenetic relatedness of the taxa (Webb et al., 2002, 2008). We used PICs instead of standard analyses like Pearson correlation, which require statistical independence of samples (Ricklefs and Starck, 1996).
We used the fungal phylogeny from Choi and Kim (2017), which is generated from whole genome sequences. We downloaded this phylogeny from Choi (2020, accessed 12/3/2020). Of the 37 species we analyzed, 26 were represented in the phylogeny (Supplementary Table 2 and Supplementary Figure 1). For each of the remaining species, we used the nearest taxon in the phylogeny. (Sequences were not available for these remaining taxa, so we could not construct a new phylogeny that included them.) Seven of the species were assigned to a taxon from the same genus or family (Supplementary Table 2). We pruned the tree to remove any taxa not represented among the 37 species (Supplementary Figure 1).
For PIC, we used the aotf function in Phylocom v 4.2 (Webb et al., 2008). The aotf function calculated the difference (“contrast”) in the values of a given trait between daughter clades of each node in the phylogeny. It then generated a series of correlations of the contrasts between each pairwise combination of traits. More recently diverged clades carried more weight in the correlations, which was the default setting for aotf. Trait data were ranked to avoid outliers. Since this study was exploratory and aimed to be as comprehensive as possible, we did not adjust for multiple comparisons and instead present unadjusted P-values (Rothman, 1990; Perneger, 1998; Feise, 2002; Althouse, 2016). A negative correlation suggests a trait trade-off.
To determine relationships among all fungal traits, we performed a non-metric multidimensional scaling (NMS) analysis, with the PIC r coefficients as the distance metric (Table 3). We used the monotonic multidimensional scaling function with the Kruskal method in SPSS version 13.2 (SPSS, 2017). This analysis generated coordinates for two dimensions (Supplementary Table 4). We visualized these data as a scatterplot, with fungal traits connected according to their PIC r coefficients using the software Polinode. We assigned traits to life history strategies based on their relatedness to one another, where traits were proposed to share a life history strategy if their PIC r coefficients were greater than 0.35. A PIC r coefficient of 0.325 or greater indicated a significant relationship (P ≤ 0.05) before correcting for multiple comparisons. The value of 0.35 was chosen to simplify the number of relationships shown on Figure 2 and highlight the proposed life history strategies. This exercise generated three life history strategies, which we named the “Resource Capture,” “Fast Growth,” and “Blended” life history strategies. One trait, α-glucosidase 31, was associated with two life history strategies (Resource Capture and Blended) based on this metric. Since the PIC r coefficient linking α-glucosidase 31 to the Blended life history strategy was larger, we assigned it to this life history strategy.
TABLE 3
| Acid phosphatase | α-Glucosidase 15 | α-Glucosidase 31 | α-Mannanase 76 | Amino acid permease | Ammonium transporter | Amylase 88 | β-Glucan synthase | β-Glucosidase 1 | β-Xylosidase 43 | Cellobiohydrolase 6 | Cellobiohydrolase 7 | Chitinase | Chitosanase 8 | |
| Acid phosphatase | 1 | |||||||||||||
| α-Glucosidase 15 | 0.525 | 1 | ||||||||||||
| α-Glucosidase 31 | 0.066 | 0.469 | 1 | |||||||||||
| α-Mannanase76 | 0.364 | 0.371 | 0.284 | 1 | ||||||||||
| Amino acid permease | 0.096 | –0.105 | –0.086 | –0.032 | 1 | |||||||||
| Ammonium transporter | 0.417 | 0.414 | 0.419 | –0.009 | 0.235 | 1 | ||||||||
| Amylase 88 | 0.095 | 0.192 | 0.314 | 0.098 | 0.314 | 0.198 | 1 | |||||||
| β-Glucan synthase | –0.462 | –0.158 | 0.249 | –0.422 | 0.099 | 0.031 | 0.031 | 1 | ||||||
| β-Glucosidase 1 | –0.012 | 0.259 | 0.272 | –0.077 | 0.113 | 0.171 | 0.481 | 0.209 | 1 | |||||
| β-Xylosidase 43 | 0.020 | 0.068 | 0.509 | 0.332 | 0.020 | –0.048 | 0.334 | 0.226 | 0.338 | 1 | ||||
| Cellobiohydrolase 6 | –0.190 | 0.005 | 0.347 | 0.286 | –0.111 | –0.076 | 0.162 | 0.229 | 0.350 | 0.377 | 1 | |||
| Cellobiohydrolase 7 | –0.283 | 0.178 | 0.426 | 0.147 | –0.053 | –0.097 | 0.339 | 0.386 | 0.512 | 0.569 | 0.757 | 1 | ||
| Chitinase | 0.254 | 0.551 | 0.772 | 0.267 | –0.092 | 0.549 | 0.241 | 0.109 | 0.142 | 0.378 | 0.325 | 0.355 | 1 | |
| Chitosanase 8 | 0.548 | 0.286 | 0.171 | 0.039 | –0.011 | 0.526 | –0.220 | –0.400 | –0.297 | –0.161 | –0.350 | –0.543 | 0.303 | 1 |
| Cold shock protein | 0.310 | 0.525 | 0.248 | –0.060 | –0.034 | 0.577 | –0.094 | 0.082 | –0.115 | –0.183 | 0.064 | –0.046 | 0.474 | 0.552 |
| Crystaline cellulase AA9 | –0.167 | 0.246 | 0.463 | 0.241 | –0.148 | –0.048 | 0.340 | 0.311 | 0.502 | 0.521 | 0.719 | 0.936 | 0.369 | –0.571 |
| Endoglucanase 12 | –0.072 | 0.042 | 0.521 | 0.216 | –0.168 | –0.123 | 0.391 | 0.365 | 0.292 | 0.793 | 0.491 | 0.591 | 0.499 | –0.271 |
| Endoglucanase 9 | 0.139 | 0.433 | 0.070 | 0.322 | –0.231 | 0.030 | –0.033 | –0.297 | 0.076 | –0.061 | 0.092 | –0.008 | 0.033 | 0.036 |
| Glucosidase 81 | 0.366 | 0.426 | 0.198 | –0.066 | 0.069 | 0.605 | –0.085 | 0.132 | –0.039 | –0.205 | –0.105 | –0.164 | 0.483 | 0.463 |
| Glycopeptidase 85 | –0.369 | –0.398 | –0.283 | 0.006 | –0.055 | –0.530 | 0.051 | –0.112 | 0.073 | 0.091 | 0.027 | 0.026 | –0.487 | –0.461 |
| Glycoprotein synthesis 92 | 0.286 | 0.301 | 0.244 | 0.143 | 0.083 | 0.001 | 0.584 | –0.121 | 0.241 | 0.195 | 0.124 | 0.114 | 0.249 | –0.076 |
| Heat shock protein | 0.073 | 0.575 | 0.699 | 0.166 | –0.070 | 0.464 | 0.230 | 0.170 | 0.415 | 0.258 | 0.313 | 0.465 | 0.665 | 0.064 |
| Invertase 32 | 0.230 | –0.079 | 0.186 | 0.250 | –0.208 | –0.045 | 0.092 | –0.417 | –0.036 | 0.286 | –0.118 | –0.235 | 0.092 | 0.338 |
| Lignin peroxidase | 0.038 | 0.105 | 0.226 | –0.118 | 0.020 | 0.210 | 0.393 | 0.394 | 0.487 | 0.300 | 0.261 | 0.488 | 0.175 | –0.498 |
| Maximum growth rate | 0.204 | –0.282 | –0.312 | –0.130 | 0.416 | 0.098 | –0.323 | –0.091 | –0.206 | –0.165 | –0.149 | –0.368 | –0.172 | 0.301 |
| Nitrate transporter | –0.008 | 0.209 | 0.287 | 0.083 | 0.418 | 0.100 | 0.279 | 0.246 | 0.554 | 0.340 | 0.232 | 0.551 | 0.125 | –0.340 |
| Phosphate transporter | 0.410 | 0.042 | 0.040 | 0.398 | 0.285 | 0.042 | 0.012 | –0.234 | –0.116 | 0.433 | –0.095 | –0.046 | 0.094 | 0.245 |
| Trehalase | 0.462 | 0.498 | 0.493 | –0.066 | 0.019 | 0.695 | 0.133 | –0.045 | 0.038 | 0.040 | –0.047 | –0.013 | 0.622 | 0.653 |
| Acid phosphatase | ||||||||||||||
| α-Glucosidase 15 | ||||||||||||||
| α-Glucosidase 31 | ||||||||||||||
| α-Mannanase76 | ||||||||||||||
| Amino acid permease | ||||||||||||||
| Ammonium transporter | ||||||||||||||
| Amylase 88 | ||||||||||||||
| β-Glucan synthase | ||||||||||||||
| β-Glucosidase 1 | ||||||||||||||
| β-Xylosidase 43 | ||||||||||||||
| Cellobiohydrolase 6 | ||||||||||||||
| Cellobiohydrolase 7 | ||||||||||||||
| Chitinase | ||||||||||||||
| Chitosanase 8 | ||||||||||||||
| Cold shock protein | 1 | |||||||||||||
| Crystaline cellulase AA9 | –0.078 | 1 | ||||||||||||
| Endoglucanase 12 | –0.174 | 0.565 | 1 | |||||||||||
| Endoglucanase 9 | 0.293 | 0.075 | –0.226 | 1 | ||||||||||
| Glucosidase 81 | 0.567 | –0.189 | –0.054 | –0.196 | 1 | |||||||||
| Glycopeptidase 85 | –0.535 | 0.050 | 0.009 | 0.417 | –0.821 | 1 | ||||||||
| Glycoprotein synthesis 92 | –0.154 | 0.162 | 0.412 | –0.047 | 0.009 | –0.007 | 1 | |||||||
| Heat shock protein | 0.287 | 0.499 | 0.353 | 0.270 | 0.144 | –0.089 | 0.200 | 1 | ||||||
| Invertase 32 | –0.266 | –0.161 | 0.213 | –0.173 | –0.105 | –0.088 | 0.180 | –0.224 | 1 | |||||
| Lignin peroxidase | –0.060 | 0.620 | 0.308 | 0.078 | 0.020 | 0.108 | 0.092 | 0.306 | –0.302 | 1 | ||||
| Maximum growth rate | 0.174 | –0.430 | –0.432 | –0.007 | 0.061 | –0.004 | –0.323 | –0.460 | 0.016 | –0.231 | 1 | |||
| Nitrate transporter | –0.135 | 0.563 | 0.127 | –0.104 | –0.223 | 0.037 | 0.056 | 0.324 | –0.187 | 0.344 | 0.097 | 1 | ||
| Phosphate transporter | –0.054 | –0.095 | 0.120 | –0.255 | –0.053 | –0.248 | –0.020 | –0.229 | 0.373 | –0.254 | 0.310 | 0.269 | 1 | |
| Trehalase | 0.653 | 0.001 | –0.025 | 0.046 | 0.558 | –0.546 | 0.033 | 0.427 | –0.049 | 0.159 | 0.042 | –0.026 | 0.048 | 1 |
Phylogenetic independent contrast r coefficients for all fungal traits used for non-metric multidimensional scaling analysis.
FIGURE 1
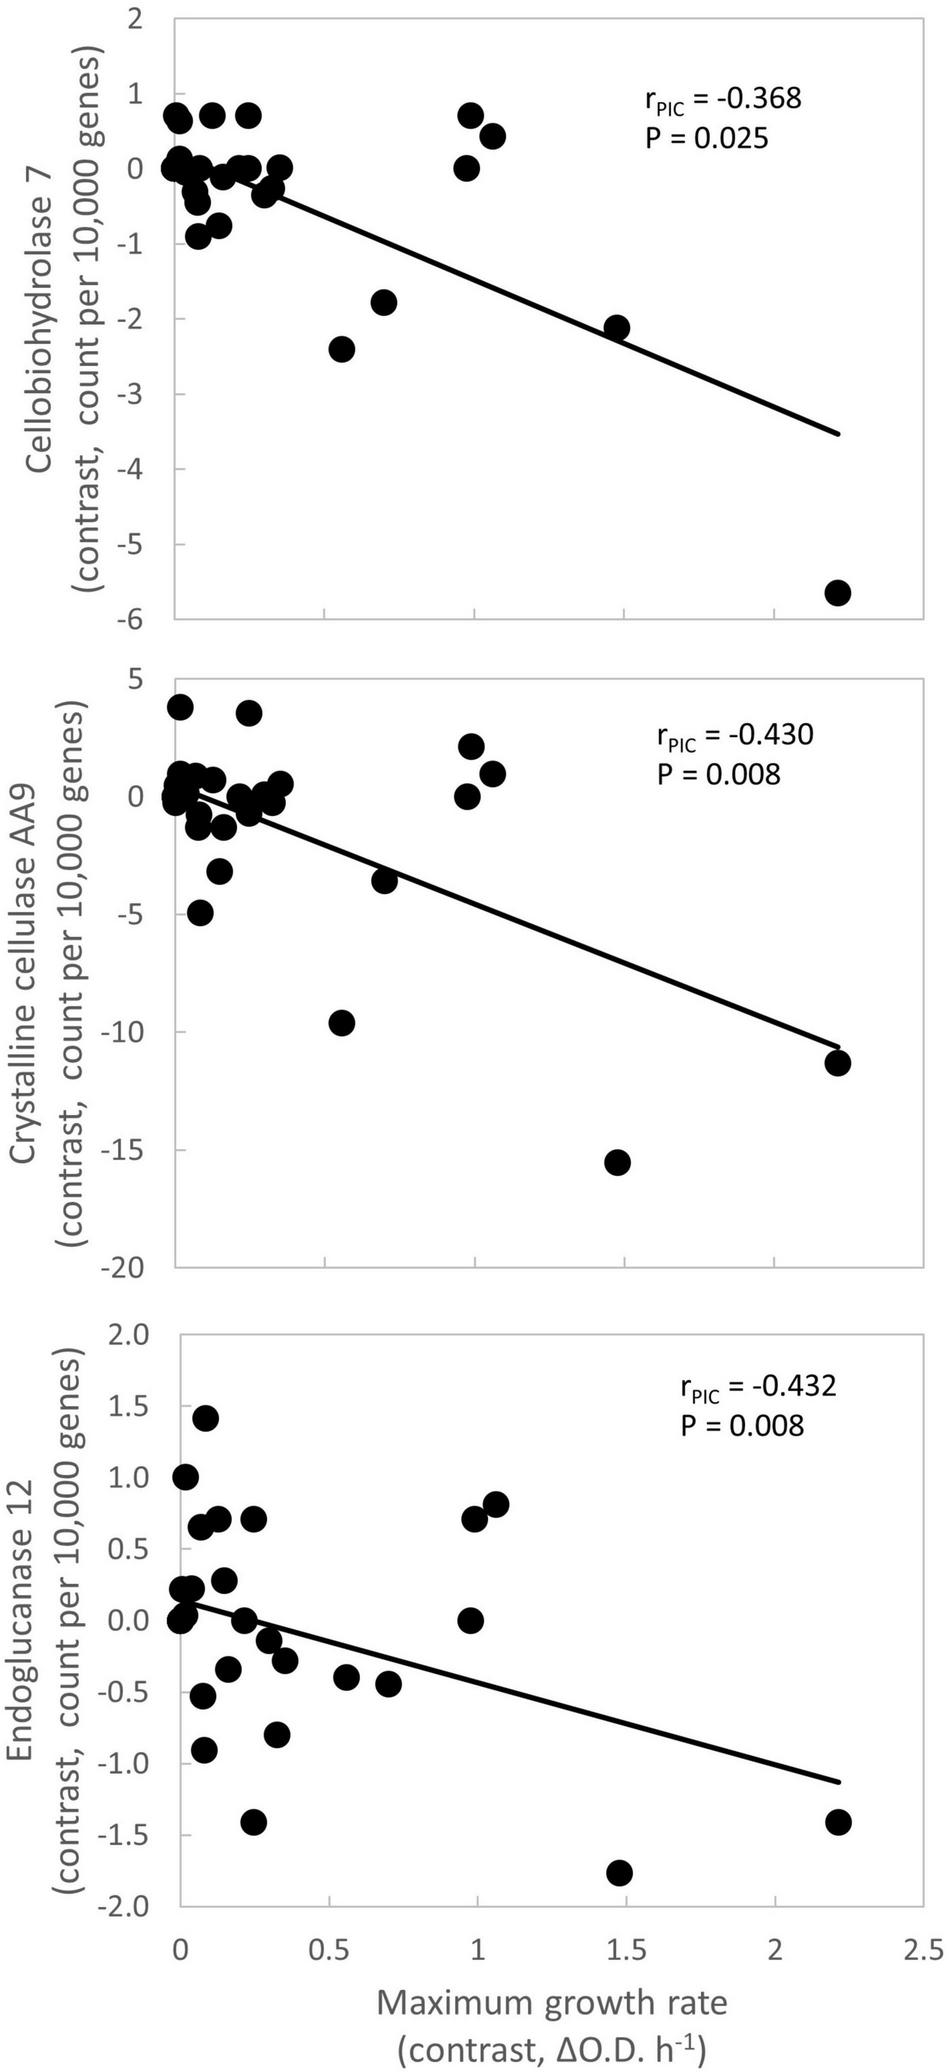
Negative relationships between maximum growth rate and other traits. Each symbol represents an internal node within the phylogeny (Supplementary Figure 1). Each node’s contrast value is the difference in average trait values between its daughter clades. This approach accounts for phylogenetic relatedness of taxa. Lines are best fit. P-values are unadjusted for multiple comparisons. Gene frequency data are from MycoCosm (Grigoriev et al., 2014). ΔO.D. = Increase in optical density at 750 nm.
FIGURE 2
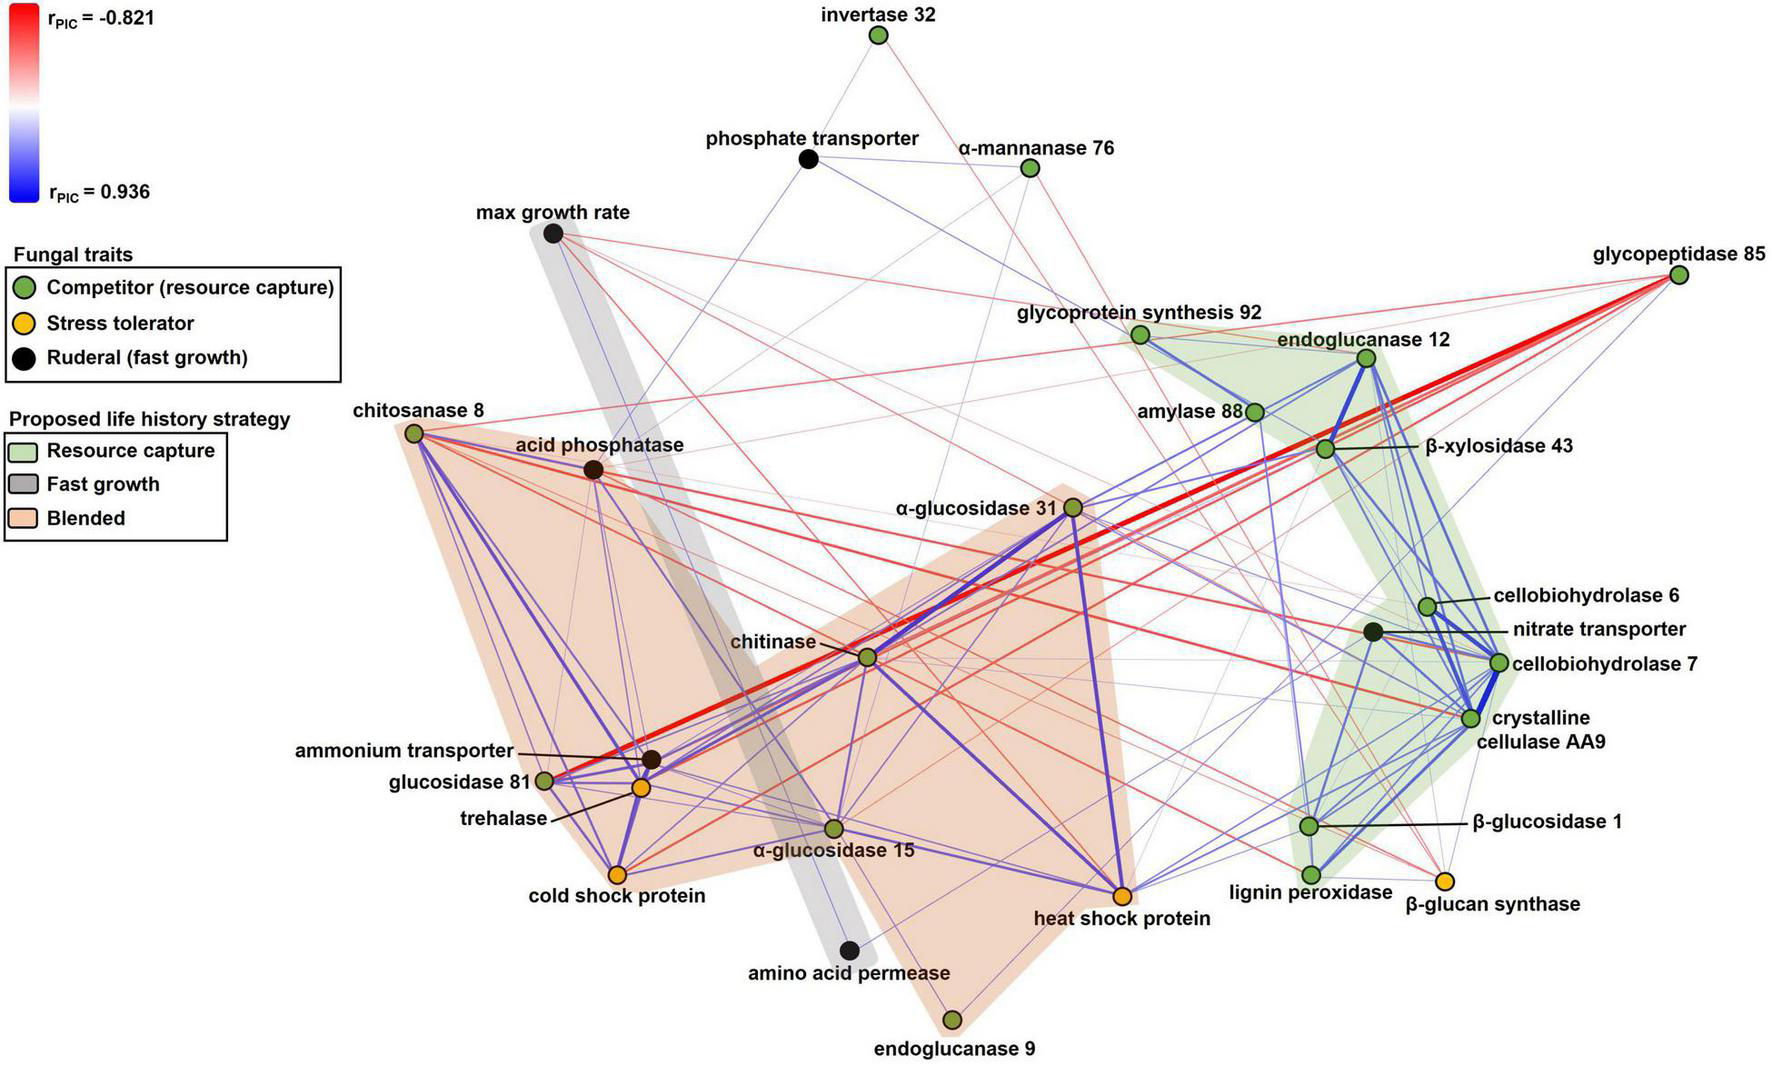
Non-metric multidimensional scaling scatterplot of fungal trait relationships calculated using PIC r coefficients between traits (n = 37). Symbols are traits; traits closer together tended to be more positively related to one another. Positive and negative relationships between traits are denoted by blue or red lines, respectively, with color intensity and thickness of lines proportional to the size of the PIC r coefficient. Trait symbols are colored according to their predicted life history strategies listed in Table 1. Lines corresponding to PIC r coefficients in the range of –0.35 to 0.35 have been excluded for simplicity.
To test if these life history strategies were statistically supported, we conducted a permutational multivariate analyses of variance (perMANOVAs). We used the adonis function in the vegan package (Oksanen et al., 2020) in R version 3.5.1, set to 10,000 permutations (R Core Team, 2020). The dependent variables were the pairwise PIC r coefficients (Table 3), and the independent variable was trait life history strategy. We also conducted a second perMANOVA in which traits had been a priori assigned to C, S, or R life history strategies.
Results
Trade-Offs Between Growth Rate and Other Fungal Traits
The first question of this study was whether fungal growth rate displayed a trade-off with other fungal traits. We predicted that a negative relationship would occur between maximum growth rate and traits related to resource capture or stress tolerance, due to physiological or evolutionary trade-offs. We found that maximum growth rate was negatively related to three resource capture traits: cellobiohydrolase 7 (P = 0.025), crystalline cellulase AA9 (P = 0.008), and endoglucanase 12 (P = 0.008; Figure 1 and Table 3, P-values listed in Supplementary Table 4).
Identification of Fungal Trait Life History Strategies
Our second question was whether relationships among fungal traits have created discrete life history strategies, such as CSR. For these purposes, a suite of traits that tend to co-occur within fungal taxa can represent a life history strategy. Moreover, if a given suite of traits were negatively related to another suite of traits, we would consider those suites to represent distinct life history strategies.
Resource Capture Life History Strategy
Numerous resource capture traits were positively correlated with each other (Table 3), and they clustered in the NMS plot (Figure 2). Extracellular enzymes involved in the breakdown of carbon compounds clustered tightly, including β-xylosidase 43, endoglucanase 12, crystalline cellulase AA9, cellobiohydrolase 6, cellobiohydrolase 7, and lignin peroxidase. Other traits that clustered within this life history strategy include nitrate transporter and the carbon-targeting enzymes β-glucosidase 1, glycoprotein synthesis 92, and amylase 88. In addition, cellobiohydrolase 7, crystalline cellulase AA9, and endoglucanase 12 displayed negative relationships to maximum growth rate (P < 0.05; Table 3). Also, nitrate transporter, crystalline cellulase AA9, cellobiohydrolase 6, cellobiohydrolase 7, and lignin peroxidase displayed negative relationships to chitosanase 8 (P < 0.05; Table 3). Hereafter, we refer to this life history strategy as the “Resource Capture” life history strategy.
Fast Growth Life History Strategy
Maximum growth rate was positively correlated with amino acid permease (P = 0.010; Figure 2 and Table 3). We call this cluster of traits the “Fast Growth” life history strategy. Furthermore, maximum growth rate was negatively related to various traits in the Resource Capture life history strategy, such as cellobiohydrolase 7, crystalline cellulase AA9, and endoglucanase 12 (P < 0.05; Table 3). In addition, maximum growth rate was negatively related to heat shock protein (see below), a trait within the Blended life history strategy (P = 0.004). Together, this suggests that the Fast Growth life history strategy is distinct from both the Resource Capture and Blended life history strategies.
Blended Life History Strategy
The “Blended” life history strategy consists of traits related to resource capture, stress tolerance, and fast growth (Figure 2). We observed a clustering of traits related to resource capture, including α-glucosidase 15, α-glucosidase 31, chitinase, chitosanase 8, endoglucanase 9, and glucosidase 81. In addition, the stress tolerance traits heat shock protein, trehalase, and cold shock protein clustered within this life history strategy. Also, ammonium transporter and acid phosphatase, traits hypothesized to support fast growth, were present within the Blended life history strategy. Furthermore, negative relationships were observed between chitosanase 8 and multiple traits of the Resource Capture life history strategy. Last, both acid phosphatase and chitosanase 8 displayed negative relationships to the stress tolerance trait β 1,3-glucan synthase.
Life History Strategy Sorting
Trait relationships varied significantly among the proposed Resource Capture, Fast Growth, and Blended life history strategies (r2 = 0.179, P < 0.001). This result provided statistical support for this life history framework. In contrast, we did not find statistical support for the CSR framework (r2 = 0.084, P = 0.128).
Discussion
In this study, fast-growing fungal species tended to display less genetic capacity for resource capture (Figure 2 and Table 3). These results support our hypothesis that trade-offs occur among traits associated with growth rate versus resource capture. On the other hand, the lack of negative relationships between growth rate and stress tolerance traits was not consistent with this hypothesis. With respect to life history strategies, we observed clusters of traits that formed putative Fast Growth (maximum growth rate and amino acid permease) and Resource Capture (extracellular enzymes and nutrient transporters) life history strategies (Figure 2). In addition, we identified a Blended life history strategy consisting of traits related to resource capture, stress tolerance, and fast growth. This analysis comparing fungal growth rates to other fungal traits was possible because hundreds of fungal species were grown under common laboratory conditions to produce the Biolog database.
Microbial Trait Frameworks
Our findings share similarities with other publications exploring microbial trait frameworks. The Fast Growth life history strategy in this study was similar to the ruderal (R) strategy in Grime’s CSR framework (Grime, 1977). More recently proposed is the YAS framework, a revised life history theory specifically for microbes (Malik et al., 2020). The competitor (C) strategy in CSR is analogous to the resource acquisition strategy (A) in YAS, which includes traits such as extracellular enzymes and uptake transporters (Malik et al., 2020). The Resource Capture life history strategy in this study aligned with these C and A strategies (Grime, 1977; Malik et al., 2020). Both frameworks share the stress tolerator (S) strategy, which was not evident in this study.
Resource Capture Life History Strategy
Extracellular enzymes, such as endoglucanase, cellobiohydrolase, and β-glucosidase, clustered tightly together within the Resource Capture life history strategy (Figure 2). This result may be explained by the nature of cellulose breakdown by fungi as follows. Cellulose, a major component of the plant cell wall, is a significant source of energy for fungi (Klemm et al., 2005). The extracellular enzymes identified in this life history strategy can break down cellulose into simpler compounds, such as cellobiose and glucose, which may then be taken up and metabolized (Lynd et al., 2002). Cellulases act in a coordinated manner to digest cellulose (Teeri, 1997; Lynd et al., 2002). First, endoglucanases cleave cellulose chains at random internal sites, creating oligosaccharides that vary in length (Lynd et al., 2002). Then, cellobiohydrolases release cellobiose and glucose from the ends of the chains (Lynd et al., 2002). Lastly, β-glucosidases hydrolyze cellobiose to glucose for cellular uptake by fungi (Lynd et al., 2002; Payne et al., 2015). In addition, fungi produce lignin peroxidase to oxidize lignin, thereby gaining access to cellulose, nitrogen, and other nutrients (Tien and Kent Kirk, 1983). Lignin peroxidase was also present in this cluster. It therefore follows that these enzymes would be simultaneously selected to target cellulose and lignin breakdown and constitute a Resource Capture life history strategy.
Unexpectedly, certain traits that were hypothesized to support fast growth, such as nitrate and phosphate transporters, either clustered within the Resource Capture life history strategy or were positively related to traits within the Resource Capture life history strategy (Figure 2). Nitrate and phosphate transporters can acquire nitrogen and phosphorus, respectively, from the environment (Versaw and Metzenberg, 1995; Slot et al., 2007). Nitrogen and phosphorus are essential to support the transcription and protein synthesis involved in extracellular enzyme production (Glenn, 1976), which might explain their affiliation with the Resource Capture life history strategy. Alternately, these genes could encode proteins that “moonlight” by exhibiting other functions in addition to nutrient uptake (Jeffery, 2018).
Fast Growth Life History Strategy
Within the Fast Growth life history strategy, maximum growth rate was positively related to amino acid permease, a transporter involved in the uptake of amino acids from the environment (Figure 2; Nehls et al., 1999). As amino acids are crucial for protein production, this trait may support rapid growth. Since maximum growth rate was negatively related to the resource capture traits cellobiohydrolase 7, crystalline cellular AA9, and endoglucanase 12, the Fast Growth life history strategy seemed separate from the Resource Capture life history strategy (Table 3).
Recently, Ramin and Allison (2019) identified a negative correlation between maximum growth rate and total activity of extracellular enzymes in 49 bacterial strains isolated from leaf litter. They proposed a resource acquisition strategy characterized by bacteria investing heavily in extracellular enzyme production, versus a growth strategy characterized by high growth rates (Ramin and Allison, 2019). These strategies are consistent with our findings of a negative relationship between growth rate and resource capture traits in fungi.
Blended Life History Strategy
Surprisingly, the Blended life history strategy displayed positive relationships between traits associated with resource capture, stress tolerance, and fast growth. This contrasted with our hypothesis that trade-offs would occur between these traits. However, we observed negative relationships indicative of trade-offs between Blended life history strategy traits and other traits. For example, acid phosphatase and chitosanase 8 in the Blended life history strategy displayed negative relationships to β 1,3-glucan synthase, which improves stress tolerance by strengthening cell walls (Shima et al., 2008). Possession of β 1,3-glucan synthase may have been costly for fungi in the Blended life history strategy, possibly explaining the observed trade-off. Or, perhaps this trait was not beneficial for survival of fungi in this life history strategy, as they already possessed other stress tolerance traits, such as trehalase, heat shock protein, and cold shock protein.
Fungal taxa possessing resource capture traits that clustered in the Blended life history strategy may have the capacity to degrade various forms of carbon compounds to support their metabolism. The enzymes chitinase and chitosanase are responsible for the hydrolysis of chitin and chitosan, respectively (Hartl et al., 2012). Chitin is the second most abundant polysaccharide found in nature and is a structural polymer of most fungal cell walls (Bowman and Free, 2006). While these enzymes are involved in the degradation and remodeling of fungal cell walls, they also play a role in exogenous chitin decomposition (Hartl et al., 2012). Interestingly, we observed a negative relationship between chitosanase 8 and four enzymes in the Resource Capture life history strategy involved in cellulose and lignin degradation. In addition, the enzymes α-glucosidase 15 and α-glucosidase 31 hydrolyze starch, while endoglucanase 9 hydrolyzes cellulose. Last, glucosidase 81 is an enzyme responsible for catalyzing the breakdown of β 1,3-glucan, a major component of the fungal cell wall (Reese and Mandels, 1959; Chesters and Bull, 1963). This enzyme can serve a survival function by breaking down and reusing stored β-glucans during periods of carbon limitation (Pitson et al., 1993, Pitson et al., 1997). Therefore, fungi in the Blended life history strategy may have possessed the ability to degrade various sources of carbon including chitin, chitosan, and β-glucans, whereas fungi in the Resource Capture life history strategy possessed enzymes more specialized to target cellulose and lignin to support their carbon metabolism.
As the positive relationships between traits associated with resource capture, stress tolerance, and fast growth in the Blended life history strategy did not support our hypothesis of trade-offs, perhaps investment in these specific traits were not as costly as predicted. Similarly, Alster et al. (2021) did not observe trade-offs between traits associated with growth yield, resource acquisition, and stress tolerance in fungi from a Southern California grassland. A possible explanation may be that fungal taxa within this Blended life history strategy required equal investment in these traits for survival, which is why trade-offs were not observed. As high temperatures can lead to protein misfolding or denaturation, heat shock proteins can facilitate the survival of fungi by assisting with protein folding and stability (Tiwari et al., 2015). Since resource capture enzymes in this life history strategy, such as glucosidases and chitosanase must assume their proper three-dimensional structures to become functional, heat shock proteins may have been particularly advantageous for fungi within the Blended life history strategy. In contrast, it is also possible that resource capture and fast growth traits in this life history strategy were used to support investment in stress tolerance as suggested by Alster et al. (2021). For example, carbon gained through resource capture enzymes and nutrients gained through acid phosphatase and ammonium transporter could be invested toward trehalose production, thereby providing protection from desiccation, freeze damage, or heat shock (Singer and Lindquist, 1998; Schimel et al., 2007). While fungi within the Resource Capture or Fast Growth life history strategies can be thought of as “specialists,” fungi in the Blended life history strategy may be more successful by possessing traits that support varying functions and may therefore be more of “generalists.”
Stress Tolerance Traits
We found little evidence for a Stress Tolerator life history strategy as the stress tolerance traits did not cluster together as hypothesized. It was surprising that other stress tolerance traits were not positively related to one another, as has been observed in other studies (Treseder and Lennon, 2015; Maynard et al., 2019). This might have been due to the differences in fungal species analyzed in this study compared to those prior. For example, the species in this study were essentially a subset of the species analyzed in Treseder and Lennon (2015), while Maynard et al. (2019) included more Basidiomycetes. We were also constrained by which fungal species were present both in the funfun and Biolog databases. It is possible that if we had more species to analyze, stress tolerance traits may have separated from others. In addition, this observation could be due to growth rates being measured under optimal conditions versus low-resource conditions as explained further below. Furthermore, some stress tolerance traits may provide additional functions. For example, while trehalase regulates levels of trehalose that protect against environmental stressors, it can also function to hydrolyze exogenous trehalose as a carbon source (Jorge et al., 1997). Last, genomic markers for stress tolerance in fungi remain largely unclassified. It is therefore possible that we have not targeted the relevant genes for stress tolerance, which may explain why a Stress Tolerator life history strategy was not identified.
Overall
While it can be argued that growth rate in the laboratory may not reflect growth rate in nature, recording growth rate under controlled conditions allows for standardized trait measurements and can improve our understanding of fungal ecology (Aguilar-Trigueros et al., 2015). For example, relative growth rate of plants measured under controlled environmental conditions has proven useful for predicting productivity in the field (Vile et al., 2006). Furthermore, measurements of maximum growth rate in this study occurred under high-resource conditions. Trade-offs may strengthen under low-resource conditions, as fewer resources are available to support multiple traits. Ultimately, collecting fungal trait data from as many contexts as possible will help determine trait plasticity and further our understanding of fungal communities. In addition, we acknowledge that this study examined a relatively small fungal collection of 37 species that are mostly limited to the phylum Ascomycota. We were constrained by (1) fungi that can be cultured in the laboratory and have measured growth rates and (2) the fungal species that have been sequenced and uploaded to the funfun database. As more fungal species are uploaded to the funfun database, we hope to incorporate their gene frequencies with our growth rate data from 653 species to have greater fungal diversity to be analyzed.
Conclusion
We identified trade-offs between fungal traits relating to fast growth and resource capture. These trade-offs led to the identification of three fungal life history strategies: a Fast Growth life history strategy characterized by rapid growth and the amino acid permease gene, a Resource Capture life history strategy encompassed by extracellular enzymes and nutrient transporters, and a Blended life history strategy consisting of traits related to rapid growth, resource capture, and stress tolerance. These relationships between fungal traits may help us predict changes in nutrient cycling under global change (Schimel and Schaeffer, 2012). For example, the frequency of wildfires is expected to increase in response to climate change (An et al., 2015). This frequent disturbance may select for fungi with fast growth rates. These fast-growing fungi might possess a lower capacity for decomposition due to trade-offs. In turn, breakdown of complex carbon compounds may slow, leading to more carbon storage than we might otherwise expect (Holden et al., 2013). Trait-based ecosystem models can incorporate trait linkages like this to improve predictions of ecosystem feedbacks resulting from shifts in microbial communities to a changing environment (Allison, 2012; Allison and Goulden, 2017).
Publisher’s Note
All claims expressed in this article are solely those of the authors and do not necessarily represent those of their affiliated organizations, or those of the publisher, the editors and the reviewers. Any product that may be evaluated in this article, or claim that may be made by its manufacturer, is not guaranteed or endorsed by the publisher.
Statements
Data availability statement
The original contributions presented in the study are included in the article/Supplementary Material, further inquiries can be directed to the corresponding author/s.
Author contributions
KT developed the original concept and obtained the funding. KL collected the growth rate data. KL and KT analyzed the data. KL led the writing of the manuscript with assistance from KT. Both authors contributed to the article and approved the submitted version.
Funding
This study was funded by an NSF Graduate Research Fellowship to KL and grants from NSF (DEB 1912525) and the Department of Energy Office of Biological and Environmental Research (DE-SC0020382) to KT.
Acknowledgments
We thank C. Alster, D. Banuelas, and E. Valdez-Ward for their feedback on earlier versions of this manuscript. We also thank all co-authors of the funfun database: H. Flores-Moreno, W. K. Cornwell, D. S. Maynard, A. M. Milo, K. Abarenkov, M. E. Afkhami, C. A. Aguilar-Trigueros, S. Bates, J. M. Bhatnagar, P. E. Busby, N. Christian, T. W. Crowther, D. Floudas, R. Gazis, D. Hibbett, P. F. Kennedy, D. L. Lindner, R. H. Nilsson, J. Powell, M. Schildhauer, J. Schilling, and A. E. Zanne.
Conflict of interest
The authors declare that the research was conducted in the absence of any commercial or financial relationships that could be construed as a potential conflict of interest.
Supplementary material
The Supplementary Material for this article can be found online at: https://www.frontiersin.org/articles/10.3389/ffgc.2021.756650/full#supplementary-material
References
1
Acharya K. Samui K. Rai M. Dutta B. B. Acharya R. (2004). Antioxidant and nitric oxide synthase activation properties of Auricularia auricula.Indian J. Exp. Biol.42538–540. 10.1146/annurev.py.24.090186.002211
2
Aguilar-Trigueros C. A. Hempel S. Powell J. R. Anderson I. C. Antonovics J. Bergmann J. (2015). Branching out: towards a trait-based understanding of fungal ecology.Fungal Biol. Rev.2934–41. 10.1016/j.fbr.2015.03.001
3
Allison S. D. (2012). A trait-based approach for modelling microbial litter decomposition.Ecol. Lett.151058–1070. 10.1111/j.1461-0248.2012.01807.x
4
Allison S. D. Goulden M. L. (2017). Consequences of drought tolerance traits for microbial decomposition in the DEMENT model.Soil Biol. Biochem.107104–113. 10.1016/j.soilbio.2017.01.001
5
Allison S. D. Lu Y. Weihe C. Goulden M. L. Martiny A. C. Treseder K. K. et al (2013). Microbial abundance and composition influence litter decomposition response to environmental change.Ecology94714–725. 10.1890/12-1243.1
6
Allison S. D. Martiny J. B. H. (2008). Resistance, resilience, and redundancy in microbial communities.Proc. Natl. Acad. Sci. U. S. A.10511512–11519. 10.1073/pnas.0801925105
7
Allison S. D. Vitousek P. M. (2004). Rapid nutrient cycling in leaf litter from invasive plants in Hawai’i.Oecologia141612–619. 10.1007/s00442-004-1679-z
8
Alster C. J. Allison S. D. Glassman S. I. Martiny A. C. Treseder K. K. (2021). Exploring trait trade-offs for fungal decomposers in a Southern California grassland.Front. Microbiol.12:665. 10.3389/fmicb.2021.655987
9
Althouse A. D. (2016). Adjust for multiple comparisons? It’s not that simple.Ann. Thorac. Surg.1011644–1645. 10.1016/j.athoracsur.2015.11.024
10
An H. Gan J. Cho S. J. (2015). Assessing climate change impacts on wildfire risk in the United States.Forests63197–3211. 10.3390/f6093197
11
Biolog. (2017). MicroStation™ System/MicroLog User’s Guide (Version 5.2.01).
12
Boddy L. (2000). Interspecific combative interactions between wood-decaying basidiomycetes.FEMS Microbiol. Ecol.31185–194. 10.1016/S0168-6496(99)00093-8
13
Boddy L. M. Bergès T. Barreau C. Vainstein M. H. Dobson M. J. Ballance D. J. et al (1993). Purification and characterisation of an Aspergillus niger invertase and its DNA sequence.Curr. Genet.2460–66. 10.1007/BF00324666
14
Bowman S. M. Free S. J. (2006). The structure and synthesis of the fungal cell wall.BioEssays28799–808. 10.1002/bies.20441
15
Bradford M. A. Wieder W. R. Bonan G. B. Fierer N. Raymond P. A. Crowther T. W. (2016). Managing uncertainty in soil carbon feedbacks to climate change.Nat. Clim. Chang.6751–758. 10.1038/nclimate3071
16
Cappellazzo G. Lanfranco L. Fitz M. Wipf D. Bonfante P. (2008). Characterization of an amino acid permease from the endomycorrhizal fungus Glomus mosseae.Plant Physiol.147429–437. 10.1104/pp.108.117820
17
Caraco N. F. Cole J. J. Raymond P. A. Strayer D. L. Pace M. L. Findlay S. E. G. et al (1997). Zebra mussel invasion in a large, turbid river: phytoplankton response to increased grazing.Ecology78588–602. 10.1890/0012-96581997078[0588:ZMIIAL]2.0.CO;2
18
Chesters C. G. Bull A. T. (1963). The enzymic degradation of laminarin. 1. The distribution of laminarinase among micro-organisms.Biochem. J.8628–31. 10.1042/bj0860028
19
Choi J. (2020). Feature Frequency Profile (FFP). Available online at: https://github.com/jaejinchoi/FFP(accessed December 3, 2020).
20
Choi J. J. Kim S.-H. (2017). A genome tree of life for the fungi kingdom.Proc. Natl. Acad. Sci. U. S. A.1149391–9396. 10.1073/pnas.1711939114
21
Cox R. A. (2003). Correlation of the rate of protein synthesis and the third power of the RNA: protein ratio in Escherichia coli and Mycobacterium tuberculosis.Microbiology149729–737. 10.1099/mic.0.25645-0
22
Crowther T. W. Maynard D. S. Crowther T. R. Peccia J. Smith J. R. Bradford M. A. (2014). Untangling the fungal niche: the trait-based approach.Front. Microbiol.5:579. 10.3389/fmicb.2014.00579
23
Dighton J. (2003). Fungi in Ecosystem Processes. In Fungi in ecosystem processes (1st ed.).New York: Marcel Dekker. 10.1201/9780824742447
24
Elser J. J. Dobberfuhl D. R. MacKay N. A. Schampel J. H. (1996). Organism size, life-history, and N:P stoichiometry - Toward a unified view of cellular and ecosystem processes.Bioscience46674–684. 10.2307/1312897
25
Feise R. J. (2002). Do multiple outcome measures require p-value adjustment?.BMC Med. Res. Methodol.2:8. 10.1186/1471-2288-2-8
26
Fierer N. (2017). Embracing the unknown: disentangling the complexities of the soil microbiome.Nat. Rev. Microbiol.15579–590. 10.1038/nrmicro.2017.87
27
Flores-Moreno H. Treseder K. K. Cornwell W. K. Maynard D. S. Milo A. M. Abarenkov K. et al (2018). Fungaltraits aka funfun: a dynamic functional trait database for the world’s fungi. Available online at: https://github.com/traitecoevo/fungaltraits(accessed January 25, 2019).
28
Ganesan S. Nellaiappan O. G. (2014). Evaluation and Selection of native fungal isolates for cellulase enzyme production.Res. J. Biotechnol.922–29.
29
Glenn A. R. (1976). Production of extracellular proteins by bacteria.Annu. Rev. Microbiol.3041–62. 10.1146/annurev.mi.30.100176.000353
30
Grigoriev I. V. Nikitin R. Haridas S. Kuo A. Ohm R. Otillar R. et al (2014). MycoCosm portal: gearing up for 1000 fungal genomes.Nucleic Acids Res.42D669–D704. 10.1093/nar/gkt1183
31
Grime J. P. (1977). Evidence for the existence of three primary strategies in plants and its relevance to ecological and evolutionary theory.Am. Nat.1111169–1194. 10.1086/283244
32
Han S. W. Nahas E. Rossi A. (1987). Regulation of synthesis and secretion of acid and alkaline phosphatases in Neurospora crassa.Curr. Genet.11521–527. 10.1007/BF00384615
33
Hartl L. Zach S. Seidl-Seiboth V. (2012). Fungal chitinases: diversity, mechanistic properties and biotechnological potential.Appl. Microbiol. Biotechnol.93533–543. 10.1007/s00253-011-3723-3
34
Ho A. Kerckhof F. M. Luke C. Reim A. Krause S. Boon N. et al (2013). Conceptualizing functional traits and ecological characteristics of methane-oxidizing bacteria as life strategies.Environ. Microbiol. Rep.5335–345. 10.1111/j.1758-2229.2012.00370.x
35
Holden S. R. Gutierrez A. Treseder K. K. (2013). Changes in soil fungal communities, extracellular enzyme activities, and litter decomposition across a fire chronosequence in Alaskan boreal forests.Ecosystems1634–46. 10.1007/s10021-012-9594-3
36
Homma T. Iwahashi H. Komatsu Y. (2003). Yeast gene expression during growth at low temperature.Cryobiology46230–237. 10.1016/S0011-2240(03)00028-2
37
Hu M. L. Zha J. He L. W. Lv Y. J. Shen M. H. Zhong C. et al (2016). Enhanced bioconversion of cellobiose by industrial Saccharomyces cerevisiae used for cellulose utilization.Front. Microbiol.7:241. 10.3389/fmicb.2016.00241
38
Huang Y. Higuchi Y. Kinoshita T. Mitani A. Eshima Y. Takegawa K. (2018). Characterization of novel endo-β-N-acetylglucosaminidases from Sphingobacterium species, Beauveria bassiana and Cordyceps militaris that specifically hydrolyze fucose-containing oligosaccharides and human IgG.Sci. Rep.8:246. 10.1038/s41598-017-17467-y
39
Ilmén M. Saloheimo A. Onnela M. L. Penttilä M. E. (1997). Regulation of cellulase gene expression in the filamentous fungus Trichoderma reesei.Appl.Environ. Microbiol.631298–1306. 10.1128/aem.63.4.1298-1306.1997
40
Jeffery C. J. (2018). Protein moonlighting: what is it, and why is it important?.Philos. Trans. R. Soc. B Biol. Sci.373:1738. 10.1098/rstb.2016.0523
41
Jorge J. A. Polizeli M. L. Thevelein J. M. Terenzi H. F. (1997). Trehalases and trehalose hydrolysis in fungi.FEMS Microbiol. Lett.154165–171. 10.1016/S0378-1097(97)00332-7
42
Klemm D. Heublein B. Fink H. P. Bohn A. (2005). Cellulose: fascinating biopolymer and sustainable raw material.Angew. Chem. Int. Ed.443358–3393. 10.1002/anie.200460587
43
Korman D. R. Bayliss F. T. Barnett C. C. Carmona C. L. Kodama K. H. Royer T. J. et al (1990). Cloning, characterization, and expression of two α-amylase genes from Aspergillus niger var. awamori.Curr. Genet.17203–212. 10.1007/BF00312611
44
Krause S. Le Roux X. Niklaus P. A. van Bodegom P. M. Lennon T. J. T. Bertilsson S. et al (2014). Trait-based approaches for understanding microbial biodiversity and ecosystem functioning.Front. Microbiol.5:251. 10.3389/fmicb.2014.00251
45
Lamoth F. Juvvadi P. R. Fortwendel J. R. Steinbach W. J. (2012). Heat shock protein 90 is required for conidiation and cell wall integrity in Aspergillus fumigatus.Eukaryot. Cell111324–1332. 10.1128/EC.00032-12
46
Langston J. A. Shaghasi T. Abbate E. Xu F. Vlasenko E. Sweeney M. D. (2011). Oxidoreductive cellulose depolymerization by the enzymes cellobiose dehydrogenase and glycoside hydrolase 61.Appl. Environ. Microbiol.777007–7015. 10.1128/AEM.05815-11
47
Langvad F. (1999). A rapid and efficient method for growth measurement of filamentous fungi.J. Microbiol. Methods3797–100. 10.1016/S0167-7012(99)00053-6
48
Lovett G. M. Canham C. D. Arthur M. A. Weathers K. C. Fitzhugh R. D. (2006). Forest ecosystem responses to exotic pests and pathogens in eastern North America.Bioscience56395–405. 10.1641/0006-3568(2006)056[0395:FERTEP]2.0.CO;2
49
Lynd L. R. Weimer P. J. van Zyl W. H. Pretorius I. S. (2002). Microbial cellulose utilization: fundamentals and biotechnology.Microbiol. Mol. Biol. Rev.66506–577. 10.1128/mmbr.66.3.506-577.2002
50
Malik A. A. Martiny J. B. H. Brodie E. L. Martiny A. C. Treseder K. K. Allison S. D. (2020). Defining trait-based microbial strategies with consequences for soil carbon cycling under climate change.ISME J.141–9. 10.1038/s41396-019-0510-0
51
Martínez Á. T. Ruiz-Dueñas F. J. Martínez M. J. del Río J. C. Gutiérrez A. (2009). Enzymatic delignification of plant cell wall: from nature to mill.Curr. Opin. Biotechnol.20348–357. 10.1016/j.copbio.2009.05.002
52
Maruyama Y. Nakajima T. Ichishima E. (1994). A 1,2-α-d-mannosidase from a bacillus sp.: purification, characterization, and mode of action.Carbohydr. Res.25189–98. 10.1016/0008-6215(94)84278-7
53
Maynard D. S. Bradford M. A. Covey K. R. Lindner D. Glaeser J. Talbert D. A. et al (2019). Consistent trade-offs in fungal trait expression across broad spatial scales.Nat. Microbiol.4846–853. 10.1038/s41564-019-0361-5
54
Mazur P. Morin N. Baginsky W. el-Sherbeini M. Clemas J. A. Nielsen J. B. et al (1995). Differential expression and function of two homologous subunits of yeast 1,3-beta-D-glucan synthase.Mol. Cell. Biol.155671–5681. 10.1128/mcb.15.10.5671
55
McGill B. J. Enquist B. J. Weiher E. Westoby M. (2006). Rebuilding community ecology from functional traits.Trends Ecol. Evol.21178–185. 10.1016/j.tree.2006.02.002
56
Meletiadis J. Meis J. F. G. M. Mouton J. W. Verweij P. E. (2001). Analysis of growth characteristics of filamentous fungi in different nutrient media.J. Clin. Microbiol.39478–484. 10.1128/JCM.39.2.478-484.2001
57
Mitsuzawa H. (2006). Ammonium transporter genes in the fission yeast Schizosaccharomyces pombe: role in ammonium uptake and a morphological transition.Genes Cells111183–1195. 10.1111/j.1365-2443.2006.01014.x
58
Murata Y. Homma T. Kitagawa E. Momose Y. Sato M. S. Odani M. et al (2006). Genome-wide expression analysis of yeast response during exposure to 4°C.Extremophiles10117–128. 10.1007/s00792-005-0480-1
59
Myrold D. D. Zeglin L. H. Jansson J. K. (2014). The potential of metagenomic approaches for understanding soil microbial processes.Soil Sci. Soc. Am. J.783–10. 10.2136/sssaj2013.07.0287dgs
60
Nakajima T. Maitra S. K. Ballou C. E. (1976). An endo α1 → 6 D mannanase from a soil bacterium. Purification, properties, and mode of action.J. Biol. Chem.251174–181. 10.1016/S0021-9258(17)33942-X
61
Nakamura A. Nishimura I. Yokoyama A. Lee D. G. Hidaka M. Masaki H. et al (1997). Cloning and sequencing of an α-glucosidase gene from Aspergillus niger and its expression in A. nidulans.J. Biotechnol.5375–84. 10.1016/S0168-1656(97)01664-7
62
Nehls U. Kleber R. Wiese J. Hampp R. (1999). Isolation and characterization of a general amino acid permease from the ectomycorrhizal fungus Amanita muscaria.New Phytol.144343–349. 10.1046/j.1469-8137.1999.00513.x
63
Nelson R. E. Lehman J. F. Metzenberg R. L. (1976). Regulation of phosphate metabolism in Neurospora crassa: identification of the structural gene for repressible acid phosphatase.Genetics84183–192.
64
Oksanen J. Blanchet F. G. Friendly M. Kindt R. Legendre P. McGlinn D. et al (2020). Vegan Community Ecology Package Version 2.5-7. Available online at: https://cran.r-project.org/web/packages/vegan/index.html(accessed October 15, 2021).
65
Payne C. M. Knott B. C. Mayes H. B. Hansson H. Himmel M. E. Sandgren M. et al (2015). Fungal cellulases.Chem. Rev.1151308–1448. 10.1021/cr500351c
66
Perneger T. V. (1998). What’s wrong with Bonferroni adjustments.Br. Med. J.3161236–1238. 10.1136/bmj.316.7139.1236
67
Pitson S. M. Seviour R. J. McDougall B. M. (1993). Noncellulolytic fungal β-glucanases: their physiology and regulation.Enzyme Microb. Technol.15178–192. 10.1016/0141-0229(93)90136-P
68
Pitson S. M. Seviour R. J. McDougall B. M. (1997). Effect of carbon source on extracellular and (1→3)- and (1→6)-β- glucanase production by Acremonium persicinum.Can. J. Microbiol.43432–439. 10.1139/m97-061
69
Pugh G. J. F. (1980). Strategies in fungal ecology.Trans. Br. Mycol. Soc.75IN1–IN14. 10.1016/s0007-1536(80)80188-4
70
Pugh G. J. F. Boddy L. (1988). A view of disturbance and life strategies in fungi.Proc. R. Soc. Edinb. B. Biol. Sci.943–11. 10.1017/s0269727000007053
71
Ramin K. I. Allison S. D. (2019). Bacterial tradeoffs in growth rate and extracellular enzymes.Front. Microbiol.10:2956. 10.3389/fmicb.2019.02956
72
R Core Team (2020). R: A language and environment for statistical computing.Vienna: R Foundation for Statistical Computing.
73
Reese E. T. Mandels M. (1959). Beta-D-1, 3 glucanases in fungi.Can. J. Microbiol.5173–185. 10.1139/m59-022
74
Ricklefs R. E. Starck J. M. (1996). Applications of Phylogenetically Independent Contrasts: a Mixed Progress Report.Oikos77:167. 10.2307/3545598
75
Rothman K. J. (1990). No adjustments are needed for multiple comparisons.Epidemiology143–46. 10.1097/00001648-199001000-00010
76
Ruiz-Dueñas F. J. Morales M. García E. Miki Y. Martínez M. J. Martínez A. T. (2009). Substrate oxidation sites in versatile peroxidase and other basidiomycete peroxidases.J. Exp. Bot.60441–452. 10.1093/jxb/ern261
77
Rungrattanakasin B. Premjet S. Thanonkeo S. Klanrit P. Thanonkeo P. (2018). Cloning and expression of an endoglucanase gene from the thermotolerant fungus Aspergillus fumigatus DBiNU-1 in Kluyveromyces lactis.Braz. J. Microbiol.49647–655. 10.1016/j.bjm.2017.10.001
78
Schimel J. Balser T. C. Wallenstein M. (2007). Microbial stress-response physiology and its implications for ecosystem function.Ecology881386–1394. 10.1890/06-0219
79
Schimel J. P. Schaeffer S. M. (2012). Microbial control over carbon cycling in soil.Front. Microbiol.3:348. 10.3389/fmicb.2012.00348
80
Scott M. Klumpp S. Mateescu E. M. Hwa T. (2014). Emergence of robust growth laws from optimal regulation of ribosome synthesis.Mol. Syst. Biol.10:747. 10.15252/msb.20145379
81
Seidl V. Huemer B. Seiboth B. Kubicek C. P. (2005). A complete survey of Trichoderma chitinases reveals three distinct subgroups of family 18 chitinases.FEBS J.2725923–5939. 10.1111/j.1742-4658.2005.04994.x
82
Semenova M. V. Drachevskaya M. I. Sinitsyna O. A. Gusakov A. V. Sinitsyn A. P. (2009). Isolation and properties of extracellular β-xylosidases from fungi Aspergillus japonicus and Trichoderma reesei.Biochemistry741002–1008. 10.1134/S0006297909090089
83
Sengottaiyan P. Ruiz-Pavõn L. Persson B. L. (2013). Functional expression, purification and reconstitution of the recombinant phosphate transporter Pho89 of Saccharomyces cerevisiae.FEBS J.280965–975. 10.1111/febs.12090
84
Shima J. Ando A. Takagi H. (2008). Possible roles of vacuolar H+-ATPase and mitochondrial function in tolerance to air-drying stress revealed by genome-wide screening of Saccharomyces cerevisiae deletion strains.Yeast25179–190. 10.1002/yea.1577
85
Shimosaka M. Nogawa M. Ohno Y. Okazaki M. (1993). Chitosanase from the plant pathogenic fungus, Fusarium solani f. sp. phaseoli—Purification and some properties.Biosci. Biotechnol. Biochem.57231–235. 10.1271/bbb.57.231
86
Siletti C. E. Zeiner C. A. Bhatnagar J. M. (2017). Distributions of fungal melanin across species and soils.Soil Biol. Biochem.113285–293. 10.1016/j.soilbio.2017.05.030
87
Singer M. A. Lindquist S. (1998). Thermotolerance in Saccharomyces cerevisiae: the Yin and Yang of trehalose.Trends Biotechnol.16460–468. 10.1016/S0167-7799(98)01251-7
88
Slot J. C. Hallstrom K. N. Matheny P. B. Hibbett D. S. (2007). Diversification of NRT2 and the origin of its fungal homolog.Mol. Biol. Evol.241731–1743. 10.1093/molbev/msm098
89
SPSS (2017). Systat (13.2).San Jose, SA: Systat Software, Inc.
90
Teeri T. T. (1997). Crystalline cellulose degradation: new insight into the function of cellobiohydrolases.Trends. Biotechnol.15160–167. 10.1016/S0167-7799(97)01032-9
91
Tien M. Kent Kirk T. (1983). Lignin-degrading enzyme from the hymenomycete Phanerochaete chrysasporium burds.Science221661–663. 10.1126/science.221.4611.661
92
Tiwari S. Thakur R. Shankar J. (2015). Role of heat-shock proteins in cellular function and in the biology of fungi.Biotechnol. Res. Int.2015:132635. 10.1155/2015/132635
93
Treseder K. K. Lennon J. T. (2015). Fungal traits that drive ecosystem dynamics on land.Microbiol. Mol. Biol. Rev.79243–262. 10.1128/mmbr.00001-15
94
Versaw W. K. Metzenberg R. L. (1995). Repressible cation-phosphate symporters in Neurospora crassa.Proc. Natl. Acad. Sci. U. S. A.923884–3887. 10.1073/pnas.92.9.3884
95
Vile D. Shipley B. Garnier E. (2006). Ecosystem productivity can be predicted from potential relative growth rate and species abundance.Ecol. Lett.91061–1067. 10.1111/j.1461-0248.2006.00958.x
96
Wallenstein M. D. Hall E. K. (2012). A trait-based framework for predicting when and where microbial adaptation to climate change will affect ecosystem functioning.Biogeochemistry10935–47. 10.1007/s10533-011-9641-8
97
Warren C. R. (2014). Response of osmolytes in soil to drying and rewetting.Soil Biol. Biochem.7022–32. 10.1016/j.soilbio.2013.12.008
98
Webb C. O. Ackerly D. D. Kembel S. W. (2008). Phylocom: software for the analysis of phylogenetic community structure and trait evolution.Bioinformatics242098–2100. 10.1093/bioinformatics/btn358
99
Webb C. O. Ackerly D. D. McPeek M. A. Donoghue M. J. (2002). Phylogenies and community ecology.Annu. Rev. Ecol. Syst.33475–505. 10.1146/annurev.ecolsys.33.010802.150448
100
Wilmes P. Bond P. L. (2006). Metaproteomics: studying functional gene expression in microbial ecosystems.Trends Microbiol.1492–97. 10.1016/j.tim.2005.12.006
101
Wipf D. Benjdia M. Tegeder M. Frommer W. B. (2002). Characterization of a general amino acid permease from Hebeloma cylindrosporum.FEBS Lett.528119–124. 10.1016/S0014-5793(02)03271-4
102
Wood J. L. Tang C. Franks A. E. (2018). Competitive traits are more important than stress-tolerance traits in a cadmium-contaminated rhizosphere: a role for trait theory in microbial ecology.Front. Microbiol.9:121. 10.3389/fmicb.2018.00121
103
Znameroski E. A. Coradetti S. T. Roche C. M. Tsai J. C. Iavarone A. T. Cate J. H. D. et al (2012). Induction of lignocellulose-degrading enzymes in Neurospora crassa by cellodextrins.Proc. Natl. Acad. Sci. U. S. A.1096012–6017. 10.1073/pnas.1118440109
Summary
Keywords
ecosystem function, CSR framework, YAS framework, life history strategy, maximum growth rate, trade-offs, fungal traits
Citation
Lovero KG and Treseder KK (2021) Trade-Offs Between Growth Rate and Other Fungal Traits. Front. For. Glob. Change 4:756650. doi: 10.3389/ffgc.2021.756650
Received
10 August 2021
Accepted
09 November 2021
Published
30 November 2021
Volume
4 - 2021
Edited by
Mark A. Anthony, ETH Zürich, Switzerland
Reviewed by
Adam Trautwig, University of Massachusetts Amherst, United States; Chao Wang, Institute of Applied Ecology, Chinese Academy of Sciences (CAS), China
Updates
Copyright
© 2021 Lovero and Treseder.
This is an open-access article distributed under the terms of the Creative Commons Attribution License (CC BY). The use, distribution or reproduction in other forums is permitted, provided the original author(s) and the copyright owner(s) are credited and that the original publication in this journal is cited, in accordance with accepted academic practice. No use, distribution or reproduction is permitted which does not comply with these terms.
*Correspondence: Karissa G. Lovero, kmgalleg@uci.edu
This article was submitted to Forest Soils, a section of the journal Frontiers in Forests and Global Change
Disclaimer
All claims expressed in this article are solely those of the authors and do not necessarily represent those of their affiliated organizations, or those of the publisher, the editors and the reviewers. Any product that may be evaluated in this article or claim that may be made by its manufacturer is not guaranteed or endorsed by the publisher.