 Shin Ugawa
 Shoji Hashimoto2
 Mitsutoshi Kitao
- 1Faculty of Agriculture, Kagoshima University, Kagoshima, Japan
- 2Department of Forest Soils, Forestry and Forest Products Research Institute, Tsukuba, Japan
- 3Department of Forest Resource Chemistry, Forestry and Forest Products Research Institute, Tsukuba, Japan
- 4Department of Plant Ecology, Forestry and Forest Products Research Institute, Tsukuba, Japan
- 5Hokkaido Research Center, Forestry and Forest Products Research Institute, Sapporo, Japan
In this study, we examined the composition of organic constituents of stem woody tissue together with tree growth in Quercus mongolica var. grosseserrata Blume seedlings raised under controlled CO2 and/or O3 concentrations in a Free-Air Concentration Enrichment system. After exposure to ambient air (control), elevated CO2 concentration (550 μmol mol–1 CO2), elevated O3 concentration (double that of the control), and a combination of elevated CO2 and O3 concentrations during a growing season, we measured the diameter and length of stem, and biomass of sampled seedlings and quantified the lignin, extractive, and holocellulose contents of the woody tissue of current-year stems. We confirmed that the growth of seedlings was enhanced under an elevated CO2 concentration condition. In line with this, the extractive content was lower in woody tissue formed under an elevated CO2 concentration than that formed under ambient air, whereas holocellulose content showed an inverse pattern. Elevated O3 concentration itself did not change the organic constituents of the woody tissue, but it reduced the influence of an elevated CO2 concentration. We thus assume that Q. mongolica formed woody tissue with a low extractive content under the high CO2 concentration condition, although this response was possibly mitigated by an elevated O3 concentration. Extractives contains antimicrobial components such as tannins, flavonoids, quinones, and terpenoids. The decrease in extractives within the widely distributed Q. mongolica in East Asia may have a non-negligible impact on C cycling in the future earth with high atmospheric CO2 concentration.
Introduction
Emissions of atmospheric carbon dioxide (CO2) and tropospheric ozone (O3) have been increasing because of anthropogenic activities (e.g., IPCC, 2013; Ainsworth et al., 2020; Takahashi et al., 2020). Elevated atmospheric CO2 and O3 concentrations can influence forest productivity (Agathokleous et al., 2020; Ainsworth et al., 2020), and further impacts on carbon (C) cycling in forest ecosystems have been investigated. Many studies have demonstrated that elevated CO2 concentrations enhance the rate of photosynthesis and the biomass growth of trees (e.g., Zak et al., 2011; Walker et al., 2019), although photosynthetic downregulation has also been observed with long-term exposure to elevated CO2 concentrations (e.g., Norby et al., 2010; Sigurdsson et al., 2013). As for elevated O3 concentrations, previous research has reported that it leads to a reduction of the rate of photosynthesis, acceleration of leaf senescence, increases in dark respiration, and changes in C allocation for seedlings and/or adult trees (e.g., Matyssek et al., 2010; Watanabe et al., 2013, 2018; Kitao et al., 2015, 2021; Yamaguchi et al., 2019).
Elevated CO2 and/or O3 concentrations may influence C cycling via the decomposition of organic matter. Organic matter is decomposed via a process of leaching, fragmentation, and chemical alteration. The chemical alteration is regulated by not only decomposer and environmental factors but also organic matter quality, which is partly determined by the composition of organic carbon-based compounds (Chapin et al., 2011). Elevated CO2 and O3 concentrations change the composition of the organic constituents of tree leaves (e.g., Oksanen et al., 2005; Chen et al., 2015) and leaf litter (e.g., Kasurinen et al., 2006; Parsons et al., 2008). Additional research has reported that leaf and leaf litter changes influence decomposition rates (e.g., Kasurinen et al., 2006, 2017; Parsons et al., 2008). This effect may also be present in other tissues. Organic composition changes under elevated CO2 and/or O3 concentrations have also been detected in woody tissue (Kaakinen et al., 2004; Mattson et al., 2005; Luo et al., 2008; Luo and Polle, 2009; Richet et al., 2012), which constitutes a large C pool in the form of woody debris and dead wood in forest ecosystems (Aalde et al., 2006). Thus, studying the organic composition of woody tissues formed under elevated CO2 and/or O3 concentrations provides important insight into understanding their impact on C cycling in forest ecosystems.
In terms of decomposition, the organic constituents of woody tissue can be divided into lignin, extractives, and holocellulose; among these constituents, lignin and extractives are strongly related to organic decomposition (Taylor et al., 2002; Oliveira et al., 2010) as determinants of organic matter quality (Chapin et al., 2011). Lignin is a structural component, constituting 18–35% of woody tissue (Pettersen, 1984). The lignin content of woody tissue formed under elevated CO2 concentrations increases in hybrid poplars, Populus × euramericana and Populus tremula × alba (Luo and Polle, 2009; Richet et al., 2012), but does not change in other tree species (Luo et al., 2008). Similarly, elevated O3 concentrations increase the lignin content in some tree species (Kaakinen et al., 2004; Richet et al., 2011, 2012). Extractives are non-structural components consisting of various compounds, such as tannins, flavonoids, quinones, and terpenoids, which are related to the durability of wood against fungi and termites (Taylor et al., 2006; Oliveira et al., 2010; Santana et al., 2010). Under elevated CO2 concentrations, extractive contents have been shown to either not change (Kaakinen et al., 2004) or increase in Betula pendula (Kostiainen et al., 2006, 2008); however, elevated O3 concentrations have been shown to decrease the extractive content of Populus tremuloides (Kostiainen et al., 2008), have no effect on Acer saccharum (Kaakinen et al., 2004), and increase the extractive content of Betula papyrifera (Kostiainen et al., 2008). Holocellulose consists of structural components (i.e., cellulose and hemicellulose) and accounts for 65–75% of woody tissue (Pettersen, 1984). Elevated CO2 concentrations decrease the cellulose and hemicellulose contents in Betula species (Kaakinen et al., 2004; Kostiainen et al., 2006), although smaller changes have been observed in other tree species (Kaakinen et al., 2004; Kostiainen et al., 2008). Elevated O3 concentrations do not affect the contents of cellulose and hemicellulose (Kaakinen et al., 2004; Kostiainen et al., 2006, 2008). Thus, for some species, recalcitrant lignin, antimicrobial extractive such as tannins, flavonoids, quinones, and terpenoids (Valette et al., 2017; Broda, 2020), and holocellulose contents may change in response to elevated CO2 and/or O3 concentrations.
Quercus mongolica var. crispula is a representative deciduous broadleaf tree species in the temperate zone of East Asia (Menitsky, 2005). Thus, the response of Q. mongolica to elevated CO2 and/or O3 concentrations may have an impact on a wide range of the temperate forest in this area. In response to elevated CO2 and/or O3 concentrations, this species is tolerant to high O3 concentrations (Yamaguchi et al., 2011) and changes the mineral composition of its leaves under elevated CO2 and O3 concentrations (Shi et al., 2016). However, the influence of elevated CO2 and/or O3 concentrations on the organic composition of its woody tissue remains unknown.
In this study, we aimed to clarify whether elevated CO2 and/or O3 concentrations induce a change in the composition of organic carbon-based compounds of Q. mongolica woody tissue. To achieve this objective, we evaluated the growth of seedlings and analyzed the organic constituents of the stem woody tissue of Q. mongolica seedlings grown over 180 days under controlled CO2 and/or O3 concentrations in Free-Air Concentration Enrichment (FACE) systems. In the FACE system of seedling scale, there is a threat that seedlings raised under elevated CO2 concentration grow rapidly and exceed the height of the FACE system. On the other hand, the stem growth of seedlings was changed under elevated O3 concentrations during one growing season for deciduous broadleaf tree species (Matsumura et al., 1998). Thus, we adopted one growing season as the experimental period of this study and used the current-year stem formed under treatments for analyzing the organic constituents.
Materials and Methods
Plant Materials
This study used 2-year-old Q. mongolica seedlings. The ecological characteristics of Q. mongolica are well known: frequent sprout formation (Sakai and Sakai, 1998), moderate shade tolerance (Higo, 1994), occurrence in mid-successional stage forests (Higo, 1994), and flush and succeeding-type leaf emergence (Kikuzawa, 1983). On March 4, 2011, Q. mongolica seedlings were planted in the nursery (soil pH ≈5.5) of the Forestry and Forest Products Research Institute in Tsukuba, Japan (36°00′ N, 140°08′ E, 20 m a.s.l.). Seedlings were planted 50 cm from each other. The contents of carbon, nitrogen, exchangeable calcium, magnesium, and potassium in soil of the nursery were 41.0 g kg–1, 3.40 g kg–1, 6.16 cmolc kg–1, 0.80 cmolc kg–1, and 0.39 cmolc kg–1, respectively (Yamada et al., 2021). The annual mean air temperature at the nearest automated meteorological data acquisition site (36°03′ N, 140°08′ E, elevation 25 m) was 14.3°C and the annual precipitation was 1395 mm in 2011 (Japan Meteorological Agency, 2021). The daily mean air temperature and precipitation in the nursery during a growing season in 2011 was shown in Figure 1.
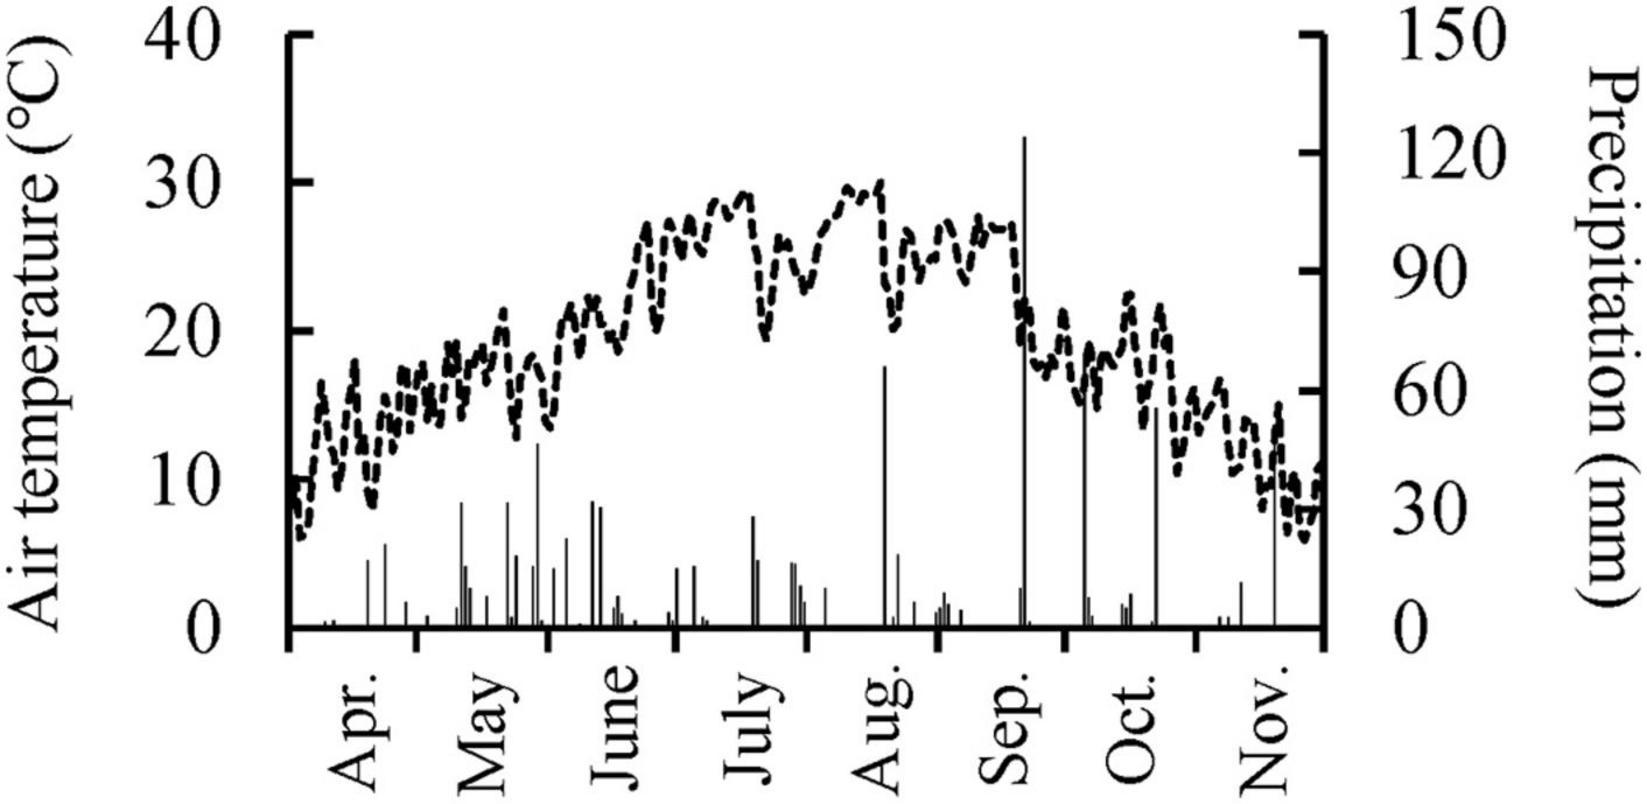
Figure 1. Daily mean air temperature and precipitation in the experimental nursery from April 1st to November 30th, 2011.
Experimental Design
We used the same experimental design and facility as those of Tobita et al. (2019), although the experimental period (1 growing season) was shorter than that of Tobita et al. (2019), who used much smaller seedlings (1-year-old) than those in the present study (2-year-old). Q. mongolica seedlings were grown in FACE systems. These seedlings were exposed to ambient air ([Control]), elevated CO2 ([CO2]; 550 μmol mol–1 CO2), elevated O3 ([O3]; twice ambient O3), or a combination of elevated CO2 and O3 ([CO2 + O3]; 550 μmol mol–1 CO2 and twice ambient O3), based on a simulation for 2060 projections (IPCC, 2007; Figure 2). Ambient O3 concentration was monitored using an O3 analyzer (Model EG-3000F, Ebara Jitsugyo Co., Ltd., Kanagawa, Japan), and elevated O3 concentration was continuously regulated to 2× ambient O3 concentration during daytime. We set 12 frames of the FACE system as three replicates of four treatments (i.e., [Control], [CO2], [O3], and [CO2 + O3]) and planted six seedlings in each frame, for a total of 72 seedlings.
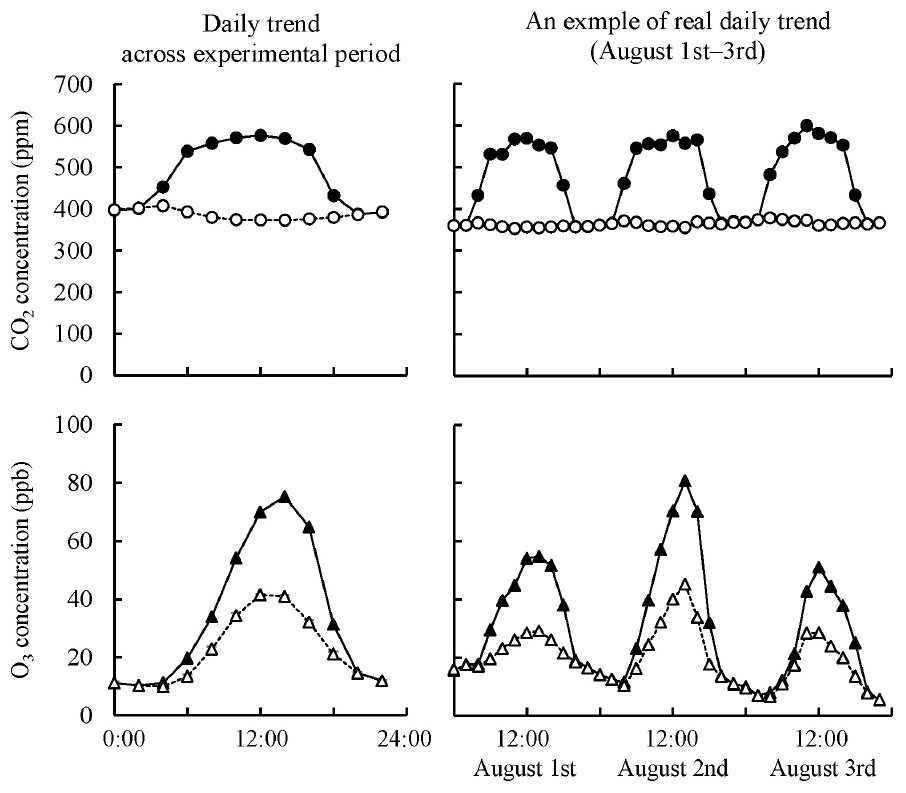
Figure 2. Daily trend of CO2 and O3 concentrations in the chamber of the FACE system across experimental period and an example of real daily trend on August 1st–3rd, 2011. Open circle, ambient CO2 as mean value of [Control] and [O3] treatments; solid circle, elevated CO2 as mean value of [CO2] and [CO2 + O3] treatments; open triangle, ambient O3 as mean value of [Control] and [CO2] treatments; solid triangle, elevated O3 as mean value of [O3] and [CO2 + O3] treatments.
Each frame of the FACE system was 2-m wide × 2.5-m high. Two transparent windscreens (Sky Coat 5 polyolefin film, C.I. Takiron Corp., Osaka, Japan) of 50-cm in length were installed into each frame at heights of 15 and 75 cm to facilitate the mixing of CO2 and O3. The windscreen is drip-proof and fog-proof film, but has no function of UV protection. CO2 and O3 gasses were injected with ambient air via polyethylene tubes connected to the frame at a height of 2 m at 20-cm intervals. Gaseous CO2 and O3 were generated from liquid CO2 (Air Water Inc., Osaka, Japan) and an ozone generator (Model PZ2A, Kofloc, Kyoto, Japan). CO2 and O3 were supplied during the daytime from May 20 to November 16, 2011. The CO2 and O3 supplies were controlled using a proportional integral derivative control system with digital controllers (Model SDC35, Azbil Corp., Tokyo, Japan).
On the basis of monitoring using an infrared CO2 analyzer (Model LI-820, LI-COR, Inc., Lincoln, NE, United States), over the course of the treatments, the mean (± standard error) CO2 concentrations during the daytime (7:00–17:00) were 378 ± 2.5 and 562 ± 16.9 ppm for the ambient and elevated CO2 concentration conditions, respectively. According to measurements obtained using an O3 analyzer (Model EG-3000F, Ebara Jitsugyo Co., Ltd., Kanagawa, Japan) and an O3 monitor (Model 205, 2B Technologies, Boulder, CO, United States), during treatments, the mean (± standard error) O3 concentrations during the daytime (7:00–17:00) were 36.1 ± 1.0 and 65.3 ± 2.0 ppb for the ambient and elevated O3 concentration conditions, respectively.
Measurement of Aboveground Biomass
We measured the stem length and diameter at the base of the seedlings on April 14 (start of the experiment) and November 15 to 16 (end of the experiment) for all 72 seedlings. At the end of the experiment, we harvested the aboveground portion of these seedlings and divided them into leaves, stems, and other parts (i.e., branches and twigs). Furthermore, from September 5, 2011, to the end of the experiment, we collected fallen leaves every day. These samples were oven-dried at 70°C for >72 h using a hot air circulating oven (GT-120P, ALP Co., Ltd., Tokyo, Japan), and then weighed. The dry weights of leaves and fallen leaves were considered to be the leaf biomass; the dry weight of stems was considered to be the stem biomass; and the aboveground biomass was the sum of the dry weight of leaves, stems, and other parts.
Measurement of Organic Constituents of Woody Tissue
We randomly selected three seedlings from each of the 12 frames (36 seedlings total) and used their dried stems to quantify the organic constituents of their woody tissues. We separated the current-year stem, formed under treatments within the FACE system, from the other parts. The bark of the current-year stem was removed using a chisel to eliminate the influence of bark chemicals, which may be altered under elevated CO2 concentrations (Eberhardt et al., 2015). The remaining portion of the stem (i.e., woody tissue) was ground into fine particles that could pass through a 4-mm-mesh screen.
Fine particle samples (0.5 g) were dried at 105°C for 24 h, weighed, and used to determine water content (WCfine particle). Next, we performed solvent extraction according to JIS P 8010-1976, with some modifications. We added 150 mL of ethanol/benzene solution (1/2, v/v) into 1.0–1.5 g of fine particle sample and conducted Soxhlet extraction for 6 h. The ethanol/benzene extractives solution was evaporated and then dried under reduced pressure in a desiccator. We weighed the dried extractives to determine the percentage of dry weight of extractives to that of fine particle sample (extractive content), which was calculated using the water content value, WCfine particle. The ethanol/benzene extraction residue was air-dried and used to quantify the lignin content, according to JIS P 8008-1976, but with some modifications (described as follows).
A 0.5-g sample of the ethanol/benzene extraction air-dried residue was dried at 105°C for 24 h and weighed and its water content was determined (WCresidue). Next, we added 15 mL of 72% H2SO4 solution into the residue, stirred the solution, and let it stand at 20°C for 4 h. We then added 560 mL of distilled water into the residue solution and refluxed it for 4 h. After cooling, the residue solution was suction filtered through a glass filter (1 GP 16). The filtrate was adjusted to 2 L by adding distilled water, and the absorbance of acid-soluble lignin (ASL) at 210 nm (As) was measured using ultraviolet-visible spectrometer (UV-2400PC, Shimadzu, Kyoto, Japan), whereas the absorbance of distilled water (Ab) was measured as a blank sample. The filtered residue was dried at 105°C for 24 h and weighed as dry weight of Klason lignin (KL). The percentage of ASL (ASL content) and KL (KL content) to dry weight of the fine particle sample was calculated using Formulas 1 and 2, respectively. We further calculated the total lignin content as the sum of ALS and KL.
where V, AC, and KLW are the volume of residue solution diluted filtrate (i.e., 2 L), absorption coefficient of lignin (i.e., 110), and dry weight of KL, respectively. SW is the dry weight of the residue, which was calculated using the water content value, WCresidue, and PE is the percentage of the dry weight of ethanol/benzene extraction to that of the fine particle sample.
In this study, the percentage of holocellulose (holocellulose content) to dry weight of the fine particle sample was calculated by subtracting the lignin and extractive contents from 100%.
Analysis of ethanol/benzene extractives, ASL, KL, and holocellulose was conducted twice for each fine particle sample, as replicate measurements; we used the mean value of the two measurements for statistical analysis. However, the dry weight of current-year stem was so low for two seedlings grown in the [Control] treatment that small amount of fine particle sample obtained; this amount of fine particle was not enough for twice measurement. We thus used only a single value for the two samples for statistical analysis.
Statistical Analysis
Values for the base diameter and stem length at the start and the end of the experiment, stem and aboveground biomass, and the extractive content of woody tissue were transformed using a Box-Cox transformation to meet data normality. We then analyzed the effects of elevated CO2 and/or O3 concentrations on seedling growth, i.e., differences in diameter at base and stem length between the start and the end of the experiment, using a generalized linear mixed model with a Gaussian error distribution (Formula 3). In Formula 3, measurement time means a categorical variable, which shows the start and the end of experiment. In this analysis, we considered individual seedling number, which is nested by each chamber in the FACE system, to be a random effect.
We further analyzed the effects of elevated CO2 and/or O3 concentrations on seedling biomass (i.e., aboveground, leaf, and stem biomass) and the organic composition of woody tissue (i.e., extractives, total lignin, ASL, KL, and holocellulose contents) using a generalized linear mixed model with a Gaussian error distribution (Formula 4). In this analysis, we considered each chamber in the FACE system to be a random effect.
We determined the significance of each fixed effect (i.e., CO2 concentration, O3 concentration, Measurement time, and their interaction) using an analysis of deviance (type II test; Fox and Weisberg, 2019). Furthermore, differences in the growth and organic constituent variables across the four treatments were assessed by the Tukey method using GLHT function based on general linear hypotheses (Hothorn et al., 2008). All statistical analyses were conducted in R3.6.1 (R Core Team, 2019).
Results
Q. mongolica Seedling Growth
Seedling base diameter was influence by CO2 concentration, measurement time, and their interaction (p < 0.001; Tables 1, 2). Seedling base diameters were similar across treatments at the start of the experiment. At the end of the experiment, the diameter at the base was higher in the [CO2] treatment than in the [O3] and [Control] treatments (p < 0.001). Stem length was also influenced by CO2 concentration, measurement time, and their interaction (p < 0.010; Tables 1, 2). At the end of the experiment, stem length was higher in the [CO2] and [CO2 + O3] treatments than in the [Control] treatment (p < 0.016).
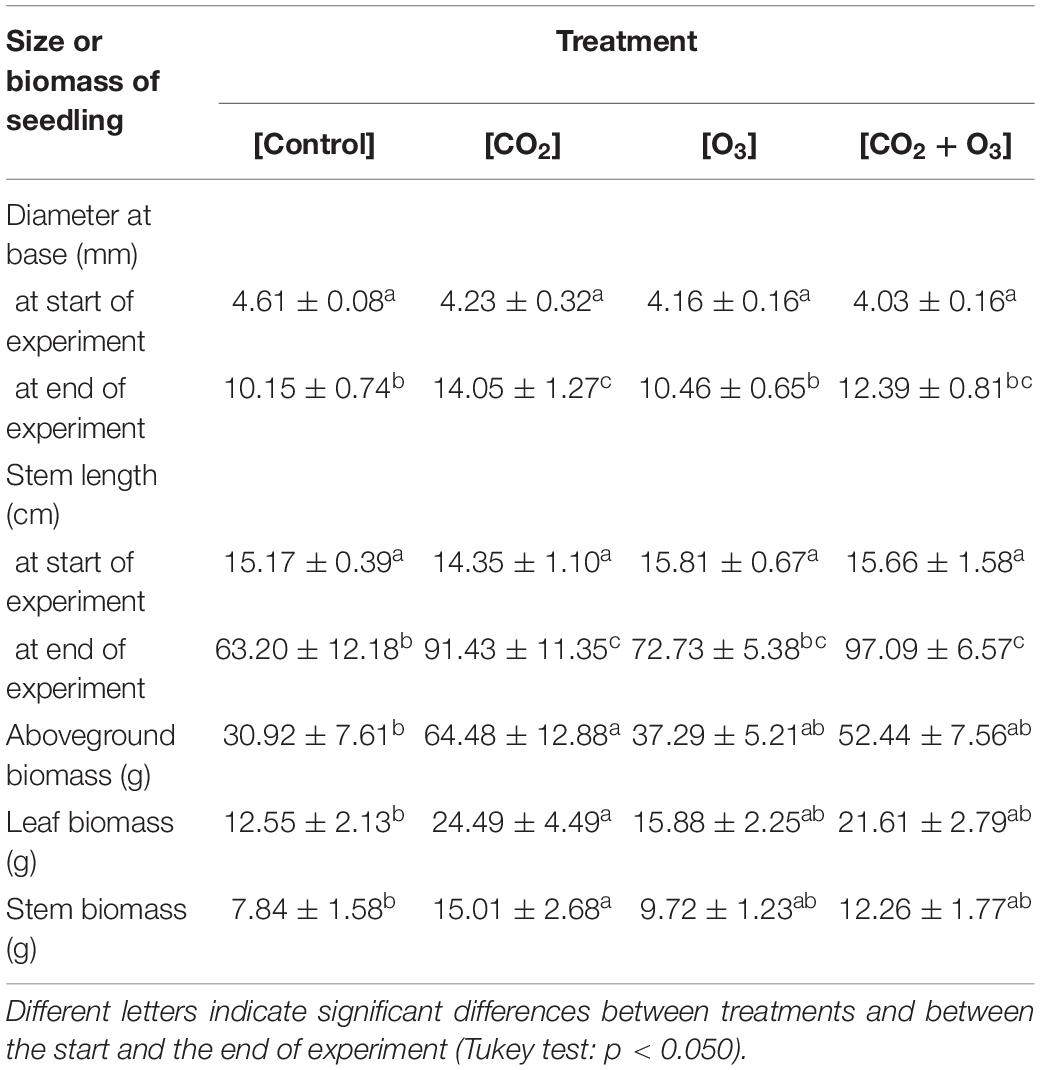
Table 1. Size and biomass (mean ± standard deviation) of Q. mongolica seedlings at the start and end of the experiment, after treatments of atmospheric CO2 and O3 concentration ([Control]), elevated CO2 concentration ([CO2]), elevated O3 concentration ([O3]), and a combination of elevated CO2 and O3 concentrations ([CO2 + O3]).
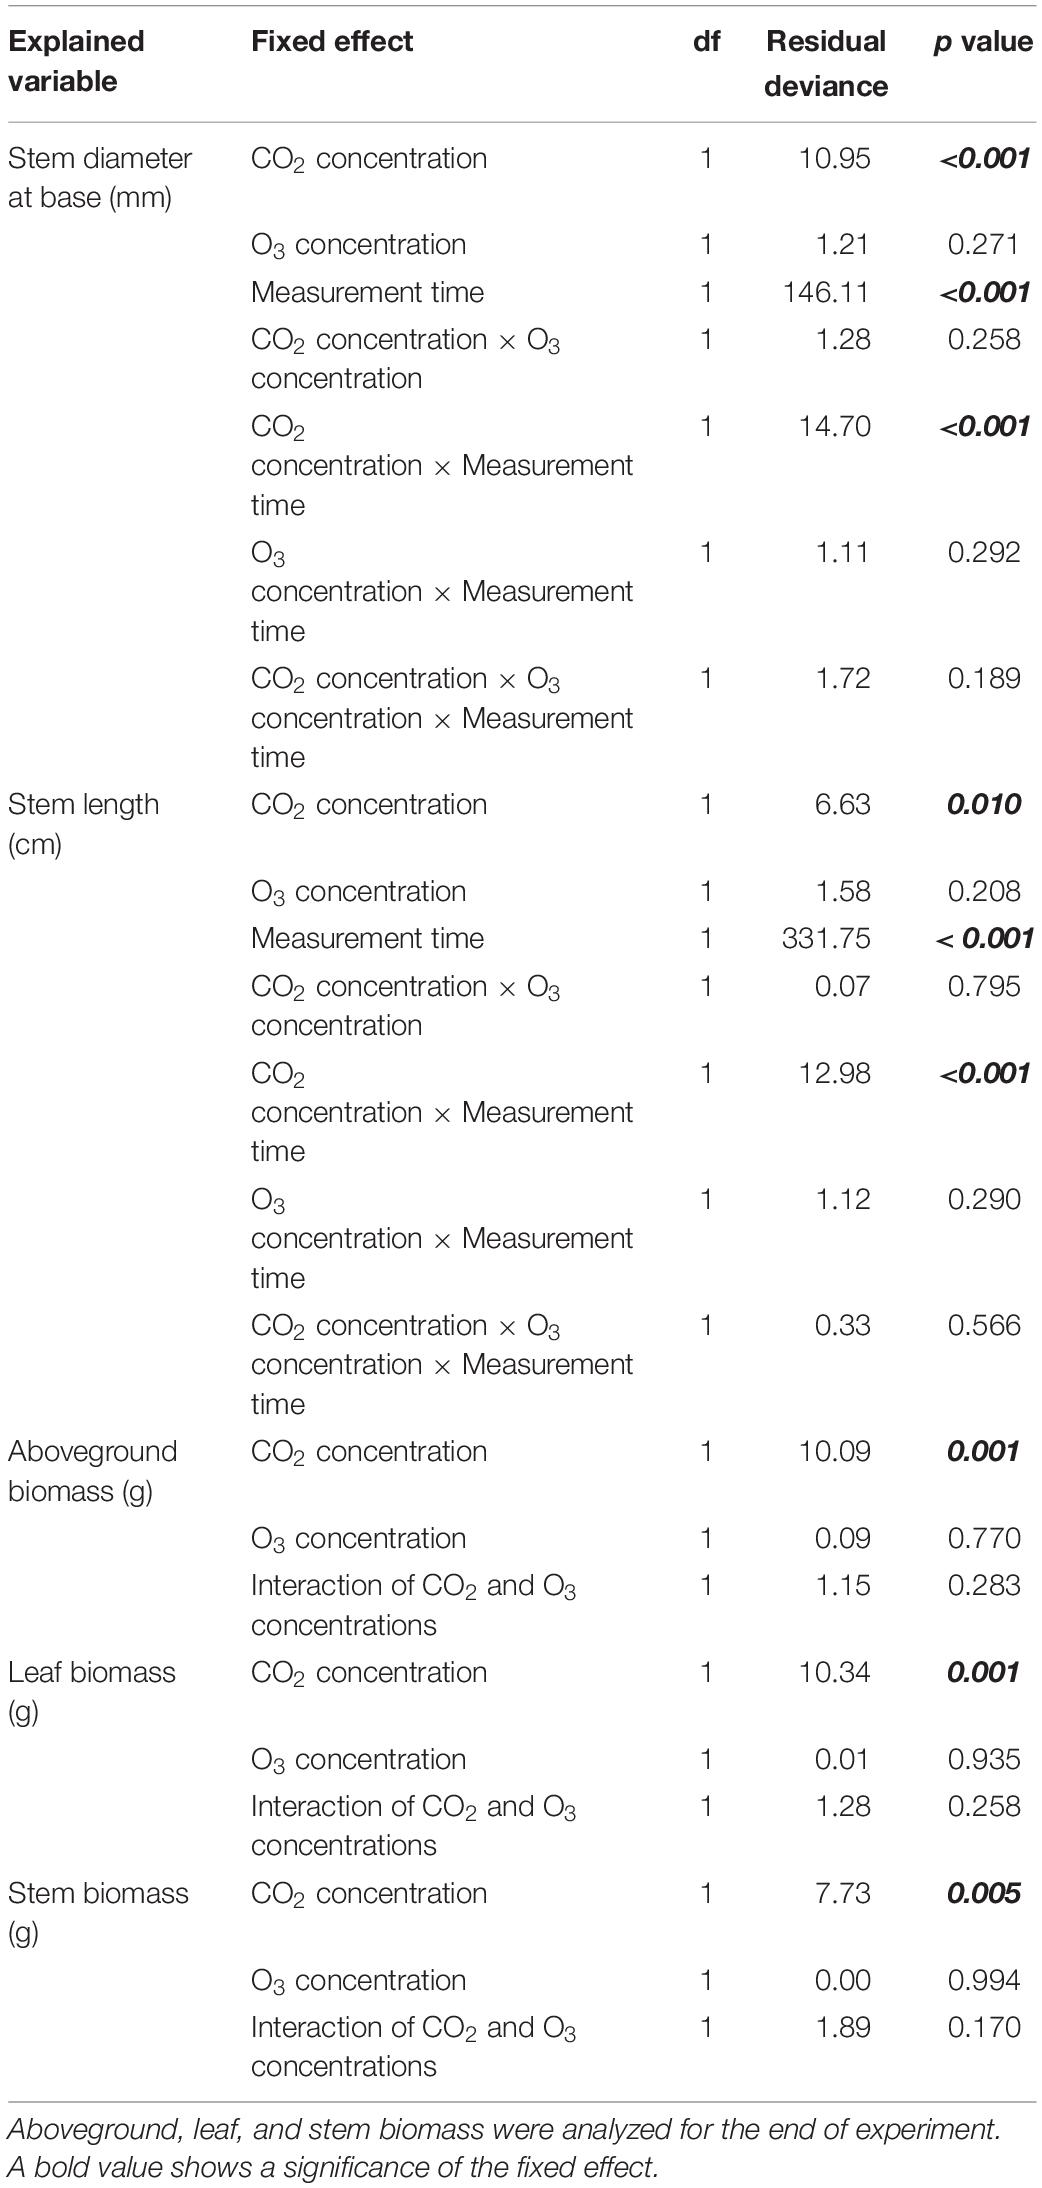
Table 2. Results of the analysis of deviance (type II test) for stem size and aboveground, leaf, and stem biomass at the start and end of the experiment.
In terms of biomass growth, CO2 concentration affected aboveground, leaf, and stem biomass at the end of the experiment (Tables 1, 2; p = 0.001, p = 0.001, p = 0.005, respectively), all of which were higher in the [CO2] treatment than in the [Control] treatment (p < 0.018).
Organic Carbon Component of Q. mongolica Seedling Stem Wood
With respect to total lignin, we detected an interaction between CO2 and O3 concentrations (Table 3; p = 0.020); however, there was no difference across treatments (Figure 3; p > 0.078). The KL content showed a similar result as that for total lignin: there was an interaction between elevated CO2 and O3 concentrations (p = 0.021), but no difference across treatments (p > 0.150). Neither CO2 nor O3 concentration influenced ASL content (p > 0.067).
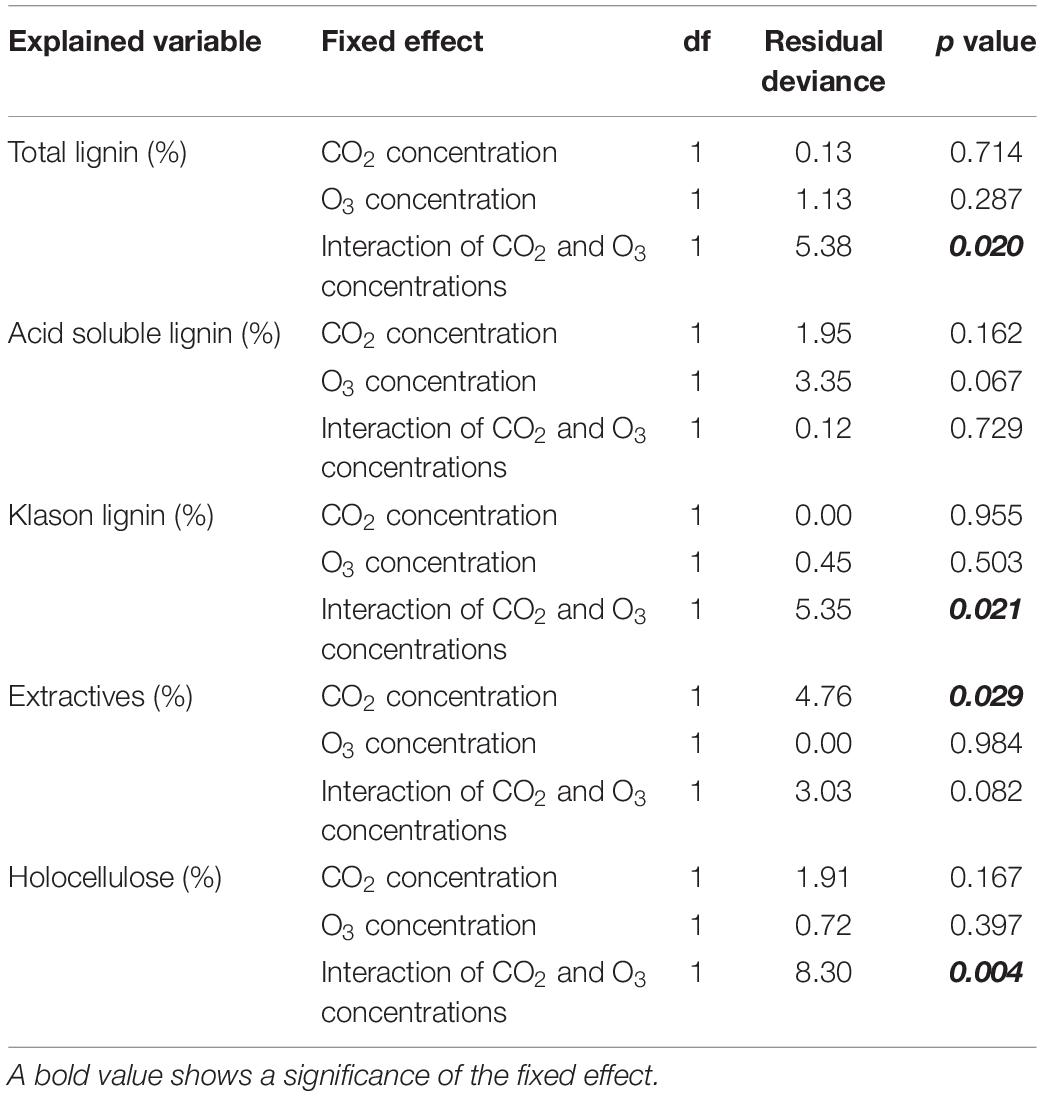
Table 3. Results of the analysis of deviance (type II test) for the organic constituents of woody tissue.
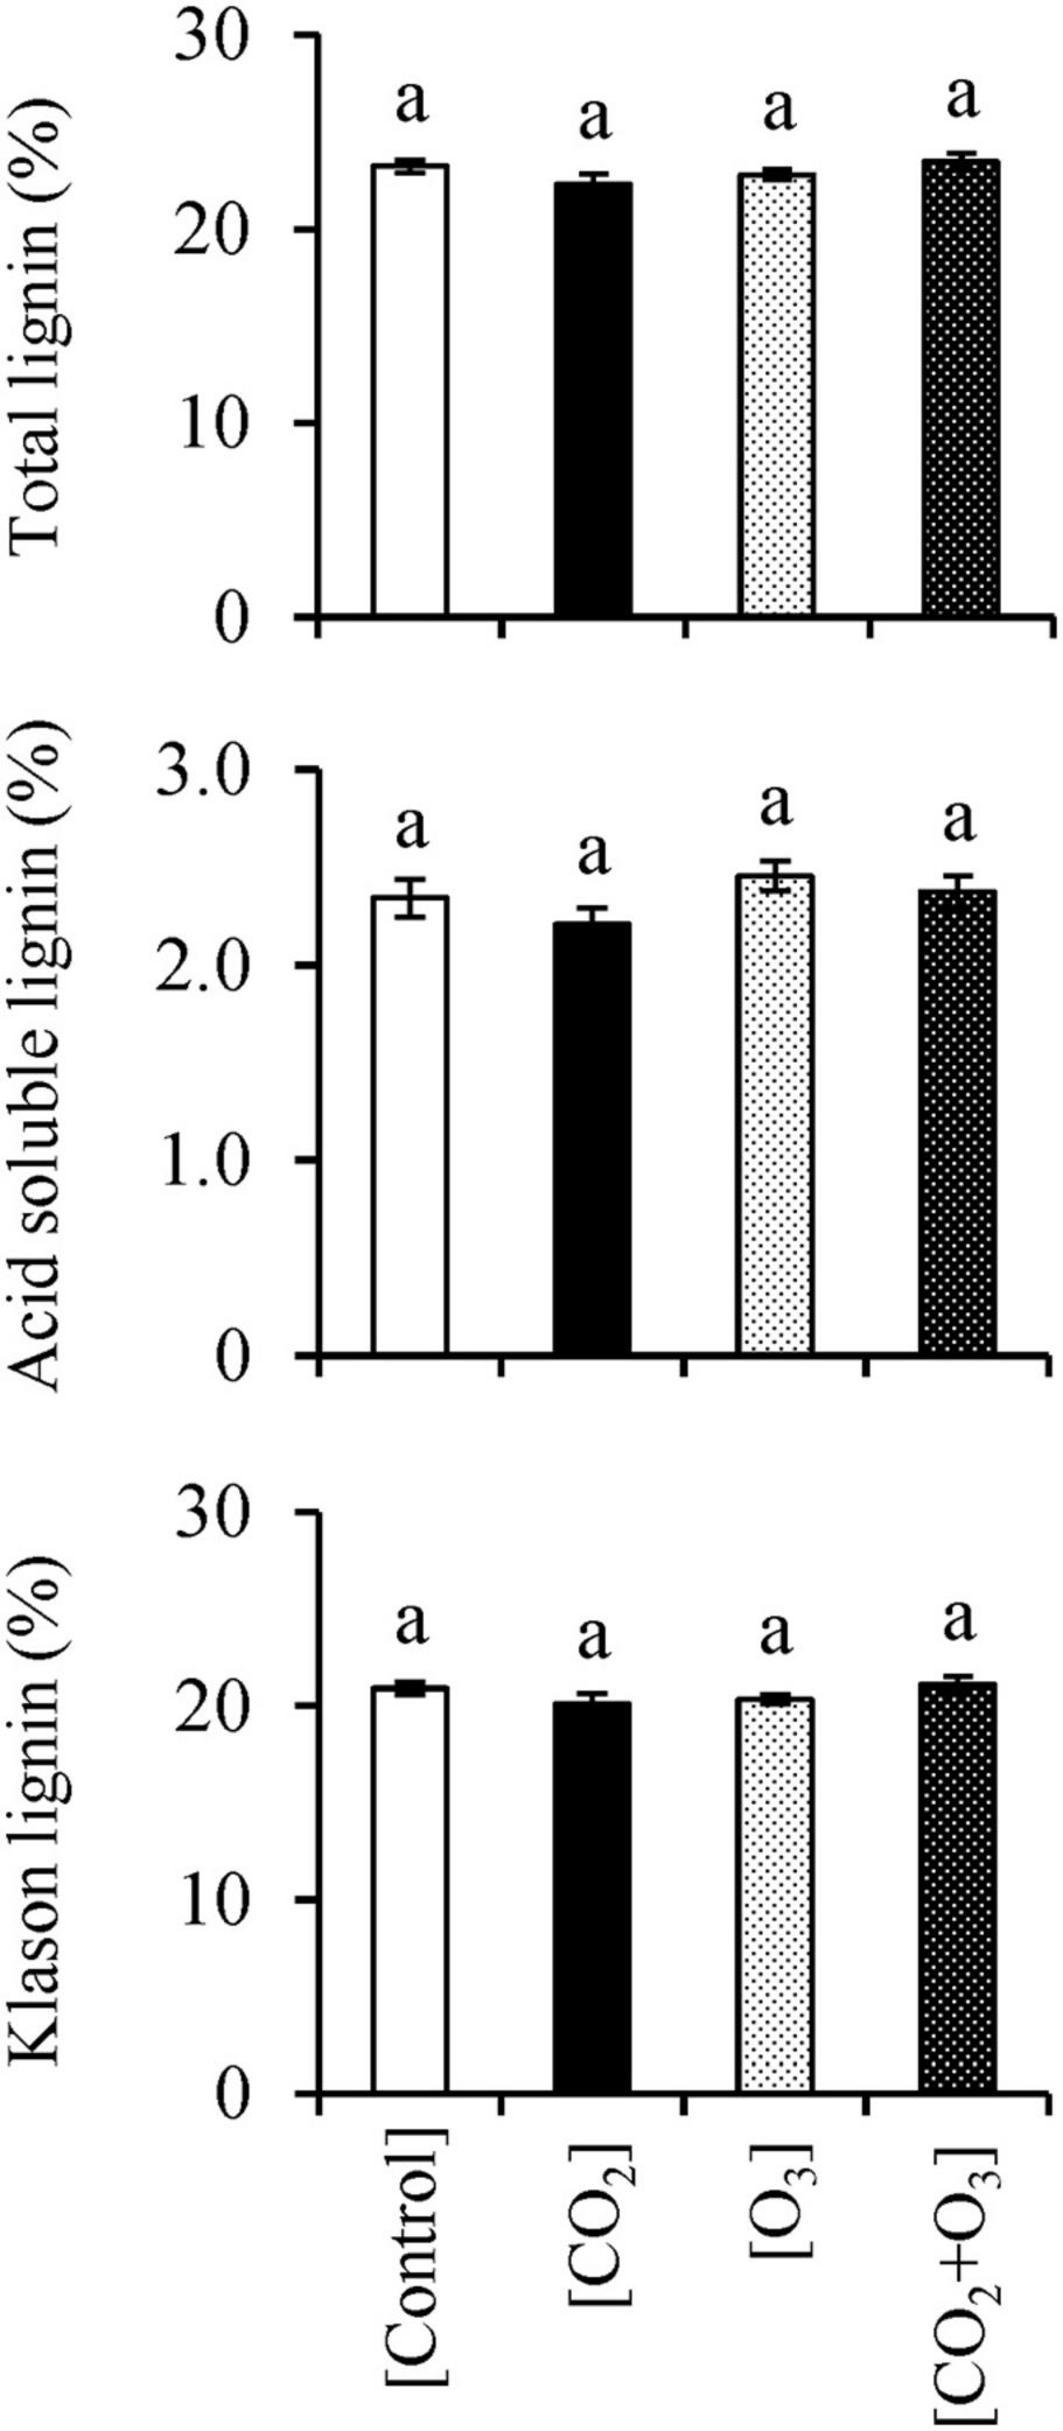
Figure 3. Total lignin, acid-soluble lignin, and Klason lignin contents in Q. mongolica seedlings subjected to conditions of atmospheric CO2 and O3 concentration ([Control]), elevated CO2 concentration ([CO2]), elevated O3 concentration ([O3]), and a combination of elevated CO2 and O3 concentrations ([CO2 + O3]). Bars indicate standard errors. Different letters indicate significant differences among treatments (Tukey method: p < 0.050).
CO2 concentration affected the stem woody tissue extractive content (Table 3; p = 0.029). The mean (± standard error) percentage of extractive content in the [CO2] treatment was 2.88 ± 0.09%, which was lower than that in the [Control] treatment (3.63 ± 0.32%; p = 0.028; Figure 4).
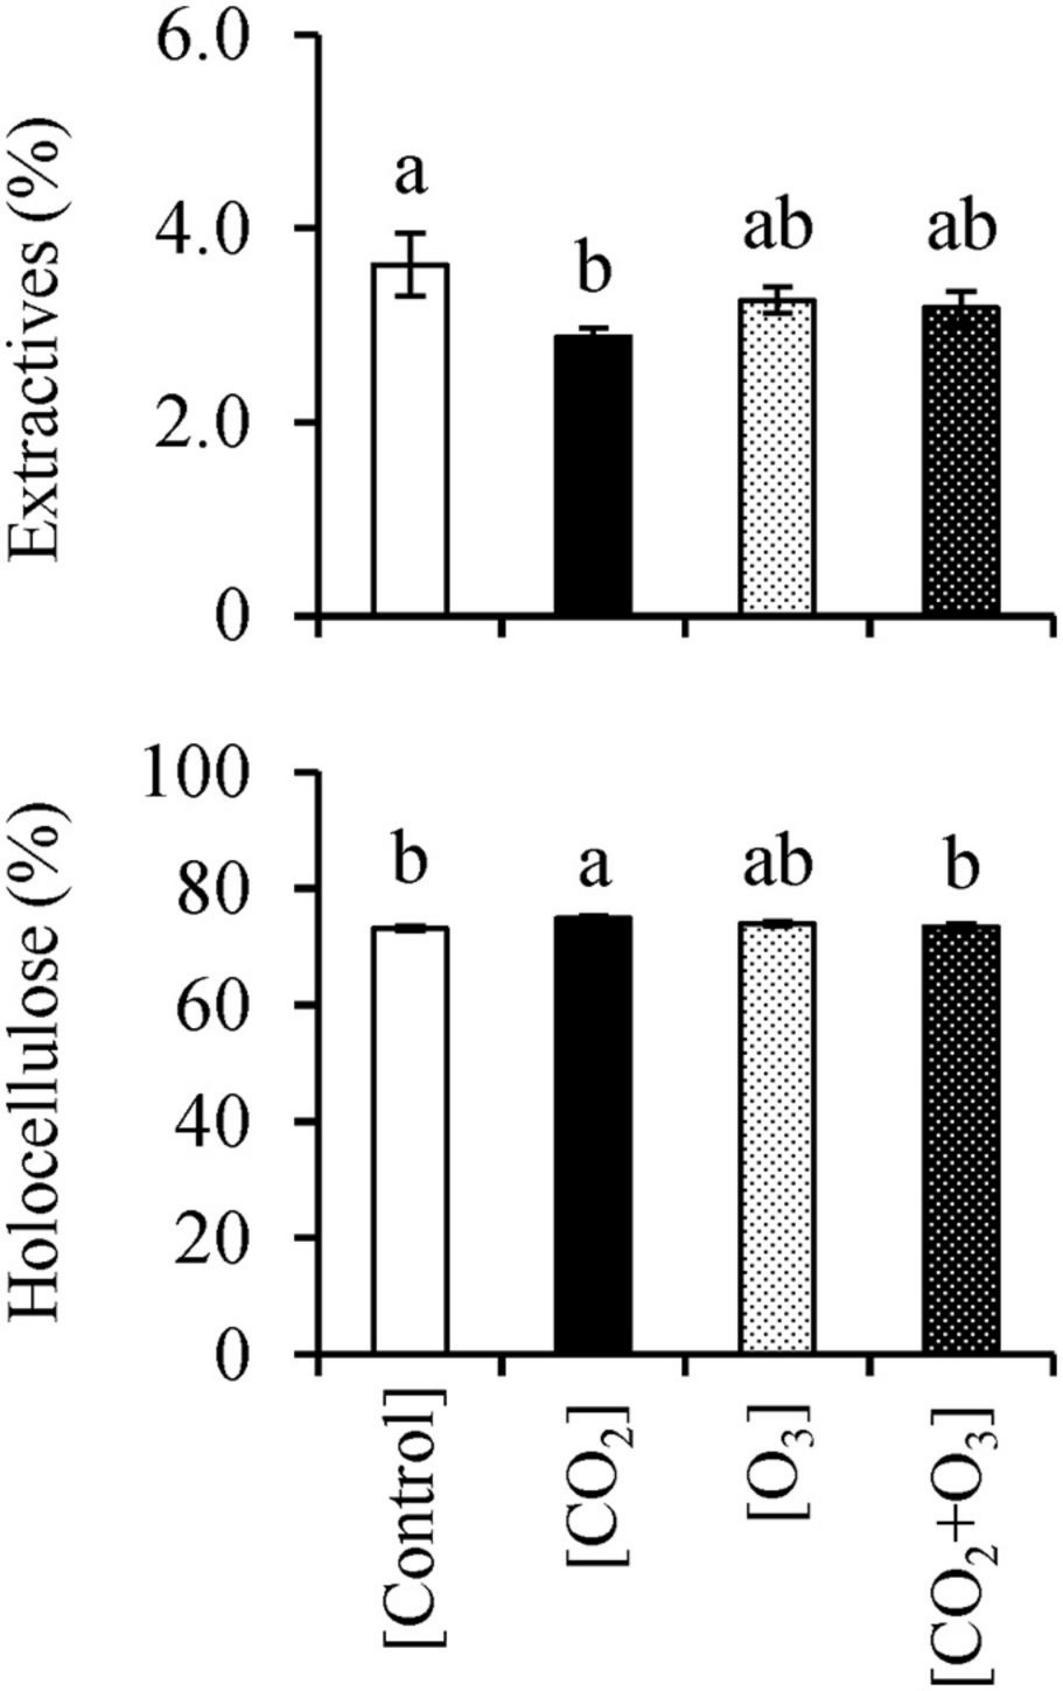
Figure 4. Ethanol/benzene extractives and holocellulose contents in Q. mongolica seedlings subjected to conditions of atmospheric CO2 and O3 concentration ([Control]), elevated CO2 concentration ([CO2]), elevated O3 concentration ([O3]), and a combination of elevated CO2 and O3 concentrations ([CO2 + O3]). Bars indicate standard errors. Different letters indicate significant differences among treatments (Tukey method: p < 0.050).
There was also a significant interaction between CO2 and O3 concentrations for holocellulose content (Table 3; p = 0.004). The holocellulose content (mean ± standard error) for the [CO2] treatment was 74.8 ± 0.47%, which was higher than that for the [Control] and [CO2 + O3] treatments (p < 0.042; Figure 4), which corresponded to 73.2 ± 0.36% and 73.4 ± 0.52%, respectively.
Discussion
Effect of Elevated CO2 and/or O3 Concentrations on Q. mongolica Growth
Elevated CO2 concentrations enhanced stem growth, resulting in increased leaf, stem, and aboveground biomass (Table 1). This suggests that the growth of Q. mongolica seedlings was accelerated by an elevated CO2 concentration, as reported for many other tree species (e.g., Richet et al., 2012; Tobita et al., 2019). Conversely, we observed minor changes in biomass growth under the elevated O3 concentration condition (Table 1), unlike in other species (e.g., Watanabe et al., 2007; Richet et al., 2012), whose growth and biomass have been shown to decrease under such conditions. However, our results are similar to those of Kitao et al. (2015), who investigated the response of the same species to elevated CO2 and O3 concentrations over 2 years. Yamaguchi et al. (2011) also suggested the sensitivity to O3 is low for Q. mongolica by summarizing the critical level of O3 concentrations for biomass growth of various tree species. Thus, we hypothesize that Q. mongolica is tolerant to elevated O3 concentrations. This species showed the reduction of net photosynthesis rate under high O3 concentration (Kitao et al., 2015), similar to other tree species (Yamaguchi et al., 2011). On the other hand, Kitao et al. (2015) suggested that C allocation is increased into the shoot and leaves under elevated O3 concentrations for Q. mongolica while similar tendency was not observed for other species (Watanabe et al., 2008). Additionally, Q. mongolica often shows partly determinant growth, i.e., additional shoot elongation, as a response to the change in environment (Kitao et al., 2006), and Quercus species carried C synthesized in a given year over to the additional growth in the next year (e.g., Vernay et al., 2018). The key to high O3 concentration tolerance may be a change in the C allocation pattern, which is induced by partly determinant growth type and carry-over effect, that may be specific to this tree species.
In this study, the interactive effect of the combination of elevated CO2 and O3 concentrations on biomass growth was not clear (Table 1). Kitao et al. (2015) reported an increase in Q. mongolica seedling biomass growth over their 2-year experiment, with a significant increase in C allocation into the shoots (cf., Kitao et al., 2021). A longer experimental period may provide more evidence of the species-specific responses of shoot–root allocation to elevated CO2 and O3 concentrations. Our results demonstrate that stem length growth is enhanced under a combination of elevated CO2 and O3 concentrations. Elevated O3 concentration enhances stem length growth in Cryptomeria japonica (Hiraoka et al., 2017), and a slight increase in stem length was observed under the elevated O3 concentration condition in our study (Table 1). Rapid biomass growth under elevated CO2 concentrations may promote an increase in stem length under elevated O3 concentrations.
Effect of Elevated CO2 and/or O3 Concentrations on the Organic Carbon Components of Q. mongolica Woody Tissue
The experimental period was only 1 growing season in this study. Thus, our results for organic carbon component may be different from a long-term experiment. However, our experiment gives an insight at least for newly formed wood tissue and supplies basic information for long-term experiment.
We did not detect a change in the total lignin, ASL, and KL contents (Figure 3), irrespective of the increase in biomass growth noted under an elevated CO2 concentration (Table 1). The lignin content of the woody tissue may be stable in Q. mongolica, similar to that of other species (e.g., Populus nigra; Luo et al., 2008). The deposition of lignin on cell walls enhances the physical strength of stem wood tissue (e.g., Gril et al., 2017), which is necessary to keep the shape of tree, i.e., standing stem against gravity. We thus think that the increase in biomass growth is accompanied by additional lignin production to keep above a certain level of lignin content. Conversely, the stability of lignin content under elevated O3 concentrations differs from the results noted in previous reports, which found an increase in lignin content in Populus tremuloides, Betula papyrifera, and a hybrid poplar (Kaakinen et al., 2004; Richet et al., 2011, 2012). Richet et al. (2012) reported a decrease in biomass growth under elevated O3 concentrations with an increase in lignin content. In this study, a reduction of biomass growth under elevated O3 concentrations was not observed (Table 1). Therefore, we speculate that less change in lignin content in Q. mongolica is due to the lack of a change in biomass growth under elevated O3 concentrations.
We found that the woody tissue extractive contents were reduced under elevated CO2 concentrations (Figure 4). This finding differs from that for other tree species (Kaakinen et al., 2004; Kostiainen et al., 2006, 2008), whose extractive contents have been reported to remain unchanged or increase under similar conditions. Conversely, Luo et al. (2008) noted a reduction of soluble phenolics, components of extractives, under elevated CO2 concentrations. Thus, we suggest that the elevated CO2 concentration reduced the extractive content of woody tissue in Q. mongolica. Luo et al. (2008) hypothesized that the biosynthesis for biomass growth precedes that for carbon-based secondary compounds such as phenolics and tannins. The synthesis of extractive may not keep up with the production of structural components, i.e., lignin and holocellulose. The extractives have the antimicrobial function, i.e., inhibition of degradative capabilities of rot fungi and disruption of parts of fungal cell (Valette et al., 2017). In this study, the difference in extractive content was very small (i.e., 0.75%) between the [Control] (3.63%) and [CO2] (2.88%) treatments (Figure 4); however, this equated to a 21% decrease (=0.75% / 3.63% × 100) in the extractive content. Kirker et al. (2013) reported that the initial decomposition rate of extractive-free wood block exposed to brown-rot fungi was 5–10 fold higher than unextracted wood block for 3 hardwood species. Thus, we predicted that the reduction of extractive contents under elevated CO2 concentration causes measurable increase in the decomposition rate of dead wood and woody debris.
On the other hand, the decrease in extractive content under the elevated CO2 concentration treatment became unclear upon the addition of O3, i.e., the combination of elevated CO2 and O3 concentrations (Figure 4). Similar differences among treatments were observed for stem biomass (Table 1). Elevated O3 concentration itself did not change the extractive content, but it may have an effect to mitigate the impact of high CO2 concentration on extractive content.
Elevated CO2 concentration enhanced the holocellulose content (Figure 4), although it was only indirectly determined (i.e., woody tissue excluding lignin and extractives). This result is different from those of previous reports for other species (Kaakinen et al., 2004; Kostiainen et al., 2006, 2008), which demonstrated no change or a decrease in cellulose and hemicellulose contents under similar conditions. However, Luo and Polle (2009) reported that the cell wall fraction increases under elevated CO2 concentrations in a hybrid poplar. For Q. mongolica, the size of the vessels and the number of cambial cells increase under elevated CO2 concentrations (Watanabe et al., 2010). In Q. mongolica, the holocellulose content may increase via a change in structure of the woody tissue under elevated CO2 concentrations. On the other hand, there was a very small increase (i.e., 1.6%) in holocellulose content from the [Control] (73.2%) to [CO2] (74.8%) treatments, indicating only a 2% increase (=1.6% / 73.2% × 100) in the holocellulose content. The small increase may not influence the decomposition rate drastically. Furthermore, an elevated O3 concentration did not change the holocellulose content, but it reduced the impact of high CO2 concentrations (Figure 4); a similar result was obtained for the cellulose content in Betula pendula seedlings (Kostiainen et al., 2006). Therefore, an increase in holocellulose content may be mitigated by elevated O3 concentrations in Q. mongolica.
Conclusion
In this study, we noted a decrease in the extractive content of Q. mongolica under elevated CO2 concentrations, whereas the holocellulose content increased. As part of the rapid biomass growth response of Q. mongolica seedlings (Table 1), the production of structural components (i.e., lignin and holocellulose) may precede that of non-structural components (i.e., extractives). Extractives inhibit biodegradation, irrespective of the small amount in woody tissue (Oliveira et al., 2010; Kirker et al., 2013) via their antimicrobial function such as inhibition of degradative capabilities of rot fungi and disruption of parts of fungal cell (Valette et al., 2017). The decrease in extractive content suggests that dead wood and woody debris may be rapidly decomposed under high atmospheric CO2 concentration in Q. mongolica. Q. mongolica is distributed widely in the temperate forests of Russian Far East, Mongolia, the northeastern part of China, the Korean Peninsula, and Japan. This decrease in extractive content may have a non-negligible impact on C cycling on the global scale. Furthermore, our results showed a possibility that elevated O3 concentrations mitigate the impact of elevated CO2 concentrations; this must be tested. Additionally, we only evaluated the organic constituents of woody tissue in one of the representative species in this area. More information for the response of various species is necessary to enhance the prediction accuracy for the impact of elevated CO2 and/or O3 concentrations on C cycling in the future forests.
Data Availability Statement
The raw data supporting the conclusions of this article will be made available by the authors, without undue reservation.
Author Contributions
SU analyzed the data of the experiment and prepared the manuscript. SH and KH measured the amount of each organic constituents of wood stem. HT got the research grants and measured the growth of seedlings. MK got the research funds and built the experiment system. All authors contributed to the article and approved the submitted version.
Funding
This research was supported by the “Technology Development for Circulatory Food Production Systems Responsive to Climate Change” conducted by the Ministry of Agriculture, Forestry and Fisheries, Japan, and the Grant-in-Aid for Scientific Research (B) (No. 25292092) and JSPS KAKENHI Grant Number JP17H03839.
Conflict of Interest
The authors declare that the research was conducted in the absence of any commercial or financial relationships that could be construed as a potential conflict of interest.
Publisher’s Note
All claims expressed in this article are solely those of the authors and do not necessarily represent those of their affiliated organizations, or those of the publisher, the editors and the reviewers. Any product that may be evaluated in this article, or claim that may be made by its manufacturer, is not guaranteed or endorsed by the publisher.
Acknowledgments
We thank the members of Department of Plant Ecology, Department of Forest Resource Chemistry, Department of Forest Soils in the Forestry and Forest Products Research Institute for supporting this research.
References
Aalde, H., Gonzalez, P., Gytarsky, M., Krug, T., Kurz, W. A., Lasco, R. D., et al. (2006). “Chapter 2, generic methodologies applicable to multiple land-use categories,” in 2006 IPCC Guidelines For National Greenhouse Gas Inventories: Volume 4 Agriculture, Forestry And Other Land Use, ed. IPCC (Hayama: The Institute for Global Environmental Strategies (IGES)).
Agathokleous, E., Feng, Z., Oksanen, E., Sicard, P., Wang, Q., Saitanis, C. J., et al. (2020). Ozone affects plant, insect, and soil microbial communities: a threat to terrestrial ecosystems and biodiversity. Sci. Adv. 6:eabc1176. doi: 10.1126/sciadv.abc1176
Ainsworth, E. A., Lemonnier, P., and Wedow, J. M. (2020). The influence of rising tropospheric carbon dioxide and ozone on plant productivity. Plant Biol. 22, 5–22. doi: 10.1111/plb.12973
Broda, M. (2020). Natural compounds for wood protection against fungi – a review. Molecules 25:3538. doi: 10.3390/molecules25153538
Chapin, F. S. III, Matson, P. A., and Vitousek, P. M. (2011). “Decomposition and ecosystem carbon budgets,” in Principles of Terrestrial Ecosystem Ecology, 2nd Edn, eds F. S. Chapin III, P. A. Matson, and P. M. Vitousek (New York, NY: Springer).
Chen, Z., Shang, H., Cao, J., and Yu, H. (2015). Effects of ambient ozone concentrations on contents of nonstructural carbohydrates in Phoebe bournei and Pinus massoniana seedlings in subtropical China. Water Air Soil Pollut. 226:310. doi: 10.1007/s11270-015-2555-7
Eberhardt, T. L., Labbé, N., So, C. L., Kim, K., Reed, K. G., Leduc, D. J., et al. (2015). Effects of long-term elevated CO2 treatment on the inner and outer bark chemistry of sweetgum (Liquidambar styraciflua L.) trees. Trees 29, 1735–1747. doi: 10.1007/s00468-015-1254-8
Fox, J., and Weisberg, S. (2019). An R Companion to Applied Regression, 3rd Edn. Thousand Oaks, CA: SAGE Publications.
Gril, J., Jullien, D., Bardet, S., and Yamamoto, H. (2017). Tree growth stress and related problems. J. Wood Sci. 63, 411–432. doi: 10.1007/s10086-017-1639-y
Higo, M. (1994). Regeneration behaviors of tree species of secondary stands regenerated on sites disturbed by Typhoon 15: based on the proportion of advanced regeneration, growth rate, and seedling density in closed mature stands. J. Jpn. For. Sci. 76, 531–539. (in Japanese with English summary)
Hiraoka, Y., Iki, T., Nose, M., Tobita, H., Yazaki, K., Watanabe, A., et al. (2017). Species characteristics and intraspecific variation in growth and photosynthesis of Cryptomeria japonica under elevated O3 and CO2. Tree Physiol. 37, 733–743. doi: 10.1093/treephys/tpx028
Hothorn, T., Bretz, F., and Westfall, P. (2008). Simultaneous inference in general parametric models. Biom. J. 50, 346–363. doi: 10.1002/bimj.200810425
IPCC (2007). Climate Change 2007: Mitigation Of Climate Change. Working Group III Contribution To The Fourth Assessment Report Of The IPCC. Cambridge: Cambridge University Press.
IPCC (2013). Climate Change 2013: The Physical Science Basis. Contribution of Working Group I to the fifth assessment report of the IPCC. Cambridge: Cambridge University Press.
Japan Meteorological Agency (2021). Meteorological Database. Available online at: https://www.data.jma.go.jp/obd/stats/etrn (accessed October 21, 2021).
Kaakinen, S., Kostiainen, K., Ek, F., Saranpää, P., Kubiske, M. E., Sober, J., et al. (2004). Stem wood properties of Populus tremuloides, Betula papyrifera and Acer saccharum saplings after 3 years of treatments to elevated carbon dioxide and ozone. Glob. Chang. Biol. 10, 1513–1525. doi: 10.1111/j.1365-2486.2004.00814.x
Kasurinen, A., Riikonen, J., Oksanen, E., Vapaavuori, E., and Holopainen, T. (2006). Chemical composition and decomposition of silver birch leaf litter produced under elevated CO2 and O3. Plant Soil 282, 261–280. doi: 10.1007/s11104-005-6026-6
Kasurinen, A., Silfver, T., Rousi, M., and Mikol, J. (2017). Warming and ozone exposure effects on silver birch (Betula pendula Roth) leaf litter quality, microbial growth and decomposition. Plant Soil 414, 127–142. doi: 10.1007/s11104-016-3122-8
Kikuzawa, K. (1983). Leaf survival of woody plants in deciduous broad-leaved forests. 1. Tall trees. Can. J. Bot. 61, 2133–2139. doi: 10.1139/b83-230
Kirker, G. T., Blodgett, A. B., Arango, R. A., Lebow, P. K., and Clausen, C. A. (2013). The role of extractives in naturally durable wood specie. Int. Biodeterior. Biodegradation 82, 53–58. doi: 10.1016/j.ibiod.2013.03.007
Kitao, M., Agathokleous, E., Yazaki, K., Komatsu, M., Kitaoka, S., and Tobita, H. (2021). Growth and photosynthetic responses of seedlings of Japanese white birch, a fast-growing pioneer species, to free-air elevated O3 and CO2. Forests 12:675. doi: 10.3390/f12060675
Kitao, M., Komatsu, M., Yazaki, K., Kitaoka, S., and Tobita, H. (2015). Growth overcompensation against O3 exposure in two Japanese oak species, Quercus mongolica var. crispula and Quercus serrata, grown under elevated CO2. Environ. Pollut. 206, 133–141. doi: 10.1016/j.envpol.2015.06.034
Kitao, M., Lei, T. T., Koike, T., Tobita, H., and Maruyama, Y. (2006). Tradeoff between shade adaptation and mitigation of photoinhibition in leaves of Quercus mongolica and Acer mono acclimated to deep shade. Tree Physiol. 26, 441–448. doi: 10.1093/treephys/26.4.441
Kostiainen, K., Jalkanen, H., Kaakinen, S., Saranpää, P., and Vapaavuori, E. (2006). Wood properties of two silver birch clones exposed to elevated CO2 and O3. Glob. Chang. Biol. 12, 1230–1240. doi: 10.1579/0044-7447-38.8.418
Kostiainen, K., Kaakinen, S., Warsta, E., Kubiske, M. E., Nelson, N. D., Sober, J., et al. (2008). Wood properties of trembling aspen and paper birch after 5 years of exposure to elevated concentrations of CO2 and O3. Tree Physiol. 28, 805–813. doi: 10.1093/treephys/28.5.805
Luo, Z. B., and Polle, A. (2009). Wood composition and energy content in a poplar short rotation plantation on fertilized agricultural land in a future CO2 atmosphere. Glob. Chang. Biol. 15, 38–47. doi: 10.1111/j.1365-2486.2008.01768.x
Luo, Z. B., Calfapietra, C., Scarascia-Mugnozza, G., Liberloo, M., and Polle, A. (2008). Carbon-based secondary metabolites and internal nitrogen pools in Populus nigra under Free Air CO2 Enrichment (FACE) and nitrogen fertilization. Plant Soil 304, 45–57. doi: 10.1007/s11104-007-9518-8
Matsumura, H., Kobayashi, T., and Kohno, Y. (1998). Effects of ozone and/or simulated acid rain on dry weight growth and gas exchange rates of Japanese cedar, Nikko fir, Japanese white birch and Japanese zelkova seedlings (in Japanese). J. Jpn. Soc. Atmos. Environ. 33, 16–35.
Mattson, W. J., Julkunen-Tiitto, R., and Herms, D. A. (2005). CO2 enrichment and carbon partitioning to phenolics: do plant responses accord better with the protein competition or the growth-differentiation balance models? Oikos 111, 337–347. doi: 10.1111/j.0030-1299.2005.13634.x
Matyssek, R., Wieser, G., Ceuleman, R., Rennenberg, H., Pretzsch, H., Haberer, K., et al. (2010). Enhanced ozone strongly reduces carbon sink strength of adult beech (Fagus sylvatica) – resume from the free-air fumigation study at Kranzberg Forest. Environ. Pollut. 158, 2527–2532. doi: 10.1016/j.envpol.2010.05.009
Norby, R. J., Warren, J. M., Iversen, C. M., Medlyn, B. E., and McMurtrie, R. E. (2010). CO2 enhancement of forest productivity constrained by limited nitrogen availability. Proc. Natl. Acad. Sci. U.S.A. 107, 19368–19373. doi: 10.1073/pnas.1006463107
Oksanen, E., Riikonen, J., Kaakinen, S., Holopainen, T., and Vapaavuori, E. (2005). Structural characteristics and chemical composition of birch (Betula pendula) leaves are modified by increasing CO2 and ozone. Glob. Chang. Biol. 11, 732–748. doi: 10.1111/j.1365-2486.2005.00938.x
Oliveira, L. S., Santana, A. L. B. D., Maranhão, C. A., de Miranda, R. C. M., de Lima, V. L. A. G., da Silva, S. I., et al. (2010). Natural resistance of five woods to Phanerochaete chrysosporium degradation. Int. Biodeterior. Biodegradation 64, 711–715. doi: 10.1016/j.ibiod.2010.08.001
Parsons, W. F. J., Bockheim, J. G., and Lindroth, R. L. (2008). Independent, interactive, and species-specific responses of leaf litter decomposition to elevated CO2 and O3 in a northern hardwood forest. Ecosystems 11, 505–519. doi: 10.1007/s10021-008-9148-x
Pettersen, R. C. (1984). “The chemical composition of wood,” in The Chemistry Of Solid Wood, Advances In Chemistry Series 20, ed. R. M. Rowell (Washington DC: ACS publishing), 57–126.
R Core Team (2019). R: A Language And Environment For Statistical Computing. Vienna: R Foundation for Statistical Computing.
Richet, N., Afif, D., Huber, F., Pollet, B., Banvoy, J., El Zein, R., et al. (2011). Cellulose and lignin biosynthesis is altered by ozone in wood of hybrid poplar (Populus tremula × alba). J. Exp. Bot. 62, 3575–3586. doi: 10.1093/jxb/err047
Richet, N., Afif, D., Tozo, K., Pollet, B., Maillard, P., Huber, F., et al. (2012). Elevated CO2 and/or ozone modify lignification in the wood of poplars (Populus tremula × alba). J. Exp. Bot. 63, 4291–4301. doi: 10.1093/jxb/ers118
Sakai, A., and Sakai, S. (1998). A test for the resource remobilization hypothesis: tree sprouting using carbohydrates from above-ground parts. Ann. Bot. 82, 213–216. doi: 10.1006/anbo.1998.0672
Santana, A. L. B. D., Maranhão, C. A., Santos, J. C., Cunha, F. M., Conceição, G. M., Bieber, L. W., et al. (2010). Antitermitic activity of extractives from three Brazilian hardwoods against Nasutitermes corniger. Int. Biodeterior. Biodegradation 64, 7–12. doi: 10.1016/j.ibiod.2009.07.009
Shi, C., Kitao, M., Agathokleous, E., Watanabe, M., Tobita, H., Yazaki, K., et al. (2016). Foliar chemical composition of two oak species grown in a free-air enrichment system with elevated O3 and CO2. J. Agric. Meteorol. 72, 50–58. doi: 10.2480/agrmet.d-14-00018
Sigurdsson, B. D., Medhurst, J. L., Wallin, G., Eggertsson, O., and Linder, S. (2013). Growth of mature boreal Norway spruce was not affected by elevated [CO2] and/or air temperature unless nutrient availability was improved. Tree Physiol. 33, 1192–1205. doi: 10.1093/treephys/tpt043
Takahashi, M., Feng, Z., Mikhailova, T. A., Kalugina, O. V., Shergina, O. V., Afanasieva, L. V., et al. (2020). Air pollutionmonitoring and tree and forest decline in East Asia: a review. Sci. Total Environ. 742:140288. doi: 10.1016/j.scitotenv.2020.140288
Taylor, A. M., Gartner, B. L., and Morrell, J. J. (2002). Heartwood formation and natural durability – a review. Wood Fiber Sci. 34, 587–611.
Taylor, A. M., Gartner, B. L., Morrell, J. J., and Tsunoda, K. (2006). Effects of heartwood extractive fractions of Thuja plicata and Chamaecyparis nootkatensis on wood degradation by termites or fungi. J. Wood Sci. 52, 147–153. doi: 10.1007/s10086-005-0743-6
Tobita, H., Komatsu, M., Harayama, H., Yazaki, K., Kitaoka, S., and Kitao, M. (2019). Effects of combined CO2 and O3 exposures on net CO2 assimilation and biomass allocation in seedlings of the late-successional Fagus Crenata. Climate 7:117. doi: 10.3390/cli7100117
Valette, N., Perrot, T., Sormani, R., Gelhaye, E., and Morel-Rouhier, M. (2017). Antifungal activities of wood extractives. Fungal Biol. Rev. 31, 113–123. doi: 10.1016/j.fbr.2017.01.002
Vernay, A., Malagoli, P., Fernandez, M., Perot, T., Améglio, T., and Balandier, P. (2018). Carry-over benefit of high internal N pool on growth and function of oak seedlings (Quercus petraea) competing with Deschampsia cespitosa. For. Ecol. Manag. 41, 130–138. doi: 10.1016/j.foreco.2018.03.039
Walker, A. P., de Kauwe, M. G., Medlyn, B. E., Zaehle, S., Iversen, C. M., Asao, S., et al. (2019). Decadal biomass increment in early secondary succession woody ecosystems is increased by CO2 enrichment. Nat. Commun. 10:454. doi: 10.1038/s41467-019-08348-1
Watanabe, M., Hoshika, Y., Inada, N., and Koike, T. (2018). Photosynthetic activity in relation to a gradient of leaf nitrogen content within a canopy of Siebold’s beech and Japanese oak saplings under elevated ozone. Sci. Total Environ. 636, 1455–1462. doi: 10.1016/j.scitotenv.2018.04.423
Watanabe, M., Hoshika, Y., Inada, N., Wang, X., Mao, Q., and Koike, T. (2013). Photosynthetic traits of Siebold’s beech and oak saplings grown under free air ozone exposure in northern Japan. Environ. Pollut. 174, 50–56. doi: 10.1016/j.envpol.2012.11.006
Watanabe, M., Yamaguchi, M., Matsumura, H., Kohno, Y., and Izuta, T. (2008). Effects of ozone on the growth and photosynthesis of Castanopsis sieboldii seedlings grown under different nitrogen loads. J. Agric. Meteorol. 64, 143–155. doi: 10.2480/agrmet.64.3.6
Watanabe, M., Yamaguchi, M., Tabe, C., Iwasaki, M., Yamashita, R., Funada, R., et al. (2007). Influences of nitrogen load on the growth and photosynthetic responses of Quercus serrata seedlings to O3. Trees 21, 421–432. doi: 10.1007/s00468-007-0134-2
Watanabe, Y., Satomura, T., Sasa, K., Funada, R., and Koike, T. (2010). Differential anatomical responses to elevated CO2 in saplings of four hardwood species. Plant Cell Environ. 33, 1101–1111. doi: 10.1111/j.1365-3040.2010.02132.x
Yamada, T., Nagakura, J., and Hirai, K. (2021). Post-outplanting growth of containerized seedlings of Cryptomeria japonica and Chamaecyparis obtusa in growth media containing wood ash. Jpn. J. For. Environ. 63, 31–38. (in Japanese with English summary)
Yamaguchi, M., Kinose, Y., Matsumura, H., and Izuta, T. (2019). Evaluation of O3 effects on cumulative photosynthetic CO2 uptake in seedlings of four Japanese deciduous broad-leaved forest tree species based on stomatal O3 uptake. Forests 10:556. doi: 10.3390/f10070556
Yamaguchi, M., Watanabe, M., Matsumura, H., Kohno, Y., and Izuta, T. (2011). Experimental studies on the effects of ozone on growth and photosynthetic activity of Japanese forest tree species. Asian J. Atmos. Environ. 5, 65–78. doi: 10.5572/ajae.2011.5.2.065
Keywords: carbon dioxide, ozone, holocellulose, lignin, solvent extractive, stem wood, organic constituent
Citation: Ugawa S, Hashimoto S, Hashida K, Tobita H and Kitao M (2021) Composition of Organic Carbon-Based Compounds in the Stem Wood of Quercus mongolica Seedlings Grown Under Elevated CO2 and/or O3 Concentrations. Front. For. Glob. Change 4:768953. doi: 10.3389/ffgc.2021.768953
Received: 01 September 2021; Accepted: 03 November 2021;
Published: 03 December 2021.
Edited by:
Alessandra De Marco, Italian National Agency for New Technologies, Energy and Sustainable Economic Development (ENEA), ItalyReviewed by:
Lina Fusaro, Institute for BioEconomy, National Research Council (CNR), ItalyTakayoshi Koike, Hokkaido University, Japan
Tamara Jakovljevic, Croatian Forest Research Institute, Croatia
Copyright © 2021 Ugawa, Hashimoto, Hashida, Tobita and Kitao. This is an open-access article distributed under the terms of the Creative Commons Attribution License (CC BY). The use, distribution or reproduction in other forums is permitted, provided the original author(s) and the copyright owner(s) are credited and that the original publication in this journal is cited, in accordance with accepted academic practice. No use, distribution or reproduction is permitted which does not comply with these terms.
*Correspondence: Shin Ugawa, dXNoaW5AYWdyaS5rYWdvc2hpbWEtdS5hYy5qcA==