 Marina Corrêa Scalon1,2*
 Amabily Bohn1,2
 Geraldo Ceni Coelho2,3
 Luana Meister1
 Rangel de Freitas Alves1,2
 Rubia Tatiana Secco1,2
 Victor P. Zwiener4
 Vinicius Marcilio-Silva1
 Weverton C. F. Trindade1,2
 Marcia C. M. Marques1
- 1Laboratório de Ecologia Vegetal, SCB, Universidade Federal do Paraná, Curitiba, Brazil
- 2Programa de Pós-graduação em Ecologia e Conservação, Universidade Federal do Paraná, Curitiba, Brazil
- 3Programa de Pós-graduação em Ciência e Tecnologia Ambiental, Universidade Federal da Fronteira Sul, Chapecó, Brazil
- 4Laboratório de Ecologia e Biogeografia de plantas, Departamento de Biodiversidade, Setor Palotina, Universidade Federal do Paraná, Palotina, Brazil
Absolute growth rates change with tree size and age, shifting throughout species ontogeny. The study on interspecific variation in plant traits has generated important insights into the life-history strategies and their consequences for ecosystem functioning. However, it remains unknown to what extent – and even if – species’ functional traits are related to the variation in their growth trajectories. We set out to model growth trajectories of 45 woody species from the Brazilian Atlantic Forest in a secondary subtropical forest under regeneration, aiming to understand if species can be grouped by their growth patterns throughout ontogeny and if these groups could be classified in distinct ecological strategies based on key plant traits. We used a maximum likelihood estimation approach to predict growth trajectories using three ecologically relevant parameters [maximum growth rate (Gmax), diameter at maximum growth rate (Dopt), and the ontogenetic variability in growth rate (K)] followed by multivariate analyses to detect associations among phylogenetic relationships, plant traits, and growth parameters and classify species into growth pattern groups. Across species, growth trajectory parameters varied widely. The cluster analysis identified three distinct groups based on growth trajectories parameters, which were not functionally or ecologically well defined. Our findings supports the idea that traits describing plant size and tree shape, such as maximum height, canopy volume and height to diameter ratio, were generally the best predictors of species growth parameters throughout ontogeny, even though traits representing resource-use and reproductive strategies also played a significant role. Growth-trait framework can be understood as a continuum of multi-trait combinations where, at one end of the gradient, we find trees with higher growth rate and larger diameters supporting a voluminous canopy combined with lower investment in leaf tissue and smaller diaspore; at the other end, taller trees supporting a smaller canopy with higher investment in leaf tissue and longer diaspore. Ultimately, we have shown that tree architecture, leaf and reproductive traits significantly influence growth trajectory along tree ontogeny, which may be the reason why objectively grouping species based on growth-trajectories parameters is ineffective, at least in highly diverse secondary subtropical forests undergoing regeneration.
Introduction
Plant growth rates drive landscape productivity and carbon sequestration and are determinants of species competitive abilities (Grime, 1977; Westoby et al., 2002). Thus, understanding their drivers is crucial not only to determine the structure, composition and dynamics of forests, but also to uncover how vegetation will respond to human-induced disturbances and climate change (Rees et al., 2001; Beer et al., 2010). However, in addition to a strong variation among species, there is a markedly variability within species throughout ontogeny (Clark and Clark, 1999; Herault et al., 2011), which makes predicting growth rates particularly challenging. Indeed, the main factors underpinning interspecific and intraspecific variation in growth rates remain contested (Bowman et al., 2013; Paine et al., 2015), but should be generally related to plant traits that describe carbon use strategies.
The relationship between plant growth rate and traits have been extensively studied (Chaturvedi et al., 2011; Visser et al., 2016; Wills et al., 2018; Gray et al., 2019). Growth rate is positively associated with maximum tree height (Rüger et al., 2012), maximum diameter (Herault et al., 2011; Visser et al., 2016), and key leaf traits, such as N and P leaf concentration, C:N ratio, and maximum photosynthetic assimilation rates (Wills et al., 2018; Gray et al., 2019). On the other hand, growth rate usually shows negative correlation with wood density (Herault et al., 2011; Rüger et al., 2012; Paine et al., 2015; Visser et al., 2016; Chaturvedi et al., 2021) and seed mass (Adler et al., 2014; Paine et al., 2015; Visser et al., 2016). These relationships reveal important trade-offs between growth rates and the ecological strategies describing resource use, spanning from conservative to acquisitive strategies, which directly relates to tissue construction costs (Wright et al., 2004; Chave et al., 2009).
Consequently, it is expected that the correlation between growth rates and plant traits to be strongly influenced by ontogeny between the newly germinated seedling and the mature individual, since the proportion of different tissues changes throughout the plant life, altering the costs associated with it. In woody species, the contribution of leaf mass to the total biomass of the individual tends to decrease along the ontogeny, while the contribution of stem biomass tends to increase (Falster et al., 2018). Therefore, to fully understand the relationship between growth and plant traits, there is the need to account for intraspecific variation over plant ontogenetic stages (Herault et al., 2011). This ontogenetic perspective on growth rate can provide an understanding of species-specific growth trajectories shape, which can potentially significantly vary among tree species in highly diverse tropical forests and unravel meaningful relationships with species ecological strategies. Determining the drivers of plant growth rates is particularly relevant in tropical forests, since they account for a significant proportion of global primary productivity (Beer et al., 2010).
One of the first attempts to model growth trajectory curves and group tropical forest species based on an objective characterization of size-growth relationship resulted in 41 species groups, with few of them revealing ecological affinities between the tree species (Vanclay, 1991), which discouraged such approach. However, with a further understanding of the trade-offs involved in functional traits and growth (Poorter et al., 2008; Baraloto et al., 2010; Gibert et al., 2016; Visser et al., 2016) and a significant advance in the development of a trait-based model of growth through ontogeny (Canham et al., 2004; Herault et al., 2011), we may elucidate how traits can help explain growth trajectories of tropical tree species.
While the search for relationships between plant traits and tree growth has advanced in recent years, our ability to use this information to classify species into groups and explain ecological processes is still incipient. For example, during the secondary succession, seminal studies have identified ecological groups unique to each phase of the succession, based on characteristics such as shade tolerance, diaspore characteristics (type, size, and quantity), life cycle and type of growth (Budowski, 1965; Brokaw, 1985; Swaine and Whitmore, 1988). Early succession sites are occupied by pioneer species that grow rapidly, reproduce and die within an interval of less than 30 years (Chazdon, 2008), ensuring rapid colonisation of the newly opened area. In more advanced sites, non-pioneer species (early and late secondary) grow slowly and have a long cycle, ensuring a longer stay in the ecosystem. Despite the recognition that two more contrasting strategies are present at the extremes of the successional gradient, we still cannot fully understand how species characteristics respond and how they are explained in an environmental gradient of light availability and soil physical and chemical attributes. Thus, if the growth trajectory of a species can be associated with plant traits representing a range of individual functions, it would be possible to better predict the ecosystem effects of a given species during ecological succession. This information is potentially useful for understanding the successional process and for planning tropical forest restoration and management.
In our study, we explored the determinants of growth trajectories in a secondary subtropical forest undergoing regeneration, with two major aims. Firstly, we modelled growth trajectories for each of the most abundant species and investigated if they could be aggregated into different growth trajectory groups. Secondly, we assessed whether key leaf, stem and reproductive traits explain variation in growth parameters among species. This approach can potentially classify species into groups using objective parameters and provide optimisation for tropical forest species growth modelling and yield predictions. In addition, by including ecologically descriptive information exploring the relationship between growth and functional traits, this study can be useful for understanding forest dynamics and its structure more broadly.
Specifically, we sought to answer the following questions:
1. Can we classify species into groups based on growth trajectories patterns? We expect that species will show unique growth trajectories, which will be aggregated into groups with similar growth habits.
2. Will these formed groups describe different ecological strategies at the community level? We expect that species groups resulting from growth patterns will exhibit distinct sets of plant traits.
3. Will species stem economics traits explain growth strategy parameters? Based on previous findings, we expect that maximum absolute diameter growth rate will increase with adult stature and decrease with increasing wood density whereas species with lower wood density should result in greater ability to modulate growth rates and respond to external factors throughout ontogeny.
4. What is the influence of reproductive (seed and diaspore size) and leaf traits on growth? We expect that maximum growth rates will be associated with traits representing a more resource-acquisitive strategy, such as higher specific leaf area and leaf N concentration and lower leaf dry matter content and seed and diaspore length.
Materials and Methods
Site Description
Study areas were in two private nature reserves operated by the Society for Wildlife Research and Environmental Education (SPVS, a non-governmental organization) in the Antonina municipality in the state of Paraná, southern Brazil (“Guaricica” Nature Reserve – 25°19′S, 45°42′W, 8600 ha; the “das Águas” Nature Reserve – 25°21′S, 48°46′W, 508 ha). This is a well preserved region and a total 68% of area is occupied by forests in advanced stages of succession (Kauano et al., 2012). Climate is humid subtropical (Cfa in the Köppen system), with annual averages of 3300 mm rainfall and 20°C (Ferretti and De Britez, 2006).
The sample design was established in areas that were once deforested for pasture for cattle grazing in 1980’ years and later abandoned to recover through natural regeneration, and which varied in age since abandonment. The age of each area was established by overlapping aerial photos, vegetation map, and through interviews with residents of the region. From this information, it was possible to place the sample plots into four age classes since abandonment: 7 – 16, 20 – 30, 35 – 55, and >85 years. These permanent plots have been monitored for the last 10 years, since 2010. We considered the areas of >85 years old as old growth forests (sensu Chazdon, 2014), since their species richness is similar to others previous studies in old growth forests in the region (Liebsch et al., 2008; Marques et al., 2014; Martins et al., 2015; Dalmaso et al., 2020). The plots were randomly selected in both Reserves and were distributed over two soils types, Cambisol and Gleysol. Within each age class, we delimited 10 circular (14 m radius) plots (except > 85), totalizing 35 plots occupying 2.2 ha. In old forests (>85 years), we limited the number of plots to five, due to the difficulty of finding regions of the lowland forests in advanced stages of succession. In all plots, we identified and measured (DBH, height) all trees (DBH ≥5 cm) in 2010 and 2016. All specimens were identified by using specialised literature and comparison with material in herbarium. When vegetal material was reproductive, vouchers were deposited in the herbarium UPCB of the Universidade Federal do Paraná.
Survey and Cleaning Protocol
The first survey resulted in 3,726 individuals of 235 woody species, and the second 3,901 individuals of 238 species [see Cequinel et al. (2018) and Capellesso et al. (2020) for details]. As a long-term study, here we use a part of the dataset that has been accumulated over the last 15 years from one of the longest running projects done in the Brazilian Atlantic Forest. Previous studies have focused on diverse issues associated with succession theory. For example, Cequinel et al. (2018) explored the factors that determine the structuring of communities in succession and Capellesso et al. (2020) explored the factors that determine carbon accumulation in succession communities. Both addressed community and ecosystem-related theories, which differ greatly from the questions posed in this study (organismic theories). We selected only individuals that survived in the second survey for this study. We indistinctly accessed the growth of individuals growing in the four successional phases. This procedure was necessary because (1) of the difficulty in finding a sufficient number of individuals in all stages, and (2) we wanted to capture the maximum growth variation within each species, in the different environmental conditions of each successional stage. Despite relying on only two growth measurement censuses within 5 years interval (2010 and 2016), our diameter cutoff of >5 cm, rather than the commonly used 10 cm diameter cutoff for tropical forests, provides information for the earlier life-history stages (Clark and Clark, 1999).
We selected the number of species and individuals for the study after possible errors in data collection were eliminated. Then, we proceeded with the following cleaning protocol: First, when DBH had decreased by more than 5% before census, it was deemed as an unreasonable measurement, following common practices for growth datasets (Condit et al., 1993). After, all additional unreasonable high measurements were deleted after plotting for being visually an obvious outlier (i.e., exceeding maximum annual growth by 50%). The clean dataset comprised records of 1,728 individuals of 45 species from the different successional stages (Supplementary Table 1), with species having at least 10 individuals with at least two individuals sampled in each quartile of the species DBH range. The selected 45 species represented over 80% of the stand basal area.
Trait Data
We selected thirteen traits that are direct or indirectly associated with tree growth and resource use (Supplementary Table 2). Data from leaf traits and tree size (height and DBH – crown and stem) were collected during field expeditions in 2016 [more details in Capellesso et al. (2020)] and are available. All measurements followed standardised protocols for functional traits measurements, according to Perez-Harguindeguy et al. (2016). Maximum Height (Hmax) and Maximum Diameter (Dmax) are the maximum values of height and diameter measured for each species. Canopy Volume (CV) was calculated according to Antin et al. (2013), which considers the crown as half-ellipsoid shape:
Where, CV is canopy volume (m3), CA is the Canopy Area (m2) obtained from the projection of two perpendicular measured radius of the crown (CA = radius1 × radius2 × ∏) and CD is Canopy Depth (m) obtained by the difference between total height and crow base height. Tree Height:Diameter Ratio (HDR) was calculated for each species from the maximum height divided by the maximum diameter of that species. Specific Leaf Area (SLA) was calculated as the ratio of leaf fresh area to leaf dry mass, whereas Leaf Dry-Mass Content (LDMC) was calculated as the ratio of leaf dry mass and leaf saturated mass. Leaf Carbon Content (Cfoliar) and Leaf Nitrogen Content (Nfolair) were obtained by combustion with elemental analyser Vario EL III (Elementar Analysensysteme Comp., Hanau, Germany). Leaf Carbon–Nitrogen ratio (C:N) was calculated as the ratio of the carbon to nitrogen leaf concentration and Nitrogen content by area (Narea) was calculated as the ratio of Narea by SLA. Seed Length (SL), Diaspore Length (DL), and Wood Density (WD) were obtained from literature in published and unpublished databases (Burkart and Reitz, 1979; Lorenzi, 2002; Carvalho, 2003; Wanderley, 2003; Zanne et al., 2009; Zimermann Oliveira et al., 2019; Kattge et al., 2020).
Our traits dataset presented only 6% of missing information and we used random forest technique for imputation of the missing data. We used the “missForest” package in R (Stekhoven and Bühlmann, 2012) that performs more accurately than other approaches for various trait types (Stekhoven and Bühlmann, 2012; Penone et al., 2014) (Supplementary Table 3).
Data Analyses
All analyses were performed using the statistical environment R 4.0.1 (R Core Team, 2019).
To fit species-specific growth trajectories curves, we followed Canham et al. (2004) growth-model equation, an individual-based model where the absolute growth rate (AGR) is assumed to vary with the DBH of the target tree species in a one-dimensional log-normal function. This equation yields to three ecological meaningful parameters: the maximum ontogenetic variation rate (Gmax), the DBH where the growth rate achieves its maximum (Dopt) and the kurtosis of the curve (K), representing the ontogenetic variation in growth rate:
We fitted models using maximum likelihood estimation and simulated annealing (Goffe et al., 1994), assuming residuals to be normally distributed. The function “anneal” from the package “likelihood” (Murphy, 2012) was used and resulted in global algorithms converging on the global maximum for all species.
We then performed model-based cluster analyses to identify species groups using the three growth trajectories parameters (Gmax, Dopt, and K) as input and the R package “mclust” (Scrucca et al., 2016), enabling us to verify if species could be aggregated into distinctive groups based on their growth trajectory shapes (Question 1).
Comparing Traits
Prior to the analyses, we checked for data normality and transformed variables accordingly (specifically, we log10-transformed Dopt, Gmax, K, Canopy volume, Dmax, Seed and Diaspore lengths, SLA, Cleaf, and Narea). We also checked for data multicollinearity using the function “vif” (variance inflation factor – VIF) from the package “car” (Fox et al., 2012) and removing variables when VIF ≥ 10 to avoid multicollinearity between variables (Hair et al., 1995). After the VIF analysis, only Narea was removed, totalling 12 independent variables.
To investigate specific trait differences between the groups suggested by the cluster analyses (Question 2), we used a multivariate analyses of variance (MANOVA) followed by one-way ANOVA’s for each trait. We used Tukey-Kramer post-hoc tests, appropriate for different sample sizes, to verify differences between the groups when ANOVA P-values were significant (<0.05), using package “agricolae” (de Mendiburu, 2021).
To understand which traits better explained growth parameters obtained from growth-trajectories models (Questions 3 and 4), we built three individual linear regression models for Gmax, Dopt and K as response variables with all the 12 traits as independent factors. We then used the function dredge from the package “MuMIn” (Barton and Barton, 2015) to select the best model based on corrected Akaike’s information criteria (AICc).
Comparing Species Growth Trajectories and the Phylogenetic Relationship
We accessed the phylogenetic relationship between the studied plant species based on the phylogenetic supertree proposed by Smith and Brown (2018) with dates from Magallón et al. (2015). This super tree was built based on the most recent phylogenetic relationships proposed by Chase et al. (2016). The manipulation of the phylogenetic supertree was done on the “V.PhyloMaker” package (Jin and Qian, 2019).
Based on the phylogenetic relationship of the species used in this study, we calculated the cophenetic distance between species based on the phylogeny (PhyDist). We then checked for relationships between the Phylogenetic Distance and growth by performing Mantel tests between PhyDist and distance matrices based on the growth trajectories parameters (Gmax, Dopt, and K) all together and separately. We also checked for phylogenetic signals in growth trajectories parameters of each species by using the lambda (λ) index (Pagel, 1999) and the K-statistic (Blomberg et al., 2003), both checked for significant phylogenetic signal based on 10,000 randomizations (Ives et al., 2007). The cophenetic distance was calculated on the “stats” and the Mantel tests performed in the “ape” packages. The phylogenetic tree figures and the phylogenetic signal analyses were built using “phytools” package (Revell, 2012).
Results
Using only diameter growth measurements over time (mm year–1) as an input, we developed growth trajectories curves with the Canham et al. (2004) model for the 45 Atlantic forest woody species (Figure 1 and Supplementary Figure 1). Individual species growth trajectories from which Gmax, Dopt, and K were estimated as shown in Supplementary Figure 1 and parameter estimations can be found in Supplementary Table 1. Maximum growth rate (Gmax) varied from 0.34 mm year–1 for Rudgea jasminoides to 5.66 mm year–1 for Vochysia bifalcata, and averaged 1.98 mm year–1 across species. Optimum diameter, where species reach maximum growth rates, ranged from 51.66 to 566.49 mm, averaging 159.70 mm. There was a peak at intermediate stem diameters showing a strong influence of tree size on growth rates (Figure 1A). For the majority of species, maximum growth was reached at less than 50% of their potential size. Only eight out of the 45 species attained maximum growth rate at over 70% of their maximum size. The ontogenetic variation, represented by K estimates, varied from 0.18, implying a strong size-dependency growth peak (such as for Garcinia gardneriana), to 2.99, which can be translate to a flat growth curve (such as for Jacaranda puberula, Myrsine coriacea and Rudgea jasminoides), averaging 1.41 for all species (Supplementary Table 1).
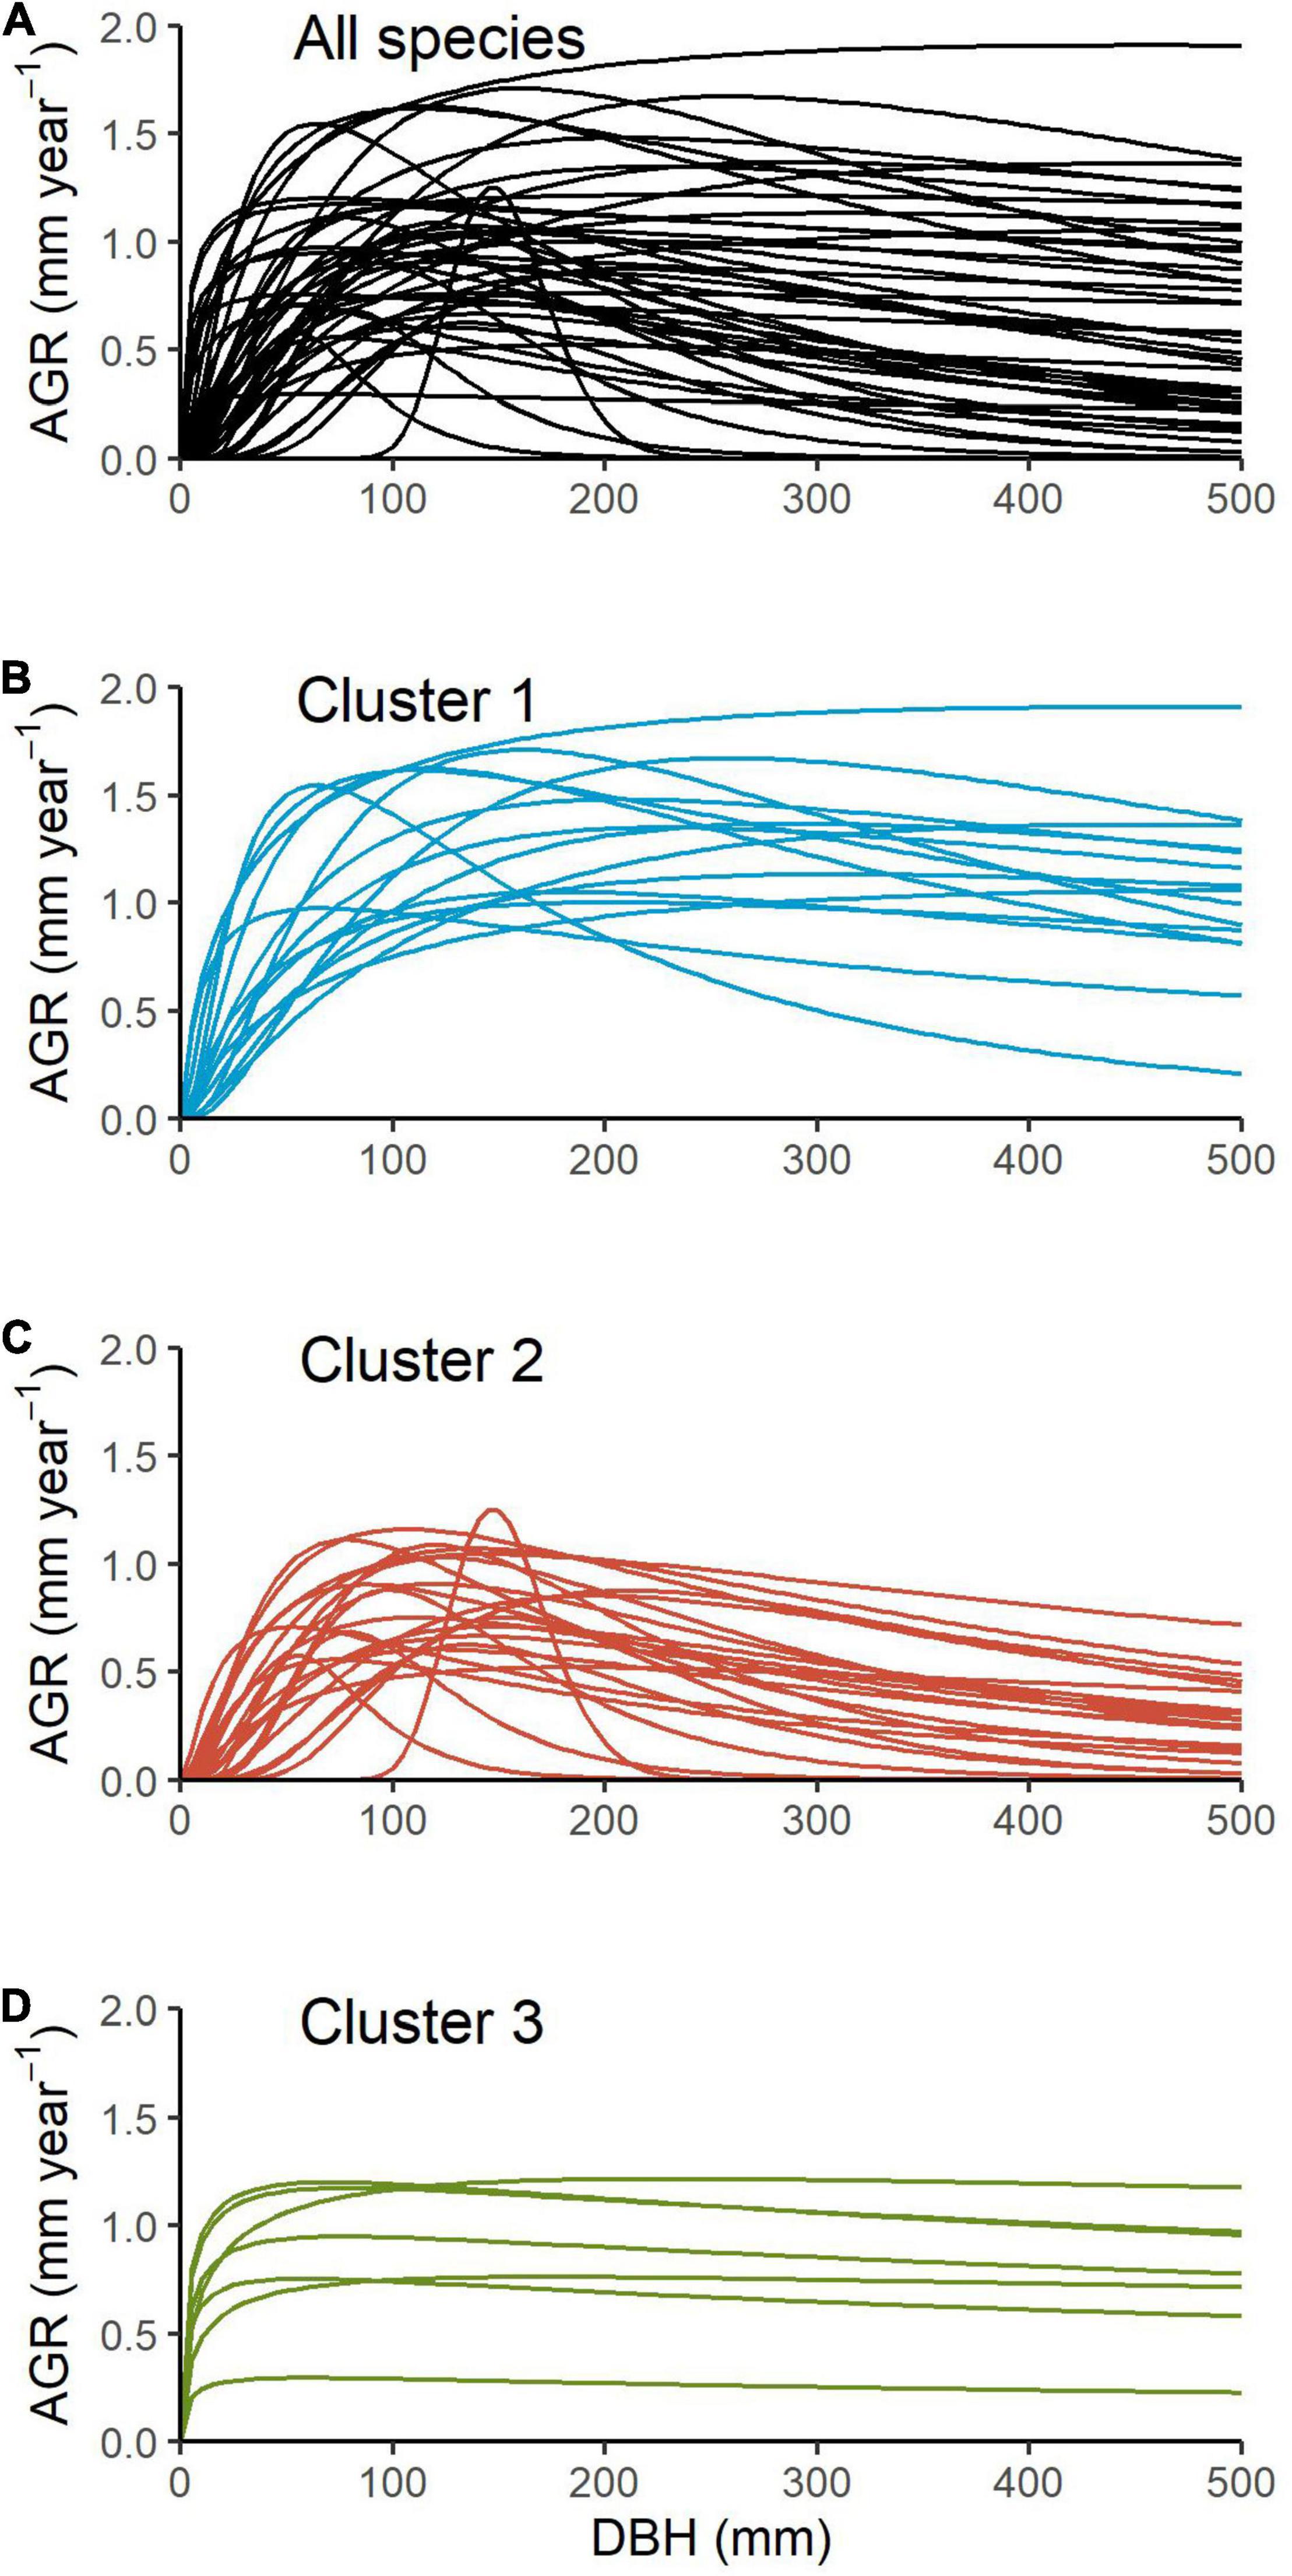
Figure 1. Modelled growth trajectories based on the relationship between diameter at breast height (DBH, mm) and the log-transformed annual growth rate (AGR, mm year–1) for 45 tropical species (A), and separated into groups identified by cluster analysis: Cluster 1 composed of 15 species (B), Cluster 2 of 23 species (C) and Cluster 3 of 7 species (D).
Cluster analysis identified three species groups, where Cluster 1 was represented by 15 species, Cluster 2 by 23 species and Cluster 3 by 7 species (Supplementary Figures 2, 3). The mean posterior probability for a species belonging to a cluster was 0.348, 0.497, and 0.155, respectively. There were marked differences in growth trajectories shapes between the three distinct groups (Figures 1B–D). Cluster 1 was characterized by species with higher maximum growth rates (mean ± sd: 3.09 ± 1.20) and higher Dopt (mean ± sd: 241.12 ± 149.03), whereas Cluster 2 was composed by species with lower Gmax and Dopt but a marked ontogenetic influence on growth (i.e., low K; mean ± sd: 0.83 ± 0.31); Cluster 3 also showed species with lower Gmax and Dopt but a flat growth curve (i.e., high K; mean ± sd: 2.94 ± 0.08).
The first two principal components of the PCA explained 47.44% of the data variation. First component was mostly related to tree structure (Hmax, Dmax, canopy volume and HDR), while PC2 was more related to leaf and reproductive traits (Figure 2A). However, there was not a clear separation between the three groups formed by the cluster analyses using growth parameters. Direct comparison between traits from species groups also did not show differences for the majority of the traits analysed. Most differences occurred between Cluster 1 and 2 regarding HDR, Dmax, canopy volume and diaspore length (Figures 2B–E), but we found mixed trait response for species forming Cluster 3. Cluster 1 species showed lower HDR and diaspore sizes, but higher Dmax and canopy volume compared to Cluster 2 species. Cluster 3 species showed similar Dmax and canopy volume to Cluster 2 (lower than Cluster 1) but smaller diaspore (similar to Cluster 1).
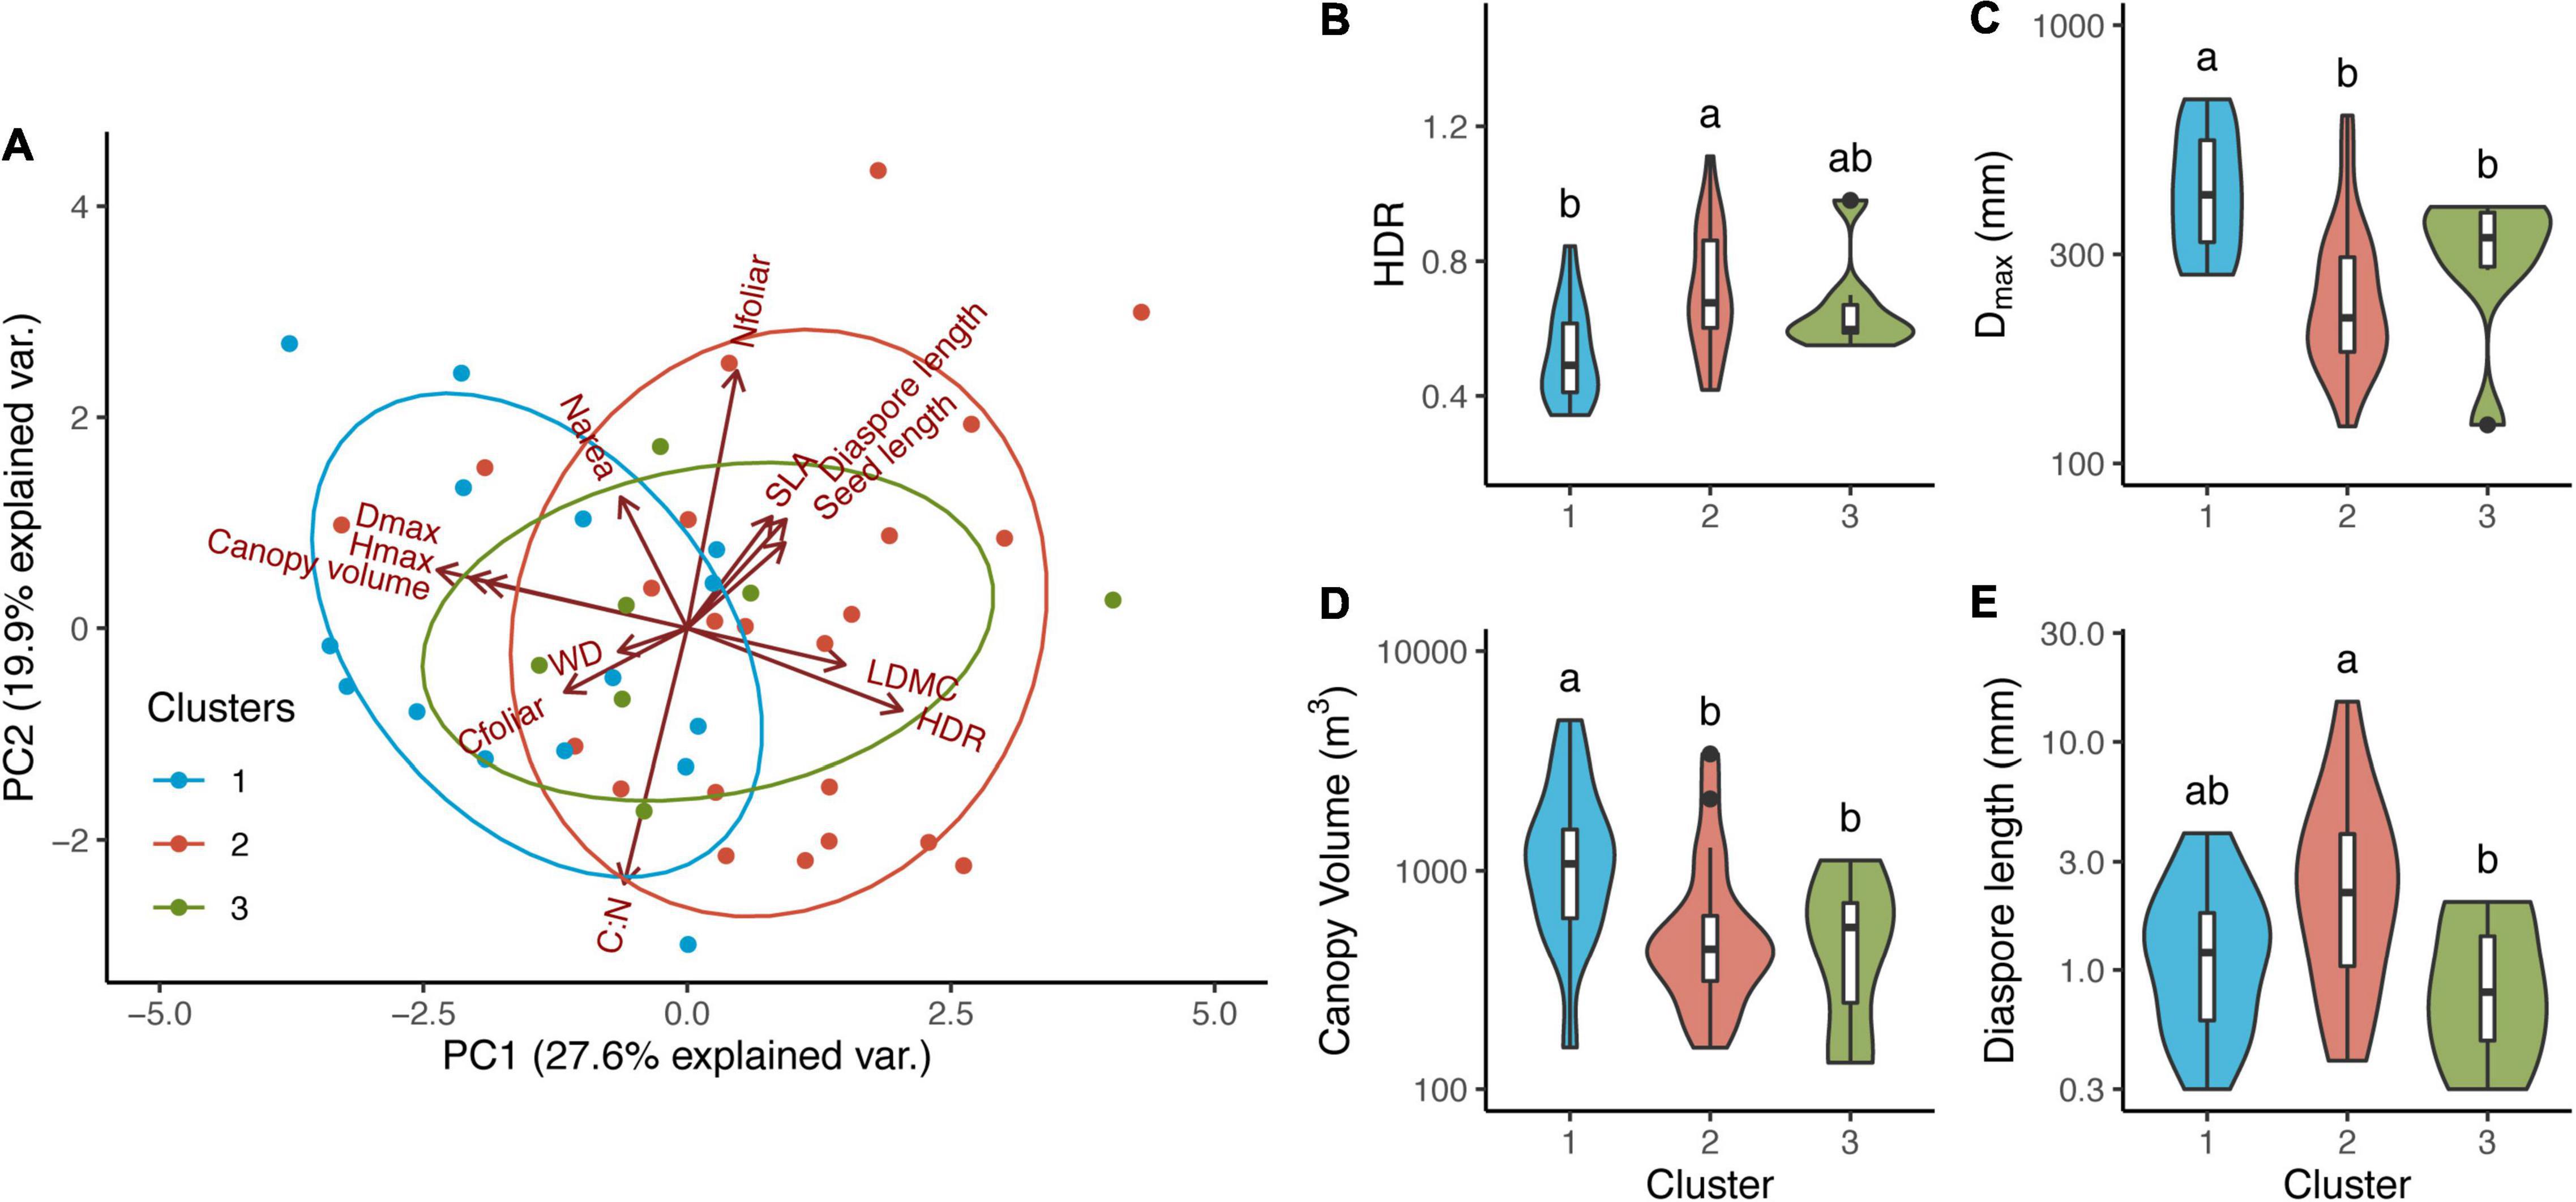
Figure 2. Principal component (PC1 and PC2) analysis of 13 plant traits (A) and direct comparison between groups and traits (B–E). Principal component scores calculated per species (45 species) classified into three different groups identified using model-based cluster analysis for growth parameters: Cluster 1 (15 species, blue circles); Cluster 2 (23 species, red circles) and Cluster 3 (7 species, green circles). Boxplots showing median, 25° e 75° percentis. Vertical curves represent kernel densities estimates as a function of the probability density for each parameter. Variables as follow: Narea, nitrogen concentration per leaf area (g m–2); Narea, leaf nitrogen concentration per mass (%); SLA, specific leaf area (m2 g–1); WD, wood density; Diaspore length (mm); Seed length (mm); LDMC, leaf dry matter content (g g–1); C:N, leaf C to N ratio; Cfoliar, leaf C concentration (%), Hmax, maximum species height (m); Dmax, maximum species diameter (cm); HDR, height to diameter ratio; Canopy volume (m3).
Gmax was best predicted by a regression model that included Hmax, Dmax and leaf C concentration, while Dopt was better predicted by LDMC and canopy volume (Table 1). The ontogenetic response to growth, represented by parameter K, was better predicted by the model that included diaspore and seed length, wood density, Hmax and Narea (Table 1). Species that achieved higher maximum growth rates also achieved greater diameters (higher Dmax) and exhibited higher canopy volume and higher leaf C concentration, but lower LDMC and lower HDR (Figures 3A–E and Table 2). The optimum diameter (Dopt) was also positively related to canopy volume, Hmax and Dmax, but negatively associated with HDR and LDMC (Figures 3F–J). Species with greater ontogenetic growth variation were also the ones achieving greater sizes (higher Dmax and Hmax, reflected in lower HDR; Figures 3K–M), but also associated with lower diaspore length (Figure 3N and Table 2).
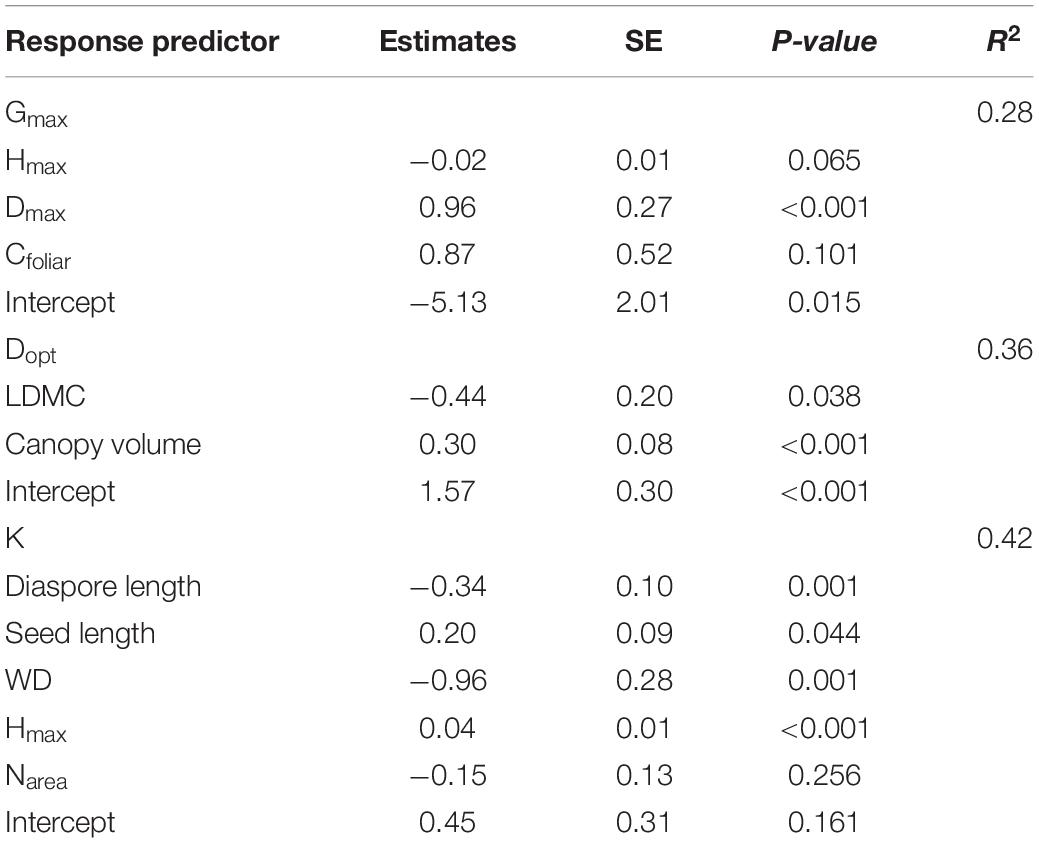
Table 1. Estimated coefficients, adjusted intervals and P-values for each of the best model predictors for maximum growth rate (Gmax), diameter at maximum growth rate (Dopt), and the ontogenetic variability in growth rate (K). Full model correlation coefficients (R2) are also shown. All models were significant at P < 0.001. Abbreviations as follow: maximum height (Hmax), maximum diameter (Dmax), leaf carbon content (Cfoliar), leaf dry-mass content (LDMC), wood density (WD), nitrogen content (Narea).
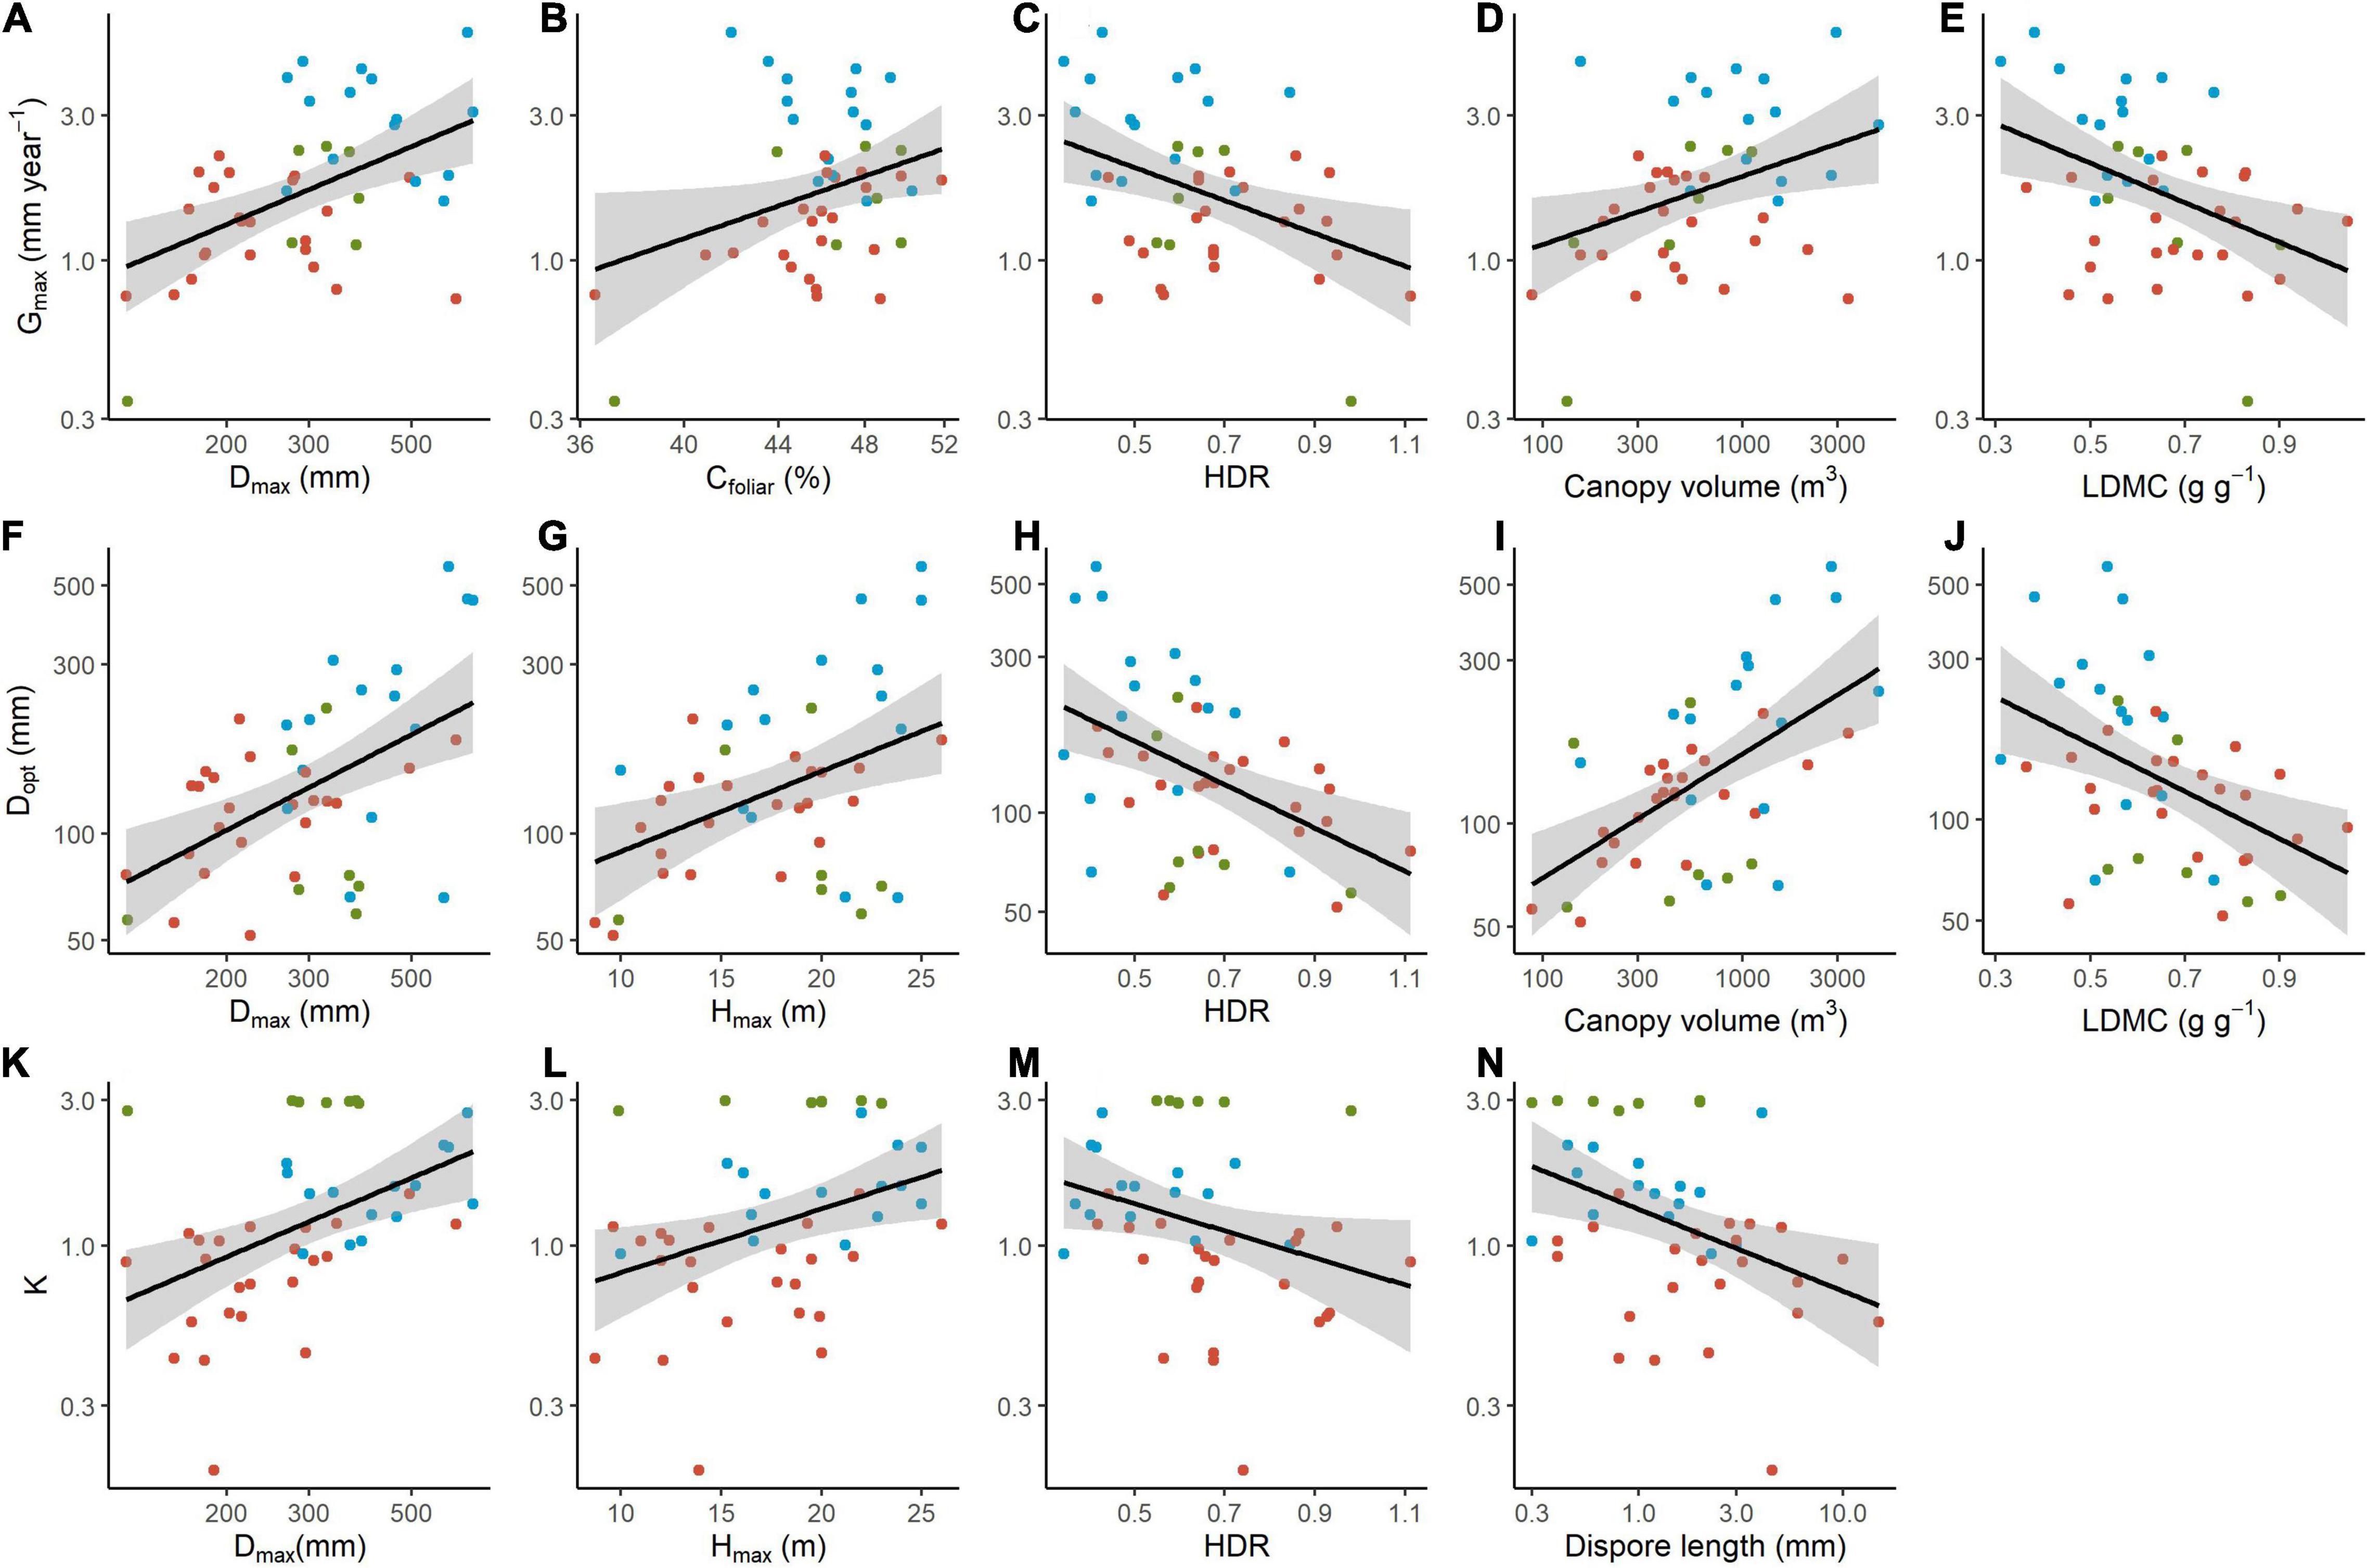
Figure 3. Relationship between growth parameters and traits measured for 45 tropical tree species. (A–E) Maximum growth rate (Gmax); (F–J) Diameter size at maximum growth rate (Dopt); and (K–N) ontogenetic variation in growth rate (K) relationship with maximum species diameter (Dmax), maximum species height (Hmax) leaf C concentration (Cfoliar), height to diameter ratio (HDR), Canopy volume, leaf dry matter content (LDMC) and Diaspore length. All variables were log-transformed before analyses. Only significant regression slopes are shown (P-value < 0.05). Different colours represent different groups identified by cluster analysis: Cluster 1 (15 species, blue circles); Cluster 2 (23 species, red circles) and Cluster 3 (7 species, green circles). Correlation R2 and P-values can be found in Table 2.
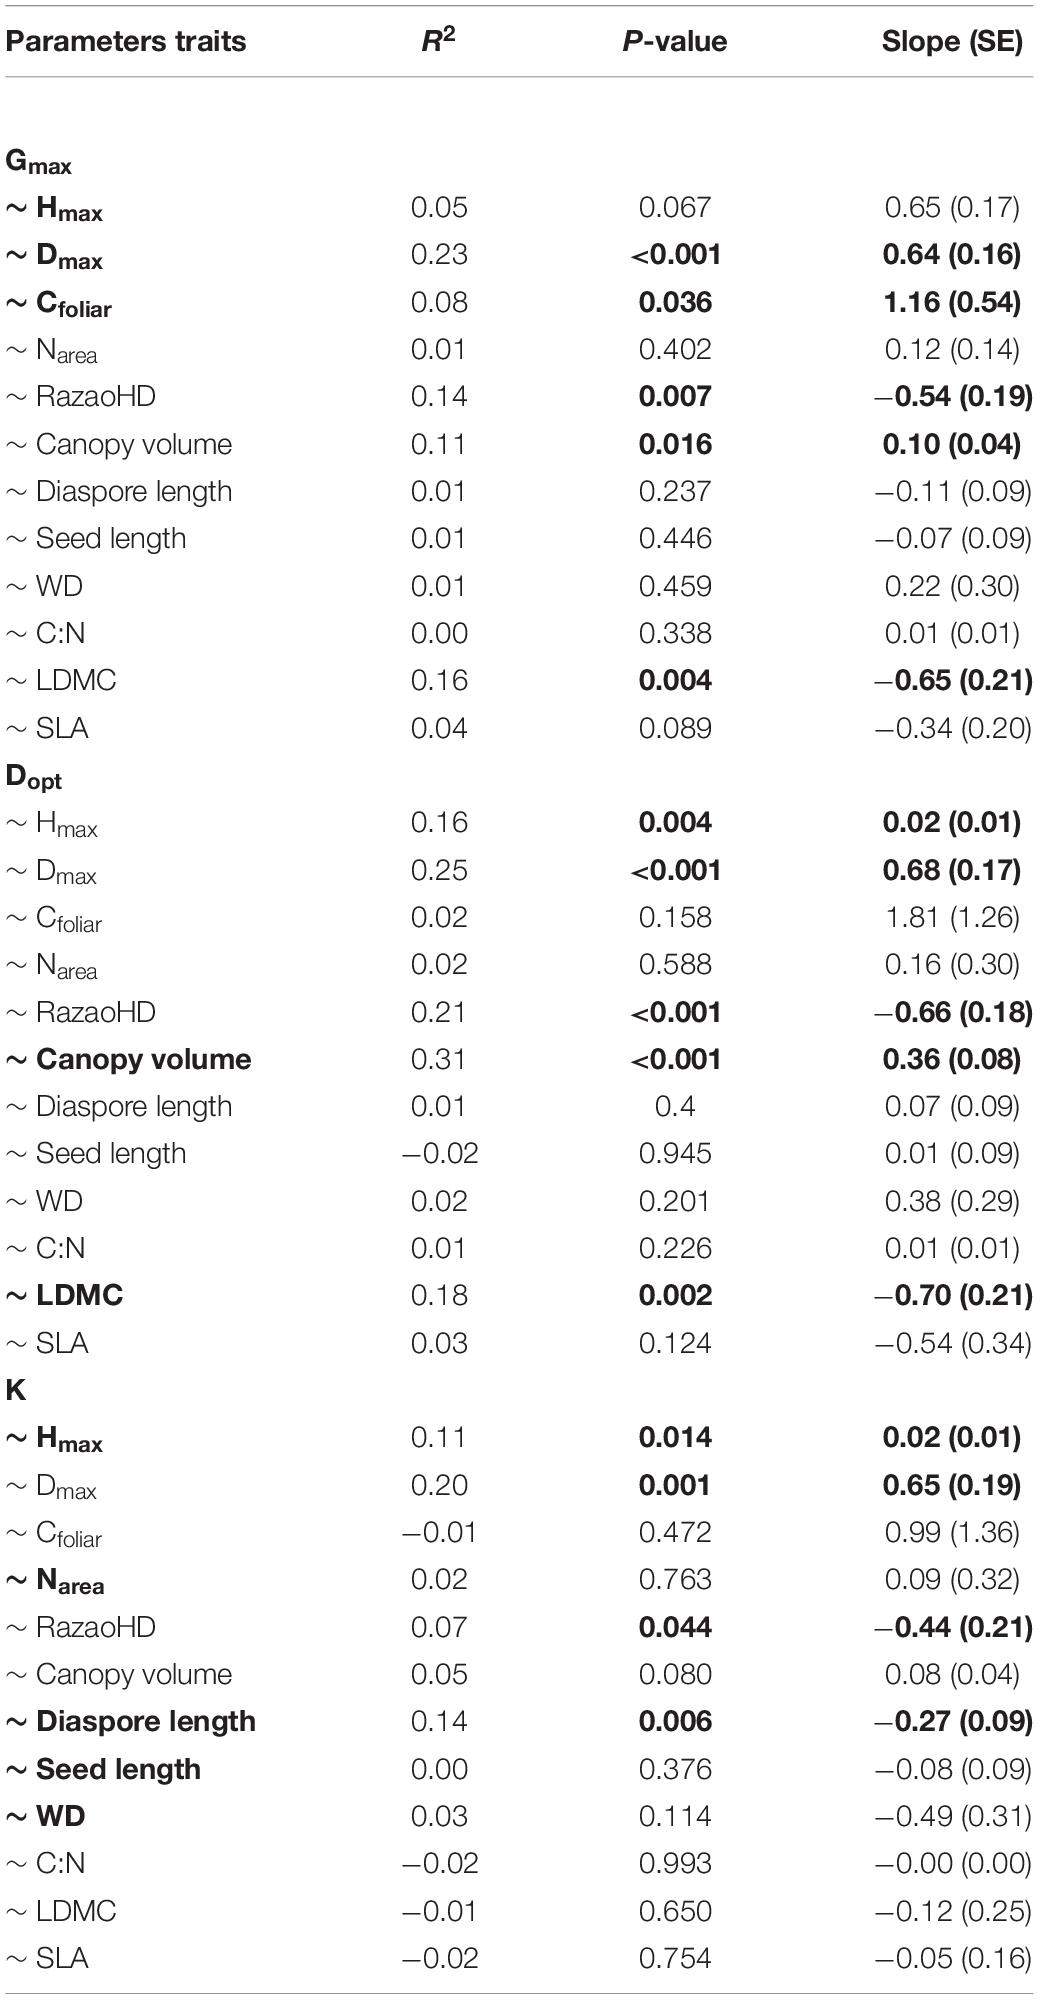
Table 2. Regression statistics for individual linear regressions between growth trajectory parameters (maximum growth rate – Gmax, diameter at maximum growth rate – Dopt, and the ontogenetic variability in growth rate – K) and traits (maximum height – Hmax, maximum diameter – Dmax, leaf carbon content – Cfoliar, nitrogen content -Narea, leaf dry-mass content -LDMC, height to diameter ratio – RatioHD, Canopy volume, Diaspore length, seed length, wood density -WD, leaf carbon–nitrogen ratio – C:N, specific leaf area – SLA) for 45 tropical tree species. Tree species list are provided in Supplementary Table 1. Parameters in bold represent the best model. Significant P-values and slopes are also highlighted in bold.
Although we found no correlation between phylogenetic distance (PhyDist) and the growth trajectory parameters (together and separately; Mantel tests P > 0.05), we found phylogenetic signals for Gmax by both methods (λ = 0.5532, P = 0.0054; K = 0.3791, P = 0.0055, Supplementary Figure 4). We also checked the phylogenetic signal for all traits that show relation with Gmax (Hmax, Dmax, Cfoliar, Canopy volume and LDMC). We found signals on Dmax (K = 0.3553, P = 0.0232) and Cfoliar (λ = 0.7221, P = 0.0054; K = 0.4645, P = 0.0049). Thus, to contrast whether the relations between Gmax and Dmax and Cfoliar were mediated by the phylogenetic structure of the relationship among the analysed species, we decompose the phylogeny in orthogonal eigenvectors (Diniz-Filho et al., 1998) and performed linear models using each trait (Dmax and Cfoliar) and the three first eigenvectors to predict the Gmax. When using the phylogenetic structure as cofactor, the relation between Gmax and Dmax is still significant, but not for Cfoliar (Supplementary Table 4), indicating that the relationship between Gmax and Cfoliar is mediated by the phylogenetic structure.
Discussion
Growth rate is commonly interpreted as a single parameter, which can be considered an oversimplification, since it changes throughout tree ontogeny. Here, by considering growth as a multi-trait value across a lifetime describing it in three different modelled parameters, we aimed at better understanding the influence of commonly measured plant traits on plant growth. We modelled growth trajectories of 45 woody species from the Brazilian Atlantic Forest in a secondary subtropical forest undergoing regeneration, and investigated the relationship between growth patterns and key functional traits. We found that, while there was not a clear patterning of traits by trajectory clusters, growth parameters were related to tree architecture, leaf and reproductive traits. Our results represent a first investigation into how growth trajectories and plant traits are related in Atlantic Forest woody species using a regeneration gradient, and here we discuss general outcomes and possible explanations for our findings.
Grouping Species Into Growth-Trajectories Strategies
We have found three distinct groups with different growth trajectory shapes (Question 1): Cluster 1, composed of canopy and sub-canopy species with fast growth rates that respond opportunistically to light; Cluster 2, composed of understory species with slow maximum growth and higher investment in leaf tissue; and Cluster 3 composed of small sub-canopy shade-tolerant trees with constant slow growth rate. The majority of species were classified within cluster 1 (15 species) and 2 (23 species) marked by a size-dependent growth, with only 7 species in cluster 3. Size-dependent growth might be favoured as a strategy probably because growth increasing with tree size would provide better access to light and larger canopy area, representing a larger photosynthetic area (Sterck et al., 2003), a clear advantage for increasing carbon assimilation in closed-canopy environments.
However, although model-based clustering may be helpful to identify general ecological-evolutionary distinctions among species, we noted a large overlap concerning species traits, and few traits that allowed for a clear distinction among the groups (Figure 2). Moreover, by looking at species within the groups formed and the traditional succession classification of species into gap-dependent and shade-tolerant species (Lieberman et al., 1985; Clark and Clark, 1992) and across forest strata (i.e., canopy vs. understory), the three groups are composed of mixed species with various distinctive succession strategies. Thus, here we argue that the general relationship between traits and growth parameters may better contribute to elucidate resource use trade-offs than grouping species into mutually exclusive classes.
Grouping species into “functional groups” or guilds may have numerous advantages in ecology, from enabling better predictions of patterns and processes generality to minimising the cost associated with field studies, especially in high species diversity systems (Swaine and Whitmore, 1988). However, contrary to our expectations (Question 2), it was not possible to describe ecologically meaningful groups based on modelled growth parameters, at least not for the 45 species considered in our study. One possible reason is that our data encompasses a regeneration gradient, with species and individuals growing on a range of successional stages and environmental conditions. Even though we did not evaluate specific differences between stages, we should not disregard that there may be different growth strategies among these successional stages. During succession, there is a variation in environmental conditions and resources over time that can directly influence tree growth, such as changes in light availability modulating tree height investment (Chazdon, 2008; Iida et al., 2011). Indeed, the growth–trait relationships vary along environmental gradients (Paine et al., 2015). Biotic interactions (Bongers et al., 2020) or even community composition and diversity (Thomas and Vesk, 2017; Bongers et al., 2020) significantly influences the relationship between traits and growth rates. Nonetheless, these differences in successional stages are common in old-growth tropical forests, where natural disturbances often trigger regeneration and successional processes (Chazdon, 2003) and should play a similar role in forest dynamics and species growth trajectories.
Trait-Growth Relationships
As expected (Question 3), maximum height and maximum diameter measured for the species were positively associated with most of the growth-trajectories parameters (i.e., Gmax, K, and Dopt) meaning that tree size is generally important in describing growth, as also noted by earlier studies (Lieberman et al., 1985; Swaine and Whitmore, 1988; Clark and Clark, 1992). In addition, tree architecture, such as the height-diameter ratio (HDR) and canopy volume (CV) were also important, both explaining differences between the groups (Figure 2) and correlating with growth trajectories parameters (Figure 3). Specifically, the height-diameter ratio seems to be a key variable to describe growth strategies throughout the tree life. Together, our findings corroborate that those traits describing plant size and general tree shape (Hmax, Dmax, CV and HDR) were generally the best predictors of species growth parameters throughout ontogeny. In fact, they describe one of the axes of variation regarding the capacity for competitive dominance (Hodgson et al., 1999), which is a major aspect in forest dynamics, structure and composition. In a canopy-closed environment, such as tropical forests, trees that invest in height could have an adaptive advantage compared to shorter ones, because their leaves would have more access to light (Poorter et al., 2005). Therefore, they can shade competitors and elevate reproductive or dispersal organs to the canopy (Aarssen, 1995). However, to maintain stability with high heights and a large canopy, trees have to invest in higher wood density or in larger diameters (Niklas, 1994; King et al., 2006). Species that can grow larger to a given height and support a larger canopy achieve higher Dopt and Gmax compared to species that invest more on height than on diameter and bear a smaller canopy. Moreover, species with high HDR (more height than diameter) have a more accentuated peak in growth rate at a certain size throughout ontogeny (lower value of K), while species with low HDR (more diameter than height) grow more constantly.
Interestingly, wood density (WD) proved to add little explanatory power to growth parameters, although it contributes to K best model, which also included diaspore and seed length, Hmax and Narea, suggesting that the ontogenetic behaviour of the species growth trajectory (K) is driven by a multi-set of traits. Contrary to our expectations (Question 3) and to previous findings in tropical forests from Australia (Gray et al., 2019), Panama (Rüger et al., 2012) and French Guiana (Herault et al., 2011), the relationship between K and WD was negative, meaning that the greater ontogenetic flexibility concerning growth is not prevented by a higher wood density. Perhaps, in a subtropical rainforest context, wood density is not a decisive factor for survival or competition between species. Indeed, according to Chave et al. (2009), the Subtropical Atlantic Rain Forest is the region where forest communities show the lowest wood density ranges in Brazil, for yet unknown reasons. The negative correlation of K with diaspore size and positive with Hmax and Dmax (Figure 3) indicates that the investment in the early stage survival is associated with smaller plants but with greater ontogenetic flexibility in terms of growth, which may favour the use of scarce opportunities to obtain light. Larger seeds increase the probability of successful seedling establishment and plant persistence (Westoby et al., 2002; Moles et al., 2005), although it is associated with low survival and growth in later ontogenetic phase, at least in early successional stages (Coelho et al., 2016).
Although leaf traits have often been uninformative in explaining larger trees growth rates (Wright et al., 2010, Herault et al., 2011; Paine et al., 2015), in our study key leaf traits were also important describing growth trajectories, together with structural traits, as predicted (Question 4). Indeed, SLA did not help explain any of the growth parameters, but leaf dry matter content (LDMC) was an important factor explaining Dopt (Table 1) and negatively related to Gmax and Dopt (Table 2 and Figure 3). LDMC is considered a better predictor of aboveground net primary productivity than SLA (Smart et al., 2017) and a better variable to locate the plant species on the resource-use axis of variation (Wilson et al., 1999). While LDMC tends to be negatively related to growth rates (Cornelissen et al., 2003), as found in our study, a positive influence of SLA on growth rate is expected, since SLA indicates the efficiency of biomass investment for a given light interception (Reich et al., 1998). However, possibly because ontogenetic changes in leaf to wood ratio, SLA and growth traits, despite correlated for seedlings, are mostly uncorrelated in larger trees (Poorter et al., 2008; Rüger et al., 2012; Paine et al., 2015; Gibert et al., 2016; Wright et al., 2019). During early life, when leaves comprise a large part of the plant, increasing SLA has an overwhelmingly positive effect on growth rate (Gibert et al., 2016; Falster et al., 2018). As trees increase in size, light interception and carbon gain depend not only on leaf area, but also are largely determined by the whole tree architecture (Sterck and Bongers, 2001) and the costs and benefits associated with SLA variation (Westoby and Wright, 2003). A second possible reason is that self-shading in the crow decreases light interception (Duursma et al., 2010), dissipating the effect of SLA on resource acquisition. In addition, the Cfoliar relationship with ontogenetic variation deserves further investigation. At this point, we are not capable to affirm if this relation is indeed causal or an artefact of the phylogeny, since our analyses showed it was mainly mediated by the phylogenetic structure of the relationships among the species.
Finally, it is important to highlight that here we used a secondary forest regenerating after a severe disturbance in a relatively short time as a model to test the relationship between growth and functional traits. As the most threatened tropical forest in the world (Laurance, 2009; Ribeiro et al., 2011), the Brazilian Atlantic Forest has only 10% conserved mature forest in small and isolated patches and therefore, most of the biome is composed by secondary forests undergoing regeneration (Ribeiro et al., 2009). Undoubtedly, there are expected changes in forest structure, species composition and functional diversity along an age gradient in secondary succession (Chazdon, 2008), which could have influenced our findings. However, earlier studies in the area showed that despite the taxonomic diversity being higher in late successional stages, species turnover remained relatively constant along the time gradient (see Cequinel et al., 2018). This could be explained by a rapid recovery during succession facilitated by nearby forested areas (Cheung et al., 2010) through increasing landscape connectivity and seed dispersal processes (Zwiener et al., 2014). Additional studies on the relationship of growth trajectories and functional traits within old-growth and secondary tropical forests are still needed to untangle the mechanisms underlying this system.
Conclusion
Our findings showed that aggregating species within well-defined groups based on growth parameters was especially challenging. The lack of discreet grouping highlights the complex set of strategies for tree resource acquisition and survival in this highly diverse tropical system. We propose that there is a continuum regarding tree architecture, leaf and reproductive traits that influence growth parameters. The extremes in this continuum are represented by: (1) Trees that can grow larger than taller, supporting a voluminous canopy, with lower LDMC and smaller diaspore, achieving higher maximum diameter and growth rate, but maintaining a more constant growth through ontogeny; and (2) Trees that grow taller than larger, supporting smaller canopy, with higher LDMC and longer diaspore, achieving maximum growth rate at a given size during ontogeny. Our study represents a novel approach and a first exploration on the relationship of growth trajectories and traits for tropical forest species under restoration, however, the complexity and variation of megadiverse tropical forests represent a major challenge, as such it would benefit from a longer time interval for growth measurements and the inclusion of more species. Further studies on this particular topic hold significant potential to disentangle the drivers of intraspecific and interspecific growth variation, especially by considering growth as a multi-parameter variable.
Data Availability Statement
Publicly available datasets were analyzed in this study. This data can be found here: https://doi.org/10.1016/j.ppees.2018.08.007 and http://dx.doi.org/10.5380/bdc/34.
Author Contributions
MS and MM conceived the idea, questions and hypotheses, and developed study design and methodology. MM, GC, VM-S, VZ, AB, LM, RA, RS, and WT collected the data. MS, VM-S, AB, and WT analysed the data. MS led the writing of the manuscript. MM obtained the funding. All authors critically contributed to the drafts and gave final approval for publication.
Funding
The study was supported by CNPq (Conselho Nacional de Pesquisa e Desenvolvimento) (Grants 577336/2008-8; CNPq 475127/2008-0) and O Boticário Foundation (FGB 0801_20082). MS was supported by a postdoctoral fellowship and AB, RA, RS, and WT were supported by a Ph.D. fellowship from CAPES (Coordenação de Aperfeiçoamento de Pessoal de Nível Superior), Brazil. MM received financial support by CNPq (Grant 303356/2019-7).
Conflict of Interest
The authors declare that the research was conducted in the absence of any commercial or financial relationships that could be construed as a potential conflict of interest.
Publisher’s Note
All claims expressed in this article are solely those of the authors and do not necessarily represent those of their affiliated organizations, or those of the publisher, the editors and the reviewers. Any product that may be evaluated in this article, or claim that may be made by its manufacturer, is not guaranteed or endorsed by the publisher.
Acknowledgments
We are grateful to Sociedade de Pesquisa em Vida Selvagem e Educação Ambiental, for allowing the study in their reserves; to Fernanda C. G. Cardoso, Elivane S. Capelesso and Anamaria Cequinel for providing the fieldwork and the general dataset organization; and to both reviewers who provided suggestions that were important to achieve the final manuscript.
Supplementary Material
The Supplementary Material for this article can be found online at: https://www.frontiersin.org/articles/10.3389/ffgc.2022.754656/full#supplementary-material
References
Aarssen, L. W. (1995). Hypotheses for the evolution of apical dominance in plants: implications for the interpretation of overcompensation. Oikos 74, 149–156.
Adler, P. B., Salguero-Gómez, R., Compagnoni, A., Hsu, J. S., Ray-Mukherjee, J., Mbeau-Ache, C., et al. (2014). Functional traits explain variation in plant life history strategies. Proc. Natl. Acad. Sci. U.S.A. 111, 740–745. doi: 10.1073/pnas.1315179111
Antin, C., Pélissier, R., Vincent, G., and Couteron, P. (2013). Crown allometries are less responsive than stem allometry to tree size and habitat variations in an Indian monsoon forest. Trees 27, 1485–1495. doi: 10.1007/s00468-013-0896-7
Baraloto, C., Timothy Paine, C., Poorter, L., Beauchene, J., Bonal, D., Domenach, A. M., et al. (2010). Decoupled leaf and stem economics in rain forest trees. Ecol. Lett. 13, 1338–1347. doi: 10.1111/j.1461-0248.2010.01517.x
Beer, C., Reichstein, M., Tomelleri, E., Ciais, P., Jung, M., Carvalhais, N., et al. (2010). Terrestrial gross carbon dioxide uptake: global distribution and covariation with climate. Science 329, 834–838. doi: 10.1126/science.1184984
Blomberg, S. P., Garland, T. Jr., and Ives, A. R. (2003). Testing for phylogenetic signal in comparative data: behavioral traits are more labile. Evolution 57, 717–745. doi: 10.1111/j.0014-3820.2003.tb00285.x
Bongers, F. J., Schmid, B., Sun, Z., Li, Y., Härdtle, W., von Oheimb, G., et al. (2020). Growth–trait relationships in subtropical forest are stronger at higher diversity. J. Ecol. 108, 256–266. doi: 10.1111/1365-2745.13242
Bowman, D. M., Brienen, R. J., Gloor, E., Phillips, O. L., and Prior, L. D. (2013). Detecting trends in tree growth: not so simple. Trends Plant Sci. 18, 11–17. doi: 10.1016/j.tplants.2012.08.005
Brokaw, N. V. (1985). Gap-phase regeneration in a tropical forest. Ecology 66, 682–687. doi: 10.2307/1940529
Budowski, G. (1965). Distribution of tropical American rain-forest species in the light of successional processes. Turrialba 15, 40–42.
Canham, C. D., LePage, P. T., and Coates, K. D. (2004). A neighborhood analysis of canopy tree competition: effects of shading versus crowding. Can. J. For. Res. 34, 778–787. doi: 10.1139/x03-232
Capellesso, E. S., Cequinel, A., Marques, R., and Marques, M. C. M. (2020). Temporal and environmental correlates of carbon stocks in a regenerating tropical forest. Appl. Veget. Sci. 23, 353–362. doi: 10.1111/avsc.12487
Carvalho, P. E. R. (2003). Espécies Arbóreas Brasileiras - Brasília: Embrapa Informação Tecnológica. Colombo: Embrapa Florestas.
Cequinel, A., Capellesso, E. S., Marcilio-Silva, V., Cardoso, F. C., and Marques, M. C. (2018). Determinism in tree turnover during the succession of a tropical forest. Perspect. Plant Ecol. Evol. Syst. 34, 120–128. doi: 10.1890/11-1180.1
Chase, M. W., Christenhusz, M., Fay, M., Byng, J., Judd, W. S., Soltis, D., et al. (2016). An update of the Angiosperm Phylogeny Group classification for the orders and families of flowering plants: APG IV. Bot. J. Linn. Soc. 181, 1–20. doi: 10.1111/boj.12385
Chaturvedi, R. K., Raghubanshi, A. S., and Singh, J. S. (2011). Leaf attributes and tree growth in a tropical dry forest. J. Veget. Sci. 22, 917–931. doi: 10.1111/j.1654-1103.2011.01299.x
Chaturvedi, R. K., Tripathi, A., Raghubanshi, A. S., and Singh, J. S. (2021). Functional traits indicate a continuum of tree drought strategies across a soil water availability gradient in a tropical dry forest. For.Ecol. Manag. 482:118740. doi: 10.1016/j.foreco.2020.118740
Chave, J., Coomes, D., Jansen, S., Lewis, S. L., Swenson, N. G., and Zanne, A. E. (2009). Towards a worldwide wood economics spectrum. Ecol. Lett. 12, 351–366. doi: 10.1111/j.1461-0248.2009.01285.x
Chazdon, R. L. (2003). Tropical forest recovery: legacies of human impact and natural disturbances. Perspect. Plant Ecol. Evol. Syst. 6, 51–71. doi: 10.1078/1433-8319-00042
Chazdon, R. L. (2008). Chance and determinism in tropical forest succession. Trop. For. Commun. Ecol. 10, 384–408.
Chazdon, R. L. (2014). Second Growth. The Promise of Tropical Forest Regeneration in an Age of Deforestation. Chicago, IL: Chicago Press.
Cheung, K. C., Liebsch, D., and Marques, M. C. M. (2010). Forest recovery in newly abandoned pastures in Southern Brazil: implications for the Atlantic Rain Forest resilience. Natureza Conservação 8, 66–70.
Clark, D. A., and Clark, D. B. (1992). Life history diversity of canopy and emergent trees in a neotropical rain forest. Ecol. Monogr. 62, 315–344. doi: 10.2307/2937114
Clark, D. A., and Clark, D. B. (1999). Assessing the growth of tropical rain forest trees: issues for forest modeling and management. Ecol. Applic. 9, 981–997. doi: 10.1890/1051-0761(1999)009[0981:atgotr]2.0.co;2
Coelho, G. C., Benvenuti-Ferreira, G., Schirmer, J., and Lucchese, O. A. (2016). Survival, growth and seed mass in a mixed tree species planting for Atlantic Forest restoration. AIMS Environ. Sci. 3, 382–394.
Condit, R., Hubbell, S. P., and Foster, R. B. (1993). Identifying fast-growing native trees from the Neotropics using data from a large, permanent census plot. For. Ecol. Manag. 62, 123–143. doi: 10.1016/0378-1127(93)90046-p
Cornelissen, J. H. C., Lavorel, S., Garnier, E., Diaz, S., Buchmann, N., Gurvich, D. E., et al. (2003). A handbook of protocols for standardised and easy measurement of plant functional traits worldwide. Aust. J. Bot. 51, 335–380. doi: 10.1071/bt02124
Dalmaso, C. A., Marques, M. C., Higuchi, P., Zwiener, V. P., and Marques, R. (2020). Spatial and temporal structure of diversity and demographic dynamics along a successional gradient of tropical forests in southern Brazil. Ecol. Evol. 10, 3164–3177. doi: 10.1002/ece3.5816
Diniz-Filho, J. A. F., de Sant’Ana, C. E. R., and Bini, L. M. (1998). An eigenvector method for estimating phylogenetic inertia. Evolution 52, 1247–1262. doi: 10.1111/j.1558-5646.1998.tb02006.x
Duursma, R. A., Mäkelä, A., Reid, D. E., Jokela, E. J., Porté, A. J., and Roberts, S. D. (2010). Self-shading affects allometric scaling in trees. Funct. Ecol. 24, 723–730. doi: 10.1111/j.1365-2435.2010.01690.x
Falster, D. S., Duursma, R. A., and FitzJohn, R. G. (2018). How functional traits influence plant growth and shade tolerance across the life cycle. Proc. Natl. Acad. Sci. U.S.A. 115, E6789–E6798. doi: 10.1073/pnas.1714044115
Ferretti, A. R., and De Britez, R. M. (2006). Ecological restoration, carbon sequestration and biodiversity conservation: the experience of the Society for Wildlife Research and Environmental Education (SPVS) in the Atlantic Rain Forest of Southern Brazil. J. Nat. Conserv. 14, 249–259. doi: 10.1016/j.jnc.2006.04.006
Fox, J., Weisberg, S., Adler, D., Bates, D., Baud-Bovy, G., Ellison, S., et al. (2012). Package ‘Car’. Vienna: R Foundation for Statistical Computing, 16.
Gibert, A., Gray, E. F., Westoby, M., Wright, I. J., and Falster, D. S. (2016). On the link between functional traits and growth rate: meta-analysis shows effects change with plant size, as predicted. J. Ecol. 104, 1488–1503. doi: 10.1111/1365-2745.12594
Goffe, W. L., Ferrier, G. D., and Rogers, J. (1994). Global optimization of statistical functions with simulated annealing. J. Econom. 60, 65–99. doi: 10.1016/0304-4076(94)90038-8
Gray, E. F., Wright, I. J., Falster, D. S., Eller, A. S., Lehmann, C., Bradford, M. G., et al. (2019). Leaf: wood allometry and functional traits together explain substantial growth rate variation in rainforest trees. AoB Plants 11:plz024. doi: 10.1093/aobpla/plz024
Grime, J. (1977). Evidence for the existence of three primary strategies in plants and its relevance to ecological and evolutionary theory. Am. Natural. 111, 1169–1194. doi: 10.1086/283244
Hair, J. F. Jr., Anderson, R. E., Tatham, R. L., and Black, W. C. (1995). Multivariate Data Analysis, 3rd Edn. New York, NY: Macmillan.
Herault, B., Bachelot, B., Poorter, L., Rossi, V., Bongers, F., Chave, J., et al. (2011). Functional traits shape ontogenetic growth trajectories of rain forest tree species. J. Ecol. 99, 1431–1440. doi: 10.1111/j.1365-2745.2011.01883.x
Hodgson, J., Wilson, P., Hunt, R., Grime, J., and Thompson, K. (1999). Allocating CSR plant functional types: a soft approach to a hard problem. Oikos 85, 282–294. doi: 10.2307/3546494
Iida, Y., Kohyama, T. S., Kubo, T., Kassim, A. R., Poorter, L., Sterck, F., et al. (2011). Tree architecture and life-history strategies across 200 co-occurring tropical tree species. Funct. Ecol. 25, 1260–1268. doi: 10.1111/j.1365-2435.2011.01884.x
Ives, A. R., Midford, P. E., and Garland, T. Jr. (2007). Within-species variation and measurement error in phylogenetic comparative methods. Syst. Biol. 56, 252–270. doi: 10.1080/10635150701313830
Jin, Y., and Qian, H. (2019). V. PhyloMaker: an R package that can generate very large phylogenies for vascular plants. Ecography 42, 1353–1359. doi: 10.1111/ecog.04434
Kattge, J., Bönisch, G., Díaz, S., Lavorel, S., Prentice, I. C., Leadley, P., et al. (2020). TRY plant trait database–enhanced coverage and open access. Glob. chang. Biol. 26, 119–188. doi: 10.1111/gcb.14904
Kauano, ÉE., Torezan, J. M. D., Cardoso, F. C. G., and Marques, M. C. M. (2012). Landscape structure in the northern coast of Paraná state, a hotspot for the brazilian Atlantic Forest conservation. Rev. Árvore 36, 961–970. doi: 10.1590/s0100-67622012000500018
King, D. A., Davies, S. J., Tan, S., and Noor, N. S. M. (2006). The role of wood density and stem support costs in the growth and mortality of tropical trees. J. Ecol. 94, 670–680. doi: 10.1111/j.1365-2745.2006.01112.x
Laurance, W. F. (2009). Conserving the hottest of the hotspots. Biol. Conserv. 142:1137. doi: 10.1016/j.biocon.2008.10.011
Lieberman, D., Lieberman, M., Hartshorn, G., and Peralta, R. (1985). Growth rates and age-size relationships of tropical wet forest trees in Costa Rica. J. Trop. Ecol. 1, 97–109. doi: 10.1017/s026646740000016x
Liebsch, D., Marques, M. C., and Goldenberg, R. (2008). How long does the Atlantic Rain Forest take to recover after a disturbance? Changes in species composition and ecological features during secondary succession. Biol. Conserv. 141, 1717–1725. doi: 10.1016/j.biocon.2008.04.013
Lorenzi, H. (2002). Árvores brasileiras: Manual de Identificação e Cultivo de Plantas Arbóreas Nativas do Brasil. Nova Odessa: Plantarum, 384.
Magallón, S., Gómez-Acevedo, S., Sánchez-Reyes, L. L., and Hernández-Hernández, T. (2015). A metacalibrated time-tree documents the early rise of flowering plant phylogenetic diversity. New Phytol. 207, 437–453. doi: 10.1111/nph.13264
Marques, M., Zwiener, V. P., Ramos, F. M., Borgo, M., and Marques, R. (2014). Forest structure and species composition along a successional gradient of Lowland Atlantic Forest in Southern Brazil. Biota Neotrop. 14, 1–11.
Martins, K. G., Marques, M. C., dos Santos, E., and Marques, R. (2015). Effects of soil conditions on the diversity of tropical forests across a successional gradient. For. Ecol. Manag. 349, 4–11. doi: 10.1016/j.foreco.2015.04.018
Moles, A. T., Ackerly, D. D., Webb, C. O., Tweddle, J. C., Dickie, J. B., and Westoby, M. (2005). A brief history of seed size. Science 307, 576–580. doi: 10.1126/science.1104863
Niklas, K. J. (1994). The allometry of safety-factors for plant height. Am. J. Bot. 81, 345–351. doi: 10.1002/j.1537-2197.1994.tb15453.x
Pagel, M. (1999). Inferring the historical patterns of biological evolution. Nature 401, 877–884. doi: 10.1038/44766
Paine, C. T., Amissah, L., Auge, H., Baraloto, C., Baruffol, M., Bourland, N., et al. (2015). Globally, functional traits are weak predictors of juvenile tree growth, and we do not know why. J. Ecol. 103, 978–989.
Penone, C., Davidson, A. D., Shoemaker, K. T., Di Marco, M., Rondinini, C., Brooks, T. M., et al. (2014). Imputation of missing data in life-history trait datasets: which approach performs the best? Methods Ecol. Evol. 5, 961–970. doi: 10.1111/2041-210x.12232
Perez-Harguindeguy, N., Diaz, S., Garnier, E., Lavorel, S., Poorter, H., Jaureguiberry, P., et al. (2016). Corrigendum to: new handbook for standardised measurement of plant functional traits worldwide. Aust. J. Bot. 64, 715–716. doi: 10.1071/bt12225_co
Poorter, L., Bongers, F., Sterck, F. J., and Wöll, H. (2005). Beyond the regeneration phase: differentiation of height–light trajectories among tropical tree species. J. Ecol. 93, 256–267. doi: 10.1111/j.1365-2745.2004.00956.x
Poorter, L., Wright, S. J., Paz, H., Ackerly, D. D., Condit, R., Ibarra-Manríquez, G., et al. (2008). Are functional traits good predictors of demographic rates? Evidence from five neotropical forests. Ecology 89, 1908–1920. doi: 10.1890/07-0207.1
R Core Team (2019). 2020. R: A Language and Environment for Statistical Computing. Vienna: R Foundation for Statistical Computing.
Rees, M., Condit, R., Crawley, M., Pacala, S., and Tilman, D. (2001). Long-term studies of vegetation dynamics. Science 293, 650–655. doi: 10.1126/science.1062586
Reich, P. B., Ellsworth, D. S., and Walters, M. B. (1998). Leaf structure (specific leaf area) modulates photosynthesis-nitrogen relations: evidence from within and across species and functional groups. Funct. Ecol. 12, 948–958. doi: 10.1046/j.1365-2435.1998.00274.x
Revell, L. J. (2012). phytools: an R package for phylogenetic comparative biology (and other things). Methods Ecol. Evol. 3, 217–223. doi: 10.1111/j.2041-210x.2011.00169.x
Ribeiro, M. C., Martensen, A. C., Metzger, J. P., Tabarelli, M., Scarano, F., and Fortin, M. J. (2011). “The Brazilian Atlantic Forest: a shrinking biodiversity hotspot,” in Biodiversity Hotspots, eds F. Zachos and J. Habel (Berlin: Springer).
Ribeiro, M. C., Metzger, J. P., Martensen, A. C., Ponzoni, F. J., and Hirota, M. M. (2009). The Brazilian Atlantic Forest: how much is left, and how is the remaining forest distributed? Implications for conservation. Biol. Conserv. 142, 1141–1153. doi: 10.1016/j.biocon.2009.02.021
Rüger, N., Wirth, C., Wright, S. J., and Condit, R. (2012). Functional traits explain light and size response of growth rates in tropical tree species. Ecology 93, 2626–2636. doi: 10.1890/12-0622.1
Scrucca, L., Fop, M., Murphy, T. B., and Raftery, A. E. (2016). mclust 5: clustering, classification and density estimation using Gaussian finite mixture models. R J. 8:289. doi: 10.32614/rj-2016-021
Smart, S. M., Glanville, H. C., Blanes, M. D. C., Mercado, L. M., Emmett, B. A., Jones, D. L., et al. (2017). Leaf dry matter content is better at predicting above-ground net primary production than specific leaf area. Funct. Ecol. 31, 1336–1344. doi: 10.1111/1365-2435.12832
Smith, S. A., and Brown, J. W. (2018). Constructing a broadly inclusive seed plant phylogeny. Am. J. Bot. 105, 302–314. doi: 10.1002/ajb2.1019
Stekhoven, D. J., and Bühlmann, P. (2012). MissForest—non-parametric missing value imputation for mixed-type data. Bioinformatics 28, 112–118. doi: 10.1093/bioinformatics/btr597
Sterck, F. J., and Bongers, F. (2001). Crown development in tropical rain forest trees: patterns with tree height and light availability. J. Ecol. 89, 1–13. doi: 10.1046/j.1365-2745.2001.00525.x
Sterck, F. J., Bongers, F., During, H. J., Martinez-Ramos, M., and De Kroon, H. (2003). Module responses in a tropical forest tree analyzed with a matrix model. Ecology 84, 2751–2761. doi: 10.1890/02-0335
Swaine, M. D., and Whitmore, T. (1988). On the definition of ecological species groups in tropical rain forests. Vegetatio 75, 81–86. doi: 10.1007/s13744-020-00779-6
Thomas, F. M., and Vesk, P. A. (2017). Are trait-growth models transferable? Predicting multi-species growth trajectories between ecosystems using plant functional traits. PLoS one 12:e0176959. doi: 10.1371/journal.pone.0176959
Vanclay, J. K. (1991). Aggregating tree species to develop diameter increment equations for tropical rainforests. For.Ecol. Manag. 42, 143–168.
Visser, M. D., Bruijning, M., Wright, S. J., Muller-Landau, H. C., Jongejans, E., Comita, L. S., et al. (2016). Functional traits as predictors of vital rates across the life cycle of tropical trees. Funct. Ecol. 30, 168–180. doi: 10.1111/1365-2435.12621
Westoby, M., Falster, D. S., Moles, A. T., Vesk, P. A., and Wright, I. J. (2002). Plant ecological strategies: some leading dimensions of variation between species. Annu. Rev. Ecol. Syst. 33, 125–159. doi: 10.1146/annurev.ecolsys.33.010802.150452
Westoby, M., and Wright, I. J. (2003). The leaf size-twig size spectrum and its relationship to other important spectra of variation among species. Oecologia 135, 621–628. doi: 10.1007/s00442-003-1231-6
Wills, J., Herbohn, J., Hu, J., Sohel, S., Baynes, J., and Firn, J. (2018). Tree leaf trade-offs are stronger for sub-canopy trees: leaf traits reveal little about growth rates in canopy trees. Ecol. Applic. 28, 1116–1125. doi: 10.1002/eap.1715
Wilson, P. J., Thompson, K., and Hodgson, J. G. (1999). Specific leaf area and leaf dry matter content as alternative predictors of plant strategies. New Phytol. 143, 155–162. doi: 10.1046/j.1469-8137.1999.00427.x
Wright, I. J., Cooke, J., Cernusak, L. A., Hutley, L. B., Scalon, M. C., Tozer, W. C., et al. (2019). Stem diameter growth rates in a fire-prone savanna correlate with photosynthetic rate and branch-scale biomass allocation, but not specific leaf area. Aust. Ecol. 44, 339–350. doi: 10.1111/aec.12678
Wright, S. J., Kitajima, K., Kraft, N. J., Reich, P. B., Wright, I. J., Bunker, D. E., et al. (2010). Functional traits and the growth-mortality trade-off in tropical trees. Ecology 91, 3664–3674.
Wright, I. J., Reich, P. B., Westoby, M., Ackerly, D. D., Baruch, Z., Bongers, F., et al. (2004). The worldwide leaf economics spectrum. Nature 428, 821–827.
Zanne, A. E., Lopez-Gonzalez, G., Coomes, D. A., Ilic, J., Jansen, S., Lewis, S. L., et al. (2009). Global Wood Density Database.
Zimermann Oliveira, L., Felippe Uller, H., Renata Klitzke, A., Roberto Eleotério, J., and Christian Vibrans, A. (2019). Towards the fulfillment of a knowledge gap: wood densities for species of the subtropical Atlantic Forest. Data 4:104. doi: 10.3390/data4030104
Keywords: leaf traits, wood density, Atlantic forest, absolute growth rate, ontogeny
Citation: Scalon MC, Bohn A, Coelho GC, Meister L, Alves RF, Secco RT, Zwiener VP, Marcilio-Silva V, Trindade WCF and Marques MCM (2022) Relationship Between Growth Trajectories and Functional Traits for Woody Trees in a Secondary Tropical Forest. Front. For. Glob. Change 5:754656. doi: 10.3389/ffgc.2022.754656
Received: 06 August 2021; Accepted: 10 January 2022;
Published: 31 January 2022.
Edited by:
Veronica De Micco, University of Naples Federico II, ItalyReviewed by:
Dominik Sperlich, University of Freiburg, GermanyRavi Kant Chaturvedi, Xishuangbanna Tropical Botanical Garden, Chinese Academy of Sciences (CAS), China
Copyright © 2022 Scalon, Bohn, Coelho, Meister, Alves, Secco, Zwiener, Marcilio-Silva, Trindade and Marques. This is an open-access article distributed under the terms of the Creative Commons Attribution License (CC BY). The use, distribution or reproduction in other forums is permitted, provided the original author(s) and the copyright owner(s) are credited and that the original publication in this journal is cited, in accordance with accepted academic practice. No use, distribution or reproduction is permitted which does not comply with these terms.
*Correspondence: Marina Corrêa Scalon, bWFyaW5hX3NjYWxvbkB5YWhvby5jb20uYnI=