 Thais M. Rosan1*
 Stephen Sitch1
 Lina M. Mercado1,2
 Viola Heinrich3Pierre Friedlingstein4,5
 Luiz E. O. C. Aragão1,6
- 1College of Life and Environmental Sciences, University of Exeter, Exeter, United Kingdom
- 2UK Centre for Ecology and Hydrology, Wallingford, United Kingdom
- 3School of Geographical Sciences, University of Bristol, Bristol, United Kingdom
- 4College of Engineering, Mathematics, and Physical Sciences, University of Exeter, Exeter, United Kingdom
- 5Laboratoire de Météorologie Dynamique/Institut Pierre-Simon Laplace, CNRS, Ecole Normale Supérieure/Université PSL, Sorbonne Université, Ecole Polytechnique, Paris, France
- 6Earth Observation and Geoinformatics Division, National Institute for Space Research (INPE), São José dos Campos, Brazil
The two major Brazilian biomes, the Amazonia and the Cerrado (savanna), are increasingly exposed to fires. The Amazonian Forest is a fire sensitive ecosystem where fires are a typically rare disturbance while the Cerrado is naturally fire-dependent. Human activities, such as landscape fragmentation and land-use management, have modified the fire regime of the Cerrado and introduced fire into the Amazonian Forest. There is limited understanding of the role of landscape fragmentation on fire occurrence in the Amazonia and Cerrado biomes. Due to differences in vegetation structure, composition, and land use characteristics in each biome, we hypothesize that the emerging burned area (BA) patterns will result from biome-specific fire responses to fragmentation. The aim of this study was to test the general relationship between BA, landscape fragmentation, and agricultural land in the Amazonia and the Cerrado biomes. To estimate the trends and status of landscape fragmentation a Forest Area Density (FAD) index was calculated based on the MapBiomas land cover dataset for both biomes between 2002 and 2018. BA fraction was analyzed within native vegetation against the FAD and agricultural land fraction. Our results showed an increase in landscape fragmentation across 16% of Amazonia and 15% of Cerrado. We identified an opposite relationship between BA fraction, and landscape fragmentation and agricultural fraction contrasting the two biomes. For Amazonia, both landscape fragmentation and agricultural fraction increased BA fraction due to an increase of human ignition activities. For the Cerrado, on the other hand, an increase in landscape fragmentation and agricultural fraction caused a decrease in BA fraction within the native vegetation. For both biomes, we found that during drought years BA increases whilst the divergent trends driven by fragmentation in the two contrasting global biomes is maintained. This understanding will be critical to informing the representation of fire dynamics in fire-enable Dynamic Global Vegetation Models and Earth System Models for climate projection and future ecosystem service provision.
Introduction
Brazil contains a diverse range of biomes across different climate and soil gradients, ranging from Amazonia and Atlantic rainforest to tropical dry forest, savannas, and natural grasslands to wetlands. The two largest biomes of Brazil, Amazonia, and Cerrado (Savanna), occupy together approximately 73% of the total country area, each biome with 49 and 24%, respectively. These two major biomes have attracted attention because of their vast area and their important contribution for key ecosystem services, notably the role of intact vegetation to the natural carbon (C) sink (Malhi et al., 2006; Pan et al., 2011; Gloor et al., 2012; Poulter et al., 2014), biodiversity (Morandi et al., 2018) and agricultural production.
Both biomes are subjected to fires with different degree of occurrence, shaping their vegetation composition through time (Pivello, 2011). In Amazonia fire is not a common natural disturbance mechanism. The Cerrado, conversely, is naturally a fire-prone biome, with fire-adapted vegetation. Historically both biomes have been impacted by land use and land cover changes associated with demographic and agricultural expansion (Rosan et al., 2021), which increases landscape fragmentation through deforestation (Vedovato et al., 2016), which can spread or supress fire. Silva C. H. L. et al. (2018) have shown that landscape fragmentation induced by deforestation in the Central Brazilian Amazonia increases fire incidence and intensity. However, there are no studies showing the relationship between fragmentation and fire dynamics for the Cerrado biome and whether or not the relationship is common across major global biomes, such as Cerrado (savanna) and Amazonia (tropical forest), as typically assumed by global fire models.
There is rising concern in the scientific community regarding increasing fire events in Brazil and their impacts on both biomes (Pivello et al., 2021). It is well known that there is a higher probability of fire events during extreme drought years, which are predicted to increase in frequency this century due global climate change (Cox et al., 2008; Malhi et al., 2008; Aragão et al., 2018; Cai et al., 2020). These additional emissions from forest fires (i.e., forest degradation) are not accounted for in in-country carbon budgets and can even surpass the emissions from deforestation (Qin et al., 2021). Moreover, forest fires also impact the natural C sink of the Amazonian Forest, as old-growth forests impacted by fire are not able to recover to the initial state even after 30 years of the fire event (Silva C. V. J. et al., 2018). Forest fires also reduce the regrowth potential of secondary forests by up to 50%, limiting their C sequestration potential (Heinrich et al., 2021). In the Cerrado, fires during the dry season caused by humans are more intense, severe and extensive (Berlinck and Batista, 2020) than natural fires due to lightning strikes in the transition between wet and dry seasons. Since the Cerrado is composed of fire-prone vegetation, during drought years, the probability of large wildfires increases and can be catastrophic, with megafires resulting in loss of biodiversity (Berlinck and Batista, 2020; Pivello et al., 2021).
To understand and predict future fire impacts in these globally relevant and contrasting biomes under climate change, it is critical to test generality in relationships between fire, human activity, and climate across biomes and incorporate these relationships into fire-enabled Dynamic Global Vegetation Models (DGVMs) that are used for future predictions. Most global fire models adopt universal relationships between human activity and fire occurrence (i.e., population density) that are constant across vegetation types (Venevsky et al., 2002; Hantson et al., 2016; Rabin et al., 2017). However, these relationships likely vary by biome, such as fire-dependent biomes (e.g., Savannas) vs. fire sensitive-biomes for which fire is not a common natural disturbance (e.g., Rainforests). Furthermore, the use of population density may not be the best or sole human-driving factor to simulate fire occurrence, it is critical to consider the type of land-use (i.e., extensive, or intensive) (Aragão and Shimabukuro, 2010; Andela et al., 2017), and other processes such as the state and trends in landscape fragmentation (Burton et al., 2019). Understanding and representation of more complex relationships between fire and anthropogenic activity for contrasting biomes is currently lacking, yet these remain critical for a better representation of fire and estimates of fire-related emissions in future developments of fire-enabled DGVMs.
Hence, the main objective of this study is to test the general relationship between burned area (BA), landscape fragmentation and agricultural land in the Cerrado (fire-dependent ecosystem) and compare with Amazonia (fire-sensitive ecosystem). To test this, we (i) mapped the temporal evolution of anthropogenic landscape fragmentation in both biomes; (ii) compared the differences in BA in drought and non-drought years in relation to the fragmentation status of each biome; and (iii) assessed the relationship between BA, landscape fragmentation and agricultural fraction for both biomes.
Materials and Methods
In order to map the evolution of landscape fragmentation and agricultural fraction we used the MapBiomas land cover dataset. For the BA fraction, we used the MCD64 A1 BA product. To test the general relationship between BA fraction, landscape fragmentation, and agricultural land in both biomes, we used a combination of satellite-derived datasets. We used the Brazilian biomes limits provided by the Brazilian Institute of Geography and Statistics at the scale of 1:5,000,000 to extract the Amazonia and Cerrado boundaries. The details of the datasets and analysis are explained in the following sections.
Land Use and Land Cover Dataset
The annual land use and land cover dataset (LULC) for Amazonia and the Cerrado biome was obtained from MapBiomas (Project of Annual Mapping of Land Cover and Land Use in Brazil, Collection 4.1) from 2002 to 2018. This dataset is based on annual Landsat-based mosaics for the entire Brazil at 30-m spatial resolution over the period 1985–2018 for collection 4.1. The LULC maps were generated in the Google Earth Engine platform using a Random Forest classifier and is freely available.1
The overall accuracy of collection 4.1 reported for Amazonia was 95.9% and for the Cerrado 82.9%. The method and explanation of the accuracy assessment of the MapBiomas maps can be found in Souza et al. (2020). The category with lowest accuracy was the Natural Grassland. In the Cerrado, MapBiomas reports that there is more confusion between Natural Grassland and Natural Forest Formation than Natural Grassland with Pasture category. For Pasture and Agriculture categories, the global User’s accuracy was 90.63 and 81.28%, respectively. Natural forest formation, which includes both forest and savannas woodlands, had an estimated global User’s Accuracy of 92.08%. The detailed accuracy assessment and graphics for each year, category and biome for MapBiomas collection 4.1 can be found on the toolkit web page.2
MapBiomas LULC maps were used to create a mask of native vegetation fragments to analyze the landscape fragmentation and its relationship to fire occurrence for both biomes. For Amazonia only the MapBiomas “Forest” category was considered. For Cerrado the following MapBiomas classes were used: Forest, which include seasonal semideciduous forest, thick woodland forests (Cerradão), and dry forests; Savannas which includes shrublands and Natural Grasslands (Campos). These classes were assigned a value of 2 and the remaining LULC categories were assigned a value of 1 as input to calculate the Forest Area Density (FAD) index (see the section “Forest Area Density Index”). The “aggregate” function in R was used to aggregate the 30-m natural vegetation mask to a 10 × 10 km spatial resolution with the total area and fraction of natural vegetation fragments for each grid-cell. We choose to aggregate to 10 × 10 km to facilitate the processing within R Studio for the statistical analysis and spatial data visualization.
The MapBiomas LULC maps were also used to elaborate the pasture and cropland fractions. To calculate the pasture fraction, Pasture and Mosaic of Agriculture and Pasture categories were reclassified as pasture. We considered the mosaic category as pasture because it is usually used by extensive cattle ranching and small-scale agriculture. For cropland fraction, we reclassified Annual and Perennial Crop and Semi-Perennial Crop as cropland. Then each map was aggregated to 10 × 10 km spatial resolution with the total area and fraction in each grid-cell using the “aggregate” function in R.
Burned Area Dataset
The monthly MCD64 A1 (collection 6) BA product derived from MODIS (Moderate Resolution Imaging Spectroradiometer) at 500-m spatial resolution (Giglio et al., 2018) from 2002 to 2018 was used to produce the annual maps of BA. The data were aggregated yearly to a 10 × 10 km spatial resolution by calculating the total BA proportion and the total BA inside natural vegetation fragments for both biomes. The BA maps were overlaid on the MapBiomas mask to extract the total BA inside natural vegetation fragments. The BA inside natural vegetation fragments were normalized using the total area of natural vegetation within each grid-cell (Eq. 1), herein called BA fraction.
The annual BA fraction maps were used to calculate mean and spatial trends over 2002–2018. For the trend analysis, a pixel-by-pixel linear regression was calculated using the raster R package (Hijmans et al., 2017) based on a 3-year pixel-by-pixel moving average of the BA fraction maps. A moving average was used because BA has a high interannual variability. Changes through time were considered significant for pixels that had a best fit line using a F-test with a 95% confidence level (p < 0.05).
Forest Area Density Index
The Forest Area Density (FAD) is an index adopted by the Food Agriculture Organization (FAO) for the State of the World’s Forests (SOFO) (Vogt et al., 2019) to report the state of forest fragmentation. This is a landscape morphological index defined as the proportion of forest pixels within a fixed neighborhood area. The FAD algorithm uses a moving window to classify each pixel assigned as foreground (e.g., forest pixels) between 0 and 100% depending on the local neighborhood and results in a new map with the same dimension as the input showing the forest area density for the analyzed neighborhood (Vogt, 2018). The FAD index can then be stratified in the following five density classes: Rare (<10%), Patchy (10 ≤ 40%), Transitional (40 ≤ 60%), Dominant (60 ≤ 90%), and Interior (>90%), which is inversely proportional to the fragmentation.
This index was used to calculate annual landscape fragmentation based on the native vegetation fragments mask derived from MapBiomas (explained on the section “Land Use and Land Cover Dataset”) at 30-m of spatial resolution. The index was applied to annual maps (2002–2018) of Amazonia and the Cerrado with a moving window of 27 × 27 pixels of 30-m (approximately 65.6 hectares, 0.61 km2) using the GUIDOS Toolbox workbench. Figures 1A,B shows an example of the input MapBiomas mask and the FAD classification categories at the 30-m of spatial resolution. The output maps were aggregated with the FAD classification to a 10-km spatial resolution grid using the average FAD index for each grid-cell.
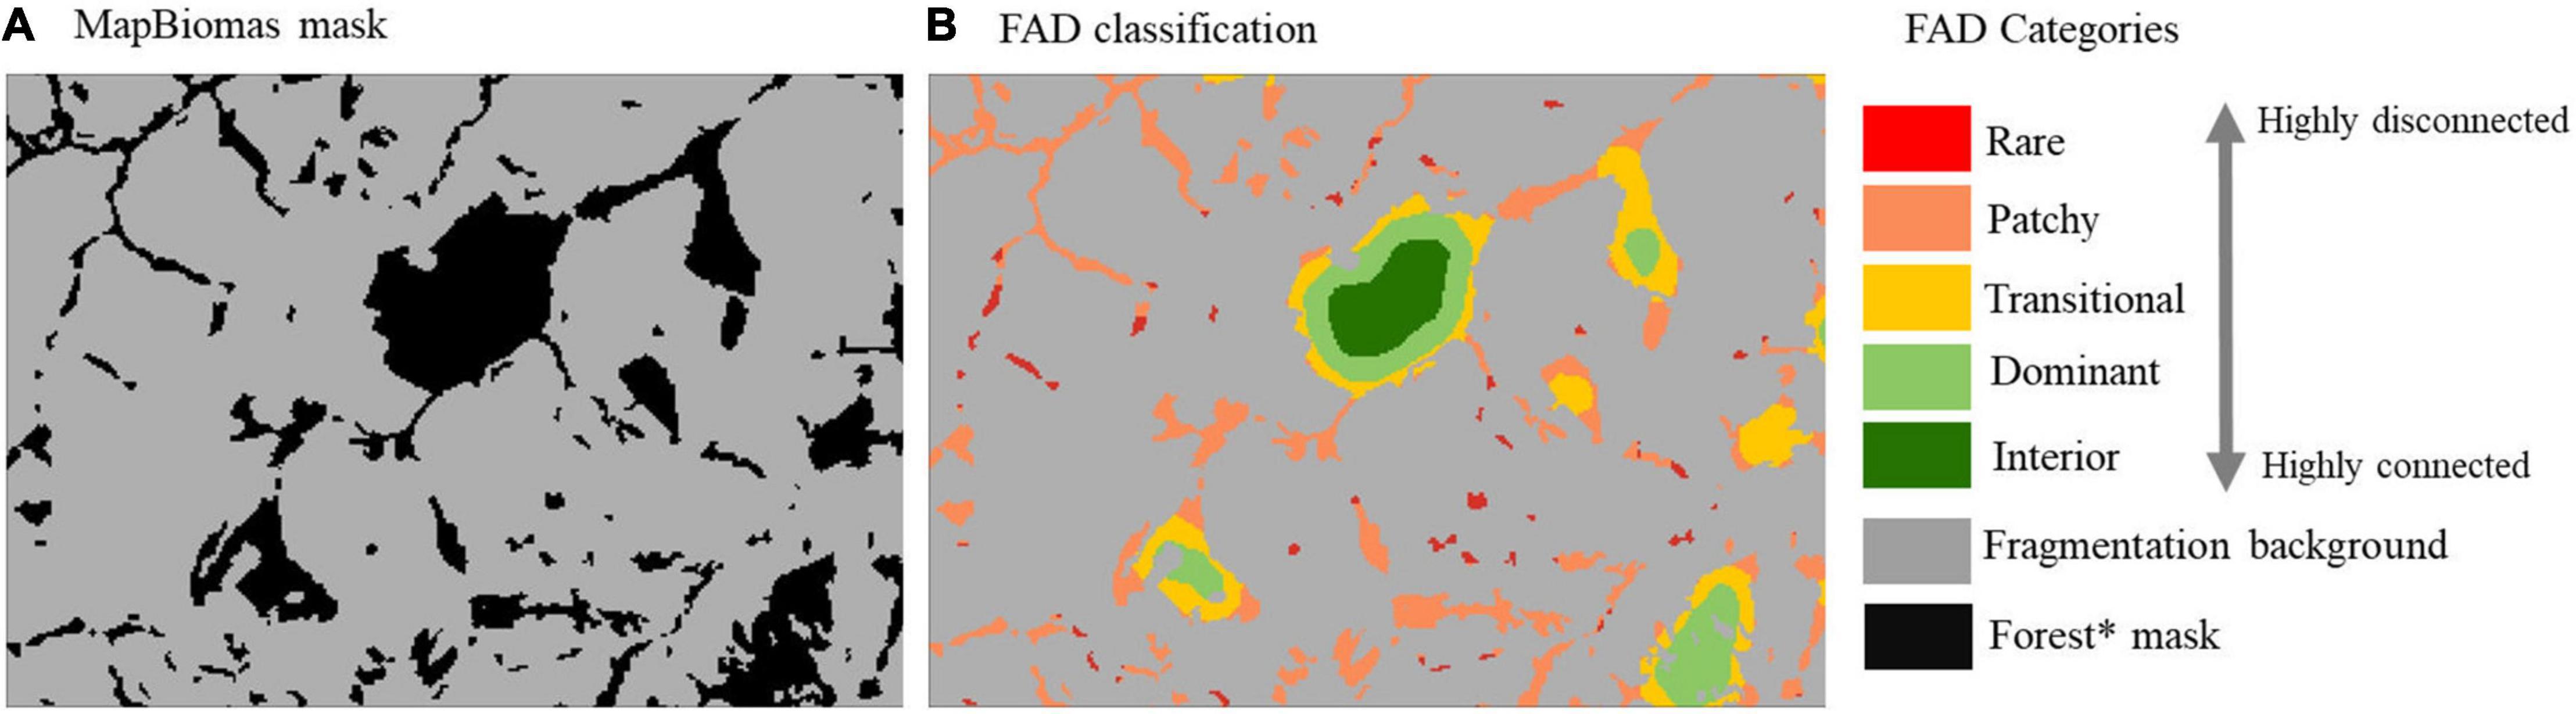
Figure 1. Example of Forest Area Density (FAD) classification categories applied to a MapBiomas mask. (A) MapBiomas mask for input on GUIDOS toolbox. (B) FAD classification output. Forest * mask for Amazonia include only MapBiomas Forest category; for Cerrado it includes Forest, Savannas, and Natural Grasslands. Fragmentation background are all the MapBiomas remaining LC categories (e.g., Cropland, pasture, urban, water, etc.).
To calculate trends in landscape fragmentation over time (2002–2018) a pixel-by-pixel linear regression was done using the raster R package (Hijmans et al., 2017). This method uses the re-gridded FAD index maps to calculate a pixel-by-pixel linear regression. Temporal changes were considered significant for pixels that had a best fit line using a F-test with a 95% confidence level (p < 0.05).
Analysis
To test the general relationship between landscape fragmentation and BA fraction for both biomes, we used a Local Polynomial Regression Fitting (LOESS; Cleveland and Loader, 1996) instead of a global fitting such as a linear regression. This is a non-parametric method for fitting smooth curve to data that exhibit noisy and sparse data values. We applied the LOESS function to the average of BA fraction and FAD grid-cells for the whole time-series (2002–2018). We used the span 0.75 (default setting) in the LOESS regression analysis. We also calculated the BA fraction statistics for each FAD category per biome and presented it in boxplots.
To analyze the impact of drought years (i.e., years with higher BA due climatic extreme droughts) on the fire relationship with the FAD categories, we calculated the average BA for both drought and non-drought years separately. Drought years corresponded to 2005, 2007, 2010, and 2015/2016. The average BA fraction for drought and non-drought years were calculated and combined with the average FAD category for the same period for each biome. To test for significant differences between the groups, the ggstatsplot R package (Patil, 2021) was used with a non-parametric test (Mann–Whitney U test) since the dataset is not normally distributed.
To integrate fragmentation and BA trends, a Boolean operator was used to combine the maps into the following four categories: (i) positive trend in fragmentation and decrease in BA; (ii) positive trend in fragmentation and increase in BA; (iii) negative trend in fragmentation and decrease in BA; and (iv) negative trend in fragmentation and increase in BA. Only grid-cells with significant changes over time (p < 0.05) were used. Then, for each of these categories the average grid-cell fraction of pasture and cropland over 2002–2018 was calculated based on MapBiomas LULC maps to assess the grid-cell composition. To evaluate the relationship between BA fraction and agricultural management in Amazonia and the Cerrado, a LOESS regression fitting was applied between the calculated average BA fraction for each fraction threshold of agricultural (Cropland and Pasture) fraction over time.
Results
Trends on Landscape Fragmentation
Between 2002 and 2018 Amazonia lost approximately 256,419 km2 of forests classified as “interior forest,” of which 16% (40,227 km2) was converted to other FAD categories and 84% (216,192 km2) was deforested (Table 1). About 89.5% (3,614,550 km2) of the remaining forest cover was classified as interior (i.e., core area) in 2002, decreasing to 87.9% (3,358,131 km2) in 2018 (Table 1). During the same period, the Cerrado biome lost 143,379 km2 of interior natural vegetation (i.e., core area), of which 82% (117,748 km2) was converted to other FAD categories and 18% (25,631 km2) was deforested. Although the total area loss of interior areas of Cerrado was lower than Amazonia, it is particularly concerning because of its degree of anthropogenic fragmentation. For example, in 2002 about 71% (946,418 km2) of the remaining natural vegetation cover in Cerrado was classified as interior dominated, and this went down to 66% (803,038 km2) in 2018. The percentage distribution of each fragmentation category for 2002 and 2018 are shown in Figures 2C,D for Amazonia and Cerrado, respectively.
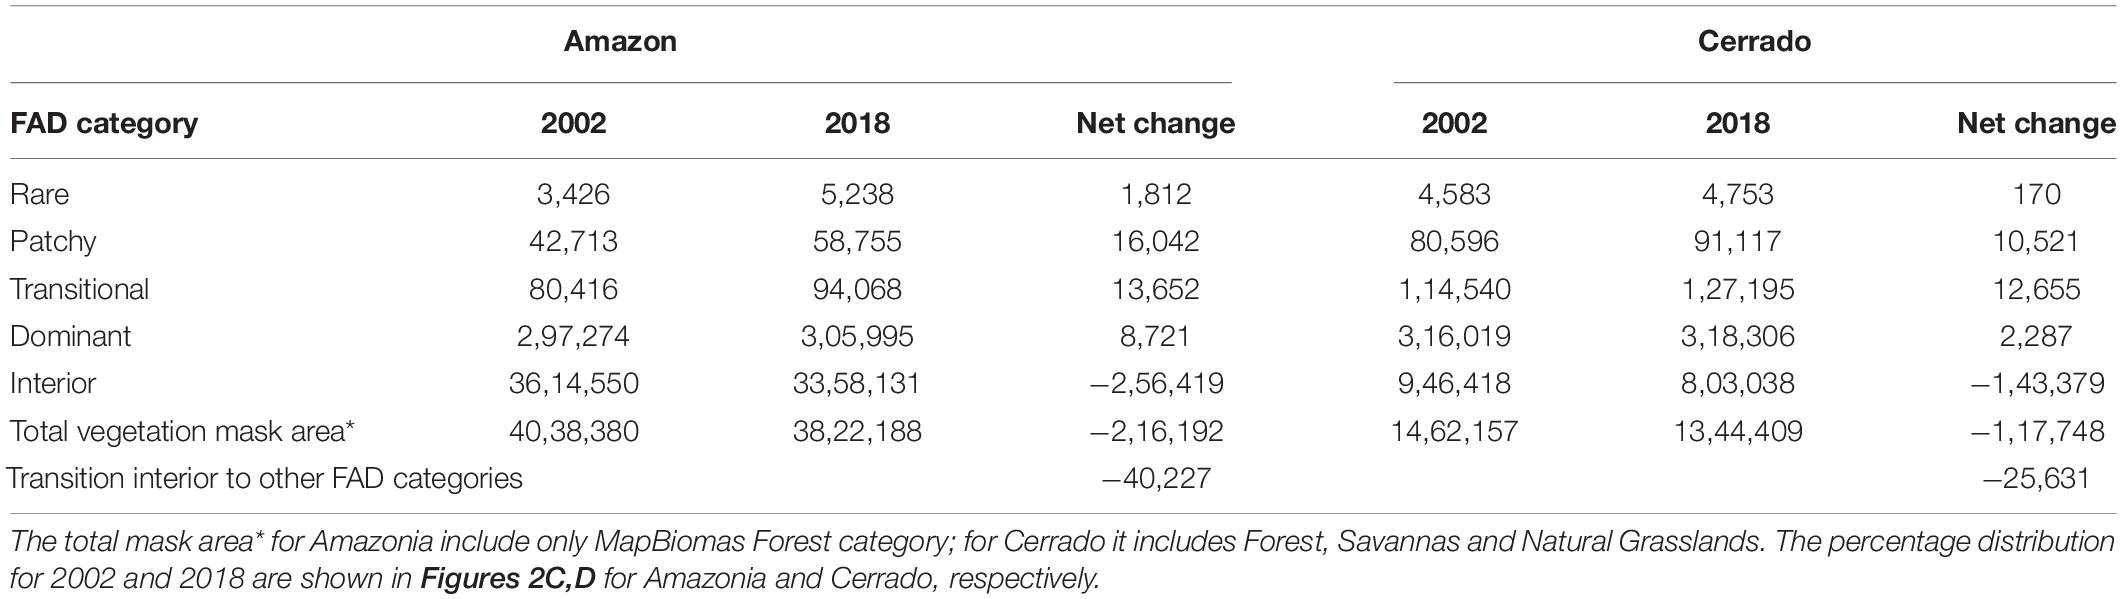
Table 1. Area (km2) and net change for each Forest Area Density (FAD) category in 2002 and 2018 for Amazonia and the Cerrado.
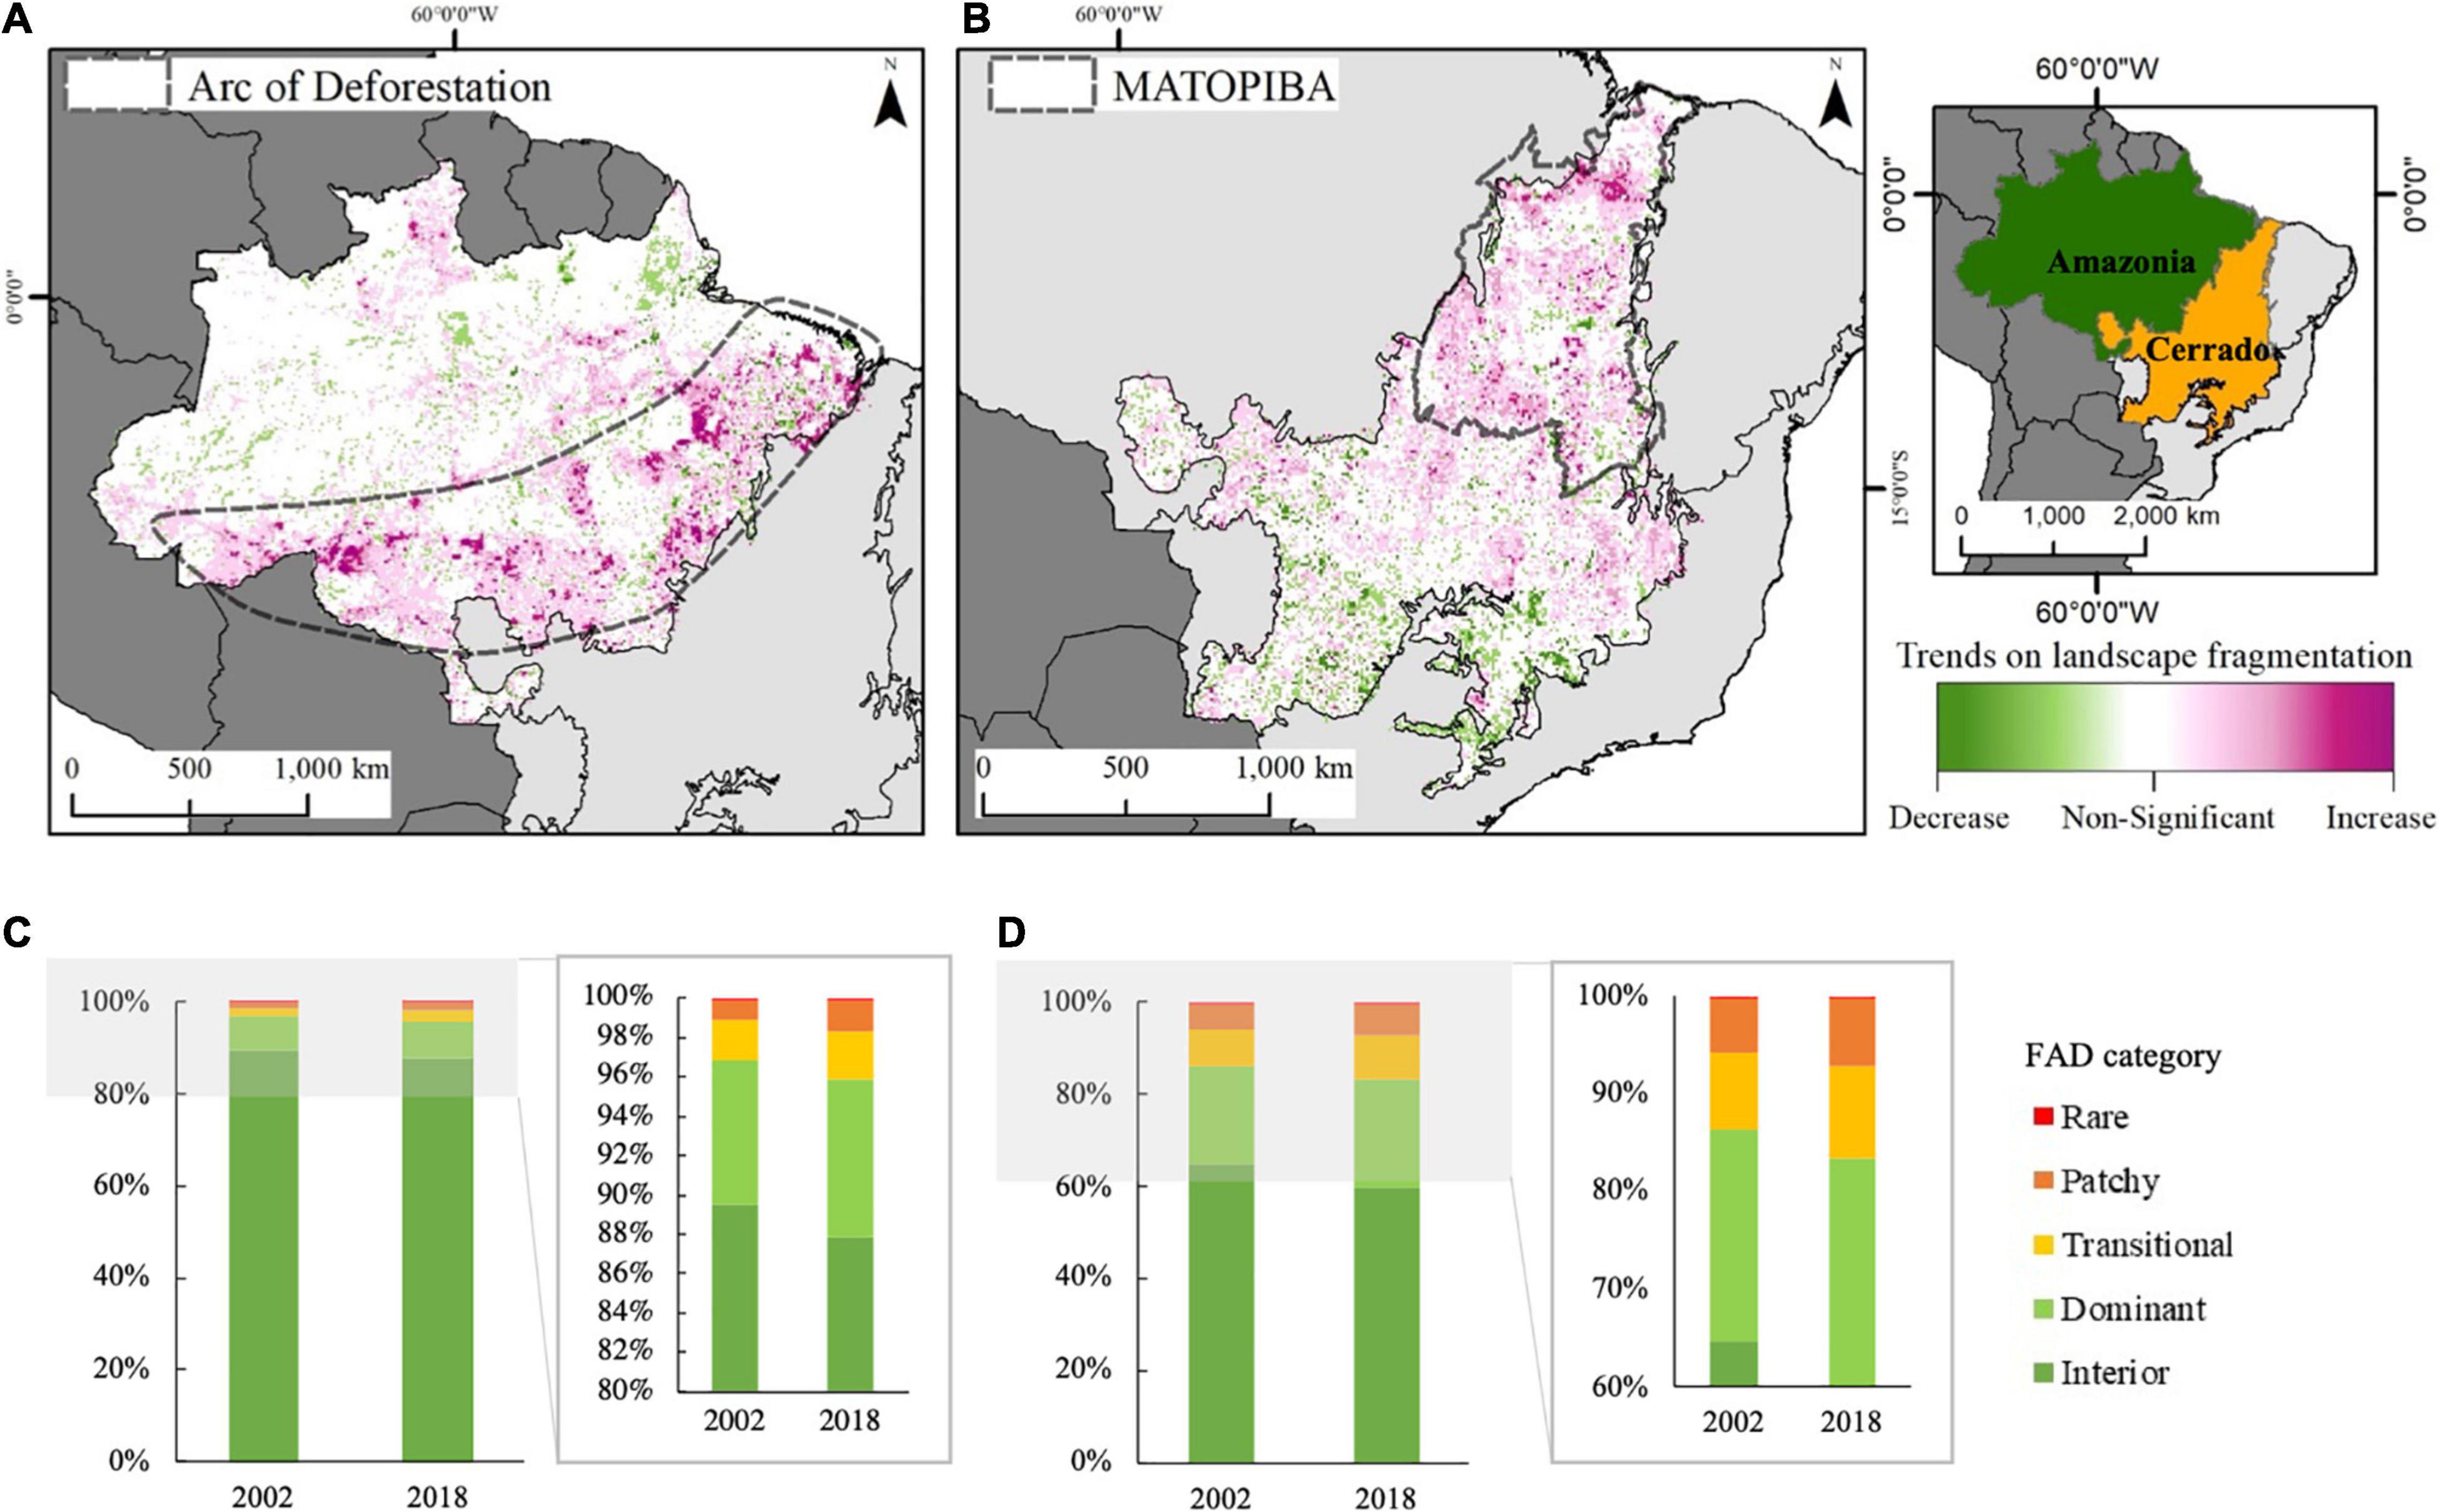
Figure 2. Landscape fragmentation trend (p < 0.05) over time (2002–2018) for (A) Amazonia and (B) Cerrado; Percentage area of each FAD category for Amazonia (C) for Cerrado (D) in 2002 and 2018. The Arc of Deforestation and MATOPIBA borders are included in gray dashed lines in a & b, respectively.
The FAD trend analysis demonstrates that 16% of Amazonia and 15% of the Cerrado total biome grid-cells exhibited a significant (p < 0.05) increase in landscape fragmentation over 2002–2018. This positive trend is concentrated in the Arc of Deforestation in Amazonia and north of Cerrado biome, a region known as MATOPIBA, which are the current deforestation hotspots (Figures 2A,B). Only 4 and 5% of Amazonia and Cerrado grid-cells, respectively, showed significant negative trends in landscape fragmentation over the analyzed period (e.g., increase in secondary vegetation).
Burned Area and Landscape Fragmentation Relationship
Our results show an opposing relationship between BA fraction and landscape fragmentation for Amazonia and the Cerrado. In the Cerrado, grid-cells that are Dominant and Interior (i.e., less fragmented/highly connected) have a higher BA fraction than Rare/patchy grid-cells (Figures 3A,C). In contrast, in Amazonia, the BA fraction is higher in the highly fragmented FAD categories and decreases toward the highly connected categories (Figures 3A,B).
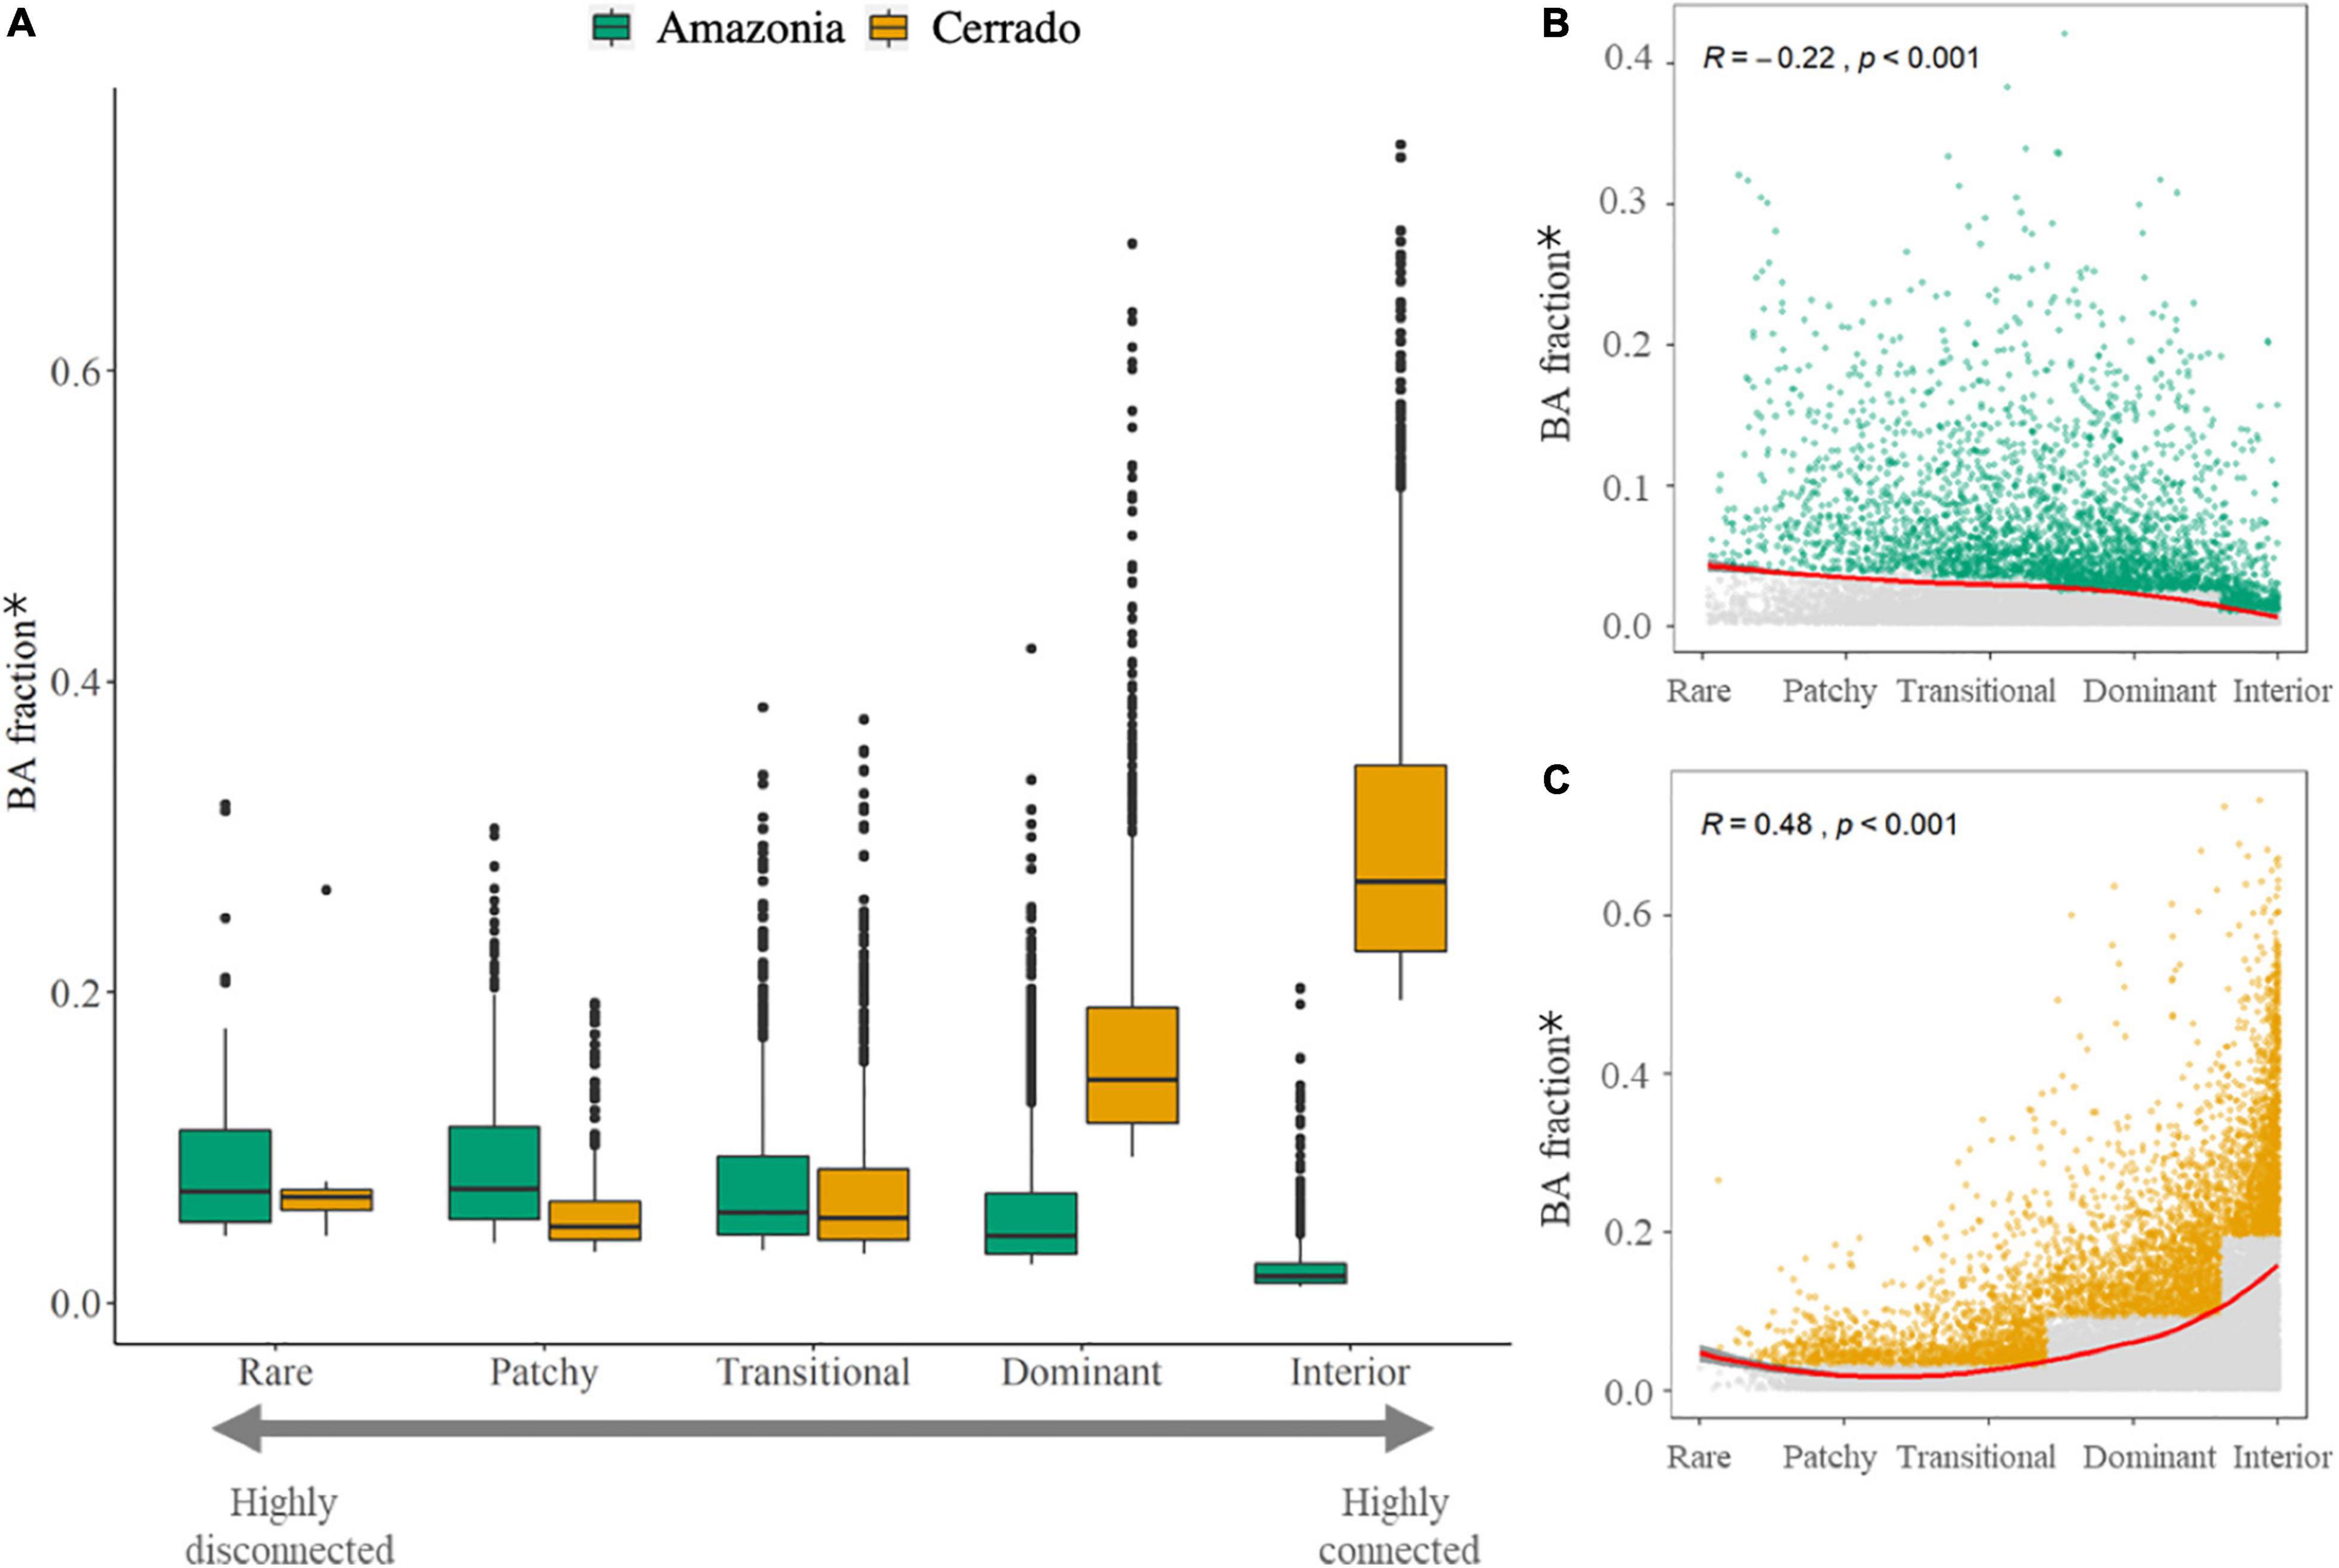
Figure 3. (A) Boxplot with the average (2002–2018) normalized burned area (BA) fraction* by each FAD category for Amazonia and Cerrado biomes; (B) Scatterplot showing the relationship between the normalized BA fraction and FAD for Amazonia, points highlighted in green were used in the boxplot (>75th percentile) for each category, gray points are the lower 75th percentile and the red line shows the fitted loess regression considering all the grid-cells; (C) Scatterplot showing the relationship between the normalized BA fraction and FAD for Cerrado, points highlighted in orange were used in the boxplot (>75th percentile) for each category, gray points are values <75th percentile and the red line shows the fitted LOESS regression considering all the grid-cells. The average and standard deviation maps used to elaborate the scatterplots can be found in Supplementary Figures 1, 2 for Amazonia and Cerrado, respectively. * Normalized BA fraction = Total BA inside natural fragments / Total area of the fragments.
The analysis of BA patterns for each FAD category in non-drought and drought years demonstrates that there is a significant increase in BA fraction in drought years compared to the non-drought years for most of the FAD categories for both biomes (Figure 4). However, this is not the case for the “Rare” category, which corresponds to landscapes highly isolated and with small fragments. Furthermore, in both biomes we continue to see the biome-specific relationship between BA fraction and fragmentation identified earlier (Figure 3), irrespective of whether the year experiences a drought or not (Figure 4).
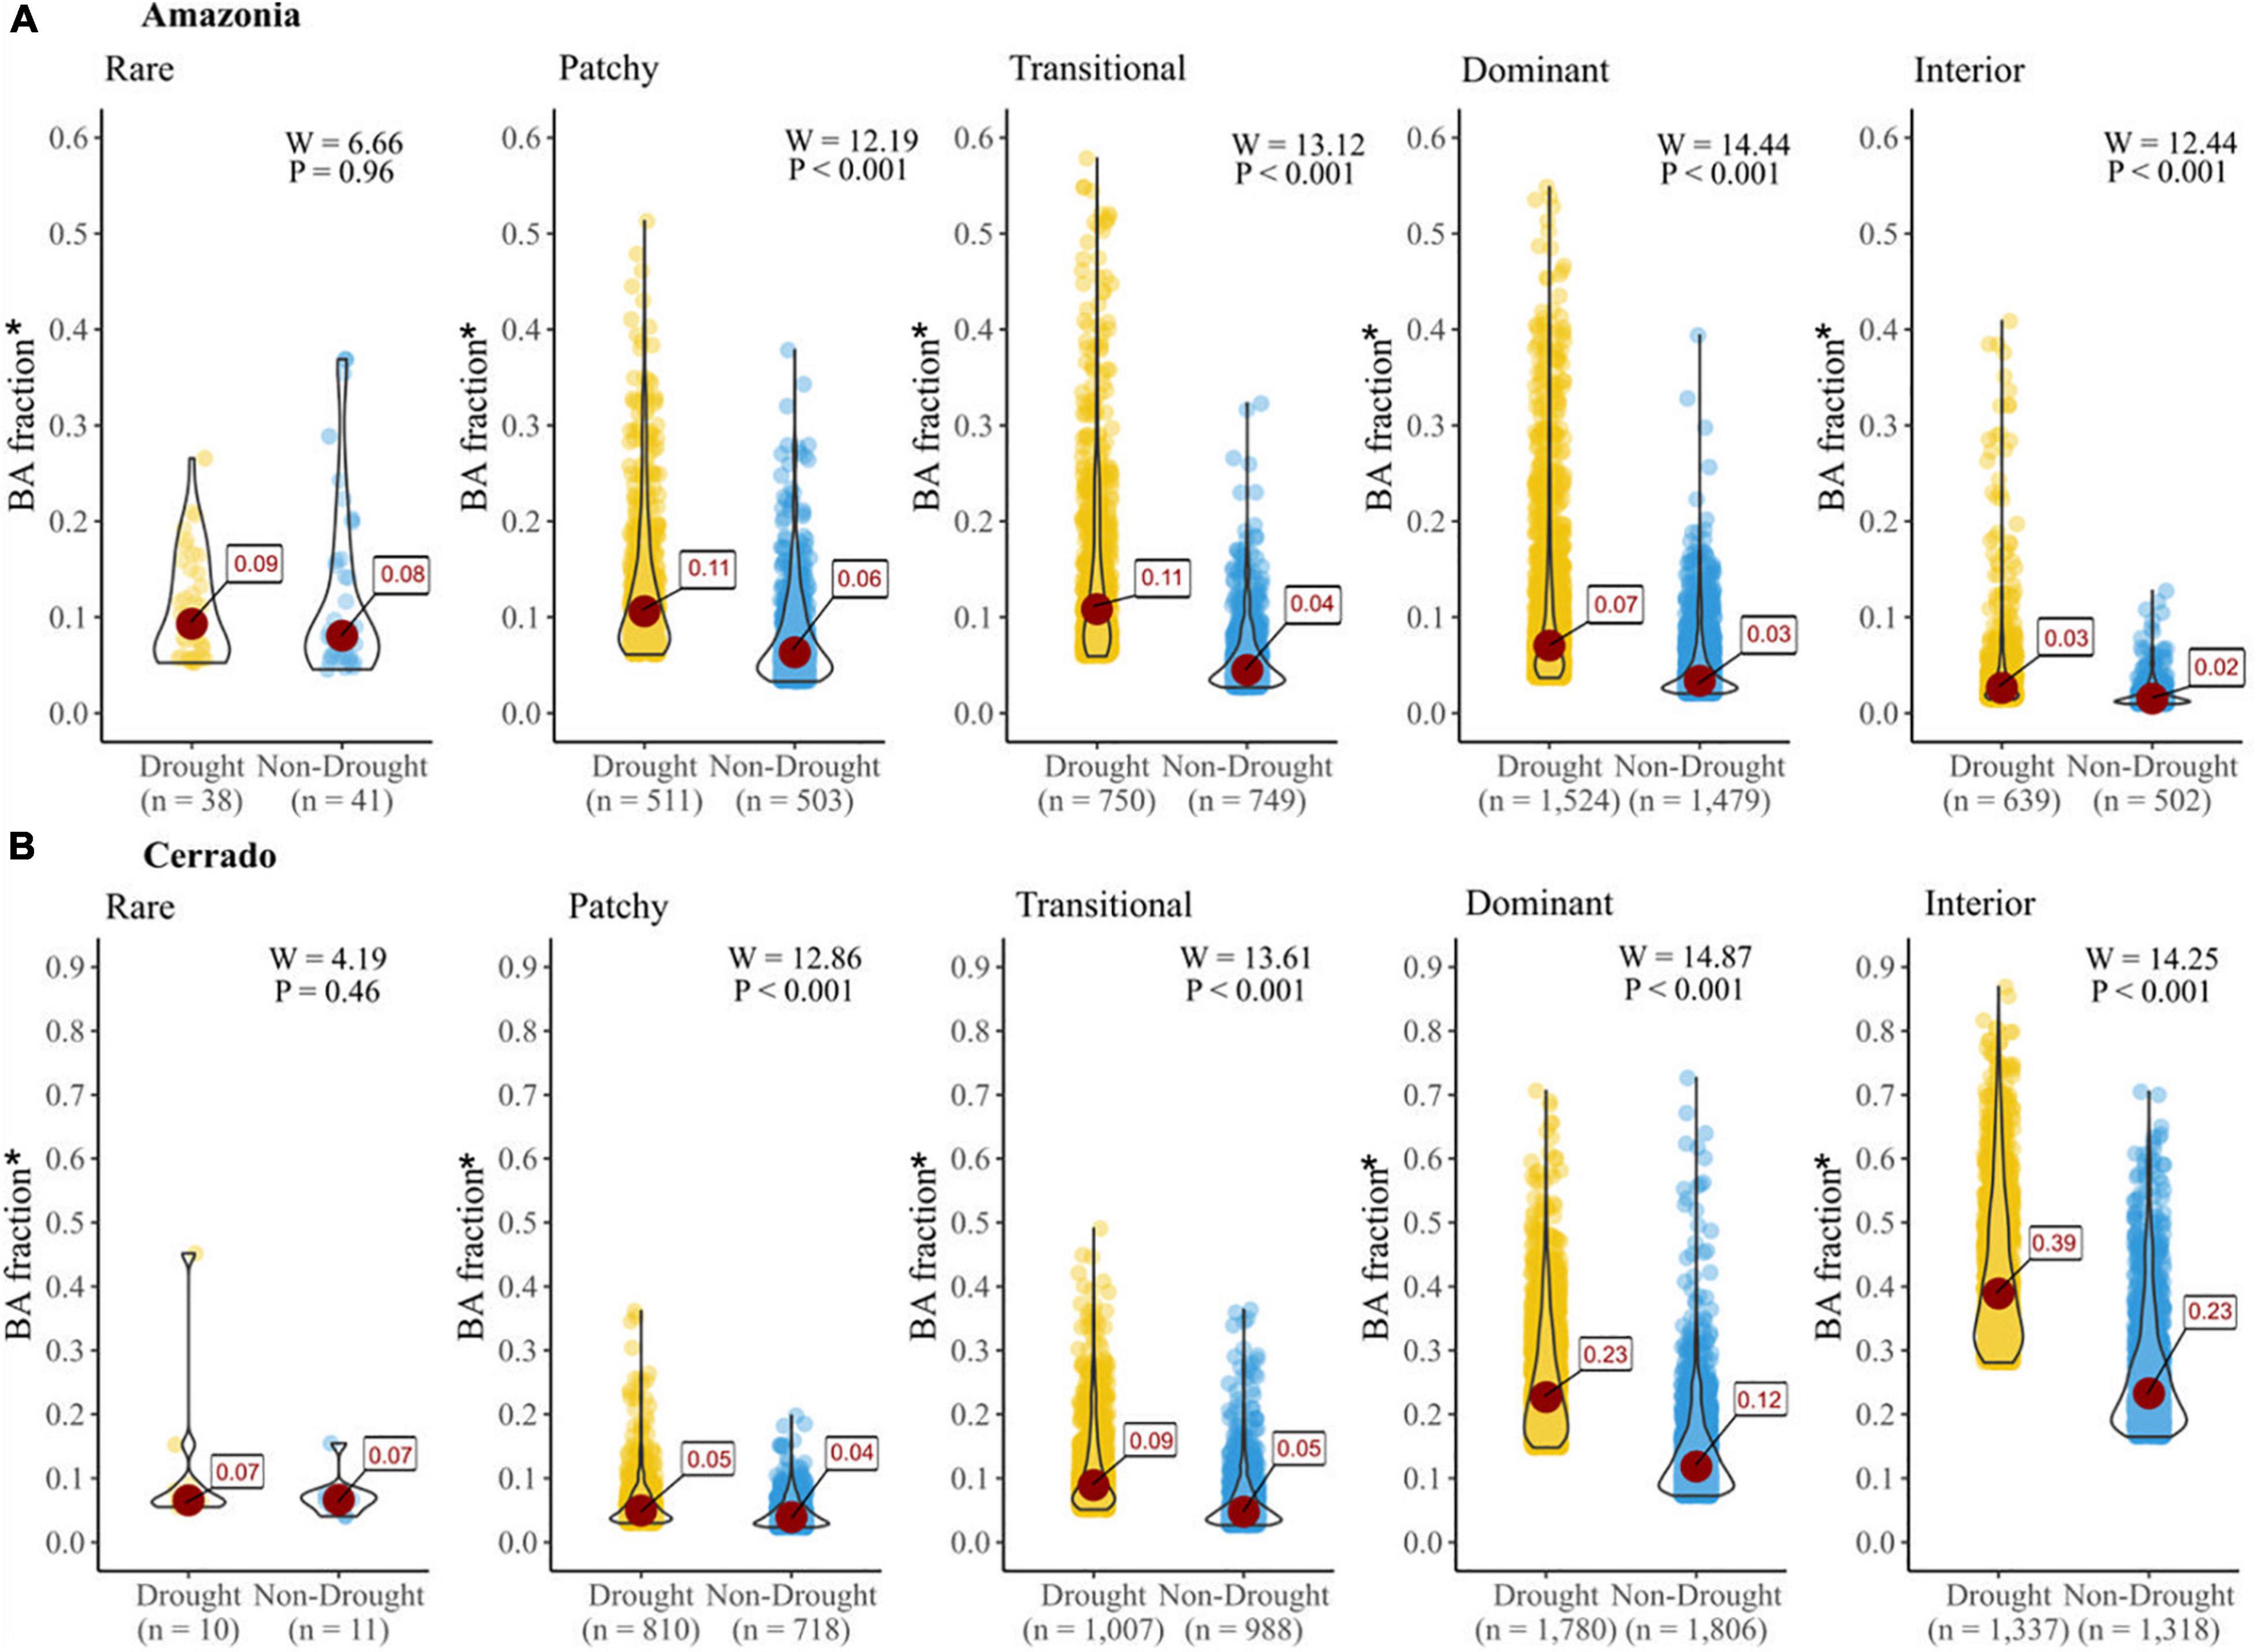
Figure 4. Average BA fraction inside native vegetation* fragments for drought (yellow) and non-drought (blue) years in the Amazonia (A) and Cerrado (B). The red dot in each violin plot is the median value. The Wilcoxon signed-rank test (W) to assess the difference between the two pairs and its p-value are shown for each pair in the figure. *Amazonia include only BA fraction within MapBiomas Forest land cover category; for Cerrado it includes BA fraction within Forest, Savannas and Natural Grasslands land cover categories.
In Amazonia, the maximum BA fraction reached up to 40% during non-drought years. During drought years, the maximum BA fraction was as high as 60% in grid-cells classed as Patchy, Transitional, and Dominant fragmentation, with a median BA fraction of 11, 11, and 7%, respectively (Figure 4A). Critically, during non-drought years the maximum BA fraction in Interior dominated landscapes (i.e., core areas) was around 10%, but during drought years it increased to 40%. This demonstrates that intact forests in grid-cells dominated by the class “Interior” in Amazonia reached up to 40% (median 3%) of their area burned during drought years compared to 10% (median 2%) during non-drought years.
In contrast, the Cerrado biome has a larger BA fraction even in the non-drought years compared to the Amazonia, which is due to its fire-prone environment (Figure 4B). However, the largest increase in BA fraction during drought years in the Cerrado was in the Dominant and Interior landscapes. For these categories there were increases of about 91% (from 12 to 23%) and 69% (from 23 to 39%) in the median BA fraction during drought compared to non-drought years, respectively. This demonstrates that extreme events such as droughts facilitate and increase the spread of fire over extensive areas of intact and fully connected Cerrado vegetation.
Trends in Landscape Fragmentation, Burned Area, and Its Relationship With Agricultural Patterns
We relate trends in landscape fragmentation, BA fraction and the fraction of land-use categories (i.e., pasture and cropland), spatially across each biome. In Amazonia (Figure 5A) about 6% of the total grid-cells showed a significant (p < 0.05) positive trend in landscape fragmentation combined with a negative trend in BA fraction, spatially concentrated in the southern border of the biome. These grid-cells exhibited an increase of 38% in pasture fraction over time with a higher increase (341%) of cropland fraction (Supplementary Figure 3). About 3% of the total grid-cells showed a significant (p < 0.05) positive trend in both landscape fragmentation and BA fraction. These grid-cells had an increase of 144% and ∼4000% in the fraction of pasture and cropland, respectively (Supplementary Figure 3). Spatially, these grid-cells are mostly concentrated in the current hotspots of deforestation in the west of Pará state.
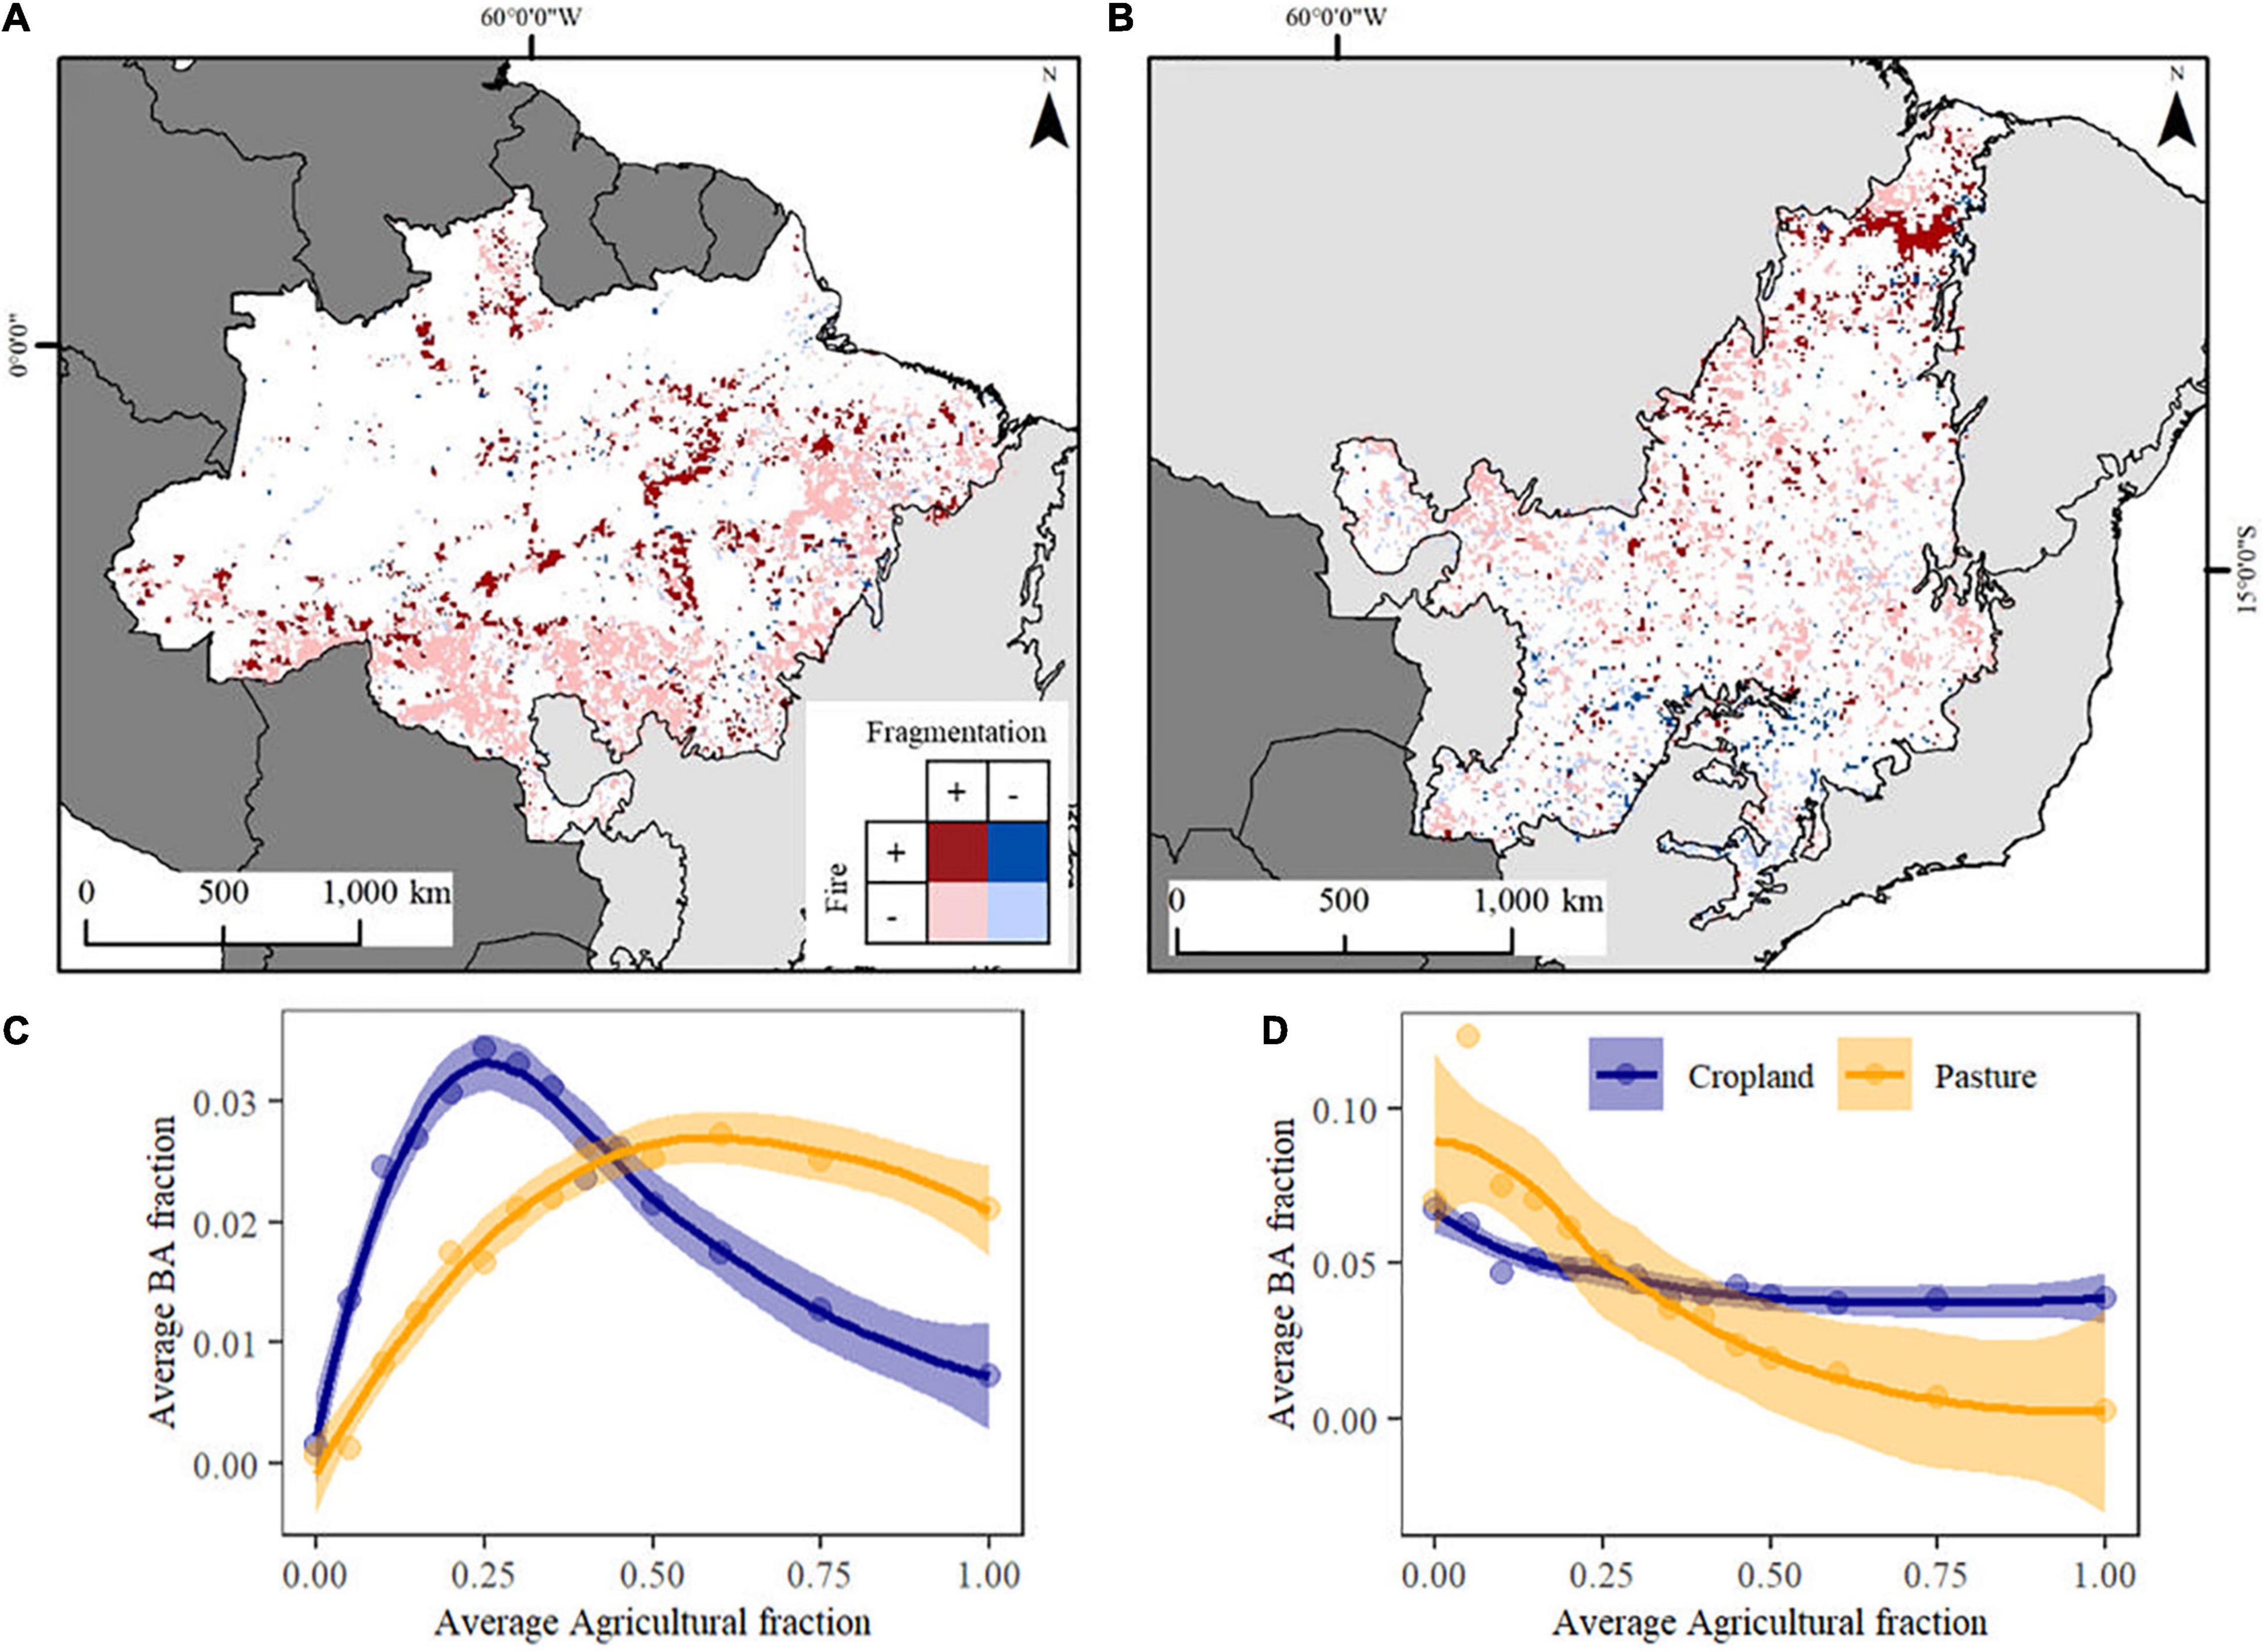
Figure 5. Pixel-based integration of the fragmentation and BA fraction trends (p < 0.05) between 2002 and 2018 for (A) Amazonia and (B) Cerrado. Non-significant pixels and pixels with no BA data are shown in white inside the biome boundaries; (C) Amazonia average BA fraction according to thresholds of agricultural fraction within grid-cells (i.e., Cropland and Pasture); (D) Cerrado average BA fraction according to thresholds of agricultural fraction within grid-cells (i.e., Cropland and Pasture). The relationship between BA fraction and agriculture was fitted with a LOESS regression. Note that the average scale for panels (C,D) are not the same due to the different scale of BA in each biome. A histogram frequency of each category of panels (A,B) maps is on Supplementary Figure 3.
In the Cerrado biome (Figure 5B) about 5% of grid-cells showed a significant (p < 0.05) positive trend in landscape fragmentation combined with a negative trend in BA fraction over the period analyzed, with an increase in both pasture (15%) and cropland fraction (79%) (Supplementary Figure 3). Spatially, these grid-cells are spread over the whole Cerrado biome. About 2% of grid-cells exhibited positive trends (p < 0.05) in both landscape fragmentation and BA fraction and were concentrated mostly in the Maranhão state (north of the Cerrado biome). These grid-cells exhibited a 19% increase in pasture fraction and an increase of >200% in cropland fraction (Supplementary Figure 3).
The relationship between BA fraction and agricultural management for Amazonia and the Cerrado is presented in Figures 5C,D, respectively. For Amazonia (Figure 5C), it is evident that BA fraction increases rapidly when land starts to be cleared for cropland, reaching a maximum when it reaches a threshold of around 25–30% cropland cover and BA decreases thereafter. On the other hand, grid-cells showed a lagged increase in BA fraction at low pasture cover, but then surpasses the BA fraction associated to cropland. The same analysis for the Cerrado shows a different pattern (Figure 5D), with reduced BA with increases in cropland and pasture cover. When the grid-cell reaches a threshold of around 30% agricultural cover, the BA fraction associated to cropland remains constant, but continues to reduce in grid-cells associated with higher pasture cover.
Discussion
Our study demonstrates that in Amazonia, landscape fragmentation increases the BA fraction within native vegetation fragments and that this pattern is opposite in the Cerrado, where a higher degree of landscape fragmentation leads to a decrease in BA within the remaining intact fragments. Our findings for Amazonia agree with a previous study which shows that in the Central Brazilian Amazonia deforestation increases forest edge (i.e., fragmentation process) facilitating the spread of fire into forest (Silva C. H. L. et al., 2018). The carbon loss associated with fragmentation, due to the edge-effect, is not accounted for in the national greenhouse gas inventories (NGHGI) and it is estimated to correspond to around one-third of the losses from deforestation (Silva Junior et al., 2020). We found a positive trend (i.e., increasing) in landscape fragmentation between 2002 and 2018 in about 16% of the Amazonia and the carbon losses due to this process is currently not being accounted in the NGHGI.
Land-use management is a key driver of ignition because fire is naturally rare in the Amazonian forests and its occurrence is strongly related with human activities (Pivello, 2011). It is reported that there is a rapid increase in fire incidence when the land starts to be cleared for intensive agriculture (e.g., cropland for soybeans), peaking when the cropland cover reaches a threshold of ∼35% within the grid-cell and then declining (Aragão and Shimabukuro, 2010). We found similar results analyzing the cropland and pasture fractions, where BA fraction starts to decline at the ∼25–30% of cropland cover threshold, and with landscapes mostly dominated by pasture cover (>45%) being associated with higher BA fraction within forests fragments. Moreover, we show that drought years associated with anthropogenic activity increases the magnitude of BA fraction within grid-cells with a lower degree of landscape fragmentation. This facilitates the spread of anthropogenic fires into intact areas. The spread of forest fires over these grid-cells mostly composed of intact fragments leads to changes in forest structure and C dynamics (Brando et al., 2014; Silva C. V. J. et al., 2018), and consequently contributes to a decline on Amazonia C sink (Gatti et al., 2021) and large unaccounted C emissions in National inventories (Aragão et al., 2018; Gatti et al., 2021; Qin et al., 2021).
Landscape fragmentation in Cerrado can act in two ways: (i) facilitating the ignition and increase in anthropogenic fires during the dry season, which leads to more intense and hotter fires (Fidelis, 2020), killing trees and shrubs, favoring grasses and open vegetation types, and (ii) suppressing the spread of either uncontrolled or natural fires (i.e., caused by lightning at the end of the wet season) between the fragments. These natural fires are essential to maintain the Cerrado vegetation structure, composition, and biodiversity. Here we show an increase in landscape fragmentation over ∼15% of the Brazilian Cerrado and a decrease in BA fraction in highly fragmented landscapes where there is an increase in agricultural land. This is particularly concerning because the increase in landscape fragmentation can impact the natural fire regime of the Cerrado limiting the spread of natural wildfires between fragments. However, in our study we analyzed the total annual BA and to better understand the effect of landscape fragmentation on fire regime in the Cerrado, future studies should consider separately the dynamic of natural and anthropogenic fires.
The decrease in natural wildfires in the Cerrado has been reported in several studies to be due to the lack of a fire policy (Durigan and Ratter, 2016; Durigan, 2020; Schmidt and Eloy, 2020). This process contributes to changes in the vegetation that have implications for biodiversity and the C cycle, for example, the increase of woody biomass (woody encroachment) (Durigan and Ratter, 2016; Pellegrini et al., 2016; Abreu et al., 2017). About 19% of the remaining natural vegetation in the Cerrado is exhibiting woody encroachment (Rosan et al., 2019) with a higher rate compared to other savanna biomes around the world (Stevens et al., 2017), and is likely related to anthropogenic landscape fragmentation which facilitates the suppression of natural wildfires (Rosan et al., 2019). These woody encroached areas contribute to a build-up of combustible material, leading to megafires during the dry season and in extreme droughts years. Here we show that during drought years the median BA fraction in the Cerrado Interior category increases by up to 91% (from 12 to 23%) compared to the non-drought average, burning large areas in grid-cells with higher cover of native vegetation. These large and more intense fires linked to woody encroachment causes a loss of savanna biodiversity (Pellegrini et al., 2016; Abreu et al., 2017) and potentially higher C emissions when fires occur. The impact of these encroached areas on the C fire emissions remains to be quantified and further studies are needed to address this question.
Fire is driven by complex interactions between climate, vegetation and human activity that vary over time and space (Hantson et al., 2016). Temperatures and intensity of the dry season are predicted to increase under future climate scenarios for South America (Kitoh et al., 2013; Ortega et al., 2021). For both the Amazonia and Cerrado, our results show that drought exacerbates BA fraction, such that it can spread over areas of intact natural vegetation more easily. Given that the climate is predicted to become hotter and drier during the 21st century, fire in both biomes associated to human activity is likely to spread over large areas of intact native vegetation (Fonseca et al., 2019) potentially resulting in large fire-induced carbon emissions. This could shift these ecosystems from C sinks to sources (Bustamante et al., 2012), a process that is already occurring in parts of Amazonia (Gatti et al., 2021).
This study focused on specific aspects of the human activity on BA fraction (i.e., fragmentation and land-use management) in two contrasting biomes. Our results show that the Amazonia and the Cerrado biomes exhibit divergent patterns in the relationship between BA fraction, landscape fragmentation, and agricultural fraction which is exacerbated during drought years. Although most of global fire-vegetation models include some consideration of the role of human activity in fire regimes (Rabin et al., 2017), this is one of the components that is treated most simplistically in the current generation of models (Ford et al., 2021) with most including global relationships, e.g., a single relationship between fire and population density applicable to all biomes. This study provides empirical evidence of the biome-specific relationships which will inform the fire-modeling community. Incorporating biome specific relationships into global fire-enable DGVMs or Earth System models (ESMs) is key to representing the complex interactions between fire and anthropogenic activity and improve the representation of regional fire dynamics. It will also improve estimates of fire impacts on the C cycle and contribute to reduce uncertainties and provide improved predictions of future changes in the fire regime and ecosystem services under future climate and land-use scenarios.
Data Availability Statement
The original contributions presented in the study are included in the article/Supplementary Material, further inquiries can be directed to the corresponding author.
Author Contributions
TR, SS, and LA designed the study. TR compiled, analyzed the data, and led the writing of the manuscript with contributions of all authors. All authors contributed to the article and approved the submitted version.
Funding
This research has been supported by the Newton Fund through the Met Office Climate Science for Service Partnership Brazil (CSSP Brazil), RECCAP2 project which is part of the ESA Climate Change Initiative (contract no. 4000123002/18/I-NB), and the H2020 European Institute of Innovation and Technology (4C; Grant No. 821003). VH was supported by a NERC GW4+ Doctoral Training Partnership studentship from the Natural Environment Research Council (NE/L002434/1).
Conflict of Interest
The authors declare that the research was conducted in the absence of any commercial or financial relationships that could be construed as a potential conflict of interest.
Publisher’s Note
All claims expressed in this article are solely those of the authors and do not necessarily represent those of their affiliated organizations, or those of the publisher, the editors and the reviewers. Any product that may be evaluated in this article, or claim that may be made by its manufacturer, is not guaranteed or endorsed by the publisher.
Supplementary Material
The Supplementary Material for this article can be found online at: https://www.frontiersin.org/articles/10.3389/ffgc.2022.801408/full#supplementary-material
Footnotes
References
Abreu, R. C. R., Hoffmann, W. A., Vasconcelos, H. L., Pilon, N. A., Rossatto, D. R., and Durigan, G. (2017). The biodiversity cost of carbon sequestration in tropical savanna. Sci. Adv. 3:e1701284. doi: 10.1126/sciadv.1701284
Andela, N., Morton, D. C., Giglio, L., Chen, Y., van der Werf, G. R., Kasibhatla, P. S., et al. (2017). A human-driven decline in global burned area. Science 356, 1356–1362. doi: 10.1126/science.aal4108
Aragão, L. E. O. C., Anderson, L. O., Fonseca, M. G., Rosan, T. M., Vedovato, L. B., Wagner, F. H., et al. (2018). 21st Century drought-related fires counteract the decline of Amazon deforestation carbon emissions. Nat. Commun. 9, 1–12. doi: 10.1038/s41467-017-02771-y
Aragão, L. E. O. C., and Shimabukuro, Y. E. (2010). The incidence of fire in Amazonian forests with implications for REDD. Science 328, 1275–1278. doi: 10.1126/science.1186925
Berlinck, C. N., and Batista, E. K. L. (2020). Good fire, bad fire: it depends on who burns. Flora 268:151610. doi: 10.1016/j.flora.2020.151610
Brando, P. M., Balch, J. K., Nepstad, D. C., Morton, D. C., Putz, F. E., Coe, M. T., et al. (2014). Abrupt increases in Amazonian tree mortality due to drought-fire interactions. Proc. Natl. Acad. Sci. U.S.A. 111, 6347–6352. doi: 10.1073/pnas.1305499111
Burton, C., Betts, R., Cardoso, M., Feldpausch, R. T., Harper, A., Jones, C. D., et al. (2019). Representation of fire, land-use change and vegetation dynamics in the Joint UK Land Environment Simulator vn4.9 (JULES). Geosci. Model Dev. 12, 179–193. doi: 10.5194/gmd-12-179-2019
Bustamante, M., Nardoto, G., Pinto, A., Resende, J., Takahashi, F., and Vieira, L. (2012). Potential impacts of climate change on biogeochemical functioning of Cerrado ecosystems. Braz. J. Biol. 72, 655–671. doi: 10.1590/s1519-69842012000400005
Cai, W., McPhaden, M. J., Grimm, A. M., Rodrigues, R. R., Taschetto, A. S., Garreaud, R. D., et al. (2020). Climate impacts of the El Niño–Southern Oscillation on South America. Nat. Rev. Earth Environ. 1, 215–231. doi: 10.1038/s43017-020-0040-3
Cleveland, W. S., and Loader, C. (1996). “Smoothing by local regression: principles and methods,” in Statistical Theory and Computational Aspects of Smoothing. Contributions to Statistics, eds W. Härdle and M. G. Schimek (Berlin: Physica-Verlag), 10–49. doi: 10.1007/978-3-642-48425-4_2
Cox, P. M., Harris, P. P., Huntingford, C., Betts, R. A., Collins, M., Jones, C. D., et al. (2008). Increasing risk of Amazonian drought due to decreasing aerosol pollution. Nature 453, 212–215. doi: 10.1038/nature06960
Durigan, G. (2020). Zero-fire: not possible nor desirable in the Cerrado of Brazil. Flora Morphol. Distrib. Funct. Ecol. Plants 268:151612. doi: 10.1016/j.flora.2020.151612
Durigan, G., and Ratter, J. A. (2016). The need for a consistent fire policy for Cerrado conservation. J. Appl. Ecol. 53, 11–15. doi: 10.1111/1365-2664.12559
Fidelis, A. (2020). Is fire always the “bad guy”? Flora 268:151611. doi: 10.1016/j.flora.2020.151611
Fonseca, M. G., Alves, L. M., Aguiar, A. P. D., Arai, E., Anderson, L. O., Rosan, T. M., et al. (2019). Effects of climate and land-use change scenarios on fire probability during the 21st century in the Brazilian Amazon. Glob. Chang. Biol. 25, 2931–2946. doi: 10.1111/gcb.14709
Ford, A. E. S., Harrison, S. P., Kountouris, Y., Millington, J. D. A., Mistry, J., Perkins, O., et al. (2021). Modelling human-fire interactions?: combining alternative perspectives and approaches. Front. Environ. Sci. 9:649835. doi: 10.3389/fenvs.2021.649835
Gatti, L. V., Basso, L. S., Miller, J. B., Gloor, M., Gatti Domingues, L., Cassol, H. L. G., et al. (2021). Amazonia as a carbon source linked to deforestation and climate change. Nature 595, 388–393. doi: 10.1038/s41586-021-03629-6
Giglio, L., Boschetti, L., Roy, D. P., Humber, M. L., and Justice, C. O. (2018). The collection 6 MODIS burned area mapping algorithm and product. Remote Sens. Environ. 217, 72–85. doi: 10.1016/j.rse.2018.08.005
Gloor, M., Gatti, L., Brienen, R., Feldpausch, T. R., Phillips, O. L., Miller, J., et al. (2012). The carbon balance of South America: a review of the status, decadal trends and main determinants. Biogeosciences 9, 5407–5430. doi: 10.5194/bg-9-5407-2012
Hantson, S., Arneth, A., Harrison, S. P., Kelley, D. I., Colin Prentice, I., Rabin, S. S., et al. (2016). The status and challenge of global fire modelling. Biogeosciences 13, 3359–3375. doi: 10.5194/bg-13-3359-2016
Heinrich, V. H. A., Dalagnol, R., Cassol, H. L. G., Rosan, T. M., de Almeida, C. T., Silva Junior, C. H. L., et al. (2021). Large carbon sink potential of secondary forests in the Brazilian Amazon to mitigate climate change. Nat. Commun. 12, 1–11. doi: 10.1038/s41467-021-22050-1
Hijmans, R. J., van Etter, J., Cheng, J., Mattiuzzi, M., Summer, M., Greenberg, J. A., et al. (2017). Geographic Data Analysis and Modeling. R CRAN Proj. 2, 15. Available online at: https://cran.r-project.org/web/packages/raster/raster.pdf (accessed Novemebr 22, 2021).
Kitoh, A., Endo, H., Krishna Kumar, K., Cavalcanti, I. F. A., Goswami, P., and Zhou, T. (2013). Monsoons in a changing world: a regional perspective in a global context. J. Geophys. Res. Atmos. 118, 3053–3065. doi: 10.1002/jgrd.50258
Malhi, Y., Roberts, J. T., Betts, R. A., Killeen, T. J., Li, W., and Nobre, C. A. (2008). Climate change, deforestation, and the fate of the Amazon. Science 319, 169–172. doi: 10.1126/science.1146961
Malhi, Y., Wood, D., Baker, T. R., Wright, J., Phillips, O. L., Cochrane, T., et al. (2006). The regional variation of aboveground live biomass in old-growth Amazonian forests. Glob. Chang. Biol. 12, 1107–1138. doi: 10.1111/j.1365-2486.2006.01120.x
Morandi, P. S., Marimon, B. S., Marimon-Junior, B. H., Ratter, J. A., Feldpausch, T. R., Colli, G. R., et al. (2018). Tree diversity and above-ground biomass in the South America Cerrado biome and their conservation implications. Biodivers. Conserv. 29, 1519–1536. doi: 10.1007/s10531-018-1589-8
Ortega, G., Arias, P. A., Villegas, J. C., Marquet, P. A., and Nobre, P. (2021). Present-day and future climate over central and South America according to CMIP5/CMIP6 models. Int. J. Climatol. 41, 6713–6735. doi: 10.1002/joc.7221
Pan, Y., Birdsey, R. A., Fang, J., Houghton, R., Kauppi, P. E., Kurz, W. A., et al. (2011). A large and persistent carbon sink in the world’s forests. Science 333, 988–993. doi: 10.1126/science.1201609
Patil, I. (2021). Visualizations with statistical details: the “ggstatsplot” approach. J. Open Source Softw. 6:3167. doi: 10.21105/joss.03167
Pellegrini, A. F. A., Socolar, J. B., Elsen, P. R., and Giam, X. (2016). Trade-offs between savanna woody plant diversity and carbon storage in the Brazilian Cerrado. Glob. Chang. Biol. 22, 3373–3382. doi: 10.1111/gcb.13259
Pivello, V. R. (2011). The use of fire in the cerrado and Amazonian rainforests of Brazil: past and present. Fire Ecol. 7, 24–39. doi: 10.4996/fireecology.0701024
Pivello, V. R., Vieira, I., Christianini, A. V., Ribeiro, D. B., da Silva Menezes, L., Berlinck, C. N., et al. (2021). Understanding Brazil’s catastrophic fires: causes, consequences and policy needed to prevent future tragedies. Perspect. Ecol. Conserv. 19, 233–255. doi: 10.1016/j.pecon.2021.06.005
Poulter, B., Frank, D., Ciais, P., Myneni, R. B., Andela, N., Bi, J., et al. (2014). Contribution of semi-arid ecosystems to interannual variability of the global carbon cycle. Nature 509, 600–603. doi: 10.1038/nature13376
Qin, Y., Xiao, X., Wigneron, J. P., Ciais, P., Brandt, M., Fan, L., et al. (2021). Carbon loss from forest degradation exceeds that from deforestation in the Brazilian Amazon. Nat. Clim. Chang. 11, 442–448. doi: 10.1038/s41558-021-01026-5
Rabin, S. S., Melton, J. R., Lasslop, G., Bachelet, D., Forrest, M., Hantson, S., et al. (2017). The Fire Modeling Intercomparison Project (FireMIP), phase 1: experimental and analytical protocols with detailed model descriptions. Geosci. Model Dev. 10, 1175–1197. doi: 10.5194/gmd-10-1175-2017
Rosan, T. M., Aragão, L. E. O. C., Oliveras, I., Phillips, O. L., Malhi, Y., Gloor, E., et al. (2019). Extensive 21st-century woody encroachment in South America’s Savanna. Geophys. Res. Lett. 46, 6594–6603. doi: 10.1029/2019GL082327
Rosan, T. M., Klein Goldewijk, K., Ganzenmüller, R., O’Sullivan, M., Pongratz, J., Mercado, L. M., et al. (2021). A multi-data assessment of land use and land cover emissions from Brazil during 2000–2019. Environ. Res. Lett. 16:074004. doi: 10.1088/1748-9326/ac08c3
Schmidt, I. B., and Eloy, L. (2020). Fire regime in the Brazilian Savanna: recent changes, policy and management. Flora 268:151613. doi: 10.1016/j.flora.2020.151613
Silva, C. H. L., Aragão, L. E. O. C., Fonseca, M. G., Almeida, C. T., Vedovato, L. B., and Anderson, L. O. (2018). Deforestation-induced fragmentation increases forest fire occurrence in central Brazilian Amazonia. Forests 9:305. doi: 10.3390/f9060305
Silva, C. V. J., Aragão, L. E. O. C., Barlow, J., Espirito-Santo, F., Young, P. J., Anderson, L. O., et al. (2018). Drought-induced Amazonian wildfires instigate a decadal-scale disruption of forest carbon dynamics. Philos. Trans. R. Soc. B Biol. Sci. 373:20180043. doi: 10.1098/rstb.2018.0043
Silva Junior, C. H. L., Aragão, L. E. O. C., Anderson, L. O., Fonseca, M. G., Shimabukuro, Y. E., Vancutsem, C., et al. (2020). Persistent collapse of biomass in Amazonian forest edges following deforestation leads to unaccounted carbon losses. Sci. Adv. 6:eaaz8360. doi: 10.1126/sciadv.aaz8360
Souza, C. M., Shimbo, J. Z., Rosa, M. R., Parente, L. L., Alencar, A. A., Rudorff, B. F. T., et al. (2020). Reconstructing three decades of land use and land cover changes in Brazilian biomes with landsat archive and earth engine. Remote Sens. 12:7. doi: 10.3390/RS12172735
Stevens, N., Lehmann, C. E. R., Murphy, B. P., and Durigan, G. (2017). Savanna woody encroachment is widespread across three continents. Glob. Chang. Biol. 23, 235–244. doi: 10.1111/gcb.13409
Vedovato, L. B., Fonseca, M. G., Arai, E., Anderson, L. O., and Aragão, L. E. O. C. (2016). The extent of 2014 forest fragmentation in the Brazilian Amazon. Reg. Environ. Chang. 16, 2485–2490. doi: 10.1007/s10113-016-1067-3
Venevsky, S., Thonicke, K., Sitch, S., and Cramer, W. (2002). Simulating fire regimes in human-dominated ecosystems: Iberian Peninsula case study. Glob. Chang. Biol. 8, 984–998. doi: 10.1046/j.1365-2486.2002.00528.x
Vogt, P. (2018). Measuring Forest Area Density to quantify Forest Fragmentation. (Available in the free JRC Software GuidosToolbox). Eur. Comm. Available online at: http://ies-ows.jrc.ec.europa.eu/gtb/GTB/psheets/GTB-Fragmentation-FADFOS.pdf (accessed Novemebr 3, 2021).
Keywords: Amazonia, Cerrado, landscape fragmentation, fire, land use management, burned area fraction
Citation: Rosan TM, Sitch S, Mercado LM, Heinrich V, Friedlingstein P and Aragão LEOC (2022) Fragmentation-Driven Divergent Trends in Burned Area in Amazonia and Cerrado. Front. For. Glob. Change 5:801408. doi: 10.3389/ffgc.2022.801408
Received: 25 October 2021; Accepted: 20 January 2022;
Published: 24 February 2022.
Edited by:
Gustavo Saiz, Imperial College London, United KingdomReviewed by:
Patrícia Silva, University of Lisbon, PortugalYan Gao, Universidad Nacional Autonoma de Mexico, Mexico
Copyright © 2022 Rosan, Sitch, Mercado, Heinrich, Friedlingstein and Aragão. This is an open-access article distributed under the terms of the Creative Commons Attribution License (CC BY). The use, distribution or reproduction in other forums is permitted, provided the original author(s) and the copyright owner(s) are credited and that the original publication in this journal is cited, in accordance with accepted academic practice. No use, distribution or reproduction is permitted which does not comply with these terms.
*Correspondence: Thais M. Rosan, VC5Sb3NhbkBleGV0ZXIuYWMudWs=