 Kristina J. Bartowitz
 Eric S. Walsh1
 Tara W. Hudiburg
- 1Department of Forest, Rangeland, and Fire Sciences, University of Idaho, Moscow, ID, United States
- 2Management of Complex Systems, University of California, Merced, Merced, CA, United States
Climate change has intensified the scale of global wildfire impacts in recent decades. In order to reduce fire impacts, management policies are being proposed in the western United States to lower fire risk that focus on harvesting trees, including large-diameter trees. Many policies already do not include diameter limits and some recent policies have proposed diameter increases in fuel reduction strategies. While the primary goal is fire risk reduction, these policies have been interpreted as strategies that can be used to save trees from being killed by fire, thus preventing carbon emissions and feedbacks to climate warming. This interpretation has already resulted in cutting down trees that likely would have survived fire, resulting in forest carbon losses that are greater than if a wildfire had occurred. To help policymakers and managers avoid these unintended carbon consequences and to present carbon emission sources in the same context, we calculate western United States forest fire carbon emissions and compare them with harvest and fossil fuel emissions (FFE) over the same timeframe. We find that forest fire carbon emissions are on average only 6% of anthropogenic FFE over the past decade. While wildfire occurrence and area burned have increased over the last three decades, per area fire emissions for extreme fire events are relatively constant. In contrast, harvest of mature trees releases a higher density of carbon emissions (e.g., per unit area) relative to wildfire (150–800%) because harvest causes a higher rate of tree mortality than wildfire. Our results show that increasing harvest of mature trees to save them from fire increases emissions rather than preventing them. Shown in context, our results demonstrate that reducing FFEs will do more for climate mitigation potential (and subsequent reduction of fire) than increasing extractive harvest to prevent fire emissions. On public lands, management aimed at less-intensive fuels reduction (such as removal of “ladder” fuels, i.e., shrubs and small-diameter trees) will help to balance reducing catastrophic fire and leave live mature trees on the landscape to continue carbon uptake.
Introduction
Climate change has intensified and increased the scale of global wildfire impacts in recent decades (Bowman et al., 2020). The western United States 2020 fire season exemplified intensifying fire impacts (Higuera and Abatzoglou, 2020), including high loss of life and property, and the record area burned in the last century in California, Oregon, and Colorado (Higuera and Abatzoglou, 2020). Historically, similar catastrophic wildfires events (i.e., the 1910 Big Burn) instigated development of management policies to prevent and contain wildfire, including a century of fire suppression. In the western United States, climate change is now amplifying the negative effects of these management practices, resulting in unprecedented catastrophic wildfire outcomes (Parks and Abatzoglou, 2020).
Forests provide many ecosystem services such as wildlife habitat, hydrologic benefits, recreation opportunities, and wood harvest (Lawler et al., 2014), and also serve as a critical “natural climate solution”; they act as extensive and persistent carbon sinks that sequester large amounts of carbon from the atmosphere (Turner et al., 2011; Fargione et al., 2018). Increases in climate change-driven wildfire events (Westerling et al., 2006) have led to proposals to increase extractive forest harvest (i.e., the removal of large, mature trees, including altering policy to increase diameter limits to remove even larger trees; Table 1) in areas at high-risk of wildfire to decrease fire risk (Figure 1; Executive Order, 2018; Infrastructure Investment and Jobs Act, 2021). Public opinion and policies have been shaped by the misconception that harvest can reduce fire risk (or save other trees), or that harvest of a singular tree can save that tree from “burning down” (Table 2). These beliefs are widespread (Table 2), but their impact on policy and subsequent impact on on-the-ground harvest has not been quantified. While prescribed fire has been shown to decrease fire risk (Kolden, 2019) and increase carbon storage (Wiedinmyer and Hurteau, 2010), removal of biomass through large-diameter tree thinning or logging produces mixed outcomes for fire risk mitigation and forest resilience (Sohn et al., 2016) and reduces forest carbon storage and sequestration for decades to centuries (Campbell et al., 2012; Bartowitz et al., 2019; Stenzel et al., 2021). The misconception that trees need to be saved from wildfire through harvest (Zinke, 2018; Infrastructure Investment and Jobs Act, 2021; Table 2) may lead to unintended consequences through increased logging. These consequences include increased fire risk, a decreased forest carbon sink, decreased forest resiliency, and loss of the forest as a natural climate solution (Hudiburg et al., 2013; Law et al., 2018; Zald and Dunn, 2018; Stephens et al., 2020).
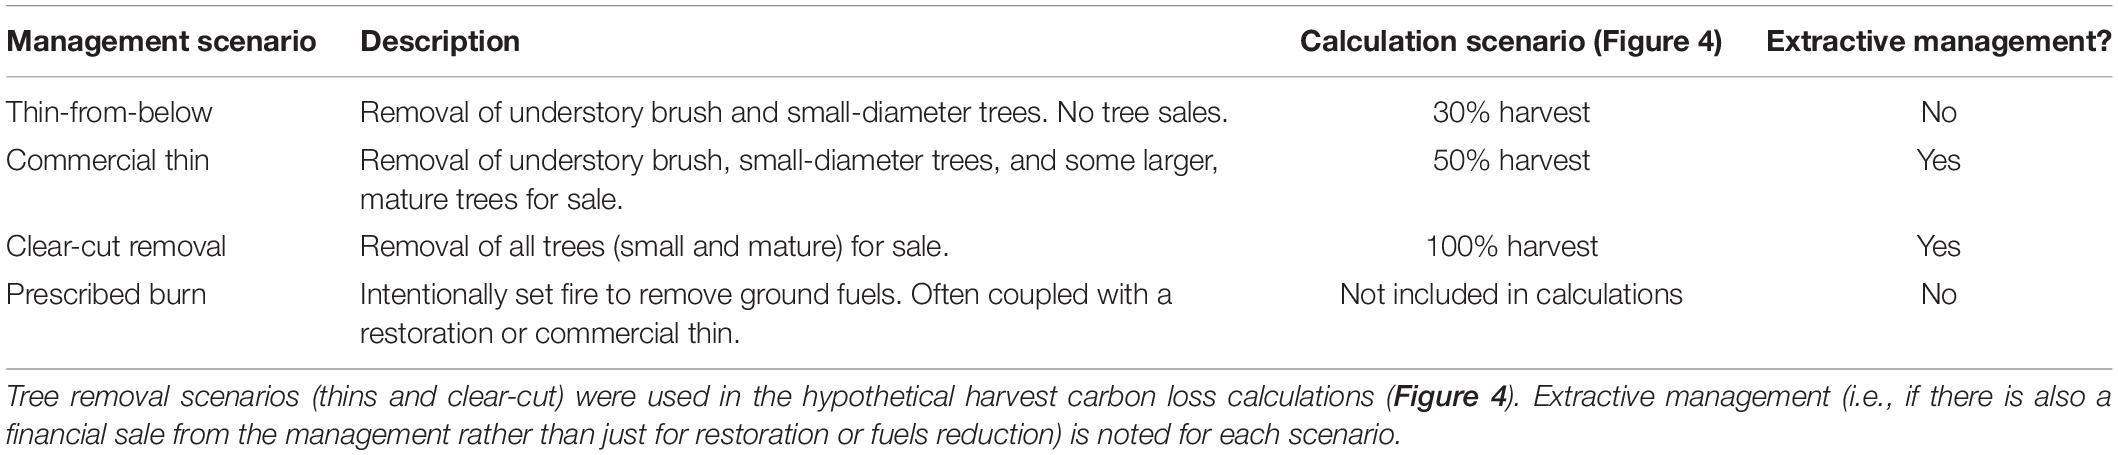
Table 1. Common management scenario types in western United States forests.
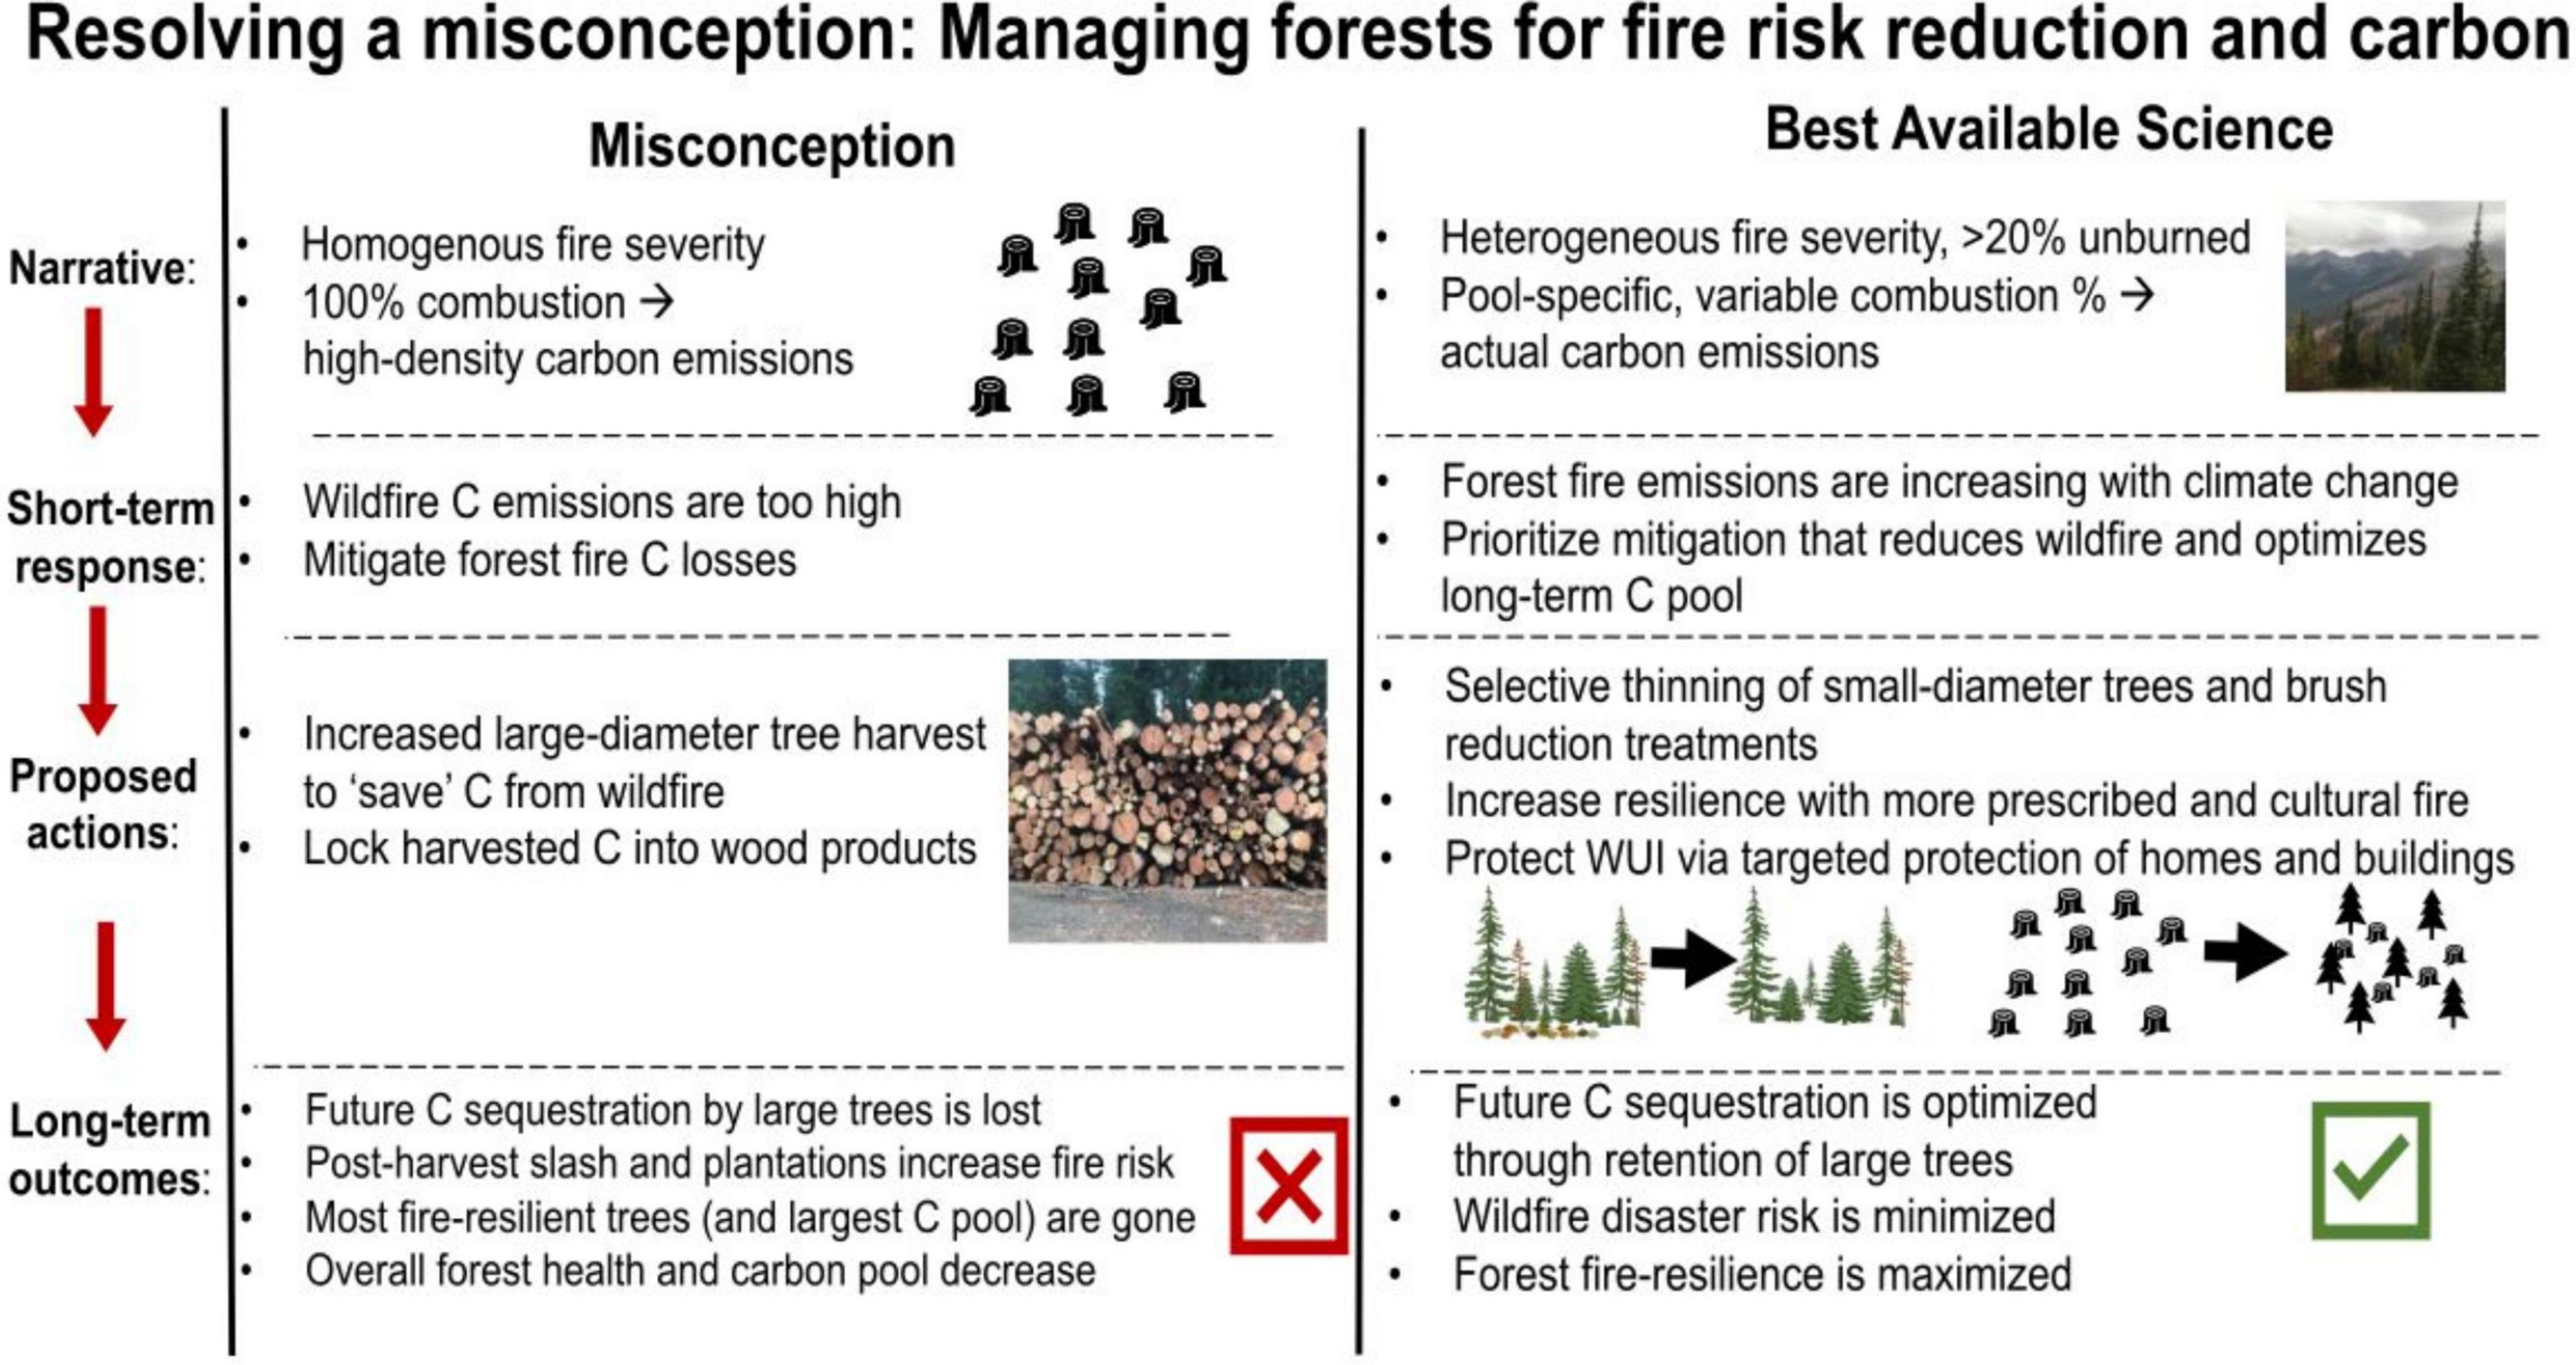
Figure 1. Conceptual figure describing the misconception about extractive forest management (Column 1) and how it can lead to unintended and unwanted consequences with forest resilience and the forest carbon sink. Column 2 describes how we can correct that misconception and develop policies that enhance forest resilience and the forest carbon sink.
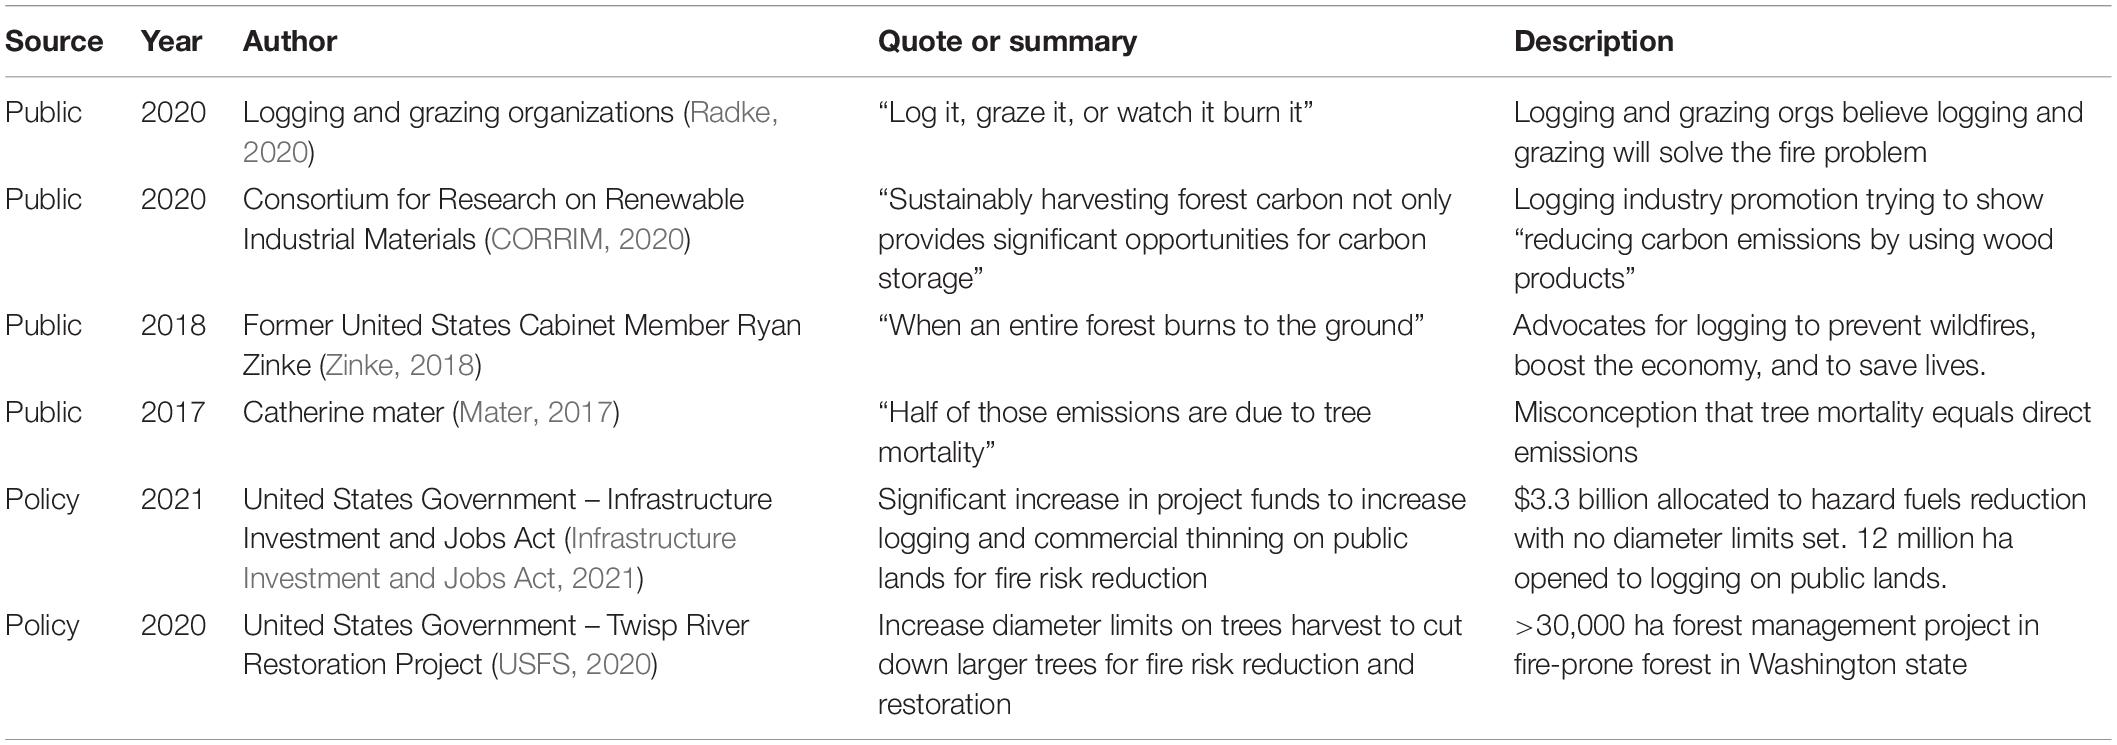
Table 2. Examples of recent public opinions surrounding the logging-forest-carbon misconceptions and how they lead to policy that increases harvest.
Although high intensity fire combusts less than 5% of mature, live tree biomass (Knorr et al., 2016), discussions of fire policy and forest management have framed tree biomass combustion as an undesirable outcome requiring mitigation through extractive forest management (i.e., harvest of mature trees for timber sales; Mater, 2017; Zinke, 2018; Newhouse, 2021; Senate Bill 762, 2021). Increasing, i.e., extractive forest management (Table 1), to “lock” carbon into man-made structures, to increase forest productivity (CORRIM, 2020), or reduce fire risk ignores the volume of forest fire emissions relative to the direct emissions of such strategies (Hudiburg et al., 2019; Stenzel et al., 2019). Previous studies have shown that timber harvest directly kills more trees than forest fire in the western United States (Berner et al., 2017), but it remains unclear how much fire and harvest are contributing to regional total carbon emissions in the western United States, especially in the context of how these emissions compare with anthropogenic FFE (Hudiburg et al., 2019; Stenzel et al., 2019).
Here, we calculate forest fire emissions (average for the last decade; large historical events, and the record 2020 fire season) and compare those to (1) average and hypothetical timber harvest emissions, and (2) average decadal FFE. Our comparisons clarify the relative contributions of extractive forest management, fire, and fossil fuels to atmospheric carbon dioxide concentrations and help provide clarity for future management scenarios intended to reduce carbon emissions and/or increase carbon uptake and the scientific observations that show the opposite occurs. We further show how misrepresentation of fire and management impacts on forest carbon cycling leads to discussions and policies that overestimates benefits to carbon stocks and sequestration, or downplays carbon consequences (Figure 1). Finally, we discuss how policy and management based on carbon cycle science and observations could be used to both reduce fire risk and to increase and maintain carbon storage.
Materials and Methods
Study Area: Forest Fires Across the Western United States
We calculated carbon emissions from the forest fires in the western United States (Figure 1) between 1984 and 2020 and the largest fire in the continental United States, the 1910 Big Burn. Here, we group the “western United States” as the 11 states in the contiguous United States West (i.e., Arizona, California, Colorado, Idaho, Montana, Nevada, New Mexico, Oregon, Utah, Washington, and Wyoming). While there were other extreme forest fires in the 20th century (e.g., 1902 Yacoult Burn in Washington, 1933 Tillamook Burn), historic records of forest attributes were not available for analysis.
Extreme fires have continued to occur in recent decades (Figure 2). Availability of high-resolution fire perimeter and burn severity data allows for analysis of fires since 1984 (Eidenshink et al., 2007) through 2020. All wildfires >526 ha (1,000 acres) with >50% forest area within the burn perimeter were included in this analysis. In addition, we selected large, notable forest fires (or complexes of individual fires; referred to as “extreme” fires throughout the manuscript) that occurred between 1984 and 2020. Fires were selected based on how notable they were at the time for size, duration, volatile fire behavior and legacy of impact in the subsequent years. Wildfires included in the “extreme fires” list (Table 1) were chosen from the created emissions database based on high area burned (i.e., >40,000 ha), and overall significance of fire event (i.e., most were record events in some way such as: highest area burned in that state or human impacts).
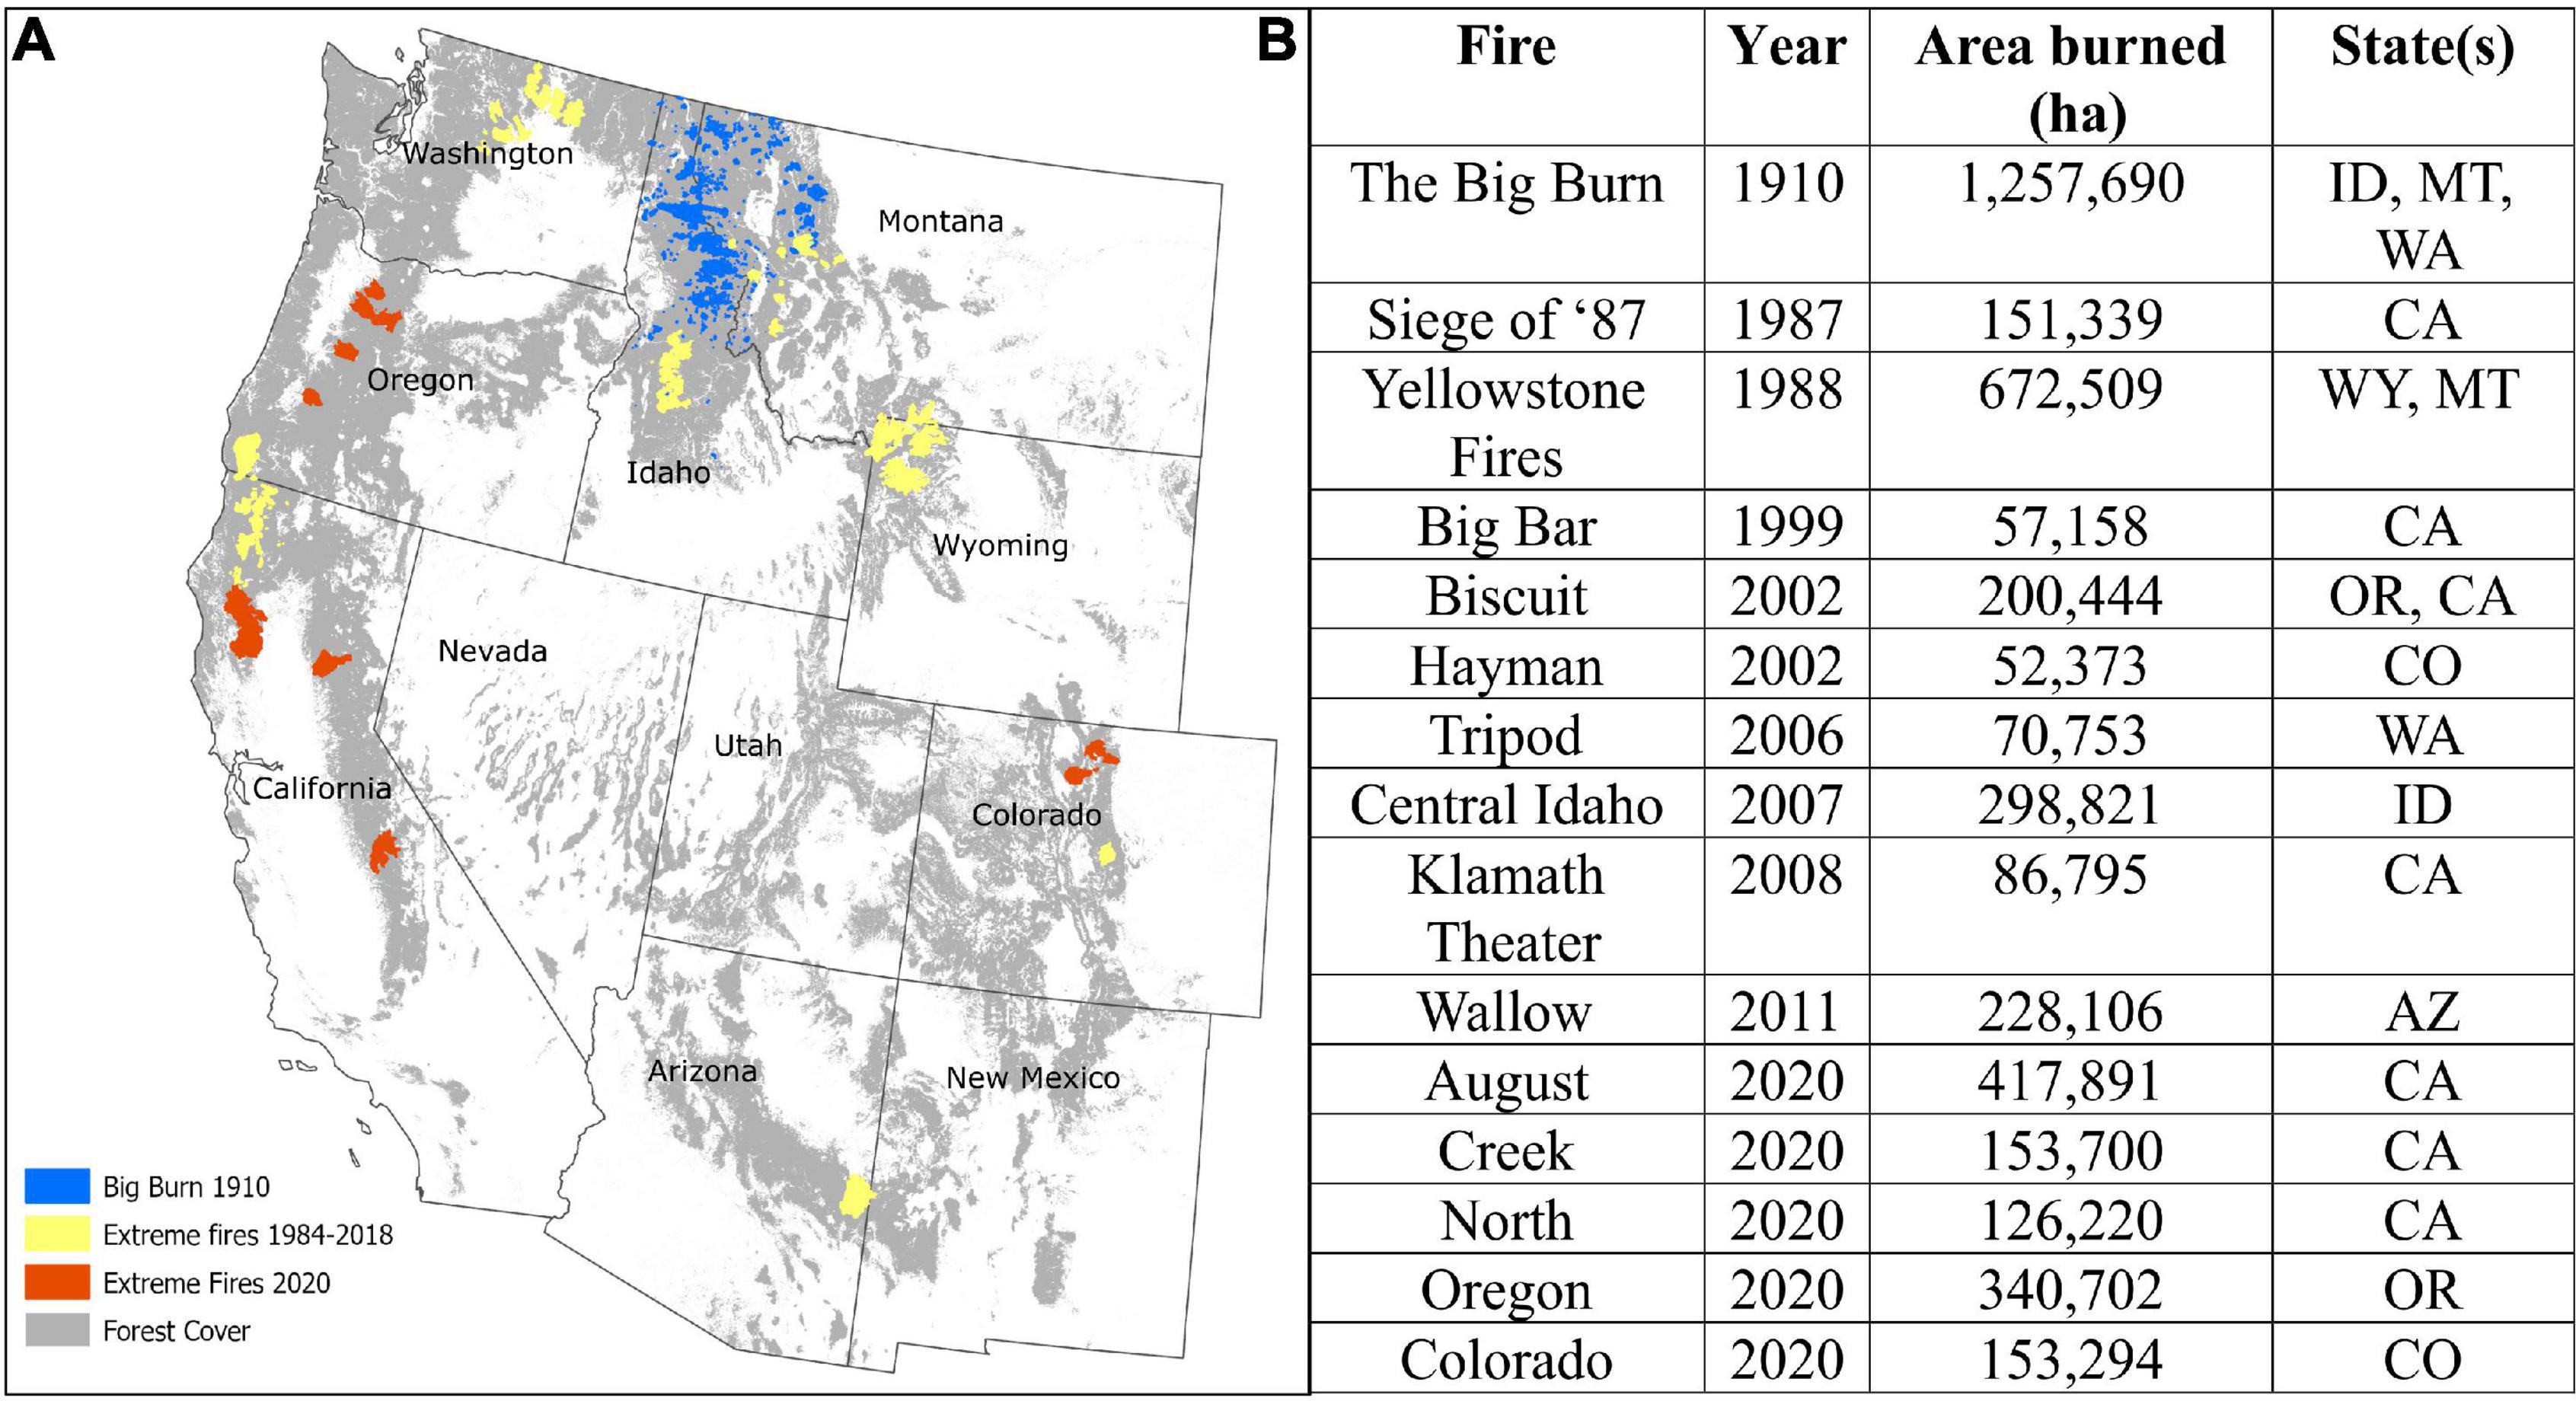
Figure 2. Extreme forest wildfires in the western United States. (A) Perimeters of forest fires in 2020, a selection of extreme forest fire events 1984–2018, and of the 1910 Big Burn fires. (B) Fire statistics of the 1910 Big Burn and contemporary fires (1984–2020) within the Western United States.
Emissions have not been previously calculated for the Big Burn. We have calculated an estimate from the Big Burn not only because it is the largest known fire to have occurred in the continental United States, but also to serve as a baseline or reference for the range of emissions possible in the absence of fire suppression. While the Big Burn emissions estimate is calculated differently from modern fires due to lack of forest data from that time, the comparison between modern fire emissions and the Big Burn is still useful and has been completed with the best possible methodology given data availability. The 1910 Big Burn encompassed an area throughout Washington, Montana, and Idaho (Figure 2). We calculated fire-induced carbon emissions of the Big Burn using historical accounts and records (Koch, 1942). The fire perimeters used in this study were a cross-reference between Koch’s account and the 1910 Fire perimeters (USFS, 1978; Gibson, 2005).
Forest Fire Emissions Calculations
Direct carbon emissions for contemporary forest fires (1984–2020) were calculated using, fire severity and area burned from the Monitoring Trends in Burn Severity database (MTBS; Eidenshink et al., 2007) for forest fires between 1984 and 2019, and Burned Area Emergency Response (BAER; Parsons, 2003) and National Interagency Fire Coordination (NIFC, 2020) data products for 2020 fires. Carbon emissions for the 1910 Big Burn were calculated using area burned from the Northern Rockies Fire atlas for the Big Burn (Gibson, 2005). All carbon stock calculations were from forest type and ecoregion-specific carbon data (Supplementary Figure 1; Buotte et al., 2019; Stenzel et al., 2019), and severity-specific combustion factors (Supplementary Table 1; Stenzel et al., 2019). Only fires that burned > 526 ha and in 50% or greater forested area within the burn perimeter (Ruefenacht et al., 2008) were used in this analysis. Aboveground carbon stocks were calculated for each forest fire area based on average carbon stocks for the forest type and ecoregion and area of the specific forest type within the burn perimeter (Supplementary Table 1). Aboveground carbon stocks were multiplied by the appropriate combustion factor for the fire severity value of that forested area to obtain carbon losses (Supplementary Table 1). Fires between 1984 and 2019 were calculated using MTBS severity classes. Smaller forest fires in 2020 were calculated using an average combustion factor. Big Burn carbon emissions were calculated using a range for the moderate-severe combustion factor which gives us a range (uncertainty) of emissions for this fire. Extreme 2020 forest fire emissions were calculated using BAER severity classes (which are precursors to MTBS severity classes). While we used contemporary forest structure data to calculate emissions from the Big Burn, our range of carbon emissions (Table 3) from this fire are robust because we used stem tree biomass and demographic data from pre-1910 timber cruise inventories (Koch, 1942) to identify FIA plots of similar structure (diameter and heights) and age classes to the 1910 inventory.
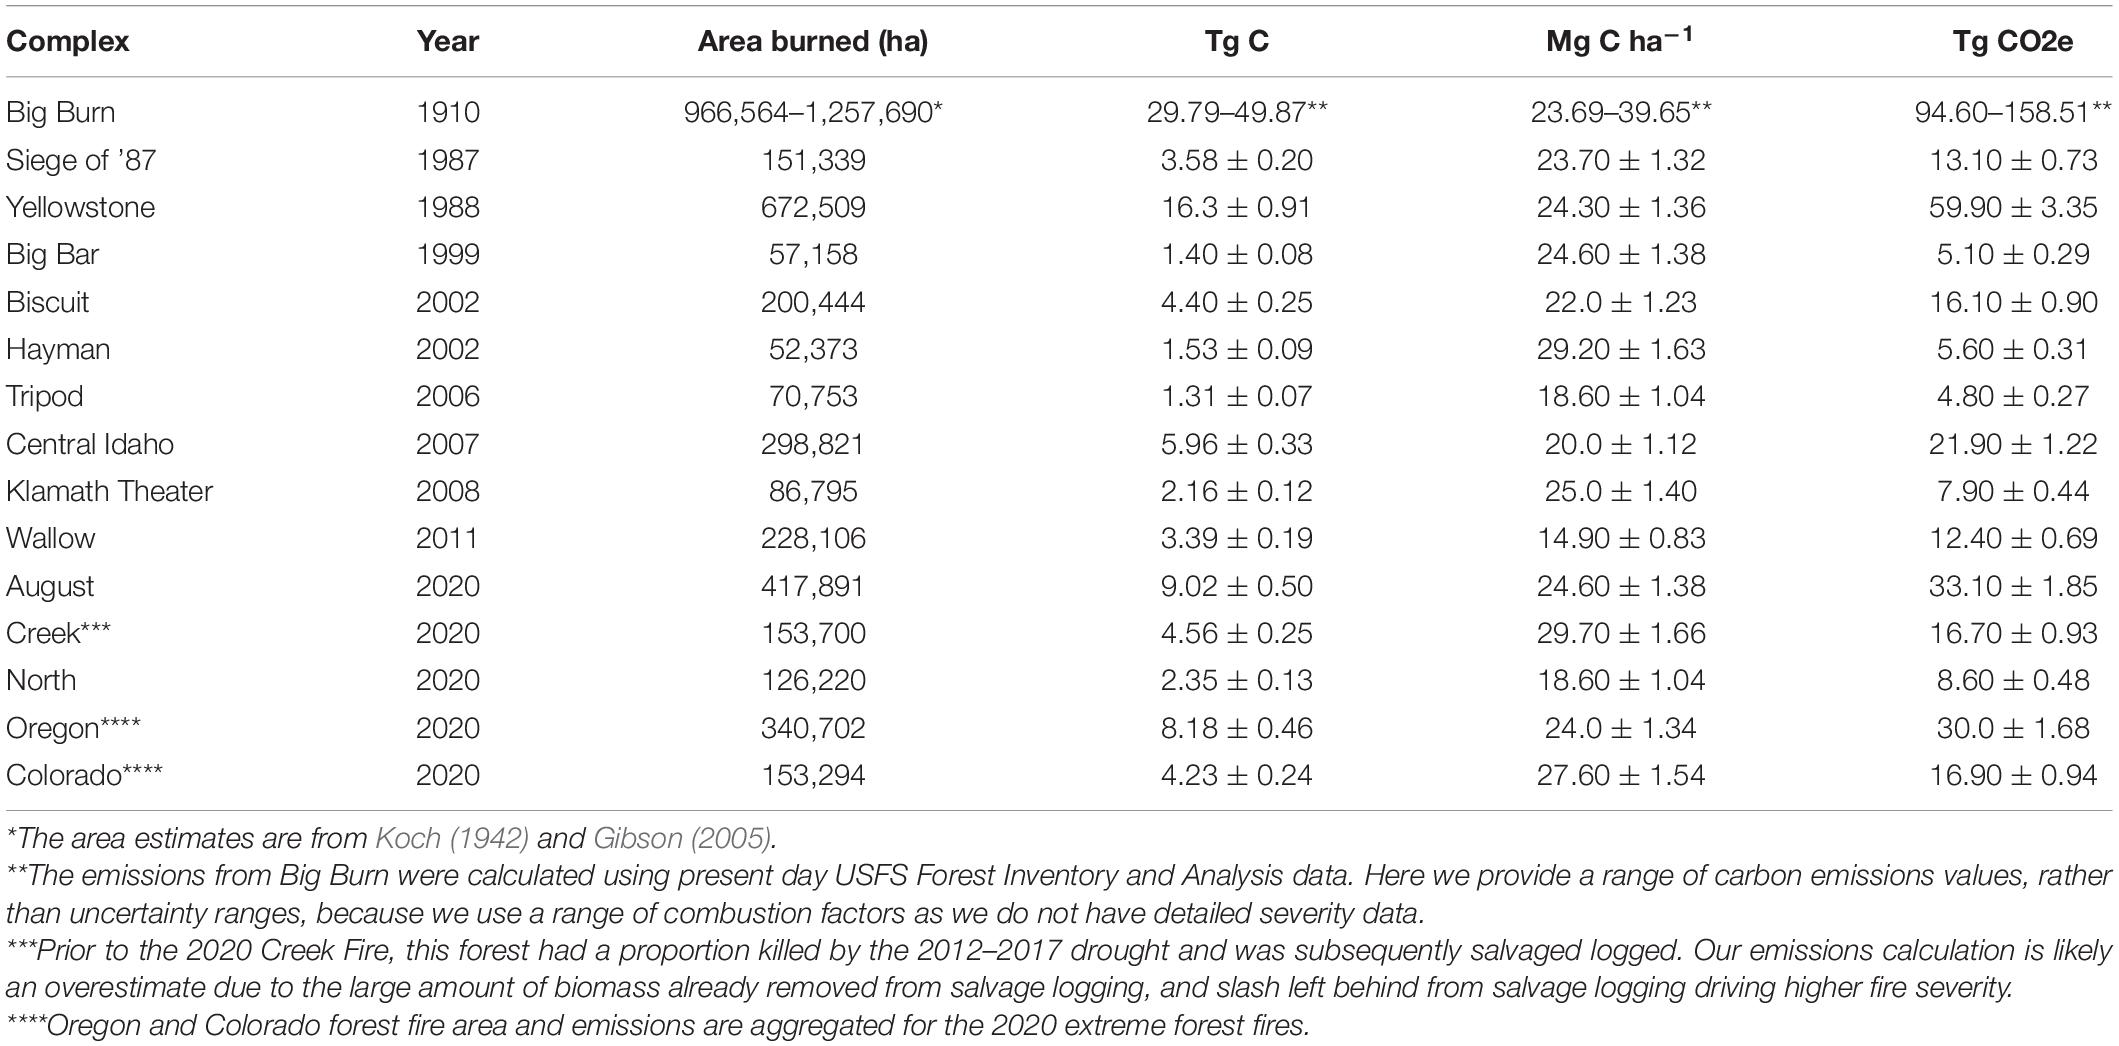
Table 3. Carbon emissions from 1910 Big Burn and extreme contemporary (1984–2020) forest fires in the western United States.
We calculated mean annual forest fire emissions for the western United States and each western United States state based on the 2009–2018 decade, to best represent the observed trends toward increased area burned under climate change (Abatzoglou and Williams, 2016). These calculations were completed using MTBS (Eidenshink et al., 2007) perimeter and severity data, carbon stock data, and combustion factors. All fire carbon losses were converted to Tg CO2e (i.e., tera-grams CO2 equivalent) for comparison with fossil fuel emissions (FFE). To normalize emissions on a per area basis, we calculated megagrams of carbon lost per hectare burned.
To calculate uncertainties for contemporary forest fire emissions, we used a propagation of error approach. We combined uncertainty estimates of each emissions calculation component to calculate total uncertainty for each individual extreme fire event (Table 4). We used the Combining Uncertainties Propagation of Error estimates from the 2006 IPCC Guidelines for National Greenhouse Gas Inventories (Eq. 1; IPCC, 2006).
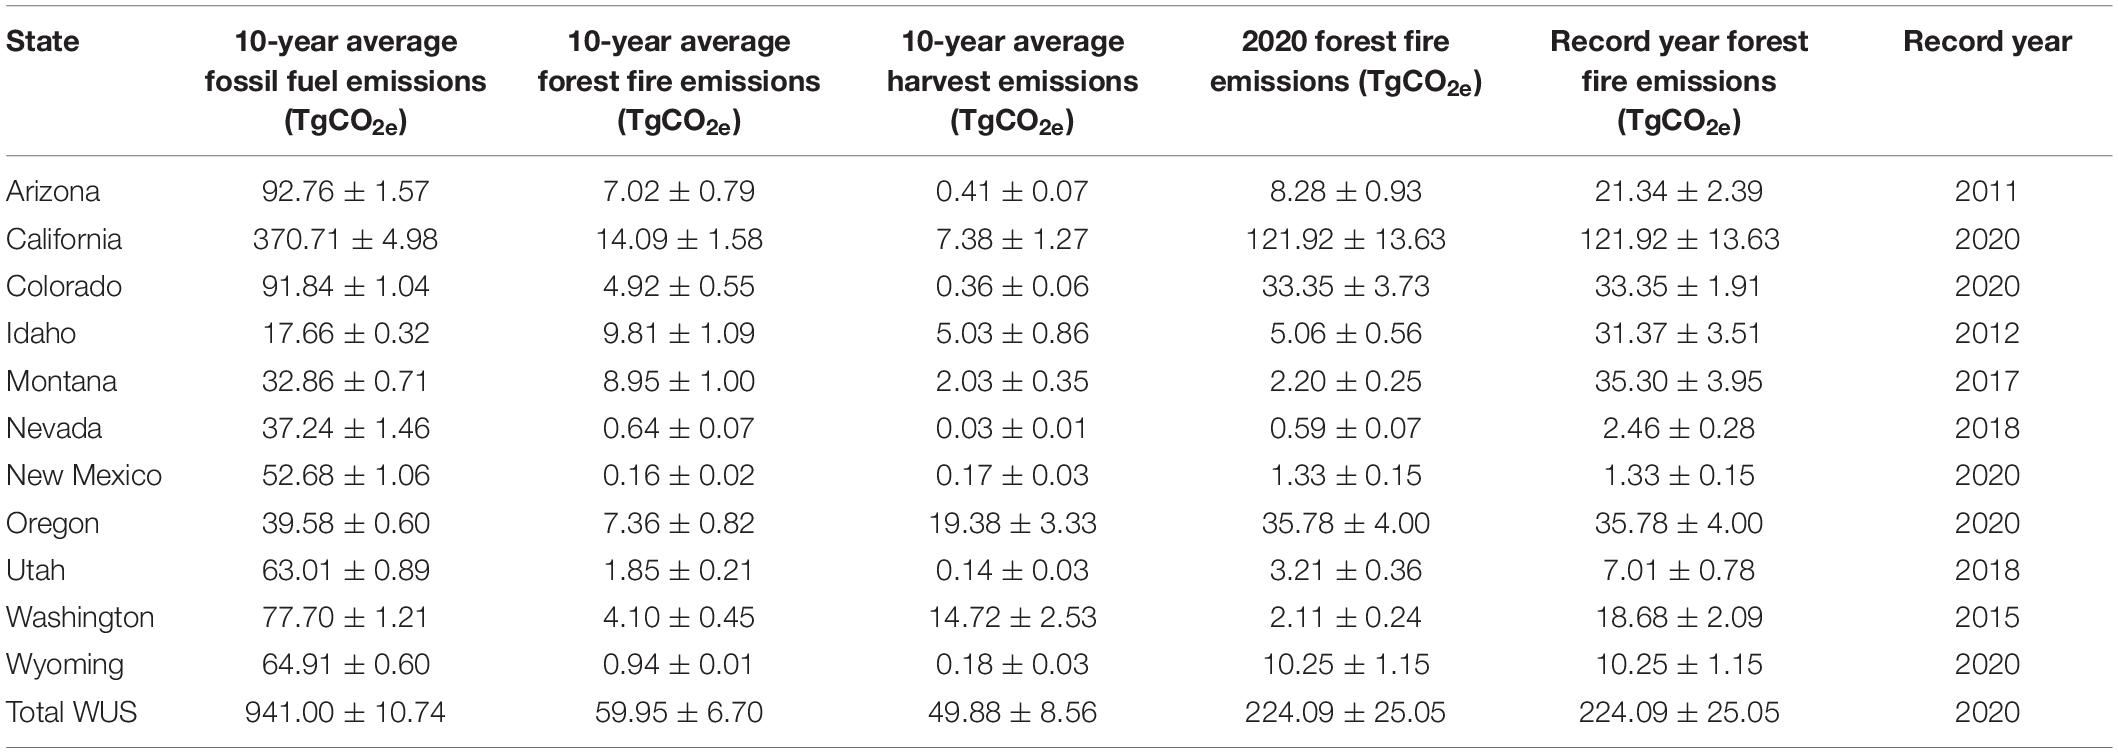
Table 4. Average fossil fuel emissions, forest fire emissions, and harvest emissions, 2020 fire emissions, and record year fire emissions (2008–2020) for all western United States and for the entire western United States region.
Equation 1: Combining Uncertainties (individual associated uncertainties):
Where Utotal = the percentage uncertainty in the sum of the quantities (half the 95 percent confidence interval divided by the total, i.e., mean and expressed as a percentage).
xi and Ui = the uncertain quantities and the percentage uncertainties associated with them. xi refers to the specific fire emission calculation. U1 refers to the uncertainty in biomass calculations (0.05) and U2 refers to remote sensing uncertainty in area burned calculations (0.10).
Calculations and spatial analyses were conducted using R (R Core Team, 2017) and ESRI software (ESRI, 2020).
Timber Harvest and Wood Product Emissions
Hypothetical Harvest Carbon Losses
Hypothetical harvest carbon losses were calculated for all states for burned areas between 2009 and 2019; these are the exact burned areas and pre-fire carbon stocks used to calculate forest fire emissions for this study. This hypothetical calculation allows us to directly compare fire carbon losses to harvest carbon losses on a per area basis. Here, we calculated three scenarios for standing tree carbon (both live trees and snags): 30% harvest, 50% harvest, and 100% harvest. Both 30% and 50% harvests are meant to represent different levels of thinning (thinning-from-below and commercial, respectively), while 100% harvest is akin to a clear-cut harvest (Table 1). For these scenarios, the fraction (30, 50, or 100%) of aboveground carbon for standing live and dead trees was calculated and counted as carbon loss, and then converted to a per area basis. For the hypothetical thinning scenarios we did not include carbon stored in wood products because very little to no long-term wood products would be created from the smaller-diameter trees removed from these types of thinning. These smaller-diameter trees will most likely be used in short-term wood products such as paper (Hudiburg et al., 2019). The hypothetical clear-cut used a static 60% emission from aboveground tree carbon stocks, with 40% remaining in long-term wood products pools. To normalize harvest carbon losses on a per area basis, we calculated megagrams of carbon lost per hectare harvested.
Actual Timber Harvest Carbon Losses
Actual timber harvest calculations were aggregated from publicly-available state and federal historical harvest sources (Hudiburg et al., 2019), including privately-owned lands. Detailed methodology can be found in Hudiburg et al. (2019). We calculated a mean annual harvest loss for the most recent available harvest data for each state (2007–2016) as well as an annual average for the entire western United States. Reported harvest volumes (merchantable) were converted to grams carbon using board feet to cubic volume estimates from Keegan (Keegan et al., 2010). Our calculations include the carbon stored (and released from at end of life) in wood products for the years of this analysis. Wood was assumed to enter short-term (1 to 10 years before emissions return to the atmosphere; includes wood waste at the mills) and long-term (50-year half-life) product pools at rates of 60 and 40%, respectively, (Heath et al., 2010; Hudiburg et al., 2019). All timber harvest carbon losses were converted to Tg CO2e for comparison with FFE.
Fossil Fuel Emissions
Fossil fuel emission numbers were sourced from the Environmental Protection Agency (EPA, 2020). The EPA provides yearly, state-by-state FFE from nearly all emissions sources (i.e., commercial, industrial, residential, transportation, and electric power; Table 4). We calculated an annual average for the most recent available data for each state (2009–2018), as well as an annual average for the entire western United States.
Forest Fire and Fossil Fuel Emission Comparisons
Carbon emissions from forest fires and FFE were normalized on a state-by-state basis by normalizing both average FFE (2009–2018) and record year fire emissions (1984–2020) with average fire emissions (2009–2018). A factor of both average FFE and record year fire emissions over the average fire emissions was calculated for each state.
Results
Forest Fire Carbon Emissions
Carbon emissions from 1984 to 2020 wildfire events varied considerably by fire severity (Supplementary Figure 1), forest type (e.g., varied carbon density), and size (Figure 2). As forest fire carbon emissions are a product of forest type (pre-fire aboveground carbon density per area, Figure 3) and fire severity (Table 4), it is notable that Colorado fires generally exhibit higher emissions per unit area (27.60 Mg C ha–1) compared to other 2020 fire events in Oregon and California, although the 2020 Creek Fire in California had the highest emissions per unit area for a single contemporary fire (Table 4). This highlights how severely Colorado wildfires have burned in recent decades, given their lower pre-fire carbon density. By contrast, Oregon forests have much higher pre-fire carbon density and slightly lower area-normalized emissions compared to other western fires because they burned, on average, at a lower severity (Figure 3). When normalized by area burned to control for size, there is notable variation amongst the contemporary extreme fires in emissions per hectare (Table 4). For example, the 2020 Creek Fire in California had the highest emissions per hectare (29.7 Mg C ha–1), and fires in Colorado all exceed the Idaho, Montana, and Wyoming fires, and many in the carbon-dense forests of Oregon when normalized by area. In addition, >90% of the burn area of extreme forest fires in 2020 were in low-to-moderate severity classes (Supplementary Figure 1).
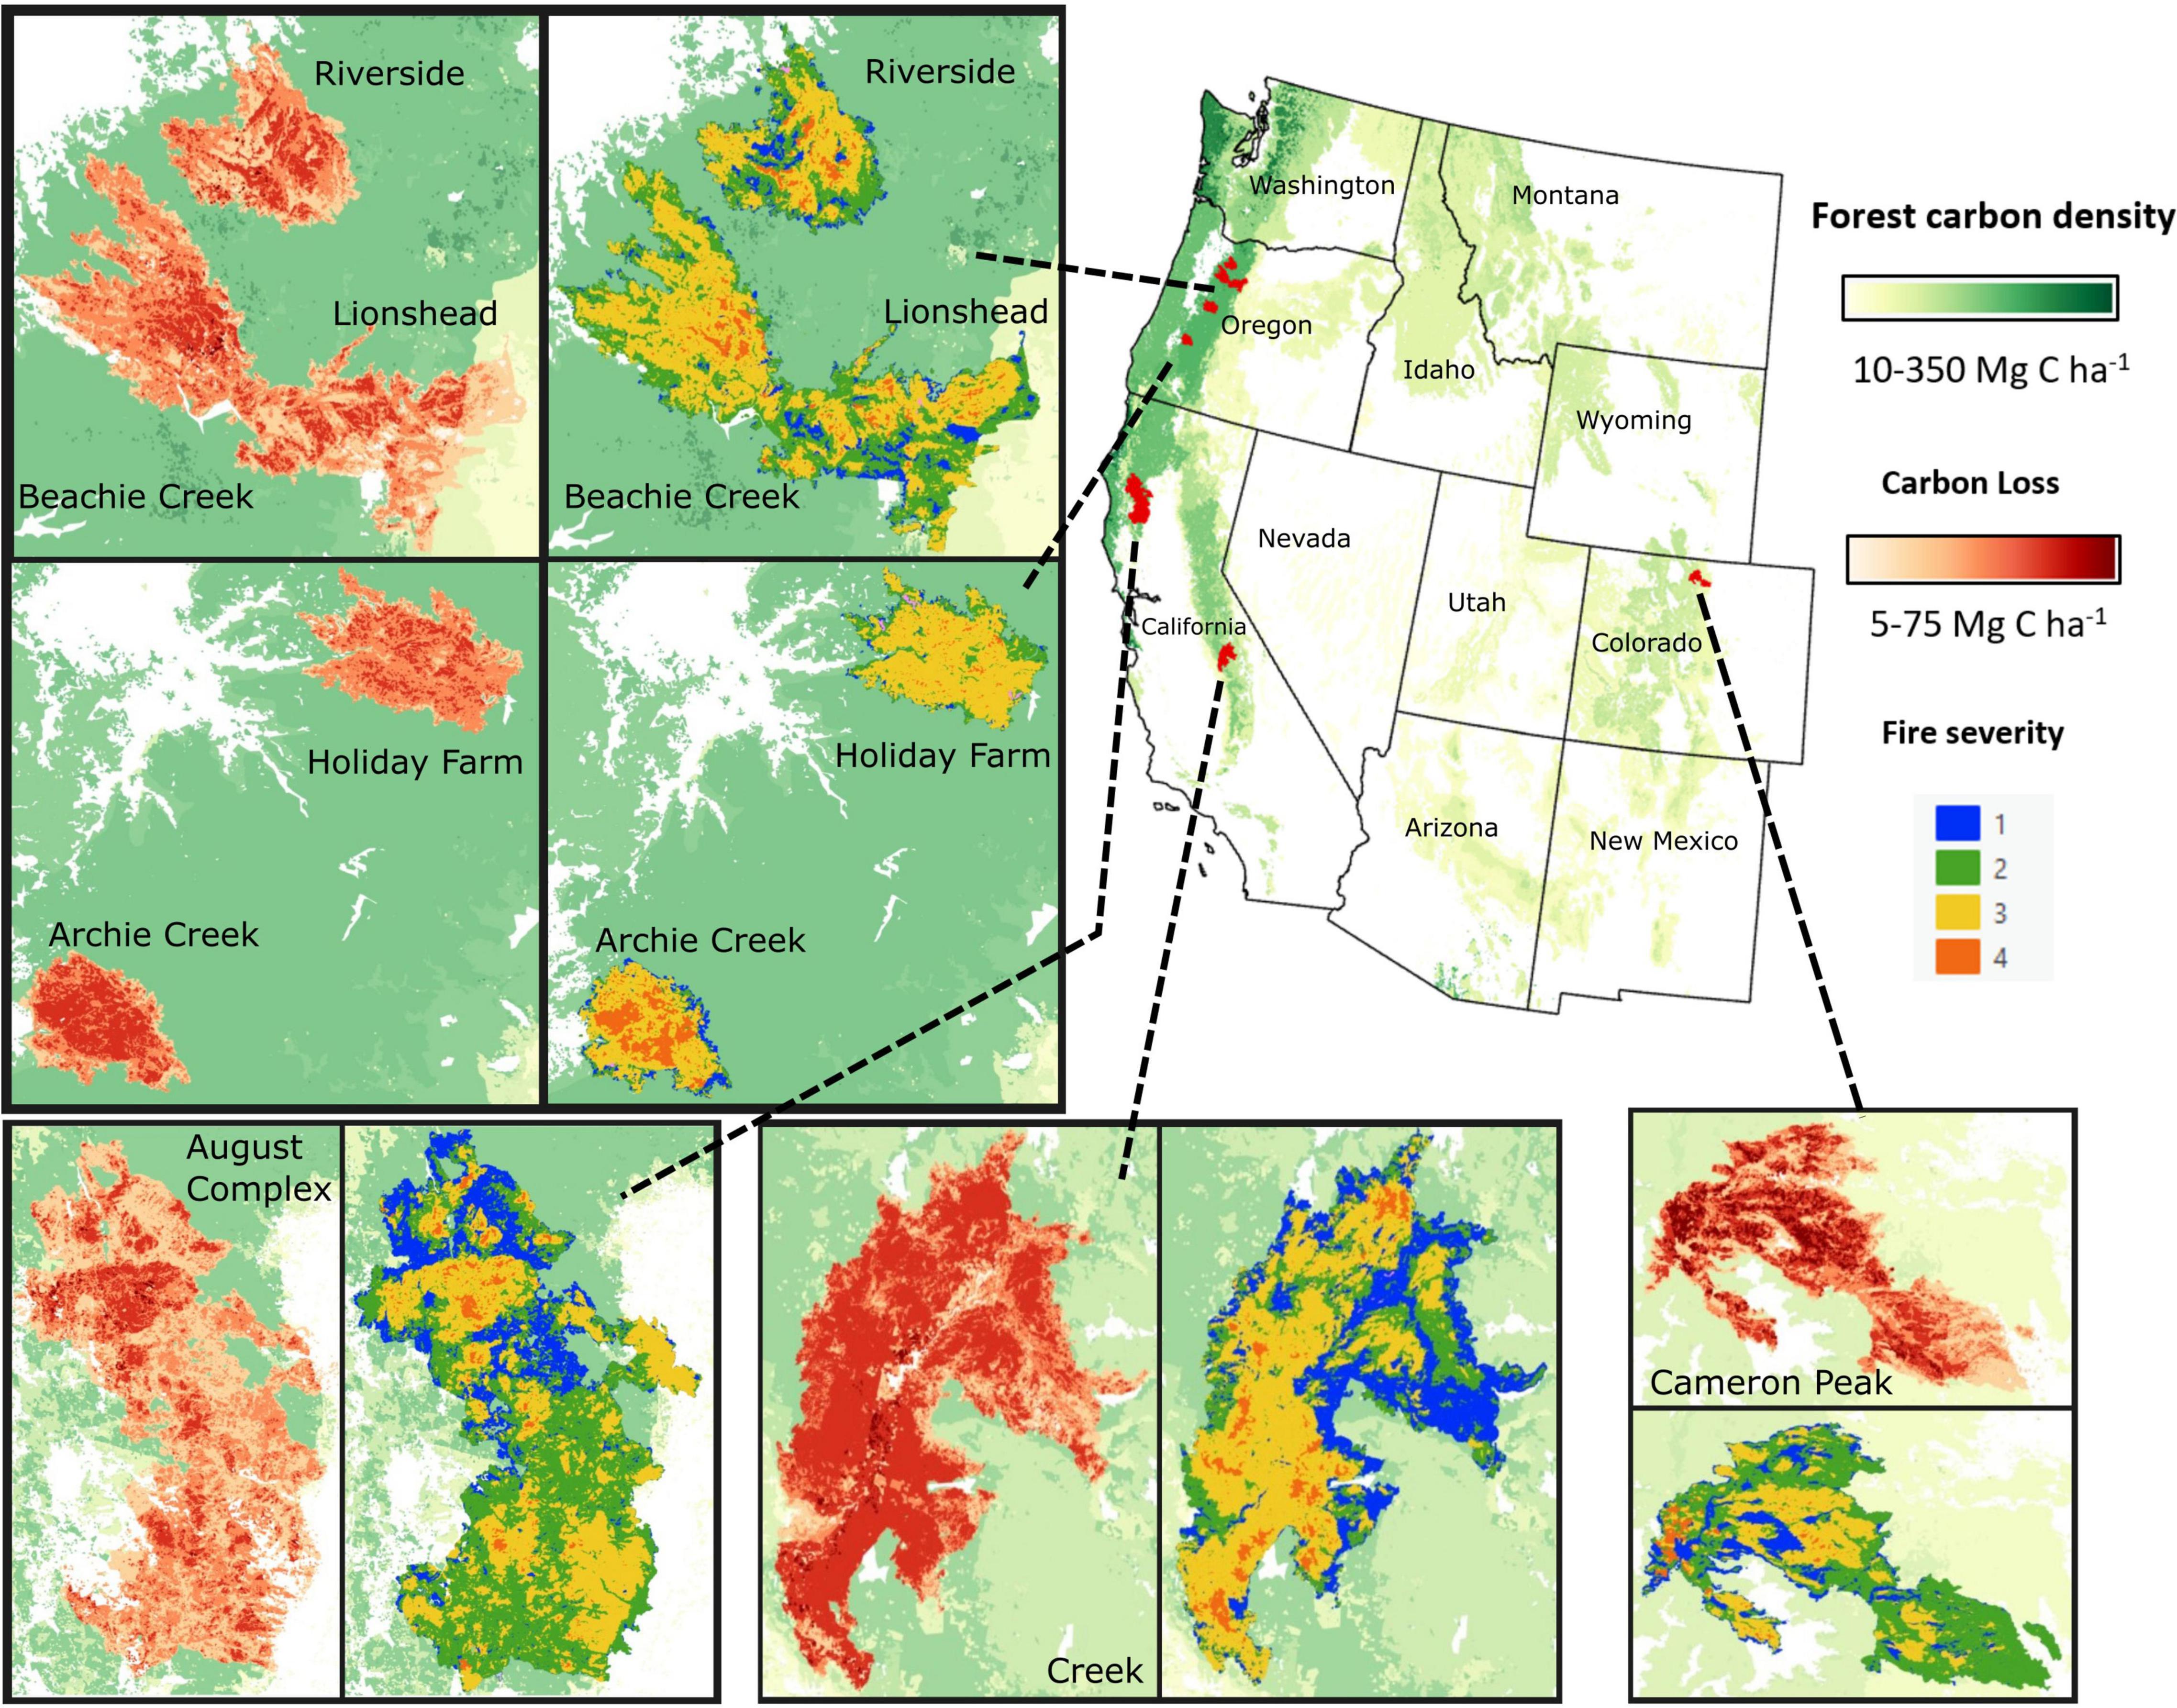
Figure 3. Fire perimeters and forest carbon density losses (Mg C ha–1) from 2020 extreme, large forest fires in CA, CO, and OR (>100,000 acres). Green background indicates aboveground carbon forest layer, where darker green forest cover denotes higher density of aboveground carbon. Detailed maps display both fire severity (multicolored fire area), and per area carbon losses (red fire area).
Harvest Carbon Losses
Total average annual western United States total harvest emissions were lower than total average forest fire emissions (Table 4), however, actual harvest area is much lower than area burned (Berner et al., 2017). Actual harvest carbon losses vary greatly by state, with carbon-dense Oregon and Washington having the highest biomass harvest removals (Table 4). However, on a per unit area basis, hypothetical 100% harvest is 2–8 times greater than fire for the same perimeters across the entire region (Figure 4). We calculated hypothetical harvest carbon losses for the exact burn areas in each state to compare per area harvest losses. We found that for all states a 50–100% harvest would have led to greater carbon losses than fire for those burned areas, and even a 30% harvest led to greater carbon losses than fire for all but four of the western United States. Hypothetical harvest carbon losses continue to outpace fire carbon losses on a per unit area basis for most scenarios (Figure 4).
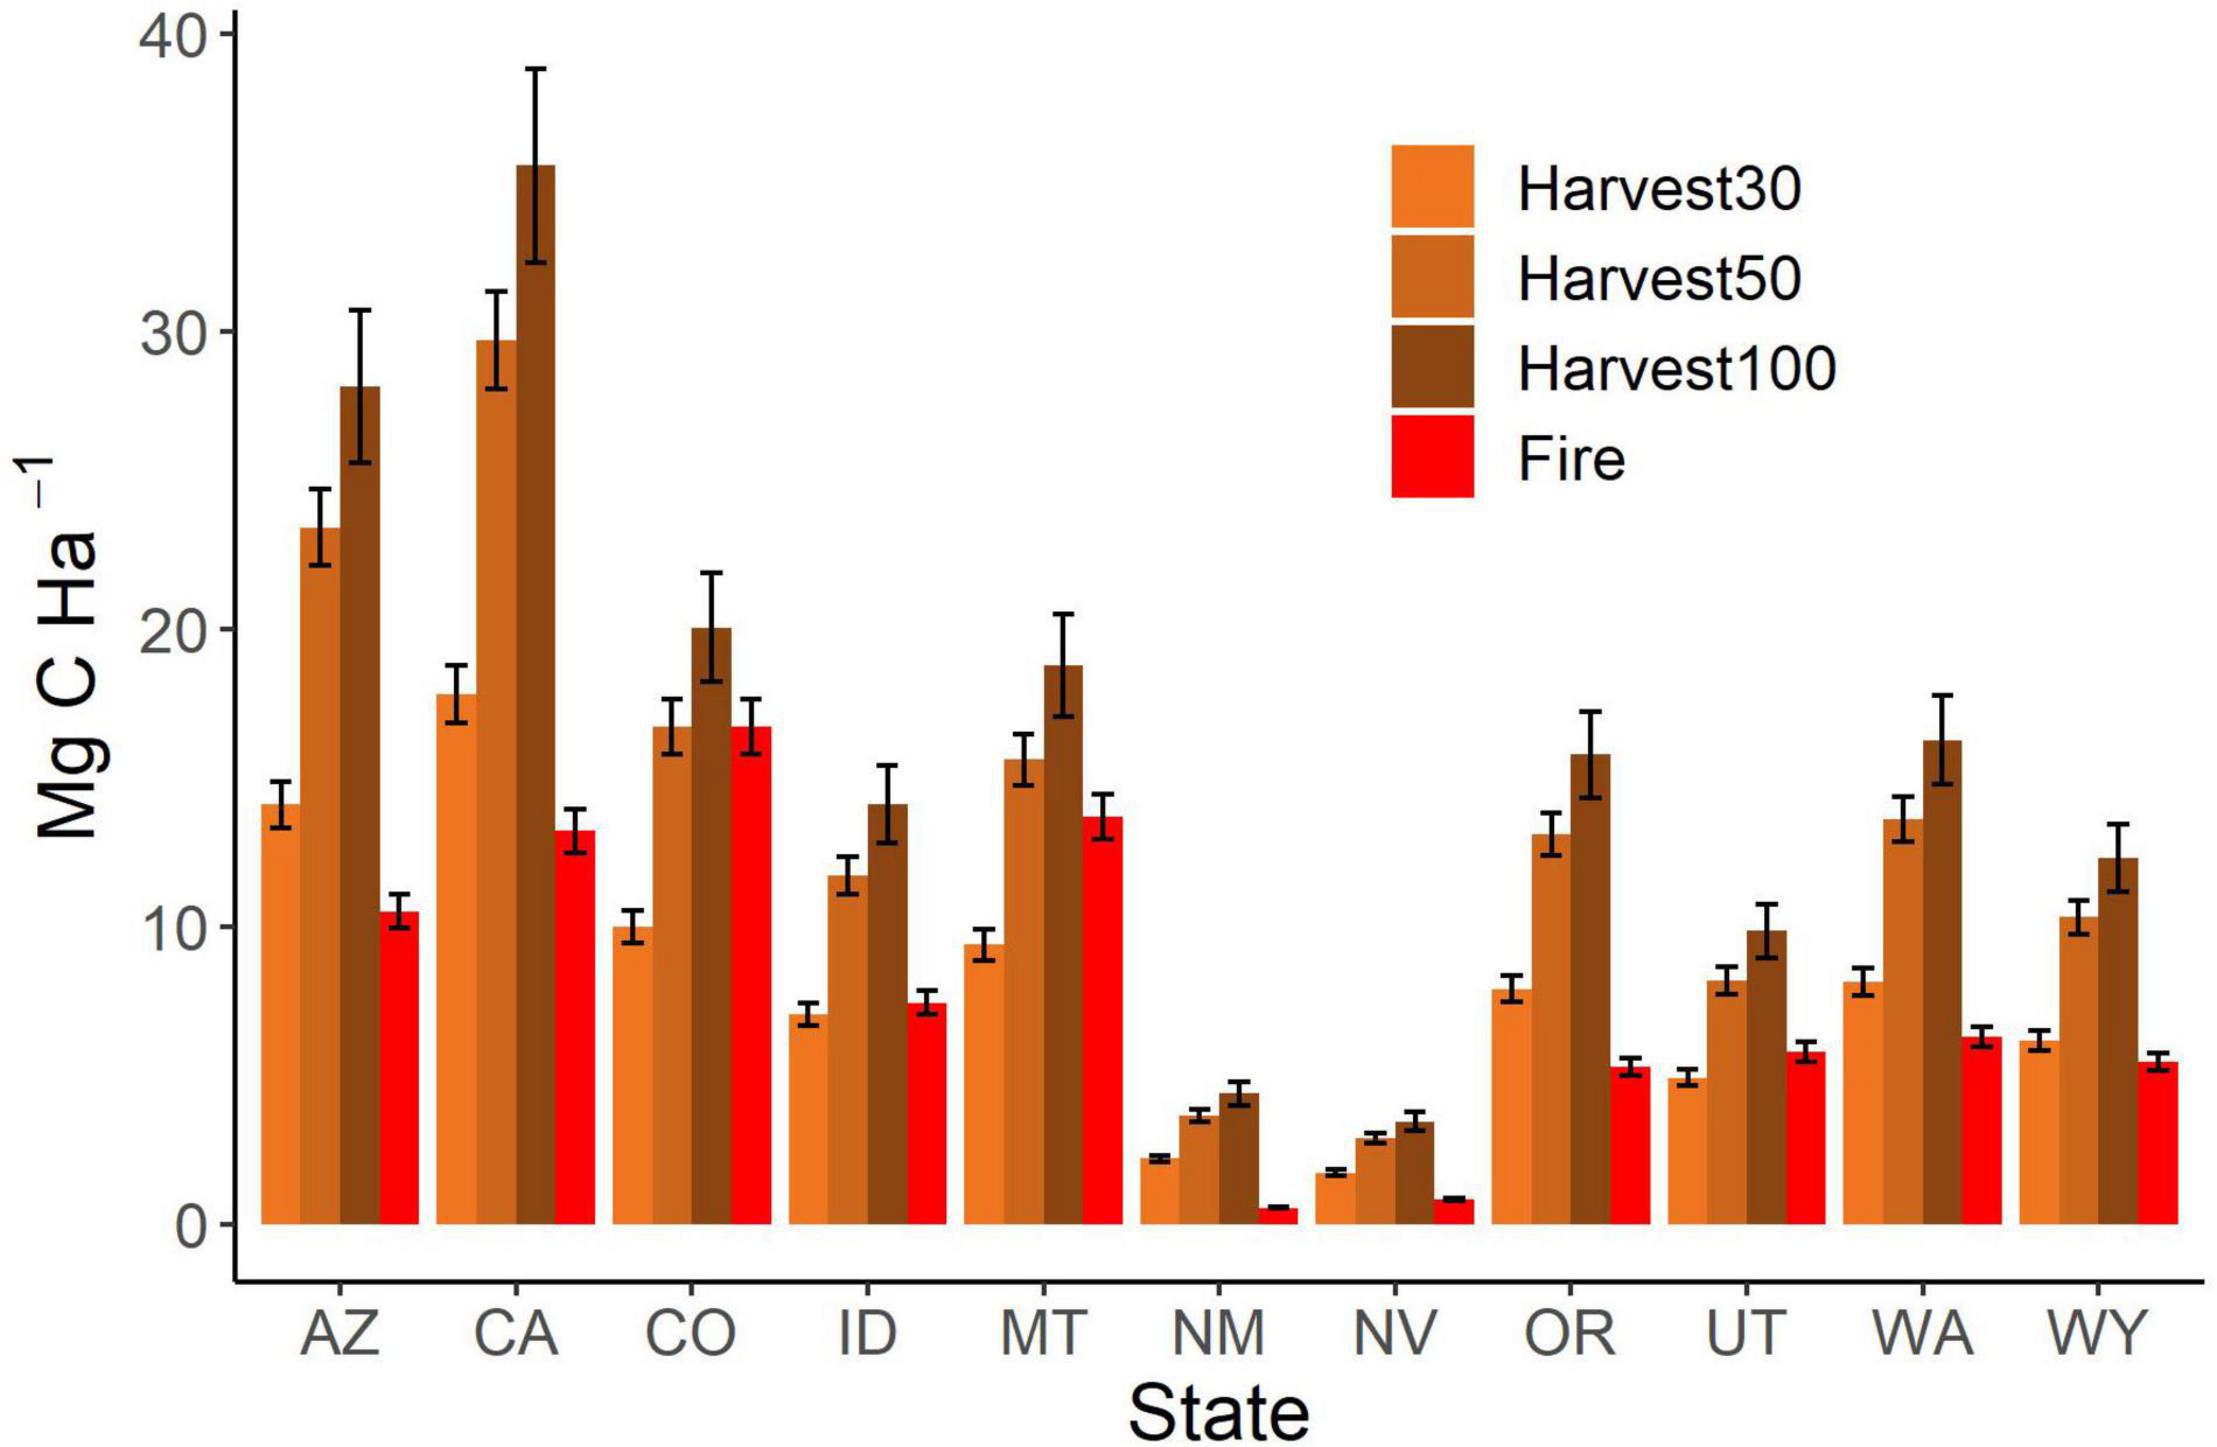
Figure 4. Comparison of per area (Mg C ha–1) hypothetical harvest scenario carbon losses to actual fire emissions. Harvest scenarios were calculated for the exact burn area in these states for 2009–2018. Harvest scenarios are based on 30, 50, and 100% aboveground tree removal rates. Here, a 30% is showing a thin-from-below, 50% harvest is akin to a commercial thin, while 100% would be representative of a clear-cut removal. Fire emissions are based on the fire perimeters of forest fires used in this study. Error bars represent standard error.
Anthropogenic Fossil Fuel Emissions
Anthropogenic fossil fuel emissions (AFFE) for each western United States and for the total western United States substantially exceed forest fire carbon emissions (mean annual and 2020), and average actual timber harvest (Figure 5 and Table 4). Mean annual AFFE in the western United States were over 15× higher than mean annual forest fire emissions and mean annual AFFE were 420% higher than forest fire emissions from the 2020 record fires across the west (Figure 5). Emissions vary widely by state, primarily due to population size (i.e., population and FFE are positively correlated) and large-scale, high-emissions industries within the state. Total western United States 2020 fire emissions were higher than the mean annual fire emissions (2009–2018), driven by large fire events in California, Oregon, and Colorado (Table 4). California, Oregon, Colorado, and New Mexico all had record-high forest fire emissions in 2020.
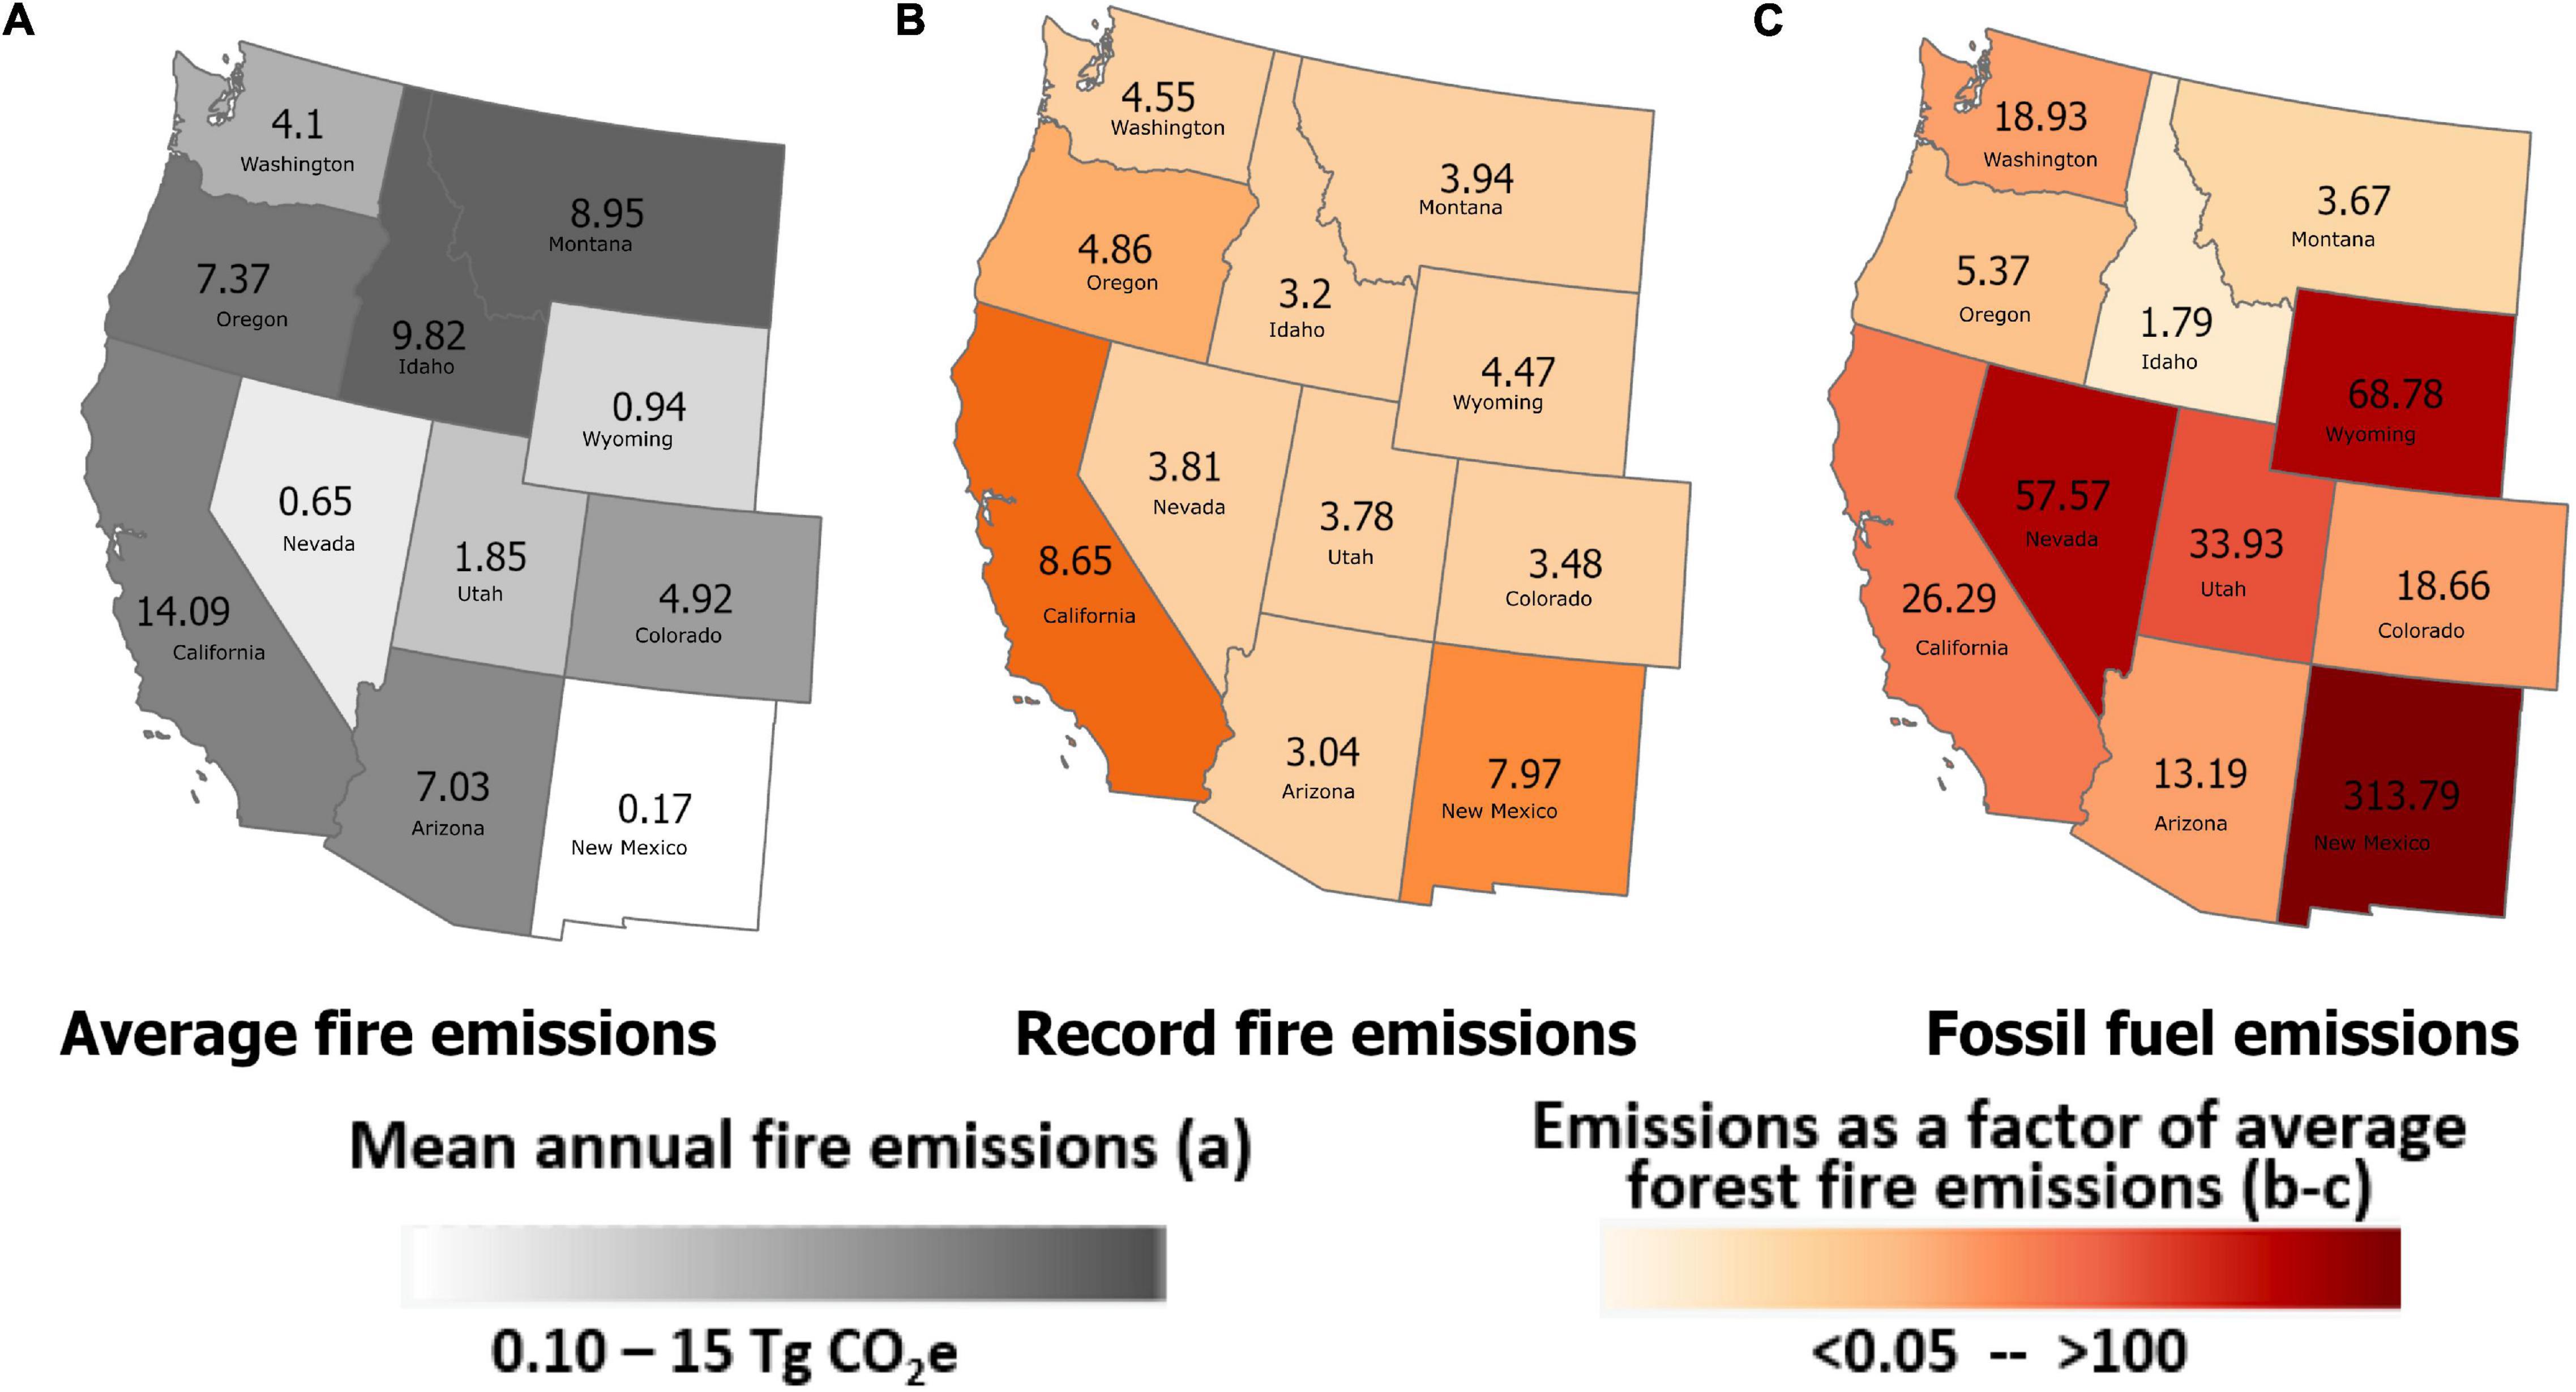
Figure 5. Fossil fuel and record-year forest fire emissions as a factor of mean annual forest fire emissions for the baseline decade 2009–2018. This comparison shows (A) mean annual fire emissions (Tg CO2e) calculated per state for a baseline 10-year (2009–2018) period, and factors from mean annual forest fire emissions (i.e., the number of times higher, or the proportion of those emissions relative to mean annual forest fire emissions) for (B) record-year forest fire year emissions (i.e., the year with the highest forest fire emissions for that state, Table 4), and (C) mean annual fossil fuel emissions.
Discussion
Forest Fire, Harvest, and Fossils Fuels: Putting Emissions in Context
Public perception and existing overestimates of forest mortality and carbon emissions from wildfire feeds into the misconception that wildfire kills all live forest cover and combusts all forest carbon (Wiedinmyer and Neff, 2007; Mater, 2017; Zinke, 2018). The reality of actual fire emissions calculated from mixed-severity combustion rather than overestimates calculated from the false high-severity narrative highlights the need to disentangle ecological impacts of wildfire from societal impacts (i.e., loss of lives and houses). This will help to ensure that risk-reduction solutions can decrease wildfire disasters while still maintaining ecosystem services, such as live tree carbon uptake and wildlife habitat (Kolden, 2020).
As wildfire policy discussions increasingly include extractive forest harvest to mitigate forest fires (Executive Order, 2018; Newhouse, 2021; Senate Bill 762, 2021), a comparison of emissions from forest fire, timber harvest, and fossil fuels provides a more complete understanding of the relative contributions of emissions sources to anthropogenic climate change. Despite increasing area burned trends across the western United States (Parks and Abatzoglou, 2020), FFE still greatly outpace forest fire emissions in the last decade, including 2020. FFE are also significantly higher than intensive and large-scale land management operations like timber harvest in many United States (i.e., California).
Policy Implications and Ways Forward
Much of United States fire management and policy has been shaped by specific, previously unprecedented wildfire events. The Big Burn of 1910 was the first massive fire event for the fledgling United States Forest Service (Koch, 1942), and is still the largest wildfire complex that has occurred in the contiguous United States. Fire suppression as the main form of fire control persisted until the late 20th century, when ecological restoration efforts began seeking to reduce hazardous fuels and increase ecologically beneficial fire effects (Parsons et al., 1986). However, these efforts have not yet altered the fire suppression culture instilled by 1910 (Stephens and Ruth, 2005; Kolden, 2019; McWethy et al., 2019).
Like past extreme fire events, the 2020 and 2021 fire seasons have accelerated fire policy and forest management discussions at all levels of government – federal, state, and local – including recent bills introduced in the United States Senate (S.4625, S.4331). Many new policy discussions on fire and forest management are being based upon the misconception that harvest will protect forests from mortality and carbon loss (Executive Order, 2018; Zinke, 2018; Infrastructure Investment and Jobs Act, 2021; Newhouse, 2021), and decrease fire risk (Forest Climate Action Team, 2018; Figure 1) despite substantial uncertainty over long-term impacts to forest climate resilience (i.e., forest treatments may decrease forest resilience in the era of climate change). Our results and the majority of full-carbon accounting studies conclude that any type of harvest (logging or commercial thinning) decreases forest carbon storage (Law et al., 2013), and this research shows harvest emits more carbon per unit area than fire at all scales (Figure 5).
To mitigate climate change, it is key we understand exactly where emissions are originating. While increased intensity and size of fires are increasing overall fire emissions, these emissions are still substantially less than FFE. This is true even in record forest fire years (Figure 5). While the 2020 fire season was unprecedented in many ways (record forest area burned in California, Oregon, and Colorado; societal devastation including fatalities, thousands of homes consumed, dramatic evacuations, and regional hazardous air quality events), ecologically, most of the forested area burned in extreme fires was in a low-to-moderate severity class (>90%, Supplementary Figure 1). Moreover, while there is assumed high tree mortality in these forest fire perimeters, many of these burns were mixed-severity fires (Supplementary Figure 1 and Figure 3) meaning many live trees will persist across most of the low-to-moderate severity burned areas. Locations with high-harvest rates and carbon-dense forests, such as the Pacific Northwest United States, see higher carbon losses from harvest than fire compared to areas in the Southwest United States with low harvest rates and carbon-sparse forests (e.g., Oregon versus Arizona). Forest management needs to be specific to forest type and region; old-growth and wet forests in the Northwest are best left preserved while dry, fire-prone forests or areas in the Wildland Urban Interface benefit from fire risk-reduction strategies like small-diameter thinning and prescribed fires (Law et al., 2018; Case et al., 2021). Inclusion of specific diameter limits in policy for public lands could help prevent large-diameter tree removal and subsequent unintended consequences.
Forest management strategies that are site-specific and balance the immediate protection of life and property with long-term preservation of existing and potential carbon stocks in forests are critical to mitigating the negative impacts of climate change. The most effective forest management strategy to protect forest carbon stocks on public lands is to preserve forests through decreased harvest and thinning, lengthened harvest rotations, increased proportion of long-term wood products, reduced harvest and mill waste, and working toward afforestation and reforestation (Hudiburg et al., 2013; Law et al., 2018; Buotte et al., 2020; Figure 1). Prescribed burns reduce fire risk while minimizing carbon losses and amplify tree growth and carbon sequestration in large-diameter trees in fire-adapted forests (Hurteau and North, 2009). In western United States forests, 33 to 46% of aboveground live biomass is stored in the large diameter trees (>60 cm; Lutz et al., 2018; Mildrexler et al., 2020). Carbon-smart treatments on public lands need to be specific about diameter limits to avoid large-diameter tree removal.
Here, we have shown that FFE for the western United States are 7 times greater than emissions associated with timber harvest and fire (Figure 5 and Table 4). As more forest-fire policy and management plans are expanded, written, and discussed following extreme fires of the recent decades, and especially the extreme forest fires of 2020 (DNR, 2020), it is crucial that these policy changes focus on the largest driving factor of these fires – anthropogenic climate change. In practice, large-scale extractive forest management efforts will hamper climate mitigation and may be futile for decreasing fire risk. To be most effective, policy will need to focus on fire-wise adaptations for homes and property and disentangle ecologically-good fire from destructive fires (Kolden, 2020). Protecting forests with ecologically sound principles, rather than increasing extractive management, may be the best scenario for the mitigation of climate change (Law et al., 2018), and protecting humans, biodiversity, and forests (Walsh et al., 2019; Buotte et al., 2020; Law et al., 2021). The continued escalation of fires throughout the 21st century is evidence of climate change-mediated intensification of fire regimes in the United States (Williams et al., 2019). Fire catastrophes will continue to occur and worsen if we do not focus on decreasing FFE, the primary driver of climate change (IPCC, 2018).
Data Availability Statement
The data that support the findings of this study are openly available from the University of Idaho at http://doi.org/10.7923/VVZE-7642 (Bartowitz et al., 2022).
Author Contributions
KB and TH: conceptualization, formal analysis, investigation, and writing—original draft preparation. KB, JS, EW, CK, and TH: methodology and writing—review and editing. All authors contributed to the article and approved the submitted version.
Funding
KB was supported by National Science Foundation award number DEB-1655183 and the National Institute of Food and Agriculture award number 2020-10162. EW was supported by the Bureau of Indian Affairs under award number A19AC00014 and the National Institute of Food and Agriculture under award number 2021-67020-33419. JS was supported by National Science Foundation award numbers DEB-155304 and DEB-2052571. CK was supported by the National Science Foundation under award number DMS-1520873. TH was supported by National Science Foundation award numbers DEB-1655183, DEB-155304 and DEB-2052571.
Conflict of Interest
The authors declare that the research was conducted in the absence of any commercial or financial relationships that could be construed as a potential conflict of interest.
Publisher’s Note
All claims expressed in this article are solely those of the authors and do not necessarily represent those of their affiliated organizations, or those of the publisher, the editors and the reviewers. Any product that may be evaluated in this article, or claim that may be made by its manufacturer, is not guaranteed or endorsed by the publisher.
Acknowledgments
We thank two reviewers for helpful comments that improved and clarified the manuscript.
Supplementary Material
The Supplementary Material for this article can be found online at: https://www.frontiersin.org/articles/10.3389/ffgc.2022.867112/full#supplementary-material
References
Abatzoglou, J. T., and Williams, A. P. (2016). Impact of anthropogenic climate change on wildfire across western US forests. Proc. Natl. Acad. Sci. 2016:113. doi: 10.1073/pnas.1607171113
Bartowitz, K., Walsh, E., Stenzel, J., Kolden, C., and Hudiburg, T. (2022). Data From: Forest Carbon Emission Sources are Not Equal: Putting Fire, Harvest, and Fossil Fuel Emissions in Context [Data set]. Moscow, ID: University of Idaho. doi: 10.7923/VVZE-7642
Bartowitz, K. J., Higuera, P. E., Shuman, B. N., McLauchlan, K. K., and Hudiburg, T. W. (2019). Post-fire carbon dynamics in subalpine forests of the rocky mountains. Fire 2:58. doi: 10.3390/fire2040058
Berner, L. T., Law, B. E., Meddens, A. J. H., and Hicke, J. A. (2017). Tree mortality from fires, bark beetles, and timber harvest during a hot and dry decade in the western United States (2003 – 2012). Environ. Res. Lett. 12:65005.
Bowman, D., Kolden, C. A., Abatzoglou, J. T., Johnston, F. H., van der Werf, G. R., and Flannigan, M. (2020). Vegetation fires in the Anthropocene. Nat. Rev. Earth Environ. 1, 500–515. doi: 10.1038/s43017-020-0085-3
Buotte, P. C., Law, B. E., Ripple, W. J., and Berner, L. T. (2020). Carbon sequestration and biodiversity co-benefits of preserving forests in the western United States. Ecol. Appl. 30, 1–11. doi: 10.1002/eap.2039
Buotte, P. C., Levis, S., Law, B. E., Hudiburg, T. W., Rupp, D. E., and Kent, J. J. (2019). Near-future forest vulnerability to drought and fire varies across the western United States. Glob. Chang. Biol. 25, 290–303. doi: 10.1111/gcb.14490
Campbell, J. L., Harmon, M. E., and Mitchell, S. R. (2012). Can fuel-reduction treatments really increase forest carbon storage in the western US by reducing future fire emissions? In a nutshell. Front. Ecol. Environ. 10, 83–90. doi: 10.1890/110057
Case, M. J., Johnson, B. G., Bartowitz, K. J., and Hudiburg, T. W. (2021). Forest Ecology and Management Forests of the future: climate change impacts and implications for carbon storage in the Pacific Northwest. USA. Ecol. Manage. 482:118886. doi: 10.1016/j.foreco.2020.118886
DNR (2020). 2020 Washington Forest Action PLan. Olympia, WA: Washington State Department of Natural Resources.
Eidenshink, J., Schwind, B., Brewer, K., Zhu, Z.-L., Quayle, B., and Howard, S. (2007). A project for monitoring trends in burn severity. Fire Ecol. 3, 3–21. doi: 10.4996/fireecology.0301003
Fargione, J. E., Bassett, S., Boucher, T., Bridgham, S. D., Conant, R. T., Cook-Patton, S. C., et al. (2018). Natural climate solutions for the United States. Sci. Adv. 4, 1–15. doi: 10.1126/sciadv.aat1869
Forest Climate Action Team (2018). California Forest Carbon Plan: Managing Our Forest Landscapes in a Changing Climate. Sacramento, CA: Forest Climate Action Team. 1–178.
Gibson, C. E. (2005). Fire History Polygons for Northern Rockies - 1889 - 2003. Washington, DC: USDA.
Heath, L. S., Maltby, V., Miner, R., Skog, K. E., Smith, J. E., Unwin, J., et al. (2010). Greenhouse gas and carbon profile of the U.S. forest products industry value chain. Environ. Sci. Technol. 44, 3999–4005. doi: 10.1021/es902723x
Higuera, P. E., and Abatzoglou, J. T. (2020). Record-setting climate enabled the extraordinary 2020 fire season in the western United States. Glob. Chang. Biol. 2020, 1–2. doi: 10.1111/gcb.15388
Hudiburg, T. W., Law, B. E., Moomaw, W. R., Harmon, M. E., and Stenzel, J. E. (2019). Meeting GHG reduction targets requires accounting for all forest sector emissions. Environ. Res. Lett. 14:95005. doi: 10.1088/1748-9326/ab28bb
Hudiburg, T. W., Luyssaert, S., Thornton, P. E., and Law, B. E. (2013). Interactive effects of environmental change and management strategies on regional forest carbon emissions. Environ. Sci. Technol. 47, 13132–13140. doi: 10.1021/es402903u
Hurteau, M., and North, M. (2009). Fuel treatment effects on tree-based forest carbon storage and emissions under modeled wildfire scenarios. Front. Ecol. Environ. 7:409–414. doi: 10.1890/080049
Infrastructure Investment and Jobs Act (2021). H.R.3684 - Infrastructure Investment and Jobs Act. Washington, DC: United States House of Representatives.
IPCC (2018). “Summary for Policymakers,” in Global warming of 1.5°C, eds H. O. P. P. Zhai, D. Roberts, J. Skea, P. R. Shukla, A. Pirani, and W. Moufouma-Okia (Waterfield Geneva: World Meteorological Organization).
Keegan, C. E., Morgan, T. A., Blatner, K. A., and Daniels, J. M. (2010). Trends in lumber processing in the western United States. Part II: Overrun and lumber recovery factors. For. Prod. J. 60, 140–143. doi: 10.13073/0015-7473-60.2.140
Knorr, W., Jiang, L., and Arneth, A. (2016). Climate, CO 2 and human population impacts on global wildfire emissions. Biogeosciences 13, 267–282. doi: 10.5194/bg-13-267-2016
Koch, E. (1942). History of the 1910 forest fires in Idaho and western Montana. Moscow: University of Idaho Library.
Kolden, C. (2020). Wildfires: count lives and homes, not hectares burnt. Nature 586:2740. doi: 10.1038/d41586-020-02740-4
Kolden, C. A. (2019). We’re not doing enough prescribed fire in the western united states to mitigate wildfire risk. Fire 2, 1–10. doi: 10.3390/fire2020030
Law, B. E., Berner, L. T., Buotte, P. C., Mildrexler, D. J., and Ripple, W. J. (2021). Strategic Forest Reserves can protect biodiversity in the western United States and mitigate climate change. Commun. Earth Environ. 2, 1–13. doi: 10.1038/s43247-021-00326-0
Law, B. E., Hudiburg, T. W., and Luyssaert, S. (2013). Thinning effects on forest productivity: consequences of preserving old forests and mitigating impacts of fire and drought. Plant Ecol. Divers. 6, 73–85. doi: 10.1080/17550874.2012.679013
Law, B. E., Hudiburg, T. W., Berner, L. T., Kent, J. J., Buotte, P. C., and Harmon, M. E. (2018). Land use strategies to mitigate climate change in carbon dense temperate forests. Proc. Natl. Acad. Sci. 2018:64115. doi: 10.1073/pnas.1720064115
Lawler, J. J., Lewis, D. J., Nelson, E., Plantinga, A. J., Polasky, S., Withey, J. C., et al. (2014). Projected land-use change impacts on ecosystem services in the United States. Proc. Natl. Acad. Sci. USA 111, 7492–7497. doi: 10.1073/pnas.1405557111
Lutz, J. A., Furniss, T. J., Johnson, D. J., Davies, S. J., Allen, D., Alonso, A., et al. (2018). Global importance of large-diameter trees. Glob. Ecol. Biogeogr. 27, 849–864. doi: 10.1111/geb.12747
Mater, C. (2017). The surprising emissions from Oregon’s forests (Guest opinion), Opinion. Portland: The Oregonian.
McWethy, D. B., Schoennagel, T., Higuera, P. E., Krawchuk, M., Harvey, B. J., Metcalf, E. C., et al. (2019). Rethinking resilience to wildfire. Nat. Sustain 2019:3538. doi: 10.1038/s41893-019-0353-8
Mildrexler, D. J., Berner, L. T., Law, B. E., Birdsey, R. A., and Moomaw, W. R. (2020). Large trees dominate carbon storage in forests east of the cascade crest in the united states pacific northwest. Front. For. Glob. Chang. 3:1–15. doi: 10.3389/ffgc.2020.594274
Parks, S. A., and Abatzoglou, J. T. (2020). Warmer and drier fire seasons contribute to increases in area burned at high severity in western US forests from 1985-2017. Geophys. Res. Lett. 2020, 1–10. doi: 10.1029/2020gl089858
Parsons, A. (2003). Soil burn severity definitions and mapping guidelines burned area emergency rehabilitation baer. USDA For. Serv. Rocky Mt. Res. Stn. 6, 1–12.
Parsons, D. J., Graber, D. M., Agee, J. K., and Vanagtendonk, J. W. (1986). Natural fire management in National Parks. Environ. Manage 10, 21–24. doi: 10.1007/bf01866414
Ruefenacht, B., Finco, M. V., Nelson, M. D., Czaplewski, R., Helmer, E. H., Blackard, J. A., et al. (2008). Conterminous U.S. and alaska forest type mapping using forest inventory and analysis data. Photogram. Eng. Rem. Sens. 74, 1379–1388. doi: 10.14358/pers.74.11.1379
Sohn, J. A., Saha, S., and Bauhus, J. (2016). Potential of forest thinning to mitigate drought stress: A meta-analysis. For. Ecol. Manage. 380, 261–273. doi: 10.1016/j.foreco.2016.07.046
Stenzel, J. E., Bartowitz, K. J., Hartman, M. D., Lutz, J. A., Kolden, C. A., Smith, A. M. S., et al. (2019). Fixing a snag in carbon emissions estimates from wildfires. Glob. Chang. Biol. 25:716. doi: 10.1111/gcb.14716
Stenzel, J. E., Berardi, D. B., Walsh, E. S., and Hudiburg, T. W. (2021). Restoration thinning in a drought-prone Idaho forest creates a persistent carbon deficit. J. Geophys. Res. Biogeosci. 2021:5815. doi: 10.1029/2020jg005815
Stephens, S. L., and Ruth, L. W. (2005). Federal Forest-Fire Policy in the United States. Ecol. Appl. 15, 532–542. doi: 10.1890/04-0545
Stephens, S. L., Westerling, A. L. R., Hurteau, M. D., Peery, M. Z., Schultz, C. A., and Thompson, S. (2020). Fire and climate change: conserving seasonally dry forests is still possible. Front. Ecol. Environ. 18:354–360. doi: 10.1002/fee.2218
Turner, D. P., Göckede, M., Law, B. E., Ritts, W. D., Cohen, W. B., Yang, Z., et al. (2011). Multiple constraint analysis of regional land-surface carbon flux. Tellus, Ser. B Chem. Phys. Meteorol. 63, 207–221. doi: 10.1111/j.1600-0889.2011.00525.x
Walsh, E. S., Vierling, K. T., Strand, E., Bartowitz, K., and Hudiburg, T. W. (2019). Climate change, woodpeckers, and forests: current trends and future modeling needs. Ecol. Evol. 9, 4875. doi: 10.1002/ece3.4876
Westerling, A. L., Hidalgo, H. G., Cayan, D. R., and Swetnam, T. W. (2006). Warming and earlier spring increase western US forest wildfire activity. Science 313, 940–943. doi: 10.1126/science.1128834
Wiedinmyer, C., and Hurteau, M. D. (2010). Prescribed fire as a means of reducing forest carbon emissions in the western United States. Environ. Sci. Technol. 44, 1926–1932. doi: 10.1021/es902455e
Wiedinmyer, C., and Neff, J. C. (2007). Estimates of CO2 from fires in the United States: implications for carbon management. Carbon Balance Manag. 2:10. doi: 10.1186/1750-0680-2-10
Williams, A. P., Abatzoglou, J. T., Gershunov, A., Guzman-Morales, J., Bishop, D. A., Balch, J. K., et al. (2019). Observed impacts of anthropogenic climate change on wildfire in california. Earth Futur. 7, 892–910. doi: 10.1029/2019EF001210
Zald, H. S. J., and Dunn, C. J. (2018). Severe fire weather and intensive forest management increase fire severity in a multi-ownership landscape. Ecol. Appl. 28, 1068–1080. doi: 10.1002/eap.1710
Keywords: carbon, forests, fire, climate change mitigation, GHG emissions
Citation: Bartowitz KJ, Walsh ES, Stenzel JE, Kolden CA and Hudiburg TW (2022) Forest Carbon Emission Sources Are Not Equal: Putting Fire, Harvest, and Fossil Fuel Emissions in Context. Front. For. Glob. Change 5:867112. doi: 10.3389/ffgc.2022.867112
Received: 31 January 2022; Accepted: 04 April 2022;
Published: 09 May 2022.
Edited by:
Eduardo Maeda, University of Helsinki, FinlandReviewed by:
Francis Edward Putz, University of Florida, United StatesLori D. Daniels, University of British Columbia, Canada
Copyright © 2022 Bartowitz, Walsh, Stenzel, Kolden and Hudiburg. This is an open-access article distributed under the terms of the Creative Commons Attribution License (CC BY). The use, distribution or reproduction in other forums is permitted, provided the original author(s) and the copyright owner(s) are credited and that the original publication in this journal is cited, in accordance with accepted academic practice. No use, distribution or reproduction is permitted which does not comply with these terms.
*Correspondence: Kristina J. Bartowitz, a2JhcnRvd2l0ekB1aWRhaG8uZWR1