 Damon B. Lesmeister
 Julianna M. A. Jenkins
- Pacific Northwest Research Station, USDA Forest Service, Corvallis, OR, United States
Wildlife monitoring programs designed to inform forest management and conservation decisions in the face of climate change benefit from long-term datasets with consistent methodology. Nevertheless, many monitoring programs may seek to transition to alternative methods because emerging technologies can improve trend tracking and expand the number of target populations, increase spatial scale, and reduce long-term costs. Integrated models strengthen the capacity to adapt long-term monitoring programs to next generation methods. Here we present a case study of northern spotted owl (Strix occidentalis caurina) population monitoring that is under transition. The first monitoring phase focused on territory occupancy and mark-resighting individual owls. Owing to rapidly declining populations and increasing costs, traditional methods are less viable for long-term monitoring. A non-invasive approach, passive acoustic monitoring, is effective for detecting spotted owl presence, estimating occupancy rates, distinguishing sex, detecting trends in populations, and monitoring many additional species. A key component to support transition to passive acoustic monitoring was the development of machine learning models to automate species detections that enable rapid and effective data processing and analysis workflows. Coupling passive acoustic monitoring networks with Forest Inventory and Analysis (FIA) and gradient nearest neighbor (GNN) datasets provide powerful tools for predicting forest change impacts on wildlife populations and identify winners and losers in dynamic landscapes. The second monitoring phase will leverage new technologies, expand the scope of inference, link forest inventory and remote sensing datasets, and transition the program to broad biodiversity monitoring that assists managers as they face myriad challenges in dynamic landscapes.
Introduction
To adapt and mitigate negative effects of climate change, modern adaptive forest management is increasingly reliant on forest monitoring tools that generate larger data than traditional methods (Torresan et al., 2021). Monitoring biological diversity in forest ecosystems is important to assess long-term population trends, disturbance effects, identity trigger points for conservation action, and evaluate effectiveness of management actions. The most impactful monitoring programs are long-term, geographically broad, and adaptable to changing conditions (Busch and Trexler, 2003; Lindenmayer and Likens, 2009; Tinkham et al., 2018). Hence, rigorous wildlife monitoring programs are increasingly expanding in scope and scale (e.g., Lesmeister and Nielsen, 2011; Steenweg et al., 2017; Cove et al., 2021). Large wildlife monitoring databases offer opportunities for biodiversity monitoring and ecological modeling over large spatial and temporal scales (e.g., Kays et al., 2020), which can rarely be achieved by small-scale programs.
Wildlife monitoring is in the midst of a renaissance with rapid technological advances in survey methods due to widely available non-invasive electronic sensor networks such as camera traps, autonomous recording units, and satellite remote sensing (Tosa et al., 2021). These tools can facilitate large-scale multi-species wildlife monitoring. The large quantities of data generated by next generation methods present both opportunity and challenges, necessitating equally important advancements in computational methods and statistics for processing and analyzing big data (Tosa et al., 2021; Nathan et al., 2022). Next generation methods also enable the ability to utilize USDA Forest Service Forest Inventory and Analysis (FIA) data and gradient nearest neighbor (GNN) models as predictors of wildlife distribution and impacts of long-term changes in forest conditions on wildlife populations (Tinkham et al., 2018; Bell et al., 2021). FIA data can be useful for evaluating environmental conditions in wildlife habitat suitability assessments, observing ecosystem change, and drivers of species diversity (Chojnacky and Dick, 2000; Manley et al., 2006; Zielinski et al., 2006). Previous efforts relied primarily on wildlife location/survey data collected by direct human observation, live capture, or were species specific, all of which limit how large an area can be surveyed and the number of species detected. There are clear advantages to leveraging non-invasive next generation methods for rapid assessment of wildlife populations and better link with FIA data at multiple spatial and temporal scales. However, historical wildlife monitoring programs must maintain long-term data integrity and are thus challenged with transitioning without affecting the utility of historical datasets and core objectives (Lindenmayer and Likens, 2009). Here we present a case study of a large-scale, long-term, and well-known single species monitoring program that is under transition to a biodiversity monitoring program with stronger direct and indirect connections to FIA data.
Case study
Northern spotted owl monitoring under transition: Challenges and opportunities
The northern spotted owl (Strix occidentalis caurina) was listed as threatened in 1990 under the US Endangered Species Act due to steeply declining populations driven by rapid loss of old-growth forests that the species relies on for nesting, roosting, and foraging. The 1994 Northwest Forest Plan (NWFP) covers 10 million ha of federally managed forest lands and is intended to protect and restore large contiguous blocks of late-successional forest in support of northern spotted owl population recovery. The NWFP shifted federal management prioritization of timber production to ecological processes and biodiversity conservation with an old-forest reserve design (Spies et al., 2019). The NWFP has made substantial progress toward meeting goals for old forest and reduced threats to biodiversity from clear-cut logging on federal lands, but several objectives have not yet been achieved, including recovery of northern spotted owls and other avian species associated with old forest (Spies et al., 2018; Phalan et al., 2019; Davis et al., 2022). Although old forests were largely protected on federal lands, intensive forest management persisted on non-federal lands and northern spotted owl populations have continued to decline and warrant reclassification to endangered status (USFWS, 2020; Franklin et al., 2021; Davis et al., 2022). Additional threats such as increasing wildfires, an invasive competitor, and rodenticide poisoning have emerged that were beyond control of federal forest managers (Lesmeister et al., 2018; Mangan et al., 2019; Spies et al., 2019; Wiens et al., 2019; Davis et al., 2022). Furthermore, large-scale commercial thinning and post-fire logging can have adverse impacts on northern spotted owls and their prey (Clark et al., 2013; Wilson and Forsman, 2013; Comfort et al., 2016; Forsman et al., 2016; Linnell and Lesmeister, 2019; Hanson et al., 2021).
Northern spotted owl population monitoring was mandated under the NWFP to evaluate the plan’s effectiveness, and to inform management and conservation decisions (Spies et al., 2019). Two phases were envisioned in the establishment of the monitoring program (Lint et al., 1999). The first phase relied on demographic data in a mark-resight framework on historical spotted owl territories in eight study areas comprised largely of federal lands. The monitoring design was established to use broadcasted conspecific calls to elicit responses from territorial owls, then capturing, marking, and resighting those birds to estimate vital rates and population change (Franklin et al., 1996; Lint et al., 1999). Broadcasting spotted owl calls can increase detection probability because territorial owls respond to the mimicked threat during surveys (Reid et al., 1999), but there are potential drawbacks to broadcast calling in long-term monitoring of northern spotted owls. Location estimates can be biased toward surveyor because owls often move to the perceived threat (Zuberogoitia et al., 2011, 2020). Further, broadcast calling is not effective for multiple species because owls respond differently to broadcast calls of other species and spotted owls are less detectable in the presence barred owls (Strix varia) (Bailey et al., 2009; Kissling et al., 2010; Dugger et al., 2011; Wiens et al., 2011).
Detection/non-detection survey data from territories in the eight historical study areas have been used to identify drivers of spotted owl occupancy dynamics, competitive impacts of barred owls, and predict effects of potential management actions (Yackulic et al., 2019; Franklin et al., 2021). Historical territories were defined as the landscape area used by territorial owls and delineated to define occupancy survey sites and spatial units for habitat covariates (Dugger et al., 2016). Thiessen polygons for each territory were created based on cumulated annual activity center locations and extended outward to a maximum of half of the median nearest-neighbor distance or midway between the annual territory center locations of owls occupying adjacent territories (Dugger et al., 2016). Each territory was unique in size and shape and were larger in northern regions of the range where spotted owls have larger home ranges. GNN models are mapped predictions of forest structure and composition across broad landscapes based on FIA plot data and Landsat imagery (Bell et al., 2021). The spotted owl monitoring program has a long history of using GNN data as territory-scale habitat covariates for modeling the effects of forest disturbance, structure, and tree species composition on spotted owl dispersal, distribution, and population trends within the eight historical study areas (Jenkins et al., 2019a,2021; Franklin et al., 2021; Davis et al., 2022; Rockweit et al., 2022). By integrating next generation survey methods throughout the entire spotted owl range, the monitoring program could further leverage the potential of range-wide FIA-derived models as spatially explicit predictors of spotted owl distribution and population change.
The spotted owl monitoring plan called for a transition to a second phase based on habitat monitoring if population change was found to follow trends in forests suitable for nesting and roosting (Lint et al., 1999). This was a reasonable possibility at the time of monitoring program development because northern spotted owls have consistently been found to be an obligate of older forests with large trees (Forsman et al., 1984; Wilk et al., 2018; Jenkins et al., 2019b; Sovern et al., 2019). However, competition with, and displacement by, invasive barred owls have disrupted spotted owl population and territorial dynamics including the strength of the relationship between old forest and demographic performance (Dugger et al., 2005; Jenkins et al., 2019a,2021; Yackulic et al., 2019). The habitat quality of old forest for northern spotted owls is degraded if barred owls are present (Lesmeister et al., 2018). Therefore, the second phase of monitoring requires, in addition to leveraging FIA data for habitat monitoring (e.g., Bell et al., 2021; Davis et al., 2022), an analytical framework including range-wide northern spotted owl and barred owl surveys to assess drivers of occupancy dynamics. Similar to annual maps of spotted owl habitat (Davis et al., 2022), range-wide occupancy models (with FIA-derived covariates) for spotted owls and barred owls (also co-occurrence models) could be updated annually with established workflows for rapid survey results.
The need for long-term monitoring of spotted owl populations coupled with FIA data to track forest conditions is further underscored by the possibility that harvesting old forest with large trees can have detrimental impacts on spotted owls that linger for decades (Jones et al., 2017). Large wildfires also potentially pose a significant risk to northern spotted owl populations (Comfort et al., 2016; Rockweit et al., 2017; Lesmeister et al., 2018; Jones et al., 2020) and have differential impact on other owl species (Duchac et al., 2021). Although northern spotted owl nesting forests tend to burn at lower severity compared to other surrounding forest types, habitat suitability is highly degraded after moderate and high severity fires (Lesmeister et al., 2019, 2021b). Further, wildfires are expected to increase in extent, frequency, and severity with climate change (Abatzoglou and Williams, 2016; Davis et al., 2017; Wan et al., 2019). Empirical data on the effects of wildfire on northern spotted owl populations and habitat is limited because only a few studies had long-term spotted owl data pre-fire (e.g., Clark et al., 2013; Rockweit et al., 2017; Lesmeister et al., 2019). Broadscale and long-term population monitoring throughout the geographic range rather than at select study areas, is more likely to provide pre-disturbance data on spotted owls within areas that will experience a wide range of future disturbances, including high-severity wildfire.
Passive acoustic monitoring is rapidly expanding in use to study and monitor forest wildlife and soundscapes (Shonfield and Bayne, 2017; Sugai et al., 2019). Compared to broadcast calling, extended-duration passive acoustic monitoring surveys decrease technician field effort while increasing, by orders of magnitude, the quantity of data collected at a survey point (Tegeler et al., 2012). Coupled with computationally intensive machine learning algorithms for automated data processing and species identification and rigorous statistical analyses, passive acoustic monitoring is a powerful tool for non-invasively monitoring wildlife populations and their environment (Ross et al., 2018; Shonfield et al., 2018; Ruff et al., 2021). Passive acoustic monitoring is effective for (1) detecting a wide range of species including spotted owls and barred owls (Duchac et al., 2020, 2021), (2) distinguishing sex of northern spotted owls (Dale et al., 2022), and (3) detecting trends in northern spotted owl populations (Lesmeister et al., 2021a). Machine learning models that automate species identification have proven effective for northern spotted owls and a wide range of other vocal wildlife species, which enables rapid and effective data processing and analysis workflows for biodiversity monitoring in the Pacific Northwest (Ruff et al., 2020, 2021). Additionally, spotted owl population trends can effectively be inferred from analyses in a dynamic multistate framework to estimate change in use and patterns of co-occurrence with barred owls (Bailey et al., 2014; Fidino et al., 2018; Lesmeister et al., 2021a). Based on the multiple lines of evidence that demonstrated the advantages and effectiveness of passive acoustic monitoring, the NWFP Regional Interagency Executive Committee made the decision in 2020 to transition northern spotted owl monitoring from phase one to phase two and directed that phase two to be fully implemented by 2023.
The monitoring program will be based on habitat monitoring (e.g., Davis et al., 2022) coupled with passive acoustic monitoring of randomly selected 5 km2 hexagons on federally managed forest lands throughout the approximate 10 million ha geographic range of northern spotted owls (Figure 1). The FIA grid design also consists of a systematic hexagonal grid, but the hexagon size (24.03 km2) was much larger than the average northern spotted owl territory core area and barred owl home range size which are both approximately 5 km2 (Glenn et al., 2004; Hamer et al., 2007; Singleton et al., 2010; Schilling et al., 2013; Wiens et al., 2014). Therefore, an independent sampling framework was developed with hexagon size that reflected ecologically relevant space use by both northern spotted owls and barred owls during the breeding season. The standardized hexagon survey sampling protocol maximizes detection probabilities of northern spotted owls and enables broad inference within the selected federal sample (base design) while retaining the flexibility to facilitate local and site-specific questions (Lesmeister et al., 2022). Each hexagon is sampled with an array of four autonomous recording units, established following a standardized rule set (Lesmeister et al., 2022). The base design is the 2 + 20% sampling scheme (Figure 1) that was one of several options tested by Lesmeister et al. (2021a) and found to be the most effective option for balancing cost with capability to detect change in northern spotted owl populations range-wide and at ecological province scales. The grid of 5 km2 hexagons covers the entire Pacific Northwest and is publicly available (USFWS, 2021), so other investigators can use the established protocols to survey hexagons beyond the base design to address project- or research-specific questions with confidence of high detection probabilities. Replicated designs could also be implemented outside the range of northern spotted owls and across different ecotypes to further expand these sensor networks. Under this framework, data could be pooled from different projects across the multiple regions for meta-analyses to better understand large-scale environmental processes and biodiversity response to climate change.
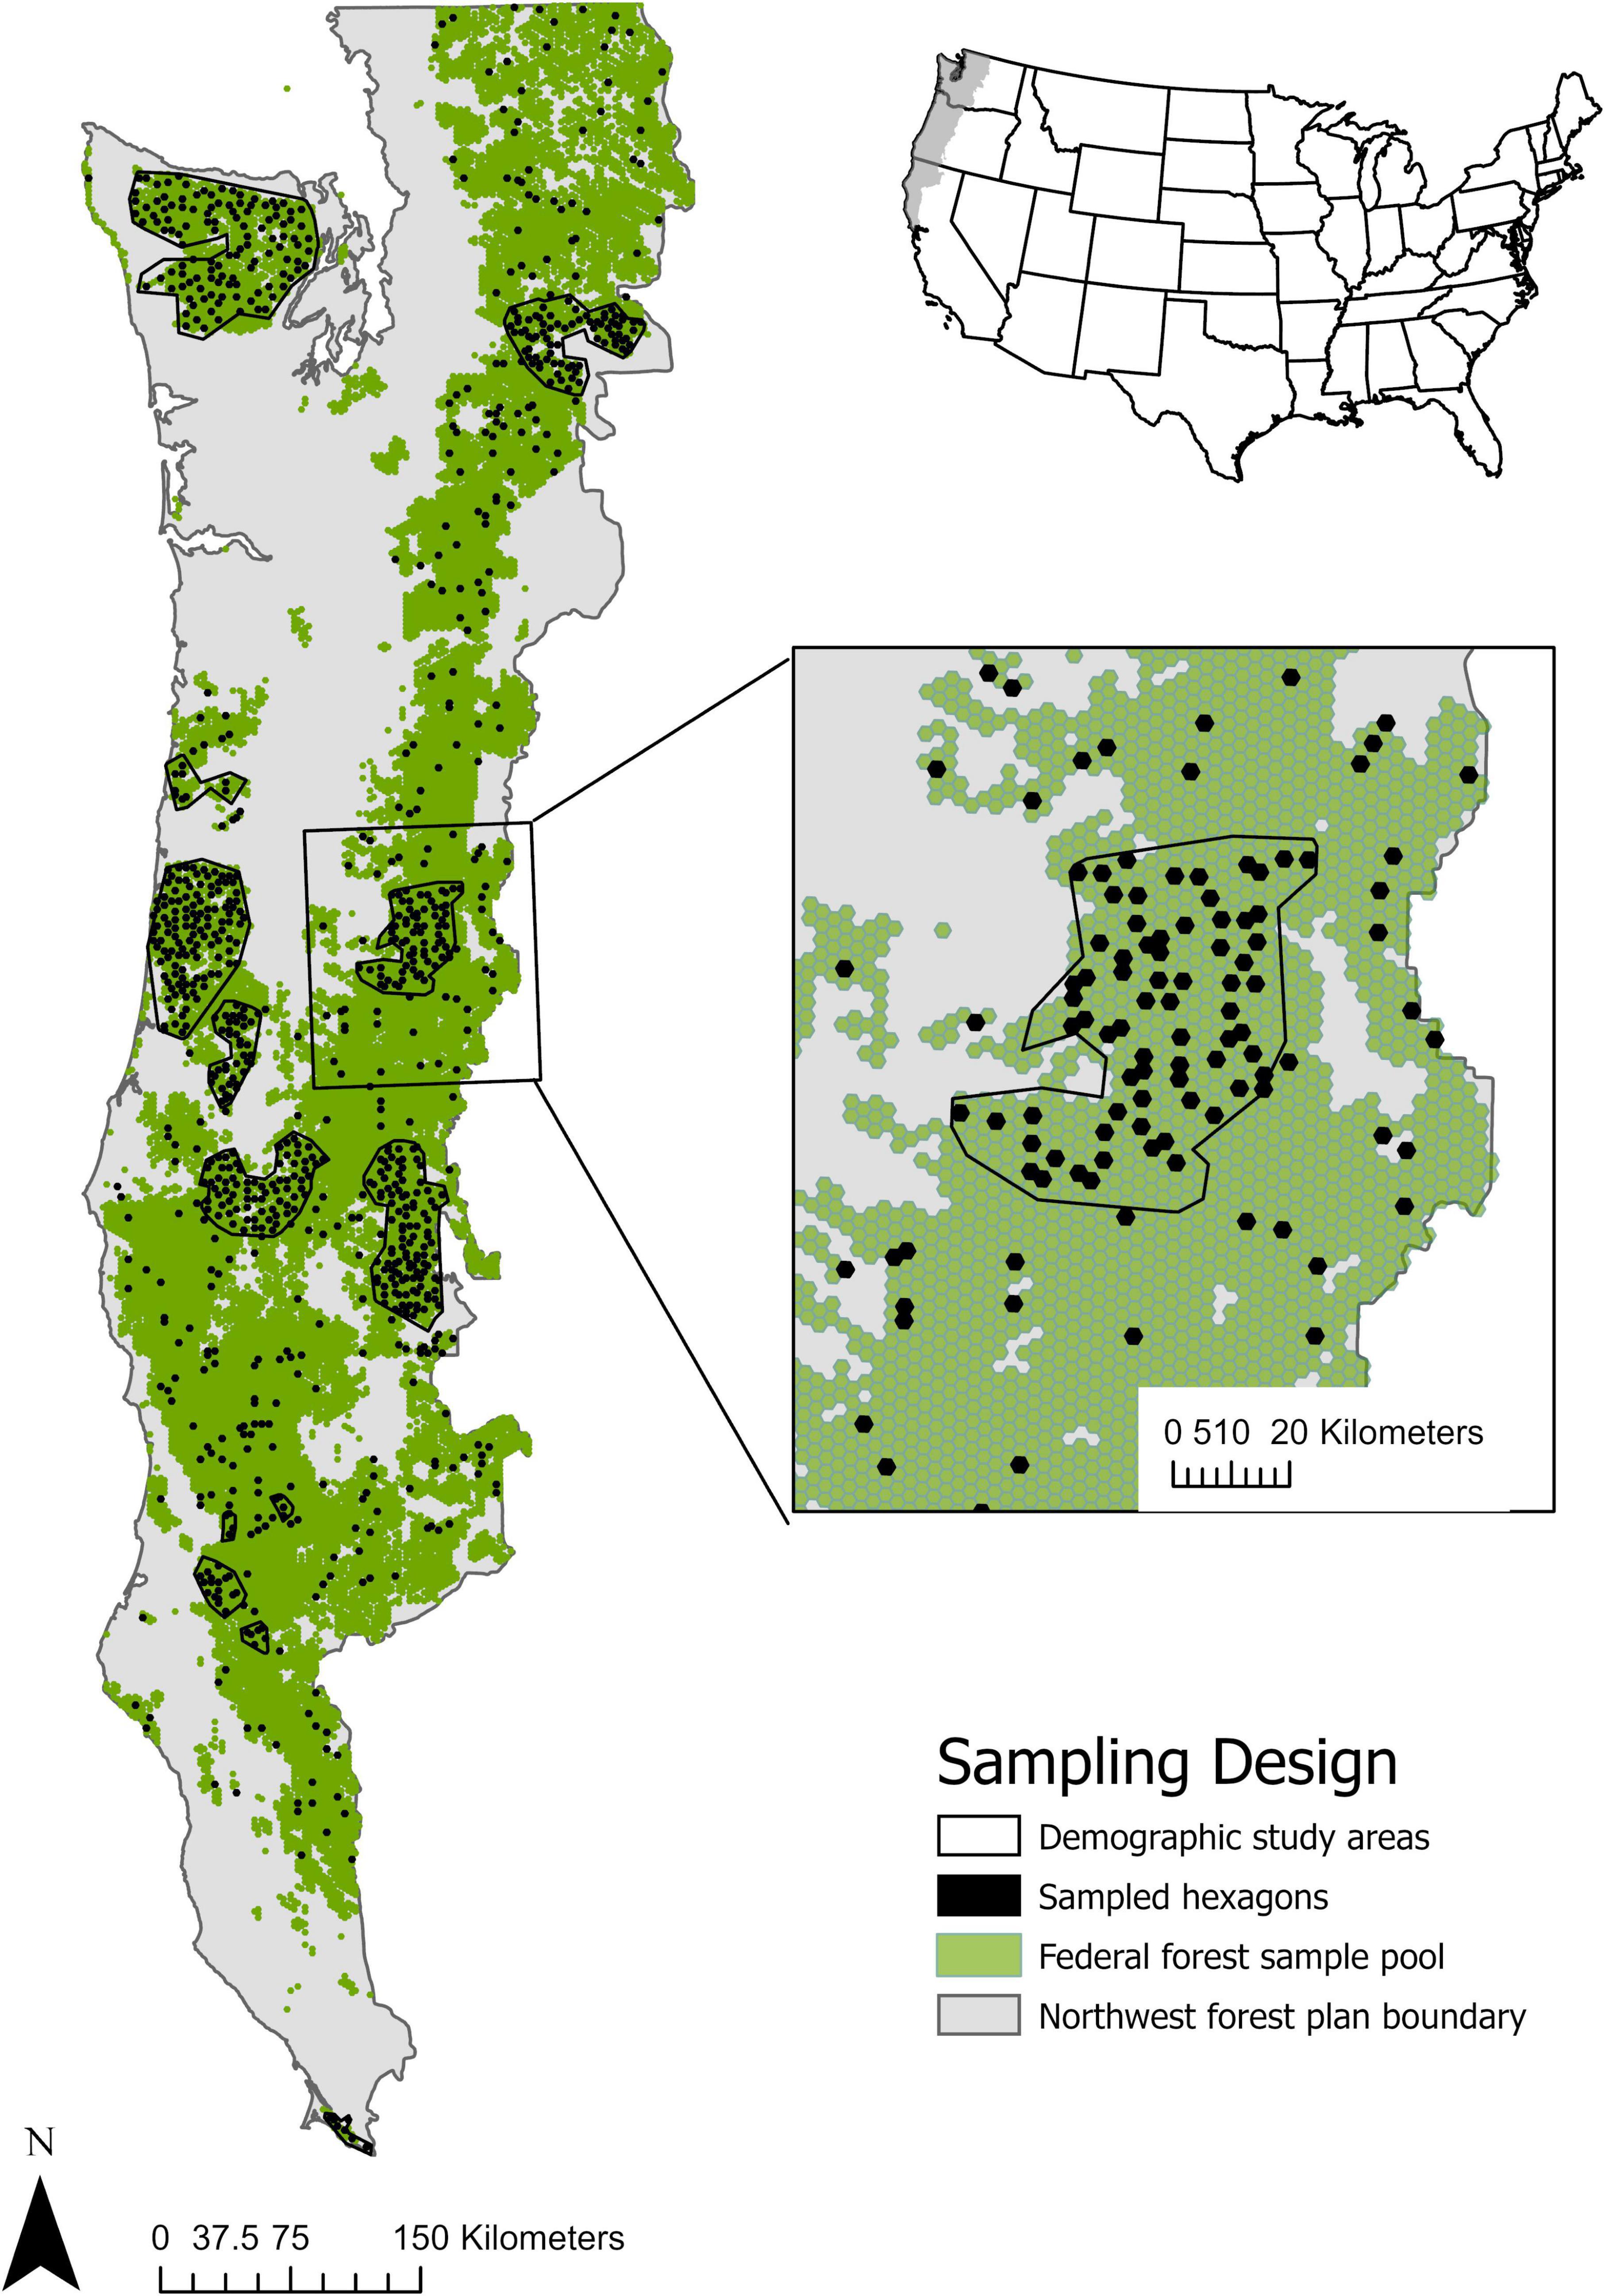
Figure 1. Map of the Northwest Forest Plan area of the Pacific Northwest, USA. Green area is the pool of 5 km2 hexagons that are >50% forest cover and >25% under federal land management. Black outlines are historical study areas for northern spotted owl demographic and territory occupancy monitoring (Franklin et al., 2021). Black 5 km2 hexagons are randomly selected from pool of green hexagons and represent the base design of passive acoustic monitoring in the 2 + 20% survey design (Lesmeister et al., 2021a). Within historical study areas, 20% of hexagons were randomly selected, and outside those study areas 2% of hexagons were randomly selected for long-term passive acoustic monitoring.
Beyond spotted owls, the passive acoustic monitoring program has an opportunity to expand into forest biodiversity monitoring at a scale that was unachievable until recently (Tosa et al., 2021). Coupling these broad scale survey data with FIA plot data and GNN models will provide a powerful toolbox for predicting how long-term changes in forest conditions will affect spotted owls and many other wildlife species and identify winners and losers in dynamic landscapes (Tinkham et al., 2018; Bell et al., 2021). These outcomes are not possible with monitoring programs based in traditional field methods because those programs are typically single-species focused and not optimally designed for sampling many other species (Lesmeister and Nielsen, 2011). There are commonly tradeoffs in study design between the number of sampling occasions and sites surveyed (Sanderlin et al., 2014). Passive bioacoustic monitoring has potential to resolve these tradeoffs given the capability of long duration deployments designed with random site selection and multiscale clustered sampling, which can generate quality data for the widest range of species over large geographic regions. The NWFP passive acoustic monitoring program was designed to ensure effectiveness for spotted owls, but the random selection of forest-capable 5 km2 hexagons with multiple sampling stations offers a design suitable for many other forest-adapted wildlife species. The development of artificial intelligence tools to automate data processing and a standardized workflow enables the extension of the program to many other species by rapidly generating robust datasets for ecological analyses that link directly to FIA-derived models for habitat assessment and distribution (Figure 2). For example, the most recent version of the PNW-Cnet model1 identifies 37 species with new species being added with each retraining of the model (Lesmeister et al., 2022; Ruff et al., In Review). Still unresolved is understanding which additional species or communities are most suitable to integrate into the monitoring program. Options will be limited to the taxa appropriate to the spatial and temporal sampling design and to the pool of species that can be included in automated systems. Some choices may be driven by conservation or management needs. Marbled murrelets (Brachyramphus marmoratus), for example, may be considered because they are endangered (IUCN, 2021), population monitoring is mandated under the NWFP, and detections are automated in PNW-Cnet (Lesmeister et al., 2022).
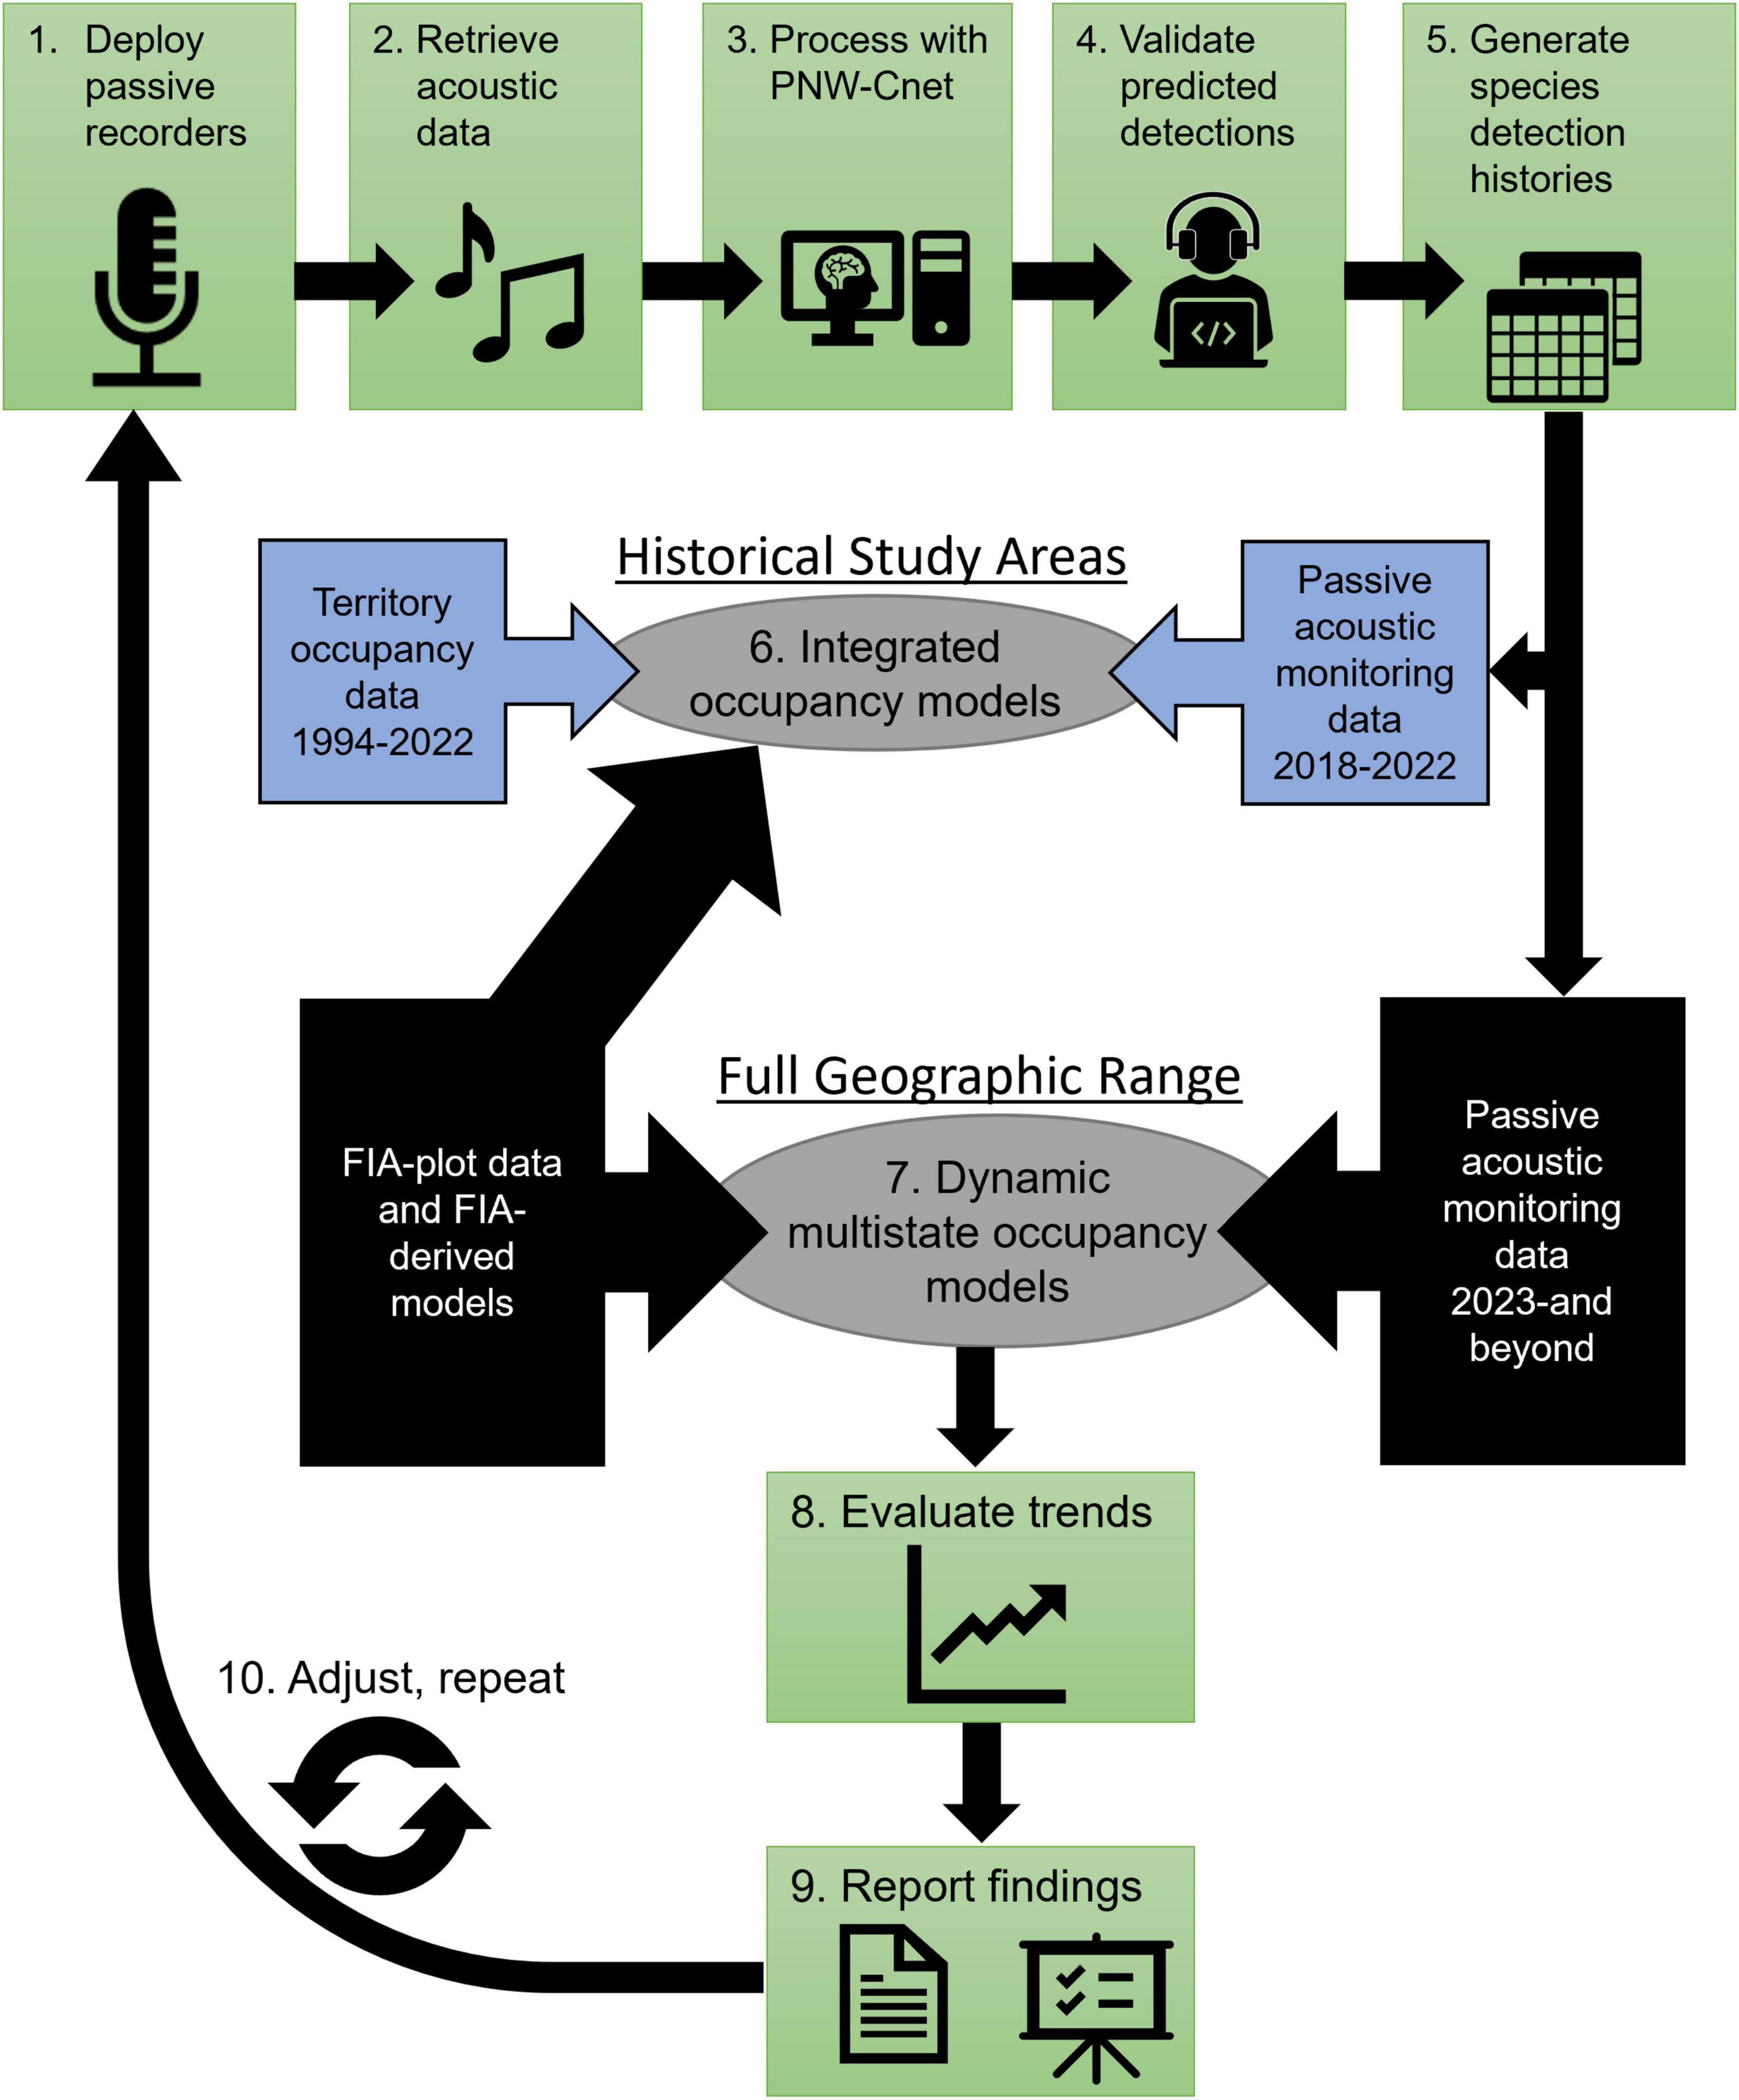
Figure 2. Steps in the workflow of long-term passive acoustic monitoring and the transition from territory occupancy monitoring. Step 1: Deploy autonomous recording units in randomly selected 5 km2 hexagons. Step 2: Retrieve acoustic data, organize and manage sound files, and conduct initial data processing. Step 3: Process data with PNW-Cnet to generate predictions for target class detections (Ruff et al., 2021). Step 4: Validate output from PNW-Cnet by confirming species identification predicted by the model. This step is necessary to ensure no false positives are included in ecological analyses, to evaluate performance of the PNW-Cnet, and create new training data that can be used to train future versions of PNW-Cnet. Step 5: Generate multistate detection histories for northern spotted owls and any other species to be included in occupancy analyses. Step 6: Use integrated dynamic multistate occupancy models for the transition from demographic and territory occupancy monitoring to passive bioacoustics. Step 7: Long-term analyses to quantify Northern spotted owl population trends in a dynamic multistate occupancy framework. FIA plot data and derived landscape models are used for developing environmental covariates for steps 6 and 7. Step 8: Based on output from previous step, evaluate trends in populations and determine if trigger points for management action are met. Step 9: Report findings by way of agency reports, presentations, and peer-reviewed publications. Step 10: Adjust monitoring design as necessary based on changes in population (step 8) and environmental conditions as informed by FIA-derived models. Repeat steps 1–9.
In the long-term, passive acoustic monitoring has well-defined advantages for northern spotted owls, but an important challenge in the transition will be developing analytical methods capable of integrating data generated from long-term demographic studies with passive acoustic monitoring. Data integration techniques are increasingly used and in active development across a wide range of ecological disciplines to expand spatial and temporal scope of ecological inferences, precision of parameter estimates, and make inferences on multiscale processes (Zipkin et al., 2021). The biological state shared among the two detection/non-detection datasets for northern spotted owls is site-occupancy within historical study areas. However, phase one data is based on historical territory site (i.e., varying size and shape) surveys and passive acoustic monitoring (phase two data) occurs at randomly selected 5 km2 hexagons (Figure 1). Models are available to integrate data at multiple matching spatial scales and from multiple methods for inference about detections probabilities and occupancy dynamics (Nichols et al., 2008). Spatial or temporal mismatch in datasets presents a change of support problem and, in the case of spatial mismatch, will require solutions to solve the modifiable area unit problem (Gotway and Young, 2002). Models to integrate multimethod data, multistate data, and reconciling spatial mismatch of site-occupancy data for northern spotted owls is an area of active research and development (Figure 2; Weldy et al., In Review). These approaches can be expanded to longitudinal data to quantify occupancy dynamics and thus a framework applicable to many monitoring programs seeking to transition to modern methodologies without the loss or integrity of historical data.
Conclusion
New technologies are fundamentally altering our ability to monitor, in detail, entire forest ecosystems and the species and communities that inhabit those environments. Passive acoustic monitoring, coupled with FIA data and complementary advancements in data computation and statistics, is an effective method for monitoring northern spotted owls. The NWFP Regional Interagency Executive Committee used multiple lines of evidence to support the decision to transition northern spotted owl monitoring to these methods. The well-planned transition ensures the monitoring program will be relevant and cutting edge into the future, while maintaining linkage to historical data. Spotted owls require a range of ecological conditions that includes old forest, so have been proposed as an indicator of those forest conditions (Block et al., 2001), but the effectiveness has declined as fewer and fewer northern spotted owls persist in these forests. While this reality is devastating, there is now an opportunity to establish a biodiversity monitoring framework that results in a standardized flow of information and utilizes the power of FIA data to understand drivers of wildlife population change. The flexibility and scale of the biodiversity monitoring program is unprecedented and will likely provide insights in the future that are unimaginable today. For example, passive acoustic monitoring data can provide inference on COVID-19 pandemic effects on forest soundscapes. Some study areas in the NWFP area have been surveyed with passive acoustic monitoring since 2018, even during the pandemic (Marcot et al., 2020), affording the ability to measure differences in species-specific calling activity and acoustic indices pre-, early-, mid-, and late pandemic. Without consistent and well-designed monitoring, these options would be unattainable. The second phase of this iconic monitoring program will leverage new technologies that better address northern spotted owl conservation needs, expand the scope of inference from FIA-derived models, and transition the program to broad biodiversity monitoring that assists forest managers as they face myriad challenges related to climate change and other large-scale disturbances.
Data availability statement
The original contributions presented in this study are included in the article/supplementary material, further inquiries can be directed to the corresponding author.
Author contributions
DL coordinated and framed the manuscript, wrote the first draft, and reconciled edits and reviews. JJ contributed to framing and edits of the manuscript and developed Figures 1, 2. Both authors contributed substantially to the article and approved the submitted version.
Funding
The NWFP effectiveness monitoring is an interagency program with northern spotted owl monitoring primarily funded by USDA Forest Service, US Bureau of Land Management, and US National Park Service.
Acknowledgments
We are deeply indebted to our predecessors in this monitoring program whose contributions to northern spotted owl conservation and research are unmatched. The development and implementation of the Northwest Forest Plan is unprecedented in scale and breadth, of which we all benefit. We thank Raymond Davis for contributions in monitoring design and his tireless efforts in program support and leadership. We have many current and former staff to thank for their dedication to northern spotted owl research and monitoring that were foundational to this manuscript and more broadly to northern spotted owl conservation. We are appreciative of comments by two reviewers that greatly improved the manuscript.
Conflict of interest
The authors declare that the research was conducted in the absence of any commercial or financial relationships that could be construed as a potential conflict of interest.
Publisher’s note
All claims expressed in this article are solely those of the authors and do not necessarily represent those of their affiliated organizations, or those of the publisher, the editors and the reviewers. Any product that may be evaluated in this article, or claim that may be made by its manufacturer, is not guaranteed or endorsed by the publisher.
Footnotes
References
Abatzoglou, J. T., and Williams, A. P. (2016). Impact of anthropogenic climate change on wildfire across western US forests. Proc. Natl. Acad. Sci. U.S.A. 113, 11770–11775. doi: 10.1073/pnas.1607171113
Bailey, L. L., Mackenzie, D. I., and Nichols, J. D. (2014). Advances and applications of occupancy models. Methods Ecol. Evol. 5, 1269–1279. doi: 10.1111/2041-210X.12100
Bailey, L. L., Reid, J. A., Forsman, E. D., and Nichols, J. D. (2009). Modeling co-occurrence of northern spotted and barred owls: Accounting for detection probability differences. Biol. Conserv. 142, 2983–2989. doi: 10.1016/j.biocon.2009.07.028
Bell, D. M., Acker, S. A., Gregory, M. J., Davis, R. J., and Garcia, B. A. (2021). Quantifying regional trends in large live tree and snag availability in support of forest management. For. Ecol. Manage. 479:118554. doi: 10.1016/j.foreco.2020.118554
Block, W. M., Franklin, A. B., Ward, J. P., Ganey, J. L., and White, G. C. (2001). Design and implementation of monitoring studies to evaluate the success of ecological restoration on wildlife. Restor. Ecol. 9, 293–303. doi: 10.3390/w13030371
Busch, E. D., and Trexler, J. C. (2003). “The importance of monitoring in regional ecosystem initiatives,” in Monitoring ecosystems: Interdisciplinary approaches for evaluating ecoregional initiatives, eds E. D. Busch and J. C. Trexler (Washington, DC: Island Press).
Chojnacky, D. C., and Dick, J. L. (2000). Evaluating fia forest inventory data for monitoring Mexican spotted owl habitata: Gila national forest example. West. J. Appl. For. 15, 195–199. doi: 10.1093/wjaf/15.4.195
Clark, D. A., Anthony, R. G., and Andrews, L. S. (2013). Relationship between wildfire, salvage logging, and occupancy of nesting territories by northern spotted owls. J. Wildl. Manag. 77, 672–688. doi: 10.1002/jwmg.523
Comfort, E. J., Clark, D. A., Anthony, R. G., Bailey, J., and Betts, M. G. (2016). Quantifying edges as gradients at multiple scales improves habitat selection models for northern spotted owl. Landsc. Ecol. 31, 1227–1240. doi: 10.1007/s10980-015-0330-1
Cove, M. V., Kays, R., Bontrager, H., Bresnan, C., Lasky, M., Frerichs, T., et al. (2021). Snapshot USA 2019: A coordinated national camera trap survey of the United States. Ecology 102:e03353.
Dale, S. S., Jenkins, J. M. A., Ruff, Z. J., Duchac, L. S., and Lesmeister, D. B. (2022). Distinguishing sex of northern spotted owls with passive acoustic monitoring. J. Raptor Res. 56, 287–299. doi: 10.3356/JRR-21-33
Davis, R. J., Lesmeister, D. B., Yang, Z., Hollen, B., Tuerler, B., and Hobson, J. (2022). Northwest forest plan—the first 25 years (1994-2018): Status and trends of northern spotted owl habitats. General Technical Report Pnw-Gtr-1003. Portland, OR: U.S. Department of Agriculture. doi: 10.2737/PNW-GTR-1003
Davis, R., Yang, Z., Yost, A., Belongie, C., and Cohen, W. (2017). The normal fire environment—Modeling environmental suitability for large forest wildfires using past, present, and future climate normals. For. Ecol. Manag. 390, 173–186. doi: 10.1016/j.foreco.2017.01.027
Duchac, L. S., Lesmeister, D. B., Dugger, K. M., and Davis, R. J. (2021). Differential landscape use by forest owls two years after a mixed-severity wildfire. Ecosphere 12:e03770. doi: 10.1002/ecs2.3770
Duchac, L. S., Lesmeister, D. B., Dugger, K. M., Ruff, Z. J., and Davis, R. J. (2020). Passive acoustic monitoring effectively detects Northern spotted Owls and barred Owls over a range of forest conditions. Condor 122, 1–22. doi: 10.1093/condor/duaa017
Dugger, K. M., Anthony, R. G., and Andrews, L. S. (2011). Transient dynamics of invasive competition: Barred Owls, Spotted Owls, habitat, and the demons of competition present. Ecol. Appl. 21, 2459–2468. doi: 10.1890/10-2142.1
Dugger, K. M., Forsman, E. D., Franklin, A. B., Davis, R. J., White, G. C., Schwarz, C. J., et al. (2016). The effects of habitat, climate and Barred Owls on the long-term population demographics of northern Spotted Owls. Condor 118, 57–116. doi: 10.1650/CONDOR-15-24.1
Dugger, K. M., Wagner, F., Anthony, R. G., and Olson, G. S. (2005). The relationship between habitat characteristics and demographic performance of northern Spotted Owls in southern Oregon. Condor 107, 863–878. doi: 10.1093/condor/107.4.863
Fidino, M., Simonis, J. L., and Magle, S. B. (2018). A multistate dynamic occupancy model to estimate local colonization–extinction rates and patterns of co-occurrence between two or more interacting species. Methods Ecol. Evol. 10, 233–244. doi: 10.1111/2041-210X.13117
Forsman, E. D., Meslow, E. C., and Wight, H. M. (1984). Distribution and biology of the spotted owl in Oregon. Wildl. Monogr. 48, 1–64.
Forsman, E. D., Swingle, J. K., Davis, R. J., Biswell, B. L., and Andrews, L. S. (2016). Tree voles: An evaluation of their distribution and habitat relationships based on recent and historical studies, habitat models, and vegetation change. Portland, OR: USDA Forest Service. doi: 10.2737/PNW-GTR-948
Franklin, A. B., Anderson, D. R., Forsman, E. D., Burnham, K. P., and Wagner, F. W. (1996). Methods for collecting and analyzing demographic data on the Northern Spotted Owl. Stud. Avian Biol. 17, 12–20.
Franklin, A. B., Dugger, K. M., Lesmeister, D. B., Davis, R. J., Wiens, J. D., White, G. C., et al. (2021). Range-wide declines of northern spotted owl populations in the Pacific Northwest: A meta-analysis. Biol. Conserv. 259:109168. doi: 10.1016/j.biocon.2021.109168
Glenn, E. M., Hansen, M. C., and Anthony, R. G. (2004). Spotted owl home-range and habitat use in young forests of western Oregon. J. Wildl. Manag. 68, 33–50. doi: 10.2193/0022-541X(2004)068[0033:SOHAHU]2.0.CO;2
Gotway, C. A., and Young, L. J. (2002). Combining incompatible spatial data. J. Am. Stat. Assoc. 97, 632–648. doi: 10.1198/016214502760047140
Hamer, T. E., Forsman, E. D., and Glenn, E. M. (2007). Home range attributes and habitat selection of Barred Owls and Spotted Owls in an area of sympatry. Condor 109, 750–768. doi: 10.1093/condor/109.4.750
Hanson, C. T., Lee, D. E., and Bond, M. L. (2021). Disentangling post-fire logging and high-severity fire effects for spotted owls. Birds 2, 147–157. doi: 10.3390/birds2020011
IUCN (2021). The IUCN red list of threatened species. Available online at: https://www.iucnredlist.org (accessed June 10, 2022).
Jenkins, J. M. A., Lesmeister, D. B., Forsman, E. D., Dugger, K. M., Ackers, S. H., Andrews, L. S., et al. (2021). Conspecific and congeneric interactions shape increasing rates of breeding dispersal of northern spotted owls. Ecol. Appl. 31:e02398. doi: 10.1002/eap.2398
Jenkins, J. M. A., Lesmeister, D. B., Forsman, E. D., Dugger, K. M., Ackers, S. H., and Andrews, L. S. (2019a). Social status, forest disturbance, and Barred Owls shape long-term trends in breeding dispersal distance of Northern Spotted Owls. Condor 121:duz055. doi: 10.1093/condor/duz055
Jenkins, J. M. A., Lesmeister, D. B., Wiens, J. D., Kane, J. T., Kane, V. R., and Verschuyl, J. (2019b). Three-dimensional partitioning of resources by congeneric forest predators with recent sympatry. Sci. Rep. 9:6036. doi: 10.1038/s41598-019-42426-0
Jones, G. A., Keane, J. J., Gutiérrez, R. J., and Peery, M. Z. (2017). Declining old-forest species as a legacy of large trees lost. Divers. Distrib. 24, 341–351. doi: 10.1111/ddi.12682
Jones, G. M., Gutièrrez, R. J., Block, W. M., Carlson, P. C., Comfort, E. J., Cushman, S. A., et al. (2020). Spotted owls and forest fire: Comment. Ecosphere 11:e03312. doi: 10.1111/j.1523-1739.2009.01414.x
Kays, R., Mcshea, W. J., and Wikelski, M. (2020). Born-digital biodiversity data: Millions and billions. Divers. Distrib. 26, 644–648. doi: 10.1111/ddi.12993
Kissling, M. L., Lewis, S. B., and Pendleton, G. (2010). Factors influencing the detectability of forest owls in Southeastern Alaska. Condor 112, 539–548. doi: 10.1525/cond.2010.090217
Lesmeister, D. B., and Nielsen, C. K. (2011). Protocol for large-scale monitoring of riparian mammals. Wildl. Biol. Pract. 7, 55–70. doi: 10.1007/s00267-016-0739-6
Lesmeister, D. B., Davis, R. J., Sovern, S. G., and Yang, Z. (2021b). Northern spotted owl nesting forests as fire refugia: A 30-year synthesis of large wildfires. Fire Ecol. 17, 32. doi: 10.1186/s42408-021-00118-z
Lesmeister, D. B., Appel, C. L., Davis, R. J., Yackulic, C. B., and Ruff, Z. J. (2021a). Simulating the effort necessary to detect changes in northern spotted owl (Strix occidentalis caurina) populations using passive acoustic monitoring. Res. Pap. Pnw-Rp-618. Portland, OR: USDA Forest Service.
Lesmeister, D. B., Davis, R. J., Singleton, P. H., and Wiens, J. D. (2018). “Northern spotted owl habitat and populations: Status and threats,” in Synthesis of science to inform land management within the northwest forest plan area. Pnw-Gtr-966, eds T. A. Spies, P. A. Stine, R. Gravenmier, J. W. Long, and M. J. Reilly (Portland, OR: USDA Forest Service). doi: 10.1111/j.1523-1739.2006.00387.x
Lesmeister, D. B., Jenkins, J. M. A., Ruff, Z. J., Davis, R. J., Appel, C. L., Thomas, A. D., et al. (2022). Passive acoustic monitoring within the northwest forest plan area: 2021 annual report. Corvallis, OR: USDA Forest Service.
Lesmeister, D. B., Sovern, S. G., Davis, R. J., Bell, D. M., Gregory, M. J., and Vogeler, J. C. (2019). Mixed-severity wildfire and habitat of an old-forest obligate. Ecosphere 10:e02696. doi: 10.1002/ecs2.2696
Lindenmayer, D. B., and Likens, G. E. (2009). Adaptive monitoring: A new paradigm for long-term research and monitoring. Trends Ecol. Evol. 24, 482–486. doi: 10.1016/j.tree.2009.03.005
Linnell, M. A., and Lesmeister, D. B. (2019). Landscape connectivity and conservation prioritization for an old forest species with limited vagility. Anim. Conserv. 22, 568–578. doi: 10.1111/acv.12496
Lint, J., Noon, B., Anthony, R., Forsman, E., Raphael, M., Collopy, M., et al. (1999). Northern spotted owl effectiveness monitoring plan for the northwest forest plan. Portland, OR: USDA Forest Service. doi: 10.2737/PNW-GTR-440
Mangan, A. O., Chestnut, T., Vogeler, J. C., Breckheimer, I. K., King, W. M., Bagnall, K. E., et al. (2019). Barred Owls reduce occupancy and breeding propensity of Northern Spotted Owl in a Washington old growth forest. Condor 121:duz031. doi: 10.1093/condor/duz031
Manley, P. N., Van Horne, B., Roth, J. K., Zielinski, W. J., Mckenzie, M. M., and Weller, T. J. (2006). Multiple species inventory and monitoring technical guide. Version 1.0. General Technical Report Wo-73. Washington, DC: USDA Forest Service. doi: 10.2737/WO-GTR-73
Marcot, B. G., Lesmeister, D. B., Wilson, T. M., Volkman, E., and Anderson, P. D. (2020). Applying principles and methods of risk analysis: A case example of northern spotted owl research in a dynamic pandemic landscape. Pnw-Rp-617. Portland, OR: U.S. Department of Agriculture.
Nathan, R., Monk, C. T., Arlinghaus, R., Adam, T., Alos, J., Assaf, M., et al. (2022). Big-data approaches lead to an increased understanding of the ecology of animal movement. Science 375:eabg1780. doi: 10.1126/science.abg1780
Nichols, J. D., Bailey, L. L., O’connell, A. F. Jr., Talancy, N. W., Campbell Grant, E. H., Gilbert, A. T., et al. (2008). Multi-scale occupancy estimation and modelling using multiple detection methods. J. Appl. Ecol. 45, 1321–1329. doi: 10.1016/j.scitotenv.2022.158143
Phalan, B. T., Northrup, J. M., Yang, Z., Deal, R. L., Rousseau, J. S., and Spies, T. A. (2019). Impacts of the northwest forest plan on forest composition and bird populations. Proc. Natl. Acad. Sci. U.S.A. 116, 3322–3327. doi: 10.1073/pnas.1813072116
Reid, J. A., Horn, R. B., and Forsman, E. D. (1999). Detection rates of spotted owls based on acoustic-lure and live-lure surveys. Wildl. Soc. Bull. 27, 986–990.
Rockweit, J. T., Franklin, A. B., and Carlson, P. C. (2017). Differential impacts of wildfire on the population dynamics of an old-forest species. Ecology 98, 1574–1582. doi: 10.1002/ecy.1805
Rockweit, J. T., Jenkins, J. M., Hines, J. E., Nichols, J. D., Dugger, K. M., and Franklin, A. B. (2022). Range-wide sources of variation in reproductive rates of northern spotted owls. Ecol. Appl. e2726. doi: 10.1002/eap.2726
Ross, S. R. P. J., Friedman, N. R., Dudley, K. L., Yoshimura, M., Yoshida, T., and Economo, E. P. (2018). Listening to ecosystems: Data-rich acoustic monitoring through landscape-scale sensor networks. Ecol. Res. 33, 135–147. doi: 10.1007/s11284-017-1509-5
Ruff, Z. J., Lesmeister, D. B., Appel, C. L., and Sullivan, C. M. (2021). Workflow and convolutional neural network for automated identification of animal sounds. Ecol. Indic. 124:107419. doi: 10.1016/j.ecolind.2021.107419
Ruff, Z. J., Lesmeister, D. B., Duchac, L. S., Padmaraju, B. K., and Sullivan, C. M. (2020). Automated identification of avian vocalizations with deep convolutional neural networks. Remote Sens. Ecol. Conserv. 6, 79–92. doi: 10.1098/rsif.2021.0921
Ruff, Z. J., Lesmeister, D. B., Jenkins, J. M. A., and Sullivan, C. M. (In Review). Pnw-Cnet v4: Automated species identification for passive acoustic monitoring. SoftwareX
Sanderlin, J. S., Block, W. M., and Ganey, J. L. (2014). Optimizing study design for multi-species avian monitoring programmes. J. Appl. Ecol. 51, 860–870. doi: 10.1111/1365-2664.12252
Schilling, J. W., Dugger, K. M., and Anthony, R. G. (2013). Survival and home-range size of northern spotted owls in southwestern Oregon. J. Raptor Res. 47, 1–14. doi: 10.3356/JRR-11-76.1
Shonfield, J., and Bayne, E. M. (2017). Autonomous recording units in avian ecological research: Current use and future applications. Avian Conserv. Ecol. 12:14. doi: 10.5751/ACE-00974-120114
Shonfield, J., Heemskerk, S., and Bayne, E. M. (2018). Utility of automated species recognition for acoustic monitoring of owls. J. Raptor Res. 52, 42–55. doi: 10.3356/JRR-17-52.1
Singleton, P. H., Lehmkuhl, J. F., Gaines, W. L., and Graham, S. A. (2010). Barred owl space use and habitat selection in the eastern Cascades. Washington. J. Wildl. Manag. 74, 285–294. doi: 10.2193/2008-548
Sovern, S. G., Lesmeister, D. B., Dugger, K. M., Pruett, M. S., Davis, R. J., and Jenkins, J. M. (2019). Activity center selection by northern spotted owls. J. Wildl. Manag. 83, 714–727. doi: 10.1002/jwmg.21632
Spies, T. A., Long, J. W., Charnley, S., Hessburg, P. F., Marcot, B. G., Reeves, G. H., et al. (2019). Twenty-five years of the northwest forest plan: What have we learned? Front. Ecol. Environ. 17:511–520. doi: 10.1002/fee.2101
Spies, T. A., Long, J. W., Stine, P. A., Charnley, S., Cerveny, L. K., Marcot, B. G., et al. (2018). “Integrating ecological and social science to inform land management in the area of the northwest forest plan,” in Synthesis of science to inform land management within the northwest forest plan area, eds T. A. Spies, P. A. Stine, R. Gravenmier, J. W. Long, and M. J. Reilly (Portland, OR: USDA Forest Service). doi: 10.2737/PNW-GTR-966
Steenweg, R., Hebblewhite, M., Kays, R., Ahumada, J., Fisher, J. T., Burton, C., et al. (2017). Scaling-up camera traps: Monitoring the planet’s biodiversity with networks of remote sensors. Front. Ecol. Environ. 15, 26–34. doi: 10.1002/fee.1448
Sugai, L. S. M., Silva, T. S. F., Ribeiro, J. W. R. Jr., and Llusia, D. (2019). Terrestrial passive acoustic monitoring: Review and perspectives. BioScience 69, 15–25. doi: 10.1093/biosci/biy147
Tegeler, A. K., Morrison, M. L., and Szewczak, J. M. (2012). Using extended-duration audio recordings to survey avian species. Wildl. Soc. Bull. 36, 21–29. doi: 10.1002/wsb.112
Tinkham, W. T., Mahoney, P. R., Hudak, A. T., Domke, G. M., Falkowski, M. J., Woodall, C. W., et al. (2018). Applications of the United States Forest Inventory and Analysis dataset: A review and future directions. Can. J. For. Res. 48, 1251–1268. doi: 10.1139/cjfr-2018-0196
Torresan, C., Garzón, M. B., O’grady, M., Robson, T. M., Picchi, G., Panzacchi, P., et al. (2021). A new generation of sensors and monitoring tools to support climate-smart forestry practices. Can. J. For. Res. 51, 1751–1765. doi: 10.1139/cjfr-2020-0295
Tosa, M. I., Dziedzic, E. H., Appel, C. L., Urbina, J., Massey, A., Ruprecht, J., et al. (2021). The rapid rise of next-generation natural history. Front. Ecol. Evol. 9:698131. doi: 10.3389/fevo.2021.698131
USFWS (2020). Endangered and threatened wildlife and plants: 12-month finding for the Northern Spotted Owl. Fed. Regist. 85, 81144–81152.
USFWS (2021). Northern spotted owl recovery information site: Survey protocol. Portland, OR: US Fish and Wildlife Service.
Wan, H. Y., Cushman, S. A., and Ganey, J. L. (2019). Recent and projected future wildfire trends across the ranges of three spotted owl subspecies under climate change. Front. Ecol. Evol. 7:37. doi: 10.3389/fevo.2019.00037
Weldy, M. J., Lesmeister, D. B., Yackulic, C. B., Appel, C. L., Mccafferty, C., and Wiens, J. D. (In Review). Long-term monitoring in transition: Resolving spatial mismatch and integrating multistate occupancy data. J. Appl. Ecol.
Wiens, J. D., Anthony, R. G., and Forsman, E. D. (2011). Barred owl occupancy surveys within the range of the northern spotted owl. J. Wildl. Manag. 75, 531–538. doi: 10.1002/jwmg.82
Wiens, J. D., Anthony, R. G., and Forsman, E. D. (2014). Competitive interactions and resource partitioning between northern spotted owls and barred owls in Western Oregon. Wildl. Monogr. 185, 1–50. doi: 10.1002/wmon.1009
Wiens, J. D., Dilione, K. E., Eagles-Smith, C. A., Herring, G., Lesmeister, D. B., Gabriel, M. W., et al. (2019). Anticoagulant rodenticides in Strix owls indicate widespread exposure in west coast forests. Biol. Conserv. 238:108238. doi: 10.1016/j.biocon.2019.108238
Wilk, R. J., Lesmeister, D. B., and Forsman, E. D. (2018). Nest trees of northern spotted owls (Strix occidentalis caurina) in Washington and Oregon, USA. PLoS One 13:e0197887. doi: 10.1371/journal.pone.0197887
Wilson, T. M., and Forsman, E. D. (2013). “Thinning effects on spotted owl prey and other forest-dwelling small mammals,” in Density management in the 21st century: West side story, eds P. D. Anderson and K. L. Ronnenberg (Portland, OR: US Department of Agriculture).
Yackulic, C. B., Bailey, L. L., Dugger, K. M., Davis, R. J., Franklin, A. B., Forsman, E. D., et al. (2019). The past and future roles of competition and habitat in the rangewide occupancy dynamics of Northern Spotted Owls. Ecol. Appl. 29:e01861. doi: 10.1002/eap.1861
Zielinski, W. J., Truex, R. L., Dunk, J. R., and Gaman, T. (2006). Using forest inventory data to assess fisher resting habitat suitability in California. Ecol. Appl. 16, 1010–1025. doi: 10.1890/1051-0761(2006)016[1010:ufidta]2.0.co;2
Zipkin, E. F., Zylstra, E. R., Wright, A. D., Saunders, S. P., Finley, A. O., Dietze, M. C., et al. (2021). Addressing data integration challenges to link ecological processes across scales. Front. Ecol. Environ. 19:30–38. doi: 10.1002/fee.2290
Zuberogoitia, I., Burgos, G., González-Oreja, J. A., Martínez, J. E., Morant, J., and Zabala, J. (2020). Testing detectability of radio-tracked Tawny Owls using playback broadcast surveys: Designing evidence-based surveys. Ardeola 67, 355–369. doi: 10.13157/arla.67.2.2020.ra8
Keywords: passive acoustic monitoring, Northwest Forest Plan, biodiversity monitoring, big data, machine learning, Endangered Species
Citation: Lesmeister DB and Jenkins JMA (2022) Integrating new technologies to broaden the scope of northern spotted owl monitoring and linkage with USDA forest inventory data. Front. For. Glob. Change 5:966978. doi: 10.3389/ffgc.2022.966978
Received: 12 June 2022; Accepted: 07 October 2022;
Published: 26 October 2022.
Edited by:
James Westfall, Northern Research Station, Forest Service (USDA), United StatesReviewed by:
Chad Hanson, Earth Island Institute, United StatesMark Nelson, Northern Research Station, Forest Service (USDA), United States
Copyright © 2022 Lesmeister and Jenkins. This is an open-access article distributed under the terms of the Creative Commons Attribution License (CC BY). The use, distribution or reproduction in other forums is permitted, provided the original author(s) and the copyright owner(s) are credited and that the original publication in this journal is cited, in accordance with accepted academic practice. No use, distribution or reproduction is permitted which does not comply with these terms.
*Correspondence: Damon B. Lesmeister, ZGFtb24ubGVzbWVpc3RlckB1c2RhLmdvdg==