Abstract
Forest dynamics in arid and semiarid regions are sensitive to water availability, which is becoming increasingly scarce as global climate changes. The timing and magnitude of precipitation in the semiarid southwestern U.S. (“Southwest”) has changed since the 21st century began. The region is projected to become hotter and drier as the century proceeds, with implications for carbon storage, pest outbreaks, and wildfire resilience. Our goal was to quantify the importance of summer monsoon precipitation for forested ecosystems across this region. We developed an isotope mixing model in a Bayesian framework to characterize summer (monsoon) precipitation soil water recharge and water use by three foundation tree species (Populus tremuloides [aspen], Pinus edulis [piñon], and Juniperus osteosperma [Utah juniper]). In 2016, soil depths recharged by monsoon precipitation and tree reliance on monsoon moisture varied across the Southwest with clear differences between species. Monsoon precipitation recharged soil at piñon-juniper (PJ) and aspen sites to depths of at least 60 cm. All trees in the study relied primarily on intermediate to deep (10-60 cm) moisture both before and after the onset of the monsoon. Though trees continued to primarily rely on intermediate to deep moisture after the monsoon, all species increased reliance on shallow soil moisture to varying degrees. Aspens increased reliance on shallow soil moisture by 13% to 20%. Utah junipers and co-dominant ñons increased their reliance on shallow soil moisture by about 6% to 12%. Nonetheless, approximately half of the post-monsoon moisture in sampled piñon (38-58%) and juniper (47-53%) stems could be attributed to the monsoon. The monsoon contributed lower amounts to aspen stem water (24-45%) across the study area with the largest impacts at sites with recent precipitation. Therefore, monsoon precipitation is a key driver of growing season moisture that semiarid forests rely on across the Southwest. This monsoon reliance is of critical importance now more than ever as higher global temperatures lead to an increasingly unpredictable and weaker North American Monsoon.
1. Introduction
Global climate change is having substantial impacts on dryland ecosystems and their carbon and water cycles. Forests in dry regions are a major driver of global variability in the terrestrial carbon cycle and are sensitive to moisture fluctuations (Loik et al., 2004; Poulter et al., 2014; Ahlström et al., 2015; Barnes et al., 2021). The southwestern U.S. (“Southwest”) is among these rapidly changing dry regions where increased aridity over the 21st century has led to frequent droughts, with major impacts on forest productivity and health (e.g., Overpeck and Udall, 2020; Williams et al., 2020, 2022; Hammond et al., 2022). Impacts include extensive loss of iconic Southwest ecosystems due directly to drought or to secondary agents (e.g., beetles) that attack drought-stressed trees (e.g., Breshears et al., 2005; Shaw et al., 2005; Hansen et al., 2013; Allen et al., 2015).
Precipitation in the Southwest is largely bimodal, dominated by winter storms entering the region from the west and summer moisture associated with the North American Monsoon. The growing season for trees in the Southwest is generally from April through October, and precipitation is highly variable during these months. Early in the growing season, precipitation is relatively low across the region. High elevation sites historically have snow on the ground until late spring, but snowpack has been declining in the 21st century (Mote et al., 2018). June is the driest month in the Southwest, but it is followed by the summer monsoon, which typically begins in early to mid-July, bringing rain to water-stressed ecosystems across the region.
Climate change is affecting the historic distribution of precipitation. Winter precipitation is declining across the Southwest, and monsoon precipitation is becoming more variable in both magnitude and timing (Jones and Gutzler, 2016; Prein et al., 2016, 2022; Seager and Ting, 2017; Mankin et al., 2021; Hoell et al., 2022). Models suggest that the North American Monsoon will weaken as global temperatures rise (Pascale et al., 2017; Wang et al., 2020), and changes in precipitation patterns across the Southwest are already affecting plant and ecosystem functioning (e.g., Biederman et al., 2016; Bradford et al., 2020). Understanding tree water use can provide insights into how precipitation variability and changes in precipitation patterns may affect forested areas across the region as climate changes.
Stable isotopes in stem and soil water provide a means to determine the seasonality of soil moisture recharge and identify plant source water (Ogle et al., 2004; West et al., 2007a; Kerhoulas et al., 2017; Berkelhammer et al., 2020). Previous studies in the region have investigated plant water sources for a number of species across the Southwest, including Pinus ponderosa, Juniperus osteosperma (Utah juniper), Pinus edulis (piñon), and Populus tremuloides (aspen) (West et al., 2007a; Anderegg et al., 2013; Kerhoulas et al., 2013, 2017; Guo et al., 2018; Kannenberg et al., 2019). However, the region is rugged and largely remote, so many of these studies focus on single sites or have limited spatial extents. Topographic complexity of the region, heterogeneity in edaphic conditions, and plasticity in plant traits (e.g., rooting characteristics) render it difficult to generalize patterns in moisture use across the region.
We aimed to better understand the extent to which three Southwest foundation tree species (piñon, juniper, and aspen) relied on monsoon moisture over the 2016 growing season across a broad geographic region (Figure 1). To evaluate the impacts of the monsoon on tree water use, we focused on three questions: (Q1) To what extent does monsoon precipitation contribute to soil moisture at various depths in different ecosystem types? (Q2) Do trees take advantage of monsoon moisture inputs by changing the depths from which they extract water after the onset of the North American Monsoon? and (Q3) To what extent does monsoon precipitation contribute to stem water in foundation Southwest trees? We used measurements of isotopes in water extracted from stems and soils from multiple sites across the Southwest to address these questions.
FIGURE 1

Maps of the study area, showing sample locations (circles) alongside (A) mean annual precipitation, (B) 2015–16 winter precipitation, and (C) 2016 summer monsoon precipitation. Winter and summer precipitation are shown as a percent of average. Panel (A) shows the locations of sites from USNIP and Tulley-Cordova et al. (2021) study, which were used to calculate the monsoon end member (stars). The inset map in panel (A) shows the location of the detailed maps in panels (A–C) highlighted in gray within the continental US. Precipitation data are from PRISM, and longerm averages are calculated from the 1990 to 2010 normals.
2. Materials and methods
We combined field measurements of vadose zone moisture and plant water status with stable isotope analysis and isotope mixing models to characterize regional variability in the water sources of three foundation tree species across a precipitation gradient. For this study, we focused on piñon, Utah juniper, and aspen trees. These three species are widespread across the Southwest, employ a range of drought-tolerance strategies and hydraulic traits (Limousin et al., 2013; McDowell and Allen, 2015; Woodruff et al., 2015; Garcia-Forner et al., 2016; Peltier et al., 2022), and are potentially threatened by land-management decisions (Campbell et al., 2020) and drought-related disturbances, including wildfires (McDowell et al., 2020), insect infestations (Breshears et al., 2005; Allen et al., 2010, 2015; McDowell et al., 2020), and aridification (Kannenberg et al., 2021; Pettit, 2021), all of which are leading to profound changes in Southwest forest distributions.
2.1. Field methods
In 2016, we collected samples from 12 sites across an area of more than 381,000 km2 in the Four Corners region of the Southwest [5 piñon-juniper woodlands (“PJ sites”) and 7 mixed conifer sites with aspen as the only deciduous species (“aspen sites”)]. The PJ sites ranged in elevation from 1,680 m to 2,246 m, with mean annual temperature (MAT) ranging from 8 to 13°C and mean annual precipitation (MAP) ranging from 237 to 386 mm (PRISM Climate Group, 2016). The aspen sites ranged in elevation from 2,714 to 2,944 m, with MAT ranging from 3.5 to 6°C and MAP ranging from 583 to 780 mm. While snow accumulation is common at aspen sites across the Southwest, piñon-juniper woodlands typically experience relatively mild winters with little snow accumulation (Petrie et al., 2015; Petrie and Savage, 2022). These sites represent a subset of a larger network that has been previously described by Peltier et al. (2021, 2022). These sites were selected, in part, based on their proximity to sites in the greater plot network of the U.S. Forest Service Forest Inventory and Analysis (FIA) program (Shaw et al., 2005). See Table 1 for a summary of conditions at the sites used in this study and Supplementary Table 1 for information about site names used in other studies.
TABLE 1
| Site type | Sitea | Elevation (m) | MAPb (mm) | Monsoon (% MAP) |
2015–2016 winter precipitation (% average) |
2016 monsoon precipitation (% average) |
| Aspen | AS1 | 2,791 | 780 | 22 | 115 | 119 |
| AS2 | 2,714 | 701 | 27 | 69 | 74 | |
| AS4 | 2,915 | 598 | 27 | 94 | 114 | |
| AS5 | 2,825 | 707 | 30 | 83 | 103 | |
| AS6 | 2,944 | 657 | 26 | 96 | 121 | |
| AS9 | 2,781 | 583 | 31 | 87 | 129 | |
| AS10 | 2,845 | 727 | 37 | 76 | 90 | |
| PJ | PJ1 | 1,680 | 337 | 32 | 84 | 168 |
| PJ2 | 1,937 | 380 | 36 | 90 | 146 | |
| PJ5 | 1,962 | 238 | 39 | 106 | 97 | |
| PJ8 | 2,246 | 377 | 34 | 95 | 88 | |
| PJ11 | 1,949 | 386 | 33 | 159 | 94 |
Sites used in this study.
aSites previously described (Peltier et al., 2021, 2022).
bMean annual precipitation; Precipitation data from PRISM Climate Group (2016) downloaded August 2022.
The selected sites lie along a monsoon gradient where, in general, the sites that are farther south and east receive a greater proportion of their annual precipitation when the North American Monsoon is active (around July to September) (Higgins et al., 1997; PRISM Climate Group, 2016). In general, the monsoon provides 22–37% of the annual precipitation at aspen sites and between 31 and 39% at PJ sites. During the 2015-2016 water year, precipitation was spatially variable during the winter (December–January–February; Figure 1B) and monsoon (July–August–September; Figure 1C) across the region. Winter precipitation was below average at all but one aspen site (AS1) and all but two PJ sites (PJ5 and PJ11). Monsoon precipitation, however, was above average at most aspen sites and two of the PJ sites (Table 1).
At each site, we collected samples from five trees per species (85 trees total) twice during the 2016 growing season: before [June; day of year (DOY) 162–180; “pre-monsoon”] and after (August to September; DOY 238–260; “post-monsoon”) the onset of the North American Monsoon. We used a hand augur to collect soil samples under the canopy drip line of each tree. Regionally, depth to bedrock is shallow in the settings where these ecosystems are found, rarely reaching 100 cm (Jorgensen, 2005). Though we collected soil from the surface to a depth of 10 cm (“shallow” soil) for most trees (77 pre- and 81 post-monsoon samples), hardened clay, colluvium, and bedrock precluded collection of multiple soil depths uniformly across all sites. Despite difficulties in collecting soil for analysis, we retrieved samples from depths of 10–30 cm (“intermediate” soil; 61 pre- and 64 post-monsoon samples) and 30–60 cm (“deep” soil; 36 pre- and post-monsoon samples) at a minimum of 2 trees per species per site.
Regional groundwater can be tens to hundreds of meters below the land surface (Robson and Banta, 1995; USGS, 2023), so it is unlikely that trees at these sites are accessing regional groundwater. Further, previous studies have documented that fine roots responsible for water uptake are typically at their highest density within the top 60 cm of soil for the focal species (Pinno et al., 2010; Schwinning et al., 2020). Though it is possible that the trees are accessing additional water sources (e.g., deeper soil or water in weathered or fractured bedrock), we believe our sampling strategy provides a representative picture of vadose zone moisture from which the plants access most of their water.
We followed careful protocols to minimize evaporation in the field during sample collection. We placed soil samples in screw-top Wheaton glass vials (24-ml) immediately upon collection, sealed them with parafilm, placed them on dry ice in the field, and subsequently stored them in a freezer in a cold room until water was extracted for isotope analysis. Separate samples for soil water content (SWC) analysis were double-bagged in zip-top bags and stored in the shade to minimize evaporation. Samples were kept cool during transport back to the lab and analyzed for gravimetric SWC by progressively drying the samples in a 110°C oven within 3 days of collection (Supplementary Figures 1, 2).
In tandem with collecting soil samples, we collected mid-canopy woody stems for xylem water extraction from the 5 focal trees per species per site during each of the 2016 field visits (pre- and post-monsoon). We intensively sampled stems from one tree per species per site (3 stems separately analyzed per tree) to account for tree variability, and we pooled stems from the other trees (3 stems pooled per tree, yielding a single sample per tree) for a total of 103 and 113 pre- and post-monsoon stem samples, respectively. We removed bark and cambium from all stem samples during collection to minimize contamination by phloem sap. As with soil samples, we immediately placed the stems in screw-top Wheaton glass vials (24-ml), sealed them with parafilm, and kept the samples on dry ice in the field and frozen in the lab to prevent fractionation.
At each site, we complemented isotope sampling with measurements intended to characterize the site. These measurements included size characteristics of each focal tree (Supplementary Table 2) and predawn water potential (ΨPD). We measured the diameter of the main stem of each study tree using a calibrated diameter tape; diameter measurements were made at “breast height” (∼1.38 m) for aspen and at ground level for piñon and juniper. We measured tree height and canopy diameter using a laser range finder. For ΨPD, we collected 2–3 stems from each focal tree approximately 1 h before sunrise and kept the stems bagged in a cooler until making the ΨPD measurement. We measured ΨPD with a Scholander-type pressure chamber (PMS Instruments Model 600) within one hour of collection (Supplementary Figure 3).
2.2. Stable isotope sample preparation and analysis
We cryogenically extracted water from the stem and soil samples on a vacuum line following established methods (West et al., 2006). Recent studies have found that cryogenic water extraction from stems can introduce biases, complicating water sourcing studies (Chen et al., 2020). However, this is a valid method (Chen et al., 2020), and there is little indication that the biases are significant for natural abundance isotopes (Allen and Kirchner, 2022; Diao et al., 2022). Water extracted from piñon stems frequently contained organic compounds (as indicated by cloudiness) that would prevent analysis on the isotopic water analyzers. We removed the organics by adding activated charcoal to the extracted water and waiting until the water was clear before pipetting the water into a separate container (West et al., 2006).
We analyzed δD and δ18O in extracted water at Northern Arizona University’s stable isotope facility in 2016 using a Los Gatos Research (LGR) DLT-100 liquid water analyzer or a Picarro L2140-i triple isotope analyzer. Both analyzers report stable isotope values as “delta” (δ) values, which are the per mil (‰) difference in the ratio (R) of heavy (i.e., 18O or 2H [D]) to light (i.e., 16O or 1H) isotopes in a sample relative to a standard (i.e., δ = ([Rsample/Rstandard–1] × 1000). Isotope ratios in water are reported relative to ocean water, which has defined δ18O and δD values of 0‰.
We used the same calibration and drift standards for both the LGR and Picarro instruments during analysis. We calculated “stretching factors” (Sharp, 2007) using NAU lab standards, which spanned a range of values from −142.65 to 1.3‰ and −18.74 to −0.09‰ in δD and δ18O, respectively. NAU lab standards were calibrated to international standards on a DELTA plus XL mass spectrometer (Supplementary Table 3). We evaluated instrument drift on each isotopic water analyzer using both calibrated lab standards and deionized tap water (DI).
2.3. Isotope mixing model description
2.3.1. Soil isotope mixing model and end-members
To determine the contribution of monsoon precipitation to soil moisture at different depths, we modeled the post-monsoon soil δD and δ18O as a mixture of two end-members: pre-monsoon soil moisture (δ Pre) and monsoon precipitation (δ Ppt) isotope values. Since δD and δ18O are correlated in meteoric water (Craig, 1961), we assumed a bivariate normal distribution to describe the likelihood of the isotope data (e.g., Ogle et al., 2004; Cable et al., 2011; Young-Robertson et al., 2017). Thus, let represent the vector of observed δD and δ18O values for post-monsoon soil sample i, then:
where is the predicted vector of δD () and δ18O () associated with sample i. ΣPost is the 2 × 2 covariance matrix that quantifies the residual variances and covariances for δD and δ18O after accounting for variability captured by the mean model (see Eq. 2). ΣPost is allowed to vary by s(i) and d(i), which denote the 17 species-site combinations (s) and the three depth intervals (d) associated with each sample (i). A standard, relatively non-informative Wishart prior was assigned to the covariance matrices (i.e., each ) (e.g., Gelman et al., 2013).
The predicted post-monsoon soil isotope values were modeled as a mixture of the aforementioned δ Ppt and δ Pre end-members. Thus, for isotope j (j = 1 for δD, j = 2 for δ18O):
Post- and pre-monsoon soil isotope values were linked by the soil sample index i, while all sites and species shared the same monsoon precipitation end-member (). The proportional contribution of monsoon precipitation to post-monsoon soil water is defined by p, while 1-p is the relative contribution of pre-monsoon soil water to the post-monsoon soil water; both p and 1-p vary by species-site (s) and soil depth (d) associated with sample i. While we apply the mixing model in Eq. 2 to all three soil depths, we do not expect to obtain precise estimates for the contribution of monsoon precipitation to the shallow depth, due to the potential effects of evaporative enrichment between sampling campaigns. Thus, we focus on the contribution estimates for the intermediate and deep soil depths.
Across all sites and species, pre-monsoon soil isotope data (δPre) were missing for 8, 24, and 58% of the shallow, intermediate, and deep soil depths, respectively (see section “2.1. Field methods”). Thus, we implemented a simple model for δPre that allowed for imputation of these missing data. We assumed univariate normal likelihoods for the δD and δ18O pre-monsoon observations, but we explicitly modeled the mean δD values () as a linear function of the observed (or imputed when missing) δ18O based on a local meteoric water line with a slope and intercept associated with the site type (PJ or aspen) to account for the greater degree of evaporative enrichment observed at PJ sites:
The mean (μPre) in the likelihood for the δ18O data varied by s(i), indicating site-species s (for shallow soils) or site s (for intermediate or deep soils) associated with sample i.
Within the Bayesian framework, relatively non-informative uniform, normal, and gamma distribution priors were assigned to the mean δ18O values (), the site-level coefficients (bs and ms), and the precisions (1/σ2, with σ = or ), respectively. The imputed δ Pre values were modularized (Jackson et al., 2009; Liu et al., 2009; Lunn et al., 2009; Ogle and Barber, 2013) to avoid feedback from other data or model components, so that only the pre-monsoon data represented in Eq. 3 were used to inform the missing data (e.g., Ogle and Barber, 2013).
The remote sites we sampled had no permanent infrastructure, which precluded the possibility of collecting precipitation during monsoon 2016. Therefore, we relied on existing data to estimate the monsoon end-member, δPpt. We used 363 weekly measurements from the US Network of Isotopes in Precipitation (USNIP) (Welker, 2000, 2012; Vachon et al., 2010; Terzer-Wassmuth et al., 2021; Xia et al., 2022) from 1989 to 2012 for the monsoon season (July–August–September) from four sites in Arizona, New Mexico, and Colorado that occurred at similar elevations to the PJ (2,100 m) and aspen (3,100 m) sites in our study. In addition to USNIP data, we included 74 precipitation event measurements from two sites on the Navajo Nation taken from 2014 to 2016 (Tulley-Cordova et al., 2021). Previous studies have shown that isotopes in monsoon precipitation across the North American Monsoon domain are typically similar despite differences in site elevation due to sub-cloud processes in these convective systems (Tulley-Cordova et al., 2021). Further, we found that the isotopic composition of monsoon precipitation at each USNIP and Navajo Nation site varied within a similar range despite differences in elevation (Supplementary Figure 4). Globally, the isotopic composition of precipitation also varies by −0.6‰/degree latitude for δ18O. The range of isotope values represented by the data we used to calculate the monsoon end member exceeds this gradient, so we believe that calculating a single monsoon end member value, while not ideal, provides relatively accurate information. USNIP and Navajo Nation precipitation site locations are shown in Figure 1A along with sample locations.
Towards quantifying the monsoon end member (δ Ppt), we assumed a bivariate normal likelihood, similar to Eqn (1), for each paired observation of δD (j = 1) and δ18O (j = 2) such that for monsoon precipitation observations (Ppt_obs) m (m = 1, … 437):
The mean, δ Ppt, is the end-member used in the mixing model in Eq. 2, and ΣPpt is the 2 × 2 covariance matrix. Standard, relatively non-informative priors were assigned to δPpt (normal priors for each isotope) and ΣPpt (Wishart prior). As for the δPre end-member model, δPpt was modularized to ensure that only the USNIP and Navajo Nation precipitation data informed this end-member, while also propagating end-member uncertainty to the mixing model (Ogle et al., 2014; Tucker et al., 2014; Ogle and Pendall, 2015; Pegoraro et al., 2021). In particular, the stochastic end-member models (Eqs 3, 4) allow for propagation of end-member uncertainty due to sampling variability or variability in the isotopic composition of precipitation across space and time that is not explicitly accounted for in this model (see Supplementary Table 5).
The site-species level contributions of monsoon precipitation to post-monsoon soil water, ps,d in Eq. 2, were assigned a hierarchical prior based on a Beta distribution with species-level parameters:
Where k(s) denotes species k associated with site-species s, and d denotes the soil depth. Wide uniform, U(1,100), priors were assigned to the global parameters (i.e., each ak,d and bk,d). Based on the Beta distribution in Eq. 5, the expected contribution of monsoon precipitation to post-monsoon soil water for each species and soil depth is thus given by:
Estimates for Ep provided general insight into the relative importance of monsoon precipitation to soil moisture recharge under different tree species and at different soil depths.
2.3.2. Stem isotope mixing model
The stem isotope data were assigned a bivariate normal likelihood similar to Eq. 1, such that for each stem observation i:
All stem data, both pre- and post-monsoon, were modeled via Eq. 7. The mean or predicted stem isotope values are denoted by μiStem; the covariance matrix, ΣStem, is allowed to vary by s(i), denoting site-species associated with stem observation i, and by t(i), denoting time period t (pre- [Pre] vs post- [Post] monsoon) associated with observation i.
The mean stem isotope values are described via a linear mixing model, and we consider three soil water sources (shallow, intermediate, and deep soil water) and a fourth deeper source. That is, in addition to soil moisture that we were able to sample, trees in the region may have access to deeper moisture, which includes deeper soil moisture, perched aquifers, or water trapped in bedrock fractures (West et al., 2007a), which we collectively refer to as the “bedrock” end member. We assumed that this fourth water source has an isotopic value consistent with unevaporated precipitation based on the Local Meteoric Water Line (LMWL; we describe how we estimate this source below). Thus, for the stem mixing model, we have:
where T(i) indicates tree T associated with observation i, and thus denotes the proportional contribution of soil water from a given depth (d) to water uptake by tree T during time period t (pre- or post-monsoon) associated with observation i. is the δD (j = 1) or δ18O (j = 2) value for the soil source at time period t and depth d, linked to stem observation i. The deeper, bedrock source is denoted by depth d = 4, and is the bedrock δD or δ18O value for site s associated with stem sample i, s(i). That is, we assume that the isotopic composition of the bedrock source may vary among sites, but that it is relatively unchanged over the study period. We recognize that we are considering more sources than can be identified with two isotopes, thus we produce estimates for two different 3-source scenarios: (1) moderately shallow soil (sum contributions for d = 1 and d = 2), deep soil (d = 3), and bedrock (d = 4) and (2) shallow soil (d = 1), moderately deep soil (sum contributions for d = 2 and d = 3), and bedrock (d = 4).
Tree rooting distributions can be quite extensive (e.g., Schwinning et al., 2020), so while we sampled soil cores beneath the canopy of each study tree, it is likely that each tree accessed water well beyond its own “canopy area.” Thus, for the soil water sources that can vary among trees within a site (d = 1, 2, and 3), we model δSrc as a weighted average (similar to a mixture) of the “local” soil water source (based on soil isotopes measured beneath the canopy of the target tree) and the “site” level water source. Thus, δSrc in Eq. 8 is given by:
where qLocal is the relative importance of the local soil water source, and 1-qLocal is the relative importance of the site-level water source, for species-site s associated with stem observation i. Additionally, i*(i,d) denotes soil sample i* associated with stem sample i and soil depth d. The pre- and post-monsoon site-level soil isotope end-members are represented by and , which are computed by averaging the individual values (i.e., observed or imputed [when missing] and , see Eqs 3, 1, respectively) across all soil samples (i*) associated with each depth d and species-site s combination.
To describe the fourth, bedrock end-member, , we followed Benettin et al. (2018) and Allen et al. (2019) to construct evaporation curves based on seasonal temperature and humidity (PRISM Climate Group, 2016) at each site. We found the intersection between these evaporation curves and the LMWL. We used initial isotope values consistent with the deepest pre-monsoon soil moisture we measured at each site. This method allowed us to input a minimum and maximum δ18O value for the bedrock water source for each site (s). We accounted for uncertainty in the estimated bedrock values by sampling the bedrock δ18O end member, , from a uniform distribution with lower and upper bounds defined by the minimum and maximum values derived from the evaporation curve calculation (see Supplementary Table 5). The δD value for the bedrock end member was calculated from the meteoric water line:
To conclude the stem mixing model, we assigned hierarchical priors to the water source contributions associated with each tree (q in Eq. 8) and to the relative importance of local water soil water sources (qLocal in Eq. 9). We modeled each (Eq. 8) as coming from an overall (“population”) distribution with parameters that varied by time period t, species-site s (trees are nested in species-site), and depth d; the “population level” parameters were given relatively non-informative priors. Likewise, we modeled each as coming from an overall distribution with parameters that varied at the level of species (site-species combinations are nested in species), and the species-level parameters were given relatively non-informative priors. These hierarchical priors allowed for borrowing of strength (Ogle et al., 2018) among trees within a site (for q) and for sites within each species (qLocal); they also allowed us to compute the expected contribution of soil water from different depths for each species-site combination (e.g., ), and the expected importance of local soil water for different species (e.g., EqsLocal).
Finally, we computed the expected contribution of monsoon precipitation to tree water at the species-site level use during the post-monsoon period as:
where, again, is the expected contribution of soil water from depth d to tree water uptake for species-site s during the post-monsoon period, and ps,d (see Eqs 2, 5) is the contribution of monsoon precipitation to post-monsoon soil water at depth d for species-site s. As noted above, we summarized the relative contributions based on two 3-source scenarios, and we applied Eq. 11 to both scenarios, where one scenarios combines the shallow and intermediate depths (moderately shallow soil) and the other combines the intermediate and deep soil depths (moderately deep soil).
2.3.3. Model implementation
We implemented the Bayesian mixing models in OpenBUGS v. 3.2.3 rev 1012 (Lunn et al., 2009). We simulated three parallel Markov Chain Monte Carlo (MCMC) sequences, with each chain assigned widely dispersed initial values to ensure sufficient exploration of the parameter space. We used the cut function to control feedback and modularize model components as described in sections “2.3.1. Soil isotope mixing model and end-members” and “2.3.2. Stem isotope mixing model” (Jackson et al., 2009; Lunn et al., 2009; Ogle and Barber, 2013; Ogle and Pendall, 2015). We ran the model for 10,000 iterations until the chains converged, as determined by calculating the Gelman statistic (Gelman and Rubin, 1992). For all monitored parameters, the Gelman statistic was <1.11, indicating that the chains had converged.
2.4. Model fit
We evaluated model fit by calculating the coefficient of determination (R2) between measured and predicted isotope ratios (Figure 2). In general, model fit was better for δD (2A, C, E) than for δ18O (2B, D, F). Further, model fit was better for soil water (2A,B) than for stem water (Figures 2C–F). The model likely underpredicted high δ18O values due to the highly evaporative conditions across the region.
FIGURE 2
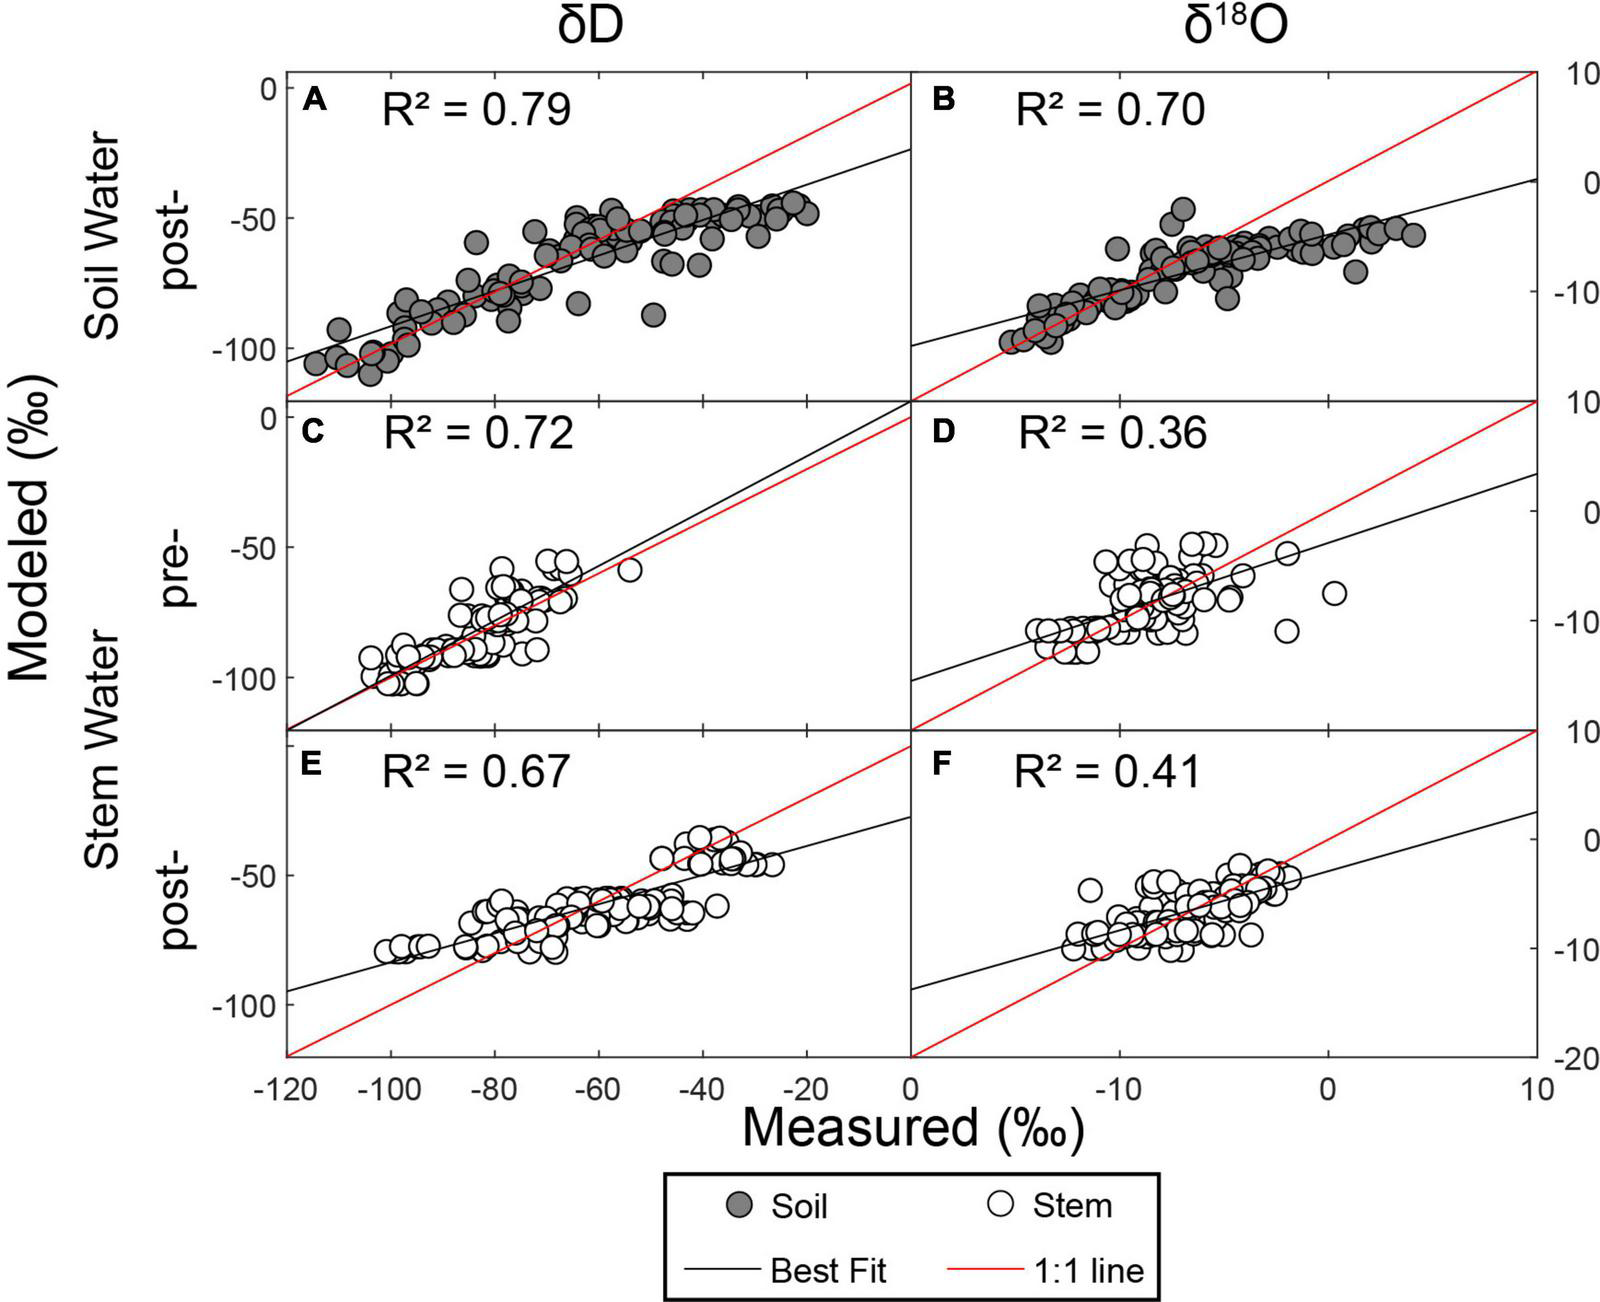
Measured vs. modeled isotope ratios for soil and stem water.
3. Results
3.1. Soil submodel
3.1.1. Site characteristics
We complemented isotope measurements with characterization of phenology, gravimetric soil water content (SWC), and predawn water potential (ΨPD) at each site. Sampled trees showed signs of new growth during the pre-monsoon sampling period. At aspen sites, all sampled trees were leafed out during both periods. At piñon-juniper sites, piñon trees had new needles and some trees were starting to produce pollen. The new growth at all site types suggests that the trees were actively transpiring during the pre-monsoon sampling period.
In general, prior to monsoon onset, SWC increased with increasing soil depth (Figure 3 and Supplementary Figures 1, 2). ΨPD provides a snapshot of water availability in the active root zone on the sampling days, and ΨPD was between −3 and −2 MPa for junipers and −2 and −1 MPa for piñon prior to the monsoon onset. Following the monsoon onset, SWC generally increased, especially in the shallowest soil depths. During both sampling periods, ΨPD was between −1 and −0.1 MPa at aspen sites, which is in a range expected for aspens across the region (Love et al., 2018). At PJ1, PJ2, AS4, AS5, and AS10, ΨPD was less negative during the post-monsoon sampling period. However, at some sites (PJ5, PJ8, PJ11, AS1, AS2, AS5, AS6), ΨPD was the same or more negative despite overall soil moisture increases (Supplementary Figure 3).
FIGURE 3
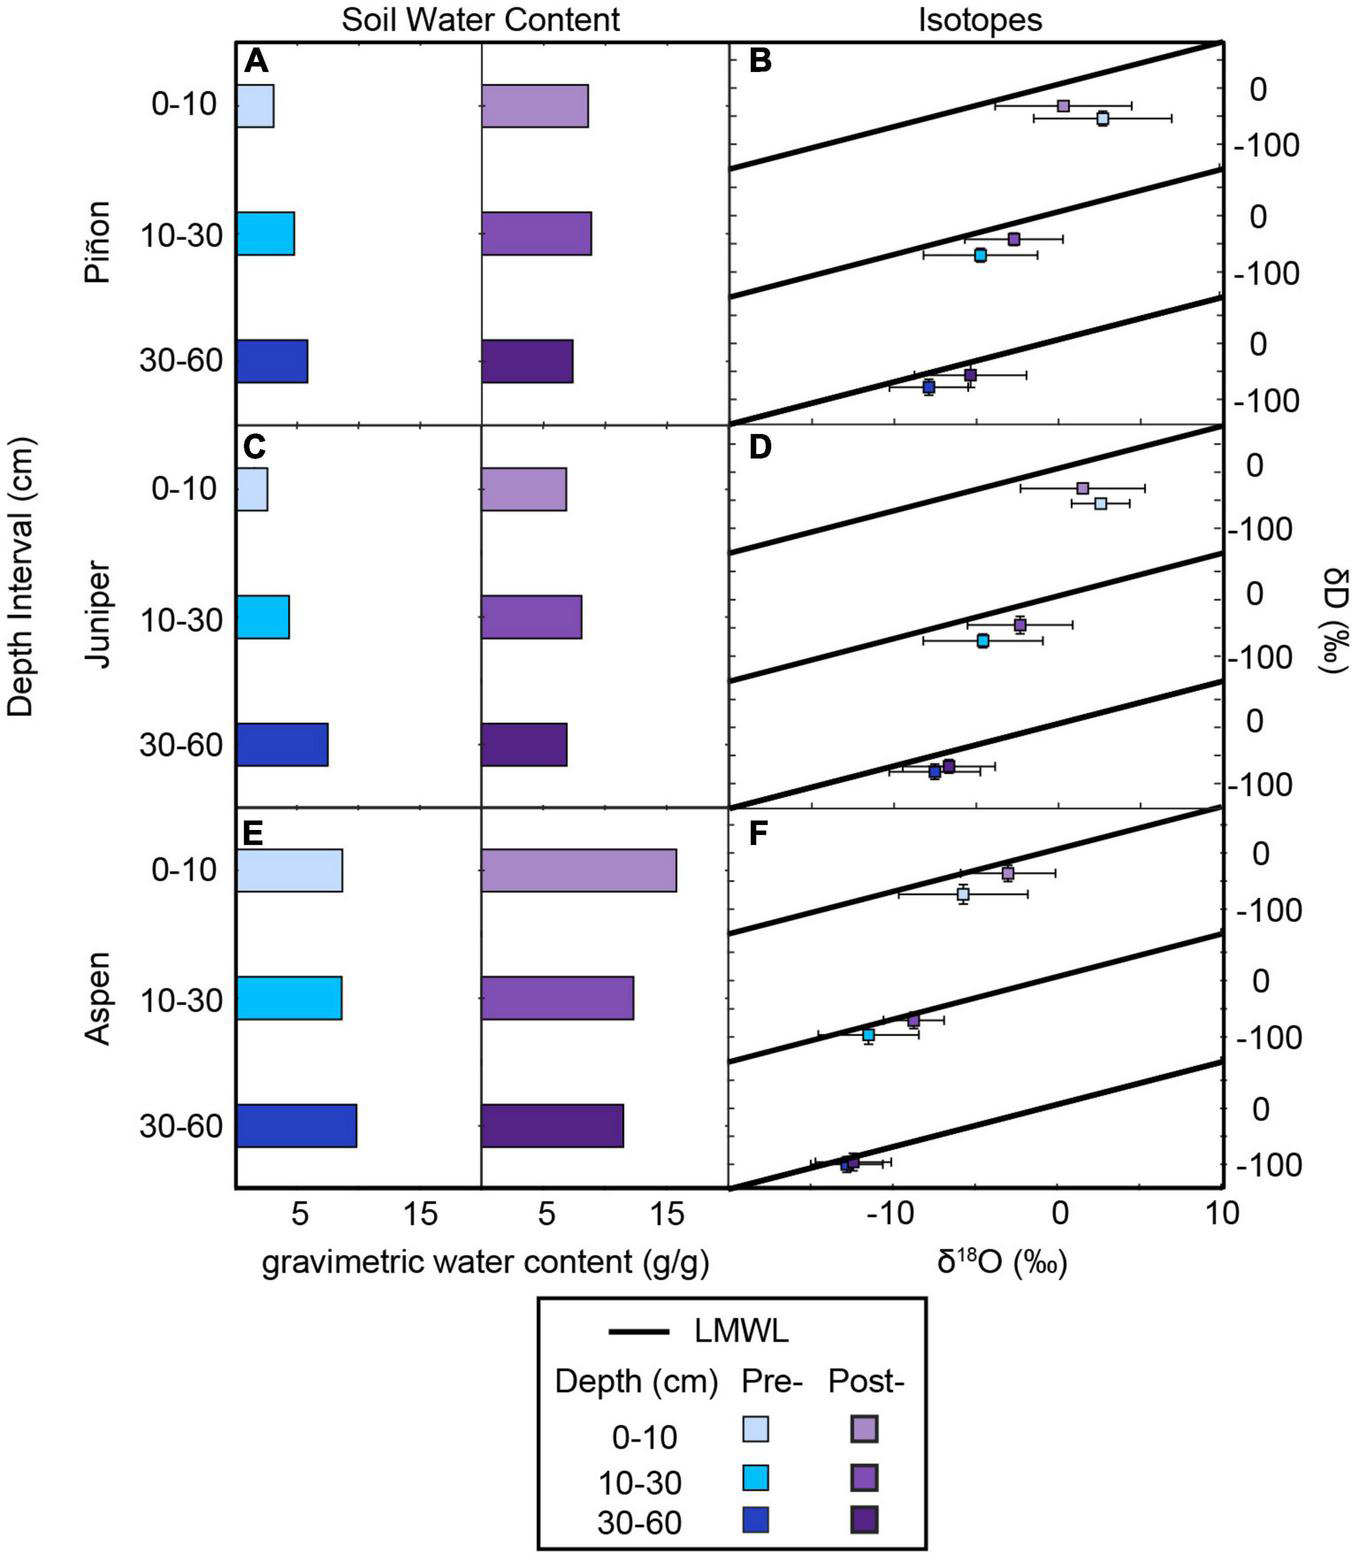
Average soil water content and isotope ratios for each species and depth interval. In general, soil water content increased from shallow to deep soil during the pre-monsoon sampling interval and was higher after the onset of the North American Monsoon (A,C,E). The isotopic composition of soil moisture (B,D,F) was typically higher during the post-monsoon sampling except for the shallowest soil depths at piñon-juniper sites where pre-monsoon soil moisture shows signs of evaporation.
3.1.2. Isotope results
We examined δD and δ18O in water extracted from stems and soil in relation to the Local Meteoric Water Line (LMWL), derived from USNIP data, which has a slope of 7.56 + 0.03. In general, the slope between δD and δ18O in pre-monsoon soil moisture (Figure 4 top row) is shallower (slope ranging from 2 to 3) than the LMWL for all site-species combinations, which is consistent with evaporation. Post-monsoon soil moisture (Figure 4 bottom row) continues to show signs of evaporation (slope ranging from 4 to 5), but the isotopes plot closer to the LMWL. δD and δ18O in water extracted from stems falls within the ranges of values found in soil, and we see little evidence that δD in the stems is fractionated relative to the soil due to cryogenic extraction (Chen et al., 2020).
FIGURE 4
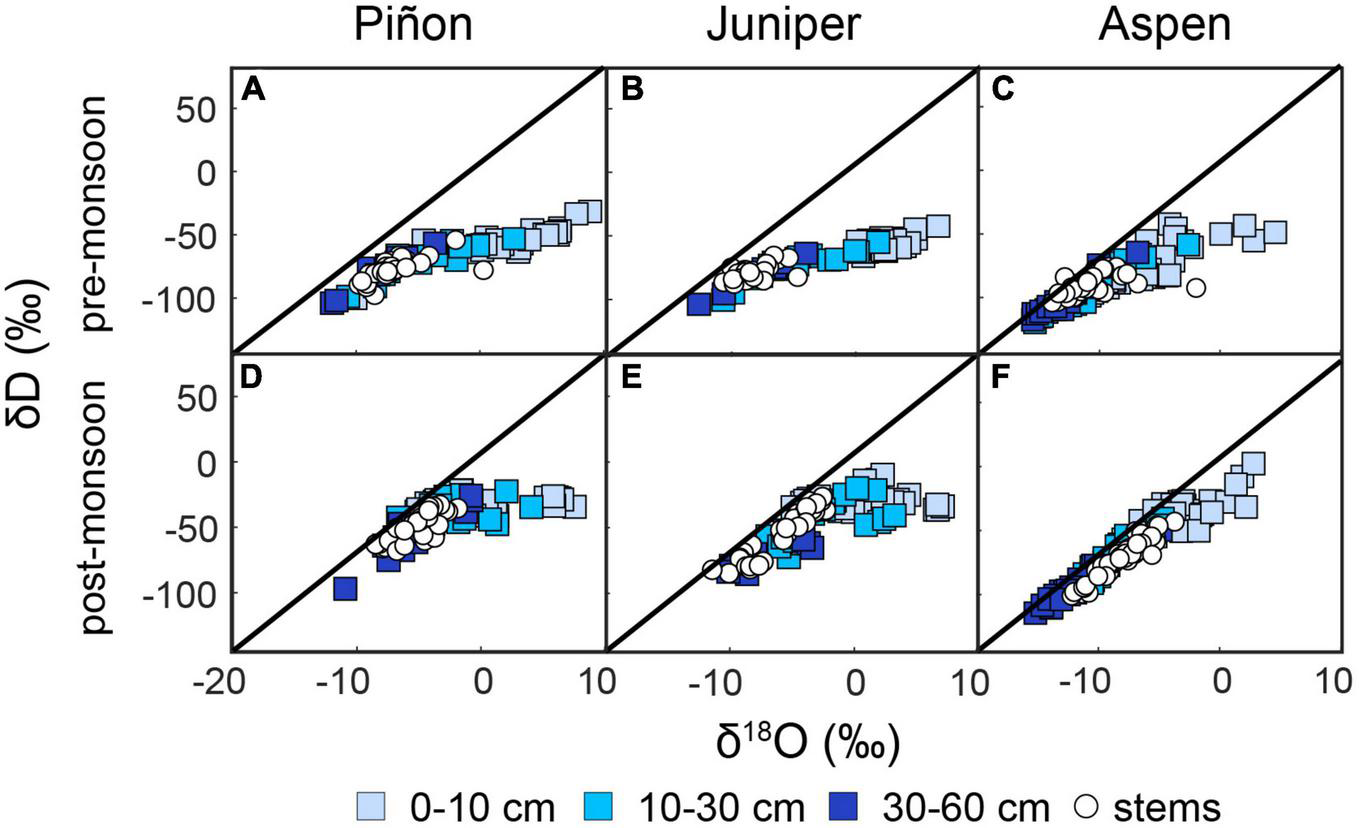
Measured δD and δ18O across all sites for the pre-monsoon (A–C) and post-monsoon (D–F) sampling periods. Soil water results are indicated by square symbols shaded by depth while stems are shown with white circles. The Local Meteoric Water Line (LMWL) is shown on all plots.
3.1.3. Monsoon contributions to soil moisture
We implemented a mixing model that estimated the amount of monsoon-derived soil moisture at each depth (i.e., as described by p in Eq. 2) based on the monsoon end member calculated from regional precipitation data (δ18O = −6.3‰, δD = −42.1‰). At PJ sites, monsoon precipitation comprised more than half of the soil moisture at intermediate depths and 18–60% of the deep soil moisture (Figures 5A, C). Estimated monsoon contribution was more variable for soil water under piñons than junipers. At aspen sites, monsoon precipitation comprised 26–69% of the intermediate and 6–10% of deep soil moisture. To use these results to estimate the contribution of soil moisture to stem water, we assumed 100% monsoon-derived moisture in shallow soil after the onset of the monsoon. This assumption is consistent with previous studies that have found that residual soil moisture at a broad range of ecosystems and elevations across the region is dependent on rainfall inputs rather than winter precipitation in the summer (Koehn et al., 2021), relatively dry conditions between the pre-monsoon sampling and the onset of the 2016 monsoon (PRISM Climate Group, 2016), higher soil moisture in the shallowest soil depths in the post-monsoon sampling (Figure 3). We further expect soil moisture memory from winter to summer to be low in shallow soils at these sites because the soils have a relatively high percentage of sand coupled with a low concentration of organic carbon (Hengl et al., 2014; Martínez-Fernandez et al., 2021; Walkinshaw et al., 2022).
FIGURE 5
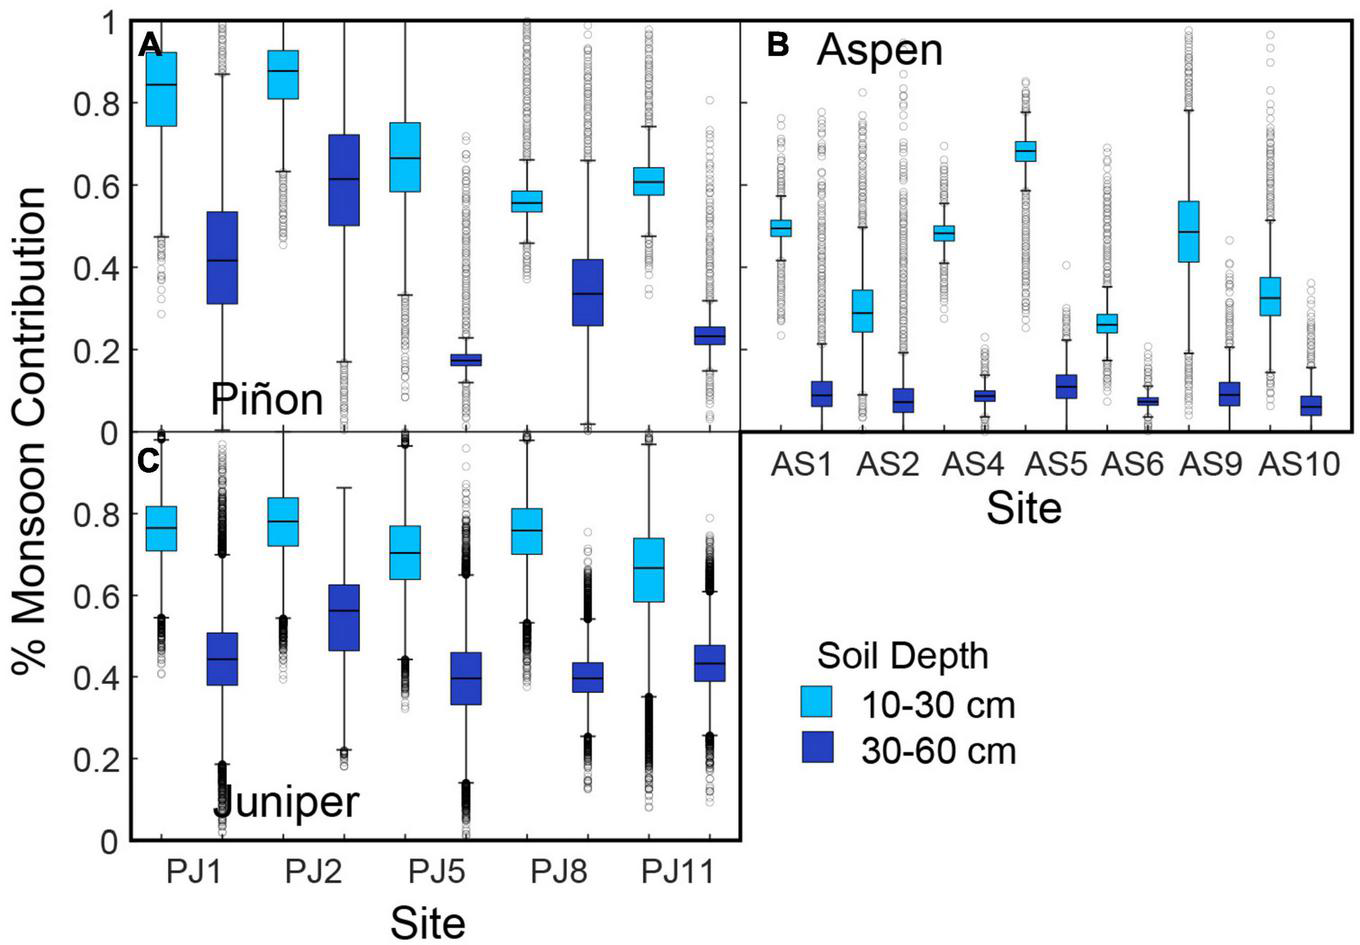
Estimated contribution of monsoon precipitation (%) to post-monsoon soil moisture at intermediate (10–30 cm) and deep (30–60 cm) depths for (A) piñon, (B) aspen, and (C) juniper.
3.2. Stem submodel
The stem isotope mixing model estimated contributions of soil water from three depth intervals: shallow soil moisture (0–10 cm), combined intermediate and deep soil moisture (10–60 cm), and from a deep source (“bedrock”) that we characterized based on the evaporation line we calculated for each site. This approach provides insight into plant water use during the pre- and post-monsoon sampling trips (i.e., as described by q in Eq. 8). We also calculated the change in contribution from each depth following the onset of monsoon precipitation and the local ( in Eq. 9) versus site-level contribution of the three end members for each species. For all species, was low (median values of 0.06, 0.11, and 0.07 for aspen, juniper, and piñon, respectively), indicating that site-level moisture was more significant than local (tree-level) for all species.
Prior to the onset of the monsoon, approximately 12–15% of the water extracted from piñon, juniper, and aspen stems had an isotopic signature consistent with shallow soil moisture. The three species relied primarily on combined intermediate and deep soil moisture (57, 60, and 71% for juniper, piñons, and aspens, respectively). The bedrock end member provided approximately 26–27% of the moisture extracted from piñon and juniper stems and 17% of water extracted from pre-monsoon aspen stems (Figure 6A).
FIGURE 6
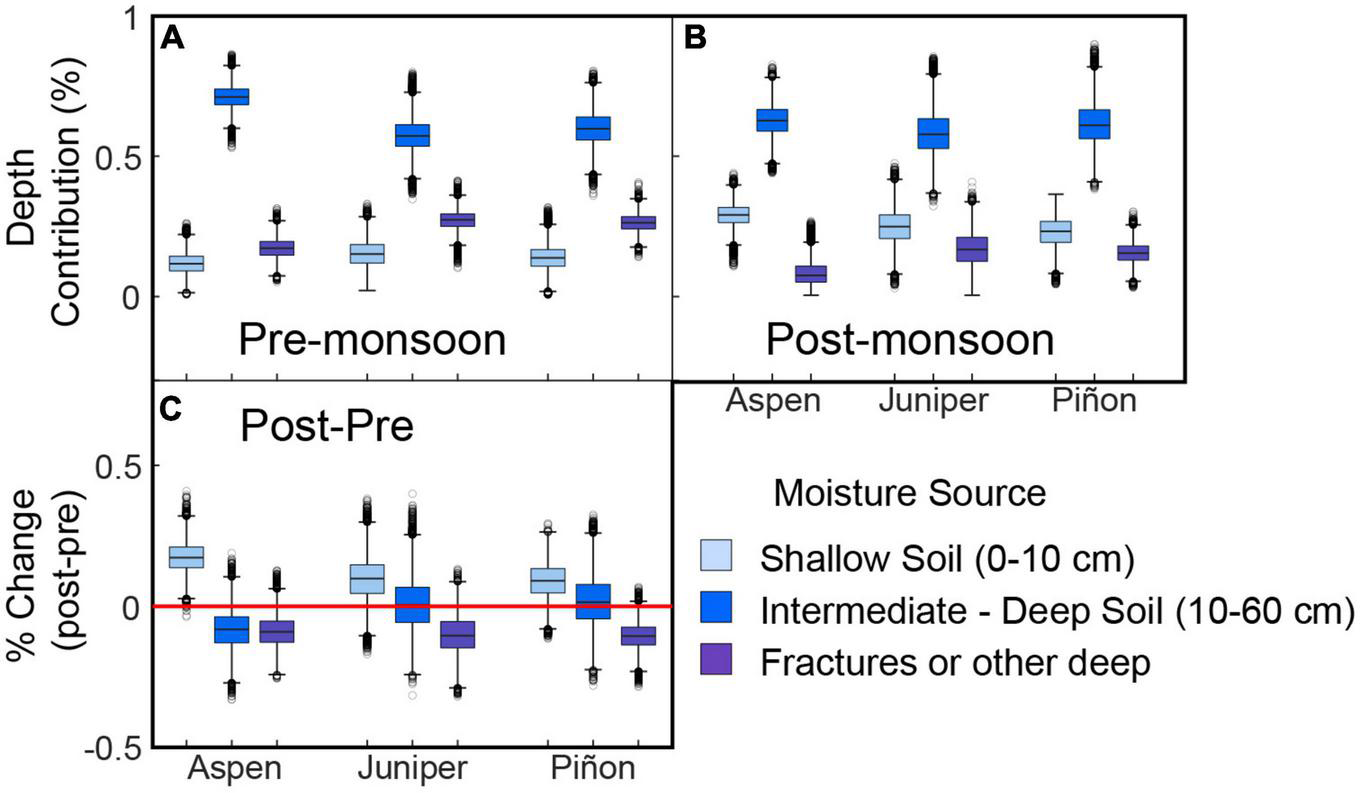
Estimates of stem water depth sources for each species (A) prior to monsoon onset and (B) during post-monsoon sampling along with (C) the difference in contributions from each depth. The red line in panel (C) indicates no significant change between pre- and post-monsoon sampling.
Isotopic analysis of stem water from post-monsoon samples suggested that all species changed the depths from which they sourced water to varying degrees, although all species continued to rely primarily on intermediate to deep soil moisture (Figure 6B). However, piñons and junipers across the region increased their reliance on shallow soil moisture by 9-10% while aspens increased their reliance on shallow soil moisture by ∼17% (Figure 6C). Aspens decreased their reliance on both intermediate to deep soil moisture and on the bedrock source by 8–9%. While piñons and junipers decreased their reliance on the bedrock source by around 10%, there was no change in the relative contribution of intermediate to deep soil moisture to tree water (Figure 6C).
The soil model estimates of the relative contribution of monsoon precipitation at each depth at the species level (i.e., Ep in Eq. 6). This allows us to estimate the contribution of monsoon precipitation to plant water sources for the species sampled across the region (i.e., Eq in Eq. 11; Figure 7). Monsoon moisture contributed up to 70% of intermediate to deep soil moisture (see section “3.1.3. Monsoon contributions to soil moisture”), so the monsoon contributed a significant amount of moisture to stem water despite the relatively small shifts to shallower sources. At the PJ sites, monsoon moisture comprised 40–57% of the water extracted from both piñon and juniper stems (Figures 7A, C). Monsoon contributions to aspen stem water were more variable, ranging from 24 to 45% across the region (Figure 7B).
FIGURE 7
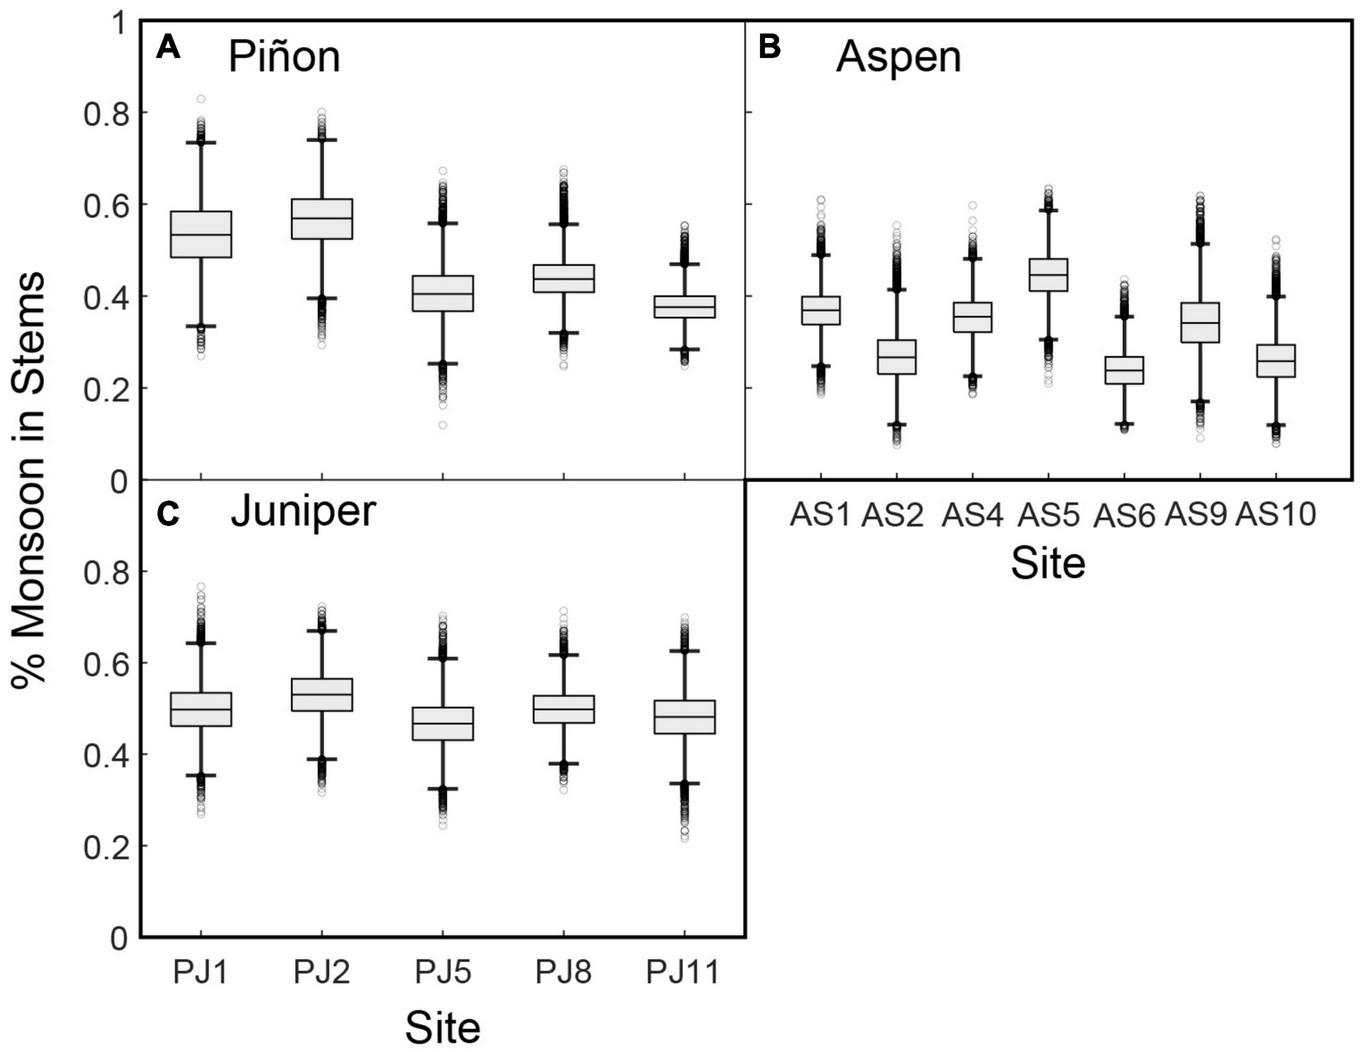
Estimates of the percent of water with isotopic compositions consistent with monsoon moisture extracted from (A) piñon, (B) aspen, and (C) juniper stems across the region.
4. Discussion
The North American Monsoon contributes precipitation that is critical to soil moisture budgets across the Southwest. Monsoon precipitation across the Southwest provides an immediate relief for trees from drought conditions and exerts an important control on tree growth in subsequent years (Peltier and Ogle, 2019). Further, studies have found that extreme droughts in the Southwest have frequently involved the coincident failures of winter and summer precipitation (Griffin et al., 2013). We found that the monsoon increased soil moisture (Figure 3 and Supplementary Figures 1, 2) across the study area and that the three foundation tree species (aspen, juniper, and piñon) in the study accessed monsoon-derived soil moisture. This is consistent with studies that have found that monsoon precipitation reaches depths significant for plants in the Four Corners region of the Southwest (Tulley-Cordova et al., 2021). This result also suggests shifts in the timing and magnitude of the North American Monsoon will have meaningful impacts on forested ecosystems throughout the Southwest. Indeed, we have already observed unprecedented mortality events in species across the Southwest during periods of low precipitation, including recent mortality of juniper species coincident with failed monsoons of 2019 and 2020 (Kannenberg et al., 2021). As climate changes, understanding tree water sources and how those water sources change can provide insights into how forests are responding to variations in seasonal precipitation and their potential sensitivity or responses to projected changes in winter and monsoonal precipitation (Seager et al., 2007; Pascale et al., 2017; Wang et al., 2020).
4.1. Monsoon contributions to soil moisture
Our first objective was to identify the extent to which monsoon precipitation contributes to intermediate and deep soil moisture across the region. We found that monsoon precipitation contributed to soil moisture at some PJ and aspen sites to depths of at least 60 cm. At select PJ sites (PJ1 and PJ2) and aspen sites (AS4, AS5, and AS10) higher proportions of monsoon moisture in intermediate to deep soil moisture is consistent with increased gravimetric soil moisture (Supplementary Figures 1, 2) and more positive ΨPD (i.e., more water available in the active root zone; Supplementary Figure 3) in the post-monsoon sampling period. At other sites, though, isotopes and mixing model output provide unique insights into changing water dynamics at these remote sites over the course of the growing season. At PJ5, PJ11, AS1, AS2, and AS9 the soil submodel of the mixing model suggests a greater contribution of monsoon moisture to intermediate depths than small increases in gravimetric soil moisture and more negative ΨPD indicate (Figure 5 and Supplementary Figures 1–3).
The shallowest soil depths in our study were subject to evaporation, so it was difficult to attribute soil moisture in the 0–10 cm depth directly to the monsoon based on isotopic composition. However, shallow soil moisture generally increased by up to 20% between the pre- and post-monsoon sampling trips at most sites, indicating the importance of monsoon precipitation for shallow soil moisture (Figure 3 and Supplementary Figures 1, 2). There were two sites where shallow soil moisture decreased between sampling trips: PJ8 (Supplementary Figure 1) and AS6 (Supplementary Figure 2). At both of these sites, 2016 precipitation was below the 30-year (1980–2010) average between sampling trips based on gridded climate data, and there was little to no precipitation the week prior to the post-monsoon sampling (PRISM Climate Group, 2016), so recharge was minimal immediately before we sampled.
4.2. Growing season water source depths
Our second goal was to determine the degree to which plants shift to rely on shallower water sources following the onset of the monsoon. Trees across the region rely primarily on intermediate to deep soil moisture prior to monsoon onset. At PJ sites, both piñon and juniper trees also rely on moisture from greater depths than we were able to sample, which is consistent with previous observations that both species access water trapped in fractures in bedrock underlying relatively shallow soil (West et al., 2007a). Although we do not have sap flux or eddy covariance data to quantify photosynthesis and transpiration during the pre-monsoon period at these remote sites, the trees we sampled had signs of activity (e.g., green leaves on aspens and new needles on piñons), suggesting that deep moisture is critical for growth in early summer.
All trees continued to rely primarily on intermediate to deep soil moisture following the monsoon. Although intermediate to deep soil moisture provided a consistent source of water to all trees, each species consistently increased their reliance on shallow soil moisture regardless of location along the monsoon precipitation gradient. Aspens increased their reliance on shallow soil moisture while decreasing the proportion of water they derived from deeper moisture. Previous studies have found little plasticity in water source over a growing season (Anderegg et al., 2013), but our approach, which allows us to identify relative shifts in moisture sources, allows us to identify these minor shifts. It does not allow us to infer the total amount of water plants extract from each depth, however. It is possible that the total amount extracted from deeper intervals remained similar to pre-monsoon, but increased water content in shallow soils likely led to higher water uptake and greater relative contribution. The sampled aspen trees’ continued reliance on intermediate to deep soil moisture following the monsoon onset is consistent with studies that have shown that growing season precipitation alone is insufficient to sustain growth (Love et al., 2018). Different sampling strategies, which included sampling later in the growing season, may also have contributed to the greater plasticity we observed in aspen water sources.
Lower elevation sites are drier than aspen sites but receive a greater proportion of precipitation during the monsoon season. Previous studies have found that piñon trees shift to shallow soil moisture more readily than coexisting junipers (Williams and Ehleringer, 2000; West et al., 2007a,b, 2008). However, we found that both species accessed similar proportions of shallow soil moisture while decreasing their reliance on water held at depths greater than 60 cm (Figure 6). Utah junipers have dynamic root systems that are long-lived but also adjust to soil moisture inputs and reach further into canopy gaps than piñons, allowing them to extract water from the most favorable depths throughout the growing season (Peek et al., 2006; Schwinning et al., 2020). This relatively rapid adjustment to moisture inputs may have allowed the junipers in our study area to extract water from shallower soil intervals following rain events.
The smaller shift in piñon water sources may reflect changing conditions in the region that could affect the ability to develop and maintain the shallow roots necessary to take advantage of shallow soil moisture recharge following rain events. Shallow root development in piñons relies on antecedent soil moisture (Plaut et al., 2012), and studies that focus on other conifer species have found that enhanced use of monsoon moisture followed wet winters, which increased storage of summer rains in the root zone (Berkelhammer et al., 2020). Further, high soil temperatures may inhibit shallow root development in piñn (Williams and Ehleringer, 2000). Since the early 2000s, the Southwest has become hotter and drier, with global change style drought and aridification characterizing the 21st century (e.g., Overpeck and Udall, 2020; Williams et al., 2020, 2022). This shift to hotter and drier conditions may have led to conditions unfavorable for shallow root development in piñon trees across the region, contributing to the difference between our results and results from earlier studies.
4.3. Monsoon water use by trees
Although trees continued to rely primarily on intermediate to deep soil moisture after the onset of the monsoon, up to 50% of the water extracted from stems had an isotopic composition consistent with the monsoon end member (objective 3; Figure 7). The relatively high monsoon moisture content in the stems can be attributed to soil moisture recharge to intermediate and deep soil moisture rather than to major shifts to shallower soil moisture after the monsoon onset. Although the soil moisture increase following monsoon onset is apparent in increased gravimetric soil moisture content and more positive ΨPD at some of these remote sites (Supplementary Figures 1–3), the importance of monsoon moisture at other sites would be masked without isotope data and a mixing model that integrates soil and stem moisture. For example, soil moisture decreased at all depths at site AS6, and there was no change in ΨPD between the two sampling events. Although soil moisture decreased, gridded climate data indicates that ∼78 mm of rain fell between the two sampling events (PRISM Climate Group, 2016). The model estimates that monsoon moisture contributed to soil moisture at this site even though overall water content decreased.
Our study had the advantage of providing an overview of trees across a broad region that is generally remote and difficult to access. However, there are limitations to our approach and important questions remain unanswered. The main limitation is that, despite the spatial coverage across this rugged region, our study provides only two snapshots in time of the isotopic composition of water in stems. While greater understanding of patterns in shallow root development and water uptake may require more intensive data collection within a growing season and across years, this study nevertheless highlights the importance of monsoon precipitation for water use by three dominant tree species across the Colorado Plateau.
5. Conclusion
Our study suggests that winter precipitation provides water for trees early in the growing season, but monsoon precipitation contributes significantly to soil moisture and serves as an important water source for trees across the Southwest later in the growing season. During the 2015–2016 water year, monsoon precipitation substantially increased soil moisture to depths of at least 60 cm in piñon-juniper woodlands and high-elevation aspen sites. All species shifted to increased reliance on shallow soil moisture following the onset of the monsoon, with less of a shift in piñons than previously documented. Regardless of whether the trees shifted source depths, monsoon precipitation comprised 24–58% of water extracted from aspen, piñon, and juniper stems. We expected piñons to respond more readily to monsoon moisture than junipers, but we found comparable shifts to monsoon moisture in both species.
Although the winter precipitation isotopic composition is often preserved in cellulose in Southwest trees (Kerhoulas et al., 2013, 2017; Berkelhammer et al., 2020), monsoon precipitation provided a significant moisture source for aspens, junipers, and piñons across the study area. Unfortunately, like winter precipitation, monsoon precipitation is becoming increasingly variable as climate changes. During the 21st century, the timing and strength of the monsoon have changed (Grantz et al., 2007; Prein et al., 2016, 2022), and the monsoon is projected to weaken as climate continues to change (Pascale et al., 2017; Wang et al., 2020). In fact, recent monsoon failures have contributed to the worst drought conditions in 1200 years (Williams et al., 2022). Our results suggest that increased variability in monsoon precipitation and a general weakening of the North American Monsoon will have a detrimental impact on trees across the Southwest, with continued drought-related mortality and dieback (e.g., Allen et al., 2015; Anderegg et al., 2019; Kannenberg et al., 2021).
Statements
Data availability statement
Model code and data are available through Zenodo (https://doi.org/10.5281/zenodo.7734469). Complementary data are available in the Supplementary material. Further inquiries can be directed to the corresponding author.
Author contributions
KS-C led the lab work and analysis, collected field data, wrote the first draft of the manuscript, and worked with KO to develop the isotope model. JG contributed to the isotope mixing model. JG, DP, and YL collected field data. JW provided USNIP data. JS helped identify sites based on existing sites in the FIA network. KO, WA, GK, CS, ML, and JS conceived the large-scale field study of which this was a part. All authors commented on the manuscript and approved the final version before submission.
Funding
Funding for all field work, stable isotope analysis, and initial model development was provided by NSF Division of Environmental Biology, RAPID #1643245. Funding for further model development was provided by NSF Hydrologic Sciences award EAR1834699.
Acknowledgments
We thank the several people assisted with sample collection and analysis, including Jamie Brown, Phiyen Nguyen, Hannah Russell, Linnea Gear, Aradhana Roberts, Joshua Sally, Zane Koch, Abigail Collier, Michael Fell, Abraham Cadmus, and many others. We thank the U.S. Forest Service Forest Inventory and Analysis (FIA) program for permission to conduct research on FIA plots though all destructive sampling for this study was conducted in nearby forested stands with similarities to the FIA plots. We also thank the two reviewers whose comments improved the manuscript greatly.
Conflict of interest
The authors declare that the research was conducted in the absence of any commercial or financial relationships that could be construed as a potential conflict of interest.
Publisher’s note
All claims expressed in this article are solely those of the authors and do not necessarily represent those of their affiliated organizations, or those of the publisher, the editors and the reviewers. Any product that may be evaluated in this article, or claim that may be made by its manufacturer, is not guaranteed or endorsed by the publisher.
Supplementary material
The Supplementary Material for this article can be found online at: https://www.frontiersin.org/articles/10.3389/ffgc.2023.1116786/full#supplementary-material
References
1
Ahlström A. Raupach M. Schurgers G. Smith B. Arneth A. Jung M. et al (2015). Carbon cycle. The dominant role of semi-arid ecosystems in the trend and variability of the land CO2 sink.Science348895–899. 10.1126/science.aaa1668
2
Allen C. Breshears D. McDowell N. (2015). On underestimation of global vulnerability to tree mortality and forest die-off from hotter drought in the anthropocene.Ecosphere61–55. 10.1890/ES15-00203.1
3
Allen C. Macalady A. Chenchouni H. Bachelet D. McDowell N. Vennetier M. et al (2010). A global overview of drought and heat-induced tree mortality reveals emerging climate change risks for forests.For. Ecol. Manage.259660–684. 10.1016/j.foreco.2009.09.001
4
Allen S. T. Kirchner J. W. Braun S. Siegwolf R. T. W. Goldsmith G. R. (2019). Seasonal origins of soil water used by trees.Hydrol. Earth Syst. Sci.231199–1210. 10.5194/hess-23-1199-2019
5
Allen S. Kirchner J. (2022). Potential effects of cryogenic extraction biases on plant water source partitioning inferred from xylem-water isotope ratios.Hydrol. Process.361–6. 10.1002/hyp.14483
6
Anderegg L. Anderegg W. Abatzoglou J. Hausladen A. Berry J. (2013). Drought characteristics’ role in widespread aspen forest mortality across Colorado, USA.Glob. Chang. Biol.191526–1537. 10.1111/gcb.12146
7
Anderegg W. Anderegg L. Huang C. (2019). Testing early warning metrics for drought-induced tree physiological stress and mortality.Glob. Chang. Biol.252459–2469. 10.1111/gcb.14655
8
Barnes M. Biederman J. Farella M. Russell L. Moore D. J. P. Ponce-Campos G. E. et al (2021). Improved dryland carbon flux predictions with explicit consideration of water-carbon coupling.Commun. Earth Environ.21–9. 10.1038/s43247-021-00308-2
9
Benettin P. Volkmann T. von Freyberg J. Frentress J. Penna D. Dawson T. et al (2018). Effects of climatic seasonality on the isotopic composition of evaporating soil waters.Hydrol. Earth Syst. Sci.222881–2890. 10.5194/hess-22-2881-2018
10
Berkelhammer M. Still C. J. Ritter F. Winnick M. Anderson L. Carroll R. et al (2020). Persistence and plasticity in conifer water-use strategies.J. Geophys. Res. Biogeosci.1251–20. 10.1016/j.plantsci.2015.02.012
11
Biederman J. Scott R. Goulden M. Vargas R. Litvak M. Kolb T. et al (2016). Terrestrial carbon balance in a drier world: The effects of water availability in southwesternNorth America.Glob. Chang. Biol.221867–1879. 10.1111/gcb.13222
12
Bradford J. Schlaepfer D. Lauenroth W. Palmquist K. (2020). Robust ecological rought projections for drylands in the 21st century.Glob. Chang. Biol.263906–3919. 10.1111/gcb.15075
13
Breshears D. Cobb N. Rich P. Price K. Allen C. Balice R. et al (2005). Regional vegetation die-off in response to global-change-type drought.Proc. Natl. Acad. Sci. U.S.A.10215144–15148. 10.1073/pnas.0505734102
14
Cable J. Ogle K. Williams D. (2011). Contribution of glacier meltwater to streamflow in the wind river range, wyoming, inferred via a Bayesian mixing model applied to isotopic measurements.Hydrol. Process.252228–2236. 10.1002/hyp.7982
15
Campbell M. Dennison P. Tune J. Kannenberg S. A. Kerrd K. L. Codding B. F. et al (2020). A multi-sensor, multi-scale approach to mapping tree mortality in woodland ecosystems.Remote Sens Environ.245:111853. 10.1016/j.rse.2020.111853
16
Chen Y. Helliker B. Tang X. Li F. Zhou Y. Song X. (2020). Stem water cryogenic extraction biases estimation in deuterium isotope composition of plant source water.Proc. Natl. Acad. Sci. U.S.A.11733345–33350. 10.1073/pnas.2014422117
17
Craig H. (1961). Isotopic variations in meteoric waters.Science1331702–1703. 10.1126/science.133.3465.1702
18
Diao H. Schuler P. Goldsmith G. Siegwolf R. T. W. Saurer M. Lehmann M. M. (2022). On uncertainties in plant water isotopic composition following extraction by cryogenic vacuum distillation.Hydrol. Earth Syst. Sci. Discuss.26, 5835–5847. 10.5194/hess-26-5835-2022
19
Garcia-Forner N. Adams H. Sevanto S. Collins A. Dickman L. Hudson P. et al (2016). Responses of two semiarid conifer tree species to reduced precipitation and warming reveal new perspectives for stomatal regulation.Plant Cell Environ.3938–49. 10.1111/pce.12588
20
Gelman A. Rubin D. (1992). Inference from iterative simulation using multiple sequences.Stat. Sci.7457–511. 10.1214/ss/1177011136
21
Gelman A. Carlin J. Stern H. Dunson D. B. Vehtari A. Rubin D. B. (2013). Bayesian Data Analysis.Boca Raton, FL: CRC Press. 10.1201/b16018
22
Grantz K. Rajagopalan B. Clark M. Zagona E. (2007). Seasonal shifts in the North American monsoon.J. Clim.201923–1935. 10.1175/JCLI4091.1
23
Griffin D. Woodhouse C. A. Meko D. M. Stahle D. W. Faulstich H. L. Carrillo C. et al (2013). North American monsoon precipitation reconstructed from tree-ring latewood. Geophys. Res. Lett. 40, 954–958. 10.1002/grl.50184
24
Guo J. Hungate B. Kolb T. Koch G. (2018). Water source niche overlap increases with site moisture availability in woody perennials.Plant Ecol.219719–735. 10.1007/s11258-018-0829-z
25
Hammond W. Williams A. Abatzoglou J. Adams H. Klein T. López R. et al (2022). Global field observations of tree die-off reveal hotter-drought fingerprint for Earth’s forests.Nat. Commun.13:1761. 10.1038/s41467-022-29289-2
26
Hansen M. Potapov P. Moore R. Hancher M. Turubanova S. Tyukavina A. et al (2013). High-resolution global maps of 21st-century forest cover change.Science342850–853. 10.1126/science.1244693
27
Hengl T. de Jesus J. MacMillan R. Batjes N. Heuvelink G. Ribeiro E. et al (2014). SoilGrids1km–global soil information based on automated mapping.PLoS One9:e105992. 10.1371/journal.pone.0105992
28
Higgins R. W. Yao Y. Wang X. L. (1997). Influence of the North American Monsoon system on the U.S. summer precipitation.J. Clim.102600–2622. 10.1175/1520-0442(1997)010<2600:IOTNAM>2.0.CO;2
29
Hoell A. Quan X. Hoerling M. Fu R. Mankin J. Simpson I. et al (2022). Record low North American monsoon rainfall in 2020 reignites drought over the American southwest.Bull. Am. Meteorol. Soc.103S26–S32. 10.1175/BAMS-D-21-0129.1
30
Jackson C. Best N. Richardson S. (2009). Bayesian graphical models for regression on multiple data sets with different variables.Biostatistics10335–351. 10.1093/biostatistics/kxn041
31
Jones S. Gutzler D. (2016). Spatial and seasonal variations in aridification across Southwest North America.J. Clim.294637–4649. 10.1175/JCLI-D-14-00852.1
32
Jorgensen W. (2005). Soil Survey of Coconino County Area, Arizona, North Kaibab Part.Phoenix, AZ: United States Department of Agriculture Natural Resources Conservation Service.
33
Kannenberg S. Driscoll A. Malesky D. Anderegg W. (2021). Rapid and surprising dieback of Utah juniper in the southwestern USA due to acute drought stress.For. Ecol. Manage.480:118639. 10.1016/j.foreco.2020.118639
34
Kannenberg S. Novick K. Alexander M. Maxwell J. Moore D. Phillips R. et al (2019). Linking drought legacy effects across scales: From leaves to tree rings to ecosystems.Glob. Chang. Biol.252978–2992. 10.1111/gcb.14710
35
Kerhoulas L. Kolb T. Koch G. (2013). Forest Ecology and management tree size, stand density, and the source of water used across seasons by ponderosa pine in northern Arizona.For. Ecol. Manage.289425–433. 10.1016/j.foreco.2012.10.036
36
Kerhoulas L. Kolb T. Koch G. (2017). The influence of monsoon climate on latewood growth of southwestern ponderosa pine.Forests8:140. 10.3390/f8050140
37
Koehn C. R. Petrie M. D. Bradford J. B. Litvak M.E. Strachan S. (2021). Seasonal precipitation and soil moisture relationships across forests and woodlands in the Southwestern United States.J. Geophys. Res. Biogeosci.126:24. 10.1016/j.scitotenv.2022.155155
38
Limousin J. Bickford C. Dickman L. Pangle R. Hudson P. Boutz A. et al (2013). Regulation and acclimation of leaf gas exchange in a piñon-juniper woodland exposed to three different precipitation regimes.Plant Cell Environ.361812–1825. 10.1111/pce.12089
39
Liu F. Bayarri M. J. Berger J. O. (2009). Modularization in Bayesian analysis, with emphasis on analysis of computer models.Bayesian Anal.4119–50. 10.1109/IEMBS.2008.4649840
40
Loik M. Breshears D. Lauenroth W. Belnap J. (2004). A multi-scale perspective of water pulses in dryland ecosystems: Climatology and ecohydrology of the western USA.Oecologia141269–281. 10.1007/s00442-004-1570-y
41
Love D. Venturas M. Sperry J. Brooks P. D. Pettit J. L. Wang Y. et al (2018). Dependence of Aspen stands on a subsurface water subsidy?: Implications for climate change impacts water resources research.Water Resour. Res.551833–1848. 10.1029/2018WR023468
42
Lunn D. Best N. Spiegelhalter D. Graham G. Neuenschwander B. (2009). Combining MCMC with ‘sequential’ PKPD modelling.J. Pharmacokinet. Pharmacodyn.3619–38. 10.1007/s10928-008-9109-1
43
Mankin J. S. Simpson I. Hoell A. Fu R. Lisonbee J. Sheffield A. et al (2021). Noaa Drought Task Force Report on the 2020 – 2021 Southwestern U.S. Drought.NOAA Drought Task Force, MAPP, and NIDIS.
44
Martínez-Fernandez J. Gonzalez-Zamora A. Almendra-Martín L. (2021). Soil moisture memory and soil properties?: An analysis with the stored precipitation fraction.J. Hydrol.593:125622.
45
McDowell N. Allen C. Anderson-Teixeira K. Aukema B. Bond-Lamberty B. Chini L. et al (2020). Pervasive shifts in forest dynamics in a changing world.Science368:eaaz9463. 10.1126/science.aaz9463
46
McDowell N. Allen C. (2015). Darcy’s law predicts widespread forest mortality under climate warming.Nat. Clim. Chang.5669–672.
47
Mote P. Li S. Lettenmaier D. Xiao M. Engel R. (2018). Dramatic declines in snowpack in the western US.NPJ Clim. Atmos. Sci.1:2. 10.1038/s41612-018-0012-1
48
Ogle K. Barber J. (2013). Feedback and Modularization in a bayesian meta – analysis of tree traits affecting forest.Bayesian Anal.8133–168. 10.1214/13-BA806
49
Ogle K. Pendall E. (2015). Isotope partitioning of soil respiration: A Bayesian solution to accommodate multiple sources of variability.J. Geophys. Res. Biogeosci.120979–988. 10.1002/2014JG002794
50
Ogle K. Peltier D. Fell M. Guo J. Kropp H. Barber J. (2018). Should we be concerned about multiple comparisons in hierarchical Bayesian models?Methods Ecol. Evol.10553–564.
51
Ogle K. Tucker C. Cable J. (2014). Beyond simple linear mixing models: Process-based isotope partitioning of ecological processes.Ecol. Appl.24181–195.
52
Ogle K. Wolpert R. Reynolds J. (2004). Reconstructing plant root area and water uptake profiles author(s): Kiona Ogle, Robert L. Wolpert and James F.Reynolds Sourc Ecol.851967–1978. 10.1890/03-0346
53
Overpeck J. Udall B. (2020). Climate change and the aridification of North America.Proc. Natl. Acad. Sci. U.S.A.11711856–11858. 10.1073/pnas.2006323117
54
Pascale S. Boos W. Bordoni S. Delworth T. L. Kapnick S. B. Murakami H. et al (2017). Weakening of the North American monsoon with global warming.Nat. Clim. Chang.7806–812. 10.1038/nclimate3412
55
Peek M. Leffler A. Hipps L. Ivans S. Ryel R. Caldwell M. (2006). Root turnover and relocation in the soil profile in response to seasonal soil water variation in a natural stand of Utah juniper (Juniperus osteosperma).Tree Physiol.261469–1476. 10.1093/treephys/26.11.1469
56
Pegoraro E. Mauritz M. Ogle K. Ebert C. Schuur E. (2021). Lower soil moisture and deep soil temperatures in thermokarst features increase old soil carbon loss after 10 years of experimental permafrost warming.Glob. Chang. Biol.271293–1308. 10.1111/gcb.15481
57
Peltier D. Guo J. Nguyen P. Bangs M. Gear L. Wilson M. et al (2021). Temporal controls on crown nonstructural carbohydrates in southwestern US tree species.Tree Physiol.41388–402. 10.1093/treephys/tpaa149
58
Peltier D. Guo J. Nguyen P. Bangs M. Wilson M. Samuels-Crow K. et al (2022). Temperature memory and non-structural carbohydrates mediate legacies of a hot drought in trees across the southwestern USA.Tree Physiol.4271–85. 10.1093/treephys/tpab091
59
Peltier D. M. P. Ogle K. (2019). Legacies of La Niña: North American monsoon can rescue trees from winter drought. Glob. Chang. Biol. 25, 121–133. 10.1111/gcb.14487
60
Petrie M. D. Pockman W. T. Pangle R. E. Limousin J. M. Plaut J. A. McDowell N. G. (2015). Winter climate change promotes an altered spring growing season in piñnon pine-juniper woodlands.Agric. For. Meteorol.214–215357–368. 10.1016/j.agrformet.2015.08.269
61
Petrie M. Savage N. (2022). Climate and landscape variation shapes the water balance of piñnon pine-juniper woodlands.Agric. For. Meteorol.323:109068.
62
Pettit B. (2021). Drought causing juniper die-off in central and northern Arizona.For. Serv. News Release51–5.
63
Pinno B. Wilson S. Steinaker D. F. Van Rees K. C. J. McDonald S. A. (2010). Original article Fine root dynamics of trembling aspen in boreal forest and aspen parkland in central Canada.Ann. For. Sci.671–6. 10.1051/forest/2010035
64
Plaut J. Yepez E. Hill J. Pangle R. Sperry J. Pockman W. et al (2012). Hydraulic limits preceding mortality in a piñon-juniper woodland under experimental drought.Plant Cell Environ.351601–1617. 10.1111/j.1365-3040.2012.02512.x
65
Poulter B. Frank D. Ciais P. Myneni R. Andela N. Bi J. et al (2014). Contribution of semi-arid ecosystems to interannual variability of the global carbon cycle.Nature.509600–603. 10.1038/nature13376
66
Prein A. Holland G. Rasmussen R. Clark M. P. Tye M. R. (2016). Running dry: The U.S. Southwest’s drift into a drier climate state.Geophys. Res. Lett.431–8. 10.1002/2015GL066727
67
Prein A. Towler E. Ge M. Baker S. Tighi S. Barrett L. (2022). Sub-seasonal predictability of North American monsoon precipitation.Geophys. Res. Lett.491–11. 10.1029/2021GL095602
68
PRISM Climate Group (2016). Gridded Climate Data.Corvallis, OR: Oregon State University. Available online at: http://prism.oregonstate.edu/
69
Robson S. Banta E. (1995). Groundwater Atlas of the United States: Arizona, Colorado, New Mexico, Utah (HA 730-C).USGS.
70
Schwinning S. Litvak M. Pockman W. Pangle R. E. Fox A. M. Huang C.-W. (2020). A 3-dimensional model of Pinus edulis and Juniperus monosperma root distributions in New Mexico: Implications for soil water dynamics.Plant Soil.450337–355. 10.1007/s11104-020-04446-y
71
Seager R. Ting M. (2017). Decadal drought variability over North America: Mechanisms and predictability.Curr. Clim. Chang. Rep.3141–149. 10.1007/s40641-017-0062-1
72
Seager R. Ting M. Held I. Kushnir Y. Lu J. Vecchi G. et al (2007). Model projections of an imminent transition to a more arid climate in southwestern North America.Science3161181–1184. 10.1126/science.1139601
73
Sharp Z. D. (2007). Principles of stable isotope geochemistry. Upper Saddle River, NJ: Pearson.
74
Shaw J. Steed B. Deblander L. (2005). Forest inventory and analysis (FIA) annual inventory answers the question?: What is happening to pinyon-juniper woodlands?J. For.103280–285.
75
Terzer-Wassmuth S. Wassenaar L. Welker J. Araguás-Araguás L. (2021). Improved high-resolution global and regionalized isoscapes of δ18O, δ2H and d-excess in precipitation.Hydrol. Process.35:e14254. 10.1002/hyp.14254
76
Tucker C. Young J. Williams D. Ogle K. (2014). Process-based isotope partitioning of winter soil respiration in a subalpine ecosystem reveals importance of rhizospheric respiration.Biogeochemistry121389–408. 10.1007/s10533-014-0008-9
77
Tulley-Cordova C. Putman A. Bowen G. (2021). Stable isotopes in precipitation and meteoric water: Sourcing and tracing the North American monsoon in Arizona, New Mexico, and Utah.Water Resour. Res.571–18. 10.1029/2021WR030039
78
USGS (2023). USGS Groundwater Historical Instantaneous Data for the Nation. Available online at: https://waterdata.usgs.gov/nwis/uv/?referred_module=gw(accessed January 4, 2023).
79
Vachon R. Welker J. White J. Vaughn B. (2010). Monthly precipitation isoscapes (δ18O) of the United States: Connections with surface temperatures, moisture source conditions, and air mass trajectories.J. Geophys. Res. Atmos.1151–17. 10.1029/2010JD014105
80
Walkinshaw M. O’Green A. Beaudette D. (2022). Soil Properties. Available online at: https://casoilresource.lawr.ucdavis.edu/soil-properties/(accessed January 31, 2023).
81
Wang B. Jin C. Liu J. (2020). Understanding future change of global monsoons projected by CMIP6 models.J. Clim.336471–6489. 10.1175/JCLI-D-19-0993.1
82
Welker J. (2000). Isotopic δ18O characteristics of weekly precipitation collected across the USA: An initial analysis with application to water source studies.Hydrol. Process.141449–1464. 10.1002/1099-1085(20000615)14:8<1449::AID-HYP993>3.0.CO;2-7
83
Welker J. (2012). ENSO effects on δ18O, δ2H and d-excess values in precipitation across the U.S. using a high-density, long-term network (USNIP).Rapid. Commun. Mass Spectrom.261893–1898. 10.1002/rcm.6298
84
West A. Hultine K. Burtch K. Ehleringer J. (2007a). Seasonal variations in moisture use in a piñon-juniper woodland.Oecologia153787–798. 10.1007/s00442-007-0777-0
85
West A. Hultine K. Jackson T. Ehleringer J. (2007b). Differential summer water use by Pinus edulis and Juniperus osteosperma reflects contrasting hydraulic characteristics.Tree Physiol.271711–1720. 10.1093/treephys/27.12.1711
86
West A. Hultine K. Sperry J. Bush S. Ehleringer J. (2008). Transpiration and hydraulic strategies in a pi?on-juniper woodland.Ecol. Appl.18911–927. 10.1890/06-2094.1
87
West A. Patrickson S. Ehleringer J. (2006). Water extraction times for plant and soil materials used in stable isotope analysis.Rapid. Commun. Mass. Spectrom.201317–1321. 10.1002/rcm.2456
88
Williams A. Cook B. Smerdon J. (2022). Rapid intensification of the emerging southwestern North American megadrought in 2020–2021.Nat. Clim. Chang.12232–234. 10.1038/s41558-022-01290-z
89
Williams A. Cook E. Smerdon J. Cook B. Abatzoglou J. Bolles K. et al (2020). Large contribution from anthropogenic warming to an emerging North American megadrought.Science368314–318. 10.1126/science.aaz9600
90
Williams D. Ehleringer J. (2000). Intra- and Interspecific variation for summer precipitation use in pinyon-juniper woodlands.Ecol. Monogr.70517–537. 10.1890/0012-9615(2000)070[0517:IAIVFS]2.0.CO;2
91
Woodruff D. Meinzer F. Marias D. Sevanto S. Jenkins M. McDowell N. (2015). Linking nonstructural carbohydrate dynamics to gas exchange and leaf hydraulic behavior in Pinus edulis and Juniperus monosperma.New Phytol.206411–421. 10.1111/nph.13170
92
Xia Z. Welker J. Winnick M. (2022). The seasonality of deuterium excess in non-polar precipitation global biogeochemical cycles.Glob. Biogeochem. Cycles361–31. 10.1029/2021GB007245
93
Young-Robertson J. Ogle K. Welker J. (2017). Thawing seasonal ground ice: An important water source for boreal forest plants in interior Alaska. Ecohydrology10:e1796. 10.1002/eco.1796
Summary
Keywords
semiarid ecosystems, North American Monsoon, Southwest U.S., water sources, stable isotopes, drought
Citation
Samuels-Crow KE, Peltier DMP, Liu Y, Guo JS, Welker JM, Anderegg WRL, Koch GW, Schwalm C, Litvak M, Shaw JD and Ogle K (2023) The importance of monsoon precipitation for foundation tree species across the semiarid Southwestern U.S.. Front. For. Glob. Change 6:1116786. doi: 10.3389/ffgc.2023.1116786
Received
05 December 2022
Accepted
06 March 2023
Published
30 March 2023
Volume
6 - 2023
Edited by
Lucy Penn Kerhoulas, Cal Poly Humboldt, United States
Reviewed by
Max Berkelhammer, University of Illinois at Chicago, United States; Jasper Oshun, Rutgers University—Newark, United States
Updates
Copyright
© 2023 Samuels-Crow, Peltier, Liu, Guo, Welker, Anderegg, Koch, Schwalm, Litvak, Shaw and Ogle.
This is an open-access article distributed under the terms of the Creative Commons Attribution License (CC BY). The use, distribution or reproduction in other forums is permitted, provided the original author(s) and the copyright owner(s) are credited and that the original publication in this journal is cited, in accordance with accepted academic practice. No use, distribution or reproduction is permitted which does not comply with these terms.
*Correspondence: Kimberly E. Samuels-Crow, Kimberly.Samuels@nau.edu
This article was submitted to Forest Ecophysiology, a section of the journal Frontiers in Forests and Global Change
Disclaimer
All claims expressed in this article are solely those of the authors and do not necessarily represent those of their affiliated organizations, or those of the publisher, the editors and the reviewers. Any product that may be evaluated in this article or claim that may be made by its manufacturer is not guaranteed or endorsed by the publisher.