Abstract
Livelihood diversification is a prominent feature of rural households in developing countries. It is a strategy commonly pursued by households to enhance their resilience to shocks and/or risks that affect their livelihood. While a common characteristic of Uganda’s community-based forest management (CBFM) is the promotion of alternative livelihood activities to reduce household reliance on natural forest resources from gazetted forests, it is unclear how livelihood diversification has been embraced by households engaged in CBFM. We explore livelihood diversification using cross-sectional survey data collected from 423 households in villages adjacent to Collaborative Forest Management (CFM) compartments and non-CFM compartments of Budongo Central Forest Reserve as well as two Community Forests (CF) in mid-western Uganda. We quantified the levels of diversification and fitted a Gini-Simpson Diversity Index as the response variable in two Tobit regression models to examine the determinants of livelihood diversification among forest-fringe communities in CFM and CF sites. Our results reveal high levels of survival-led household livelihood diversification in the area, with an average household engaging in five livelihood activities that were predominantly on-farm or involved the extraction of forest products for subsistence. In the CFM sites, livelihood diversification levels significantly increased with household heads’ duration of residence in the village and membership in other social groups in the village. In villages adjacent to the community forests, only the household dependency ratio positively influenced household livelihood diversification. Membership in forest conservation groups did not significantly predict the level of household livelihood diversification. Given the current survival-led diversification that these communities pursue, we recommended that development and conservation agencies in the area and other similar sites of CBFM deliberately enhance household access to high-return on-farm and non-farm livelihood activities to achieve meaningful transformations in rural livelihoods.
1. Introduction
Livelihood diversification is an important concept among scholars and policy makers in developing countries due to its practical connection to rural livelihood resilience (Baffoe and Matsuda, 2017a). Globally, rural livelihoods tend to be centered around three key strategies: agricultural intensification, livelihood diversification, and migration (Barrett et al., 2001). Most rural households in sub-Saharan Africa explore these strategies by pursuing other non-farm and off-farm livelihood activities besides farming (Ellis, 1999, 2000; Block and Webb, 2001; Walelign, 2016; Walelign and Jiao, 2017). This serves as a way of attenuating the negative effects of the predominantly risk-prone farming practices that they pursue for livelihood support (Asfaw et al., 2019; Etea et al., 2019). However, even within the same rural community, there are usually differences in the levels of diversification among households depending on the level of urbanization, access to markets, human and social capital, wealth and other household characteristics (Ellis, 1999, 2000; Baffoe and Matsuda, 2017b; Walelign and Jiao, 2017; Loison and Bignebat, 2018).
Ellis (1999) defined livelihood diversification as a process by which household members construct a diverse portfolio of activities in their struggle for survival. Livelihood diversification enables household members to meet their basic needs, improve their standards of living and cope with risk. Two broad typologies of rural livelihood diversification can be identified: agricultural diversification and non-agricultural diversification. Agricultural diversification involves production of multiple or high-value crops and/or livestock. On the other hand, non-agricultural livelihood diversification is typified by involvement in petty businesses, formal employment, remittances, extraction of forest resources and off-farm labor (Ellis, 2000). While agricultural diversification could result in significant positive livelihood gains for poor households, it may not be beneficial for wealthier households, for whom returns from specialization tend to outweigh the benefits of diversification.
In rural areas, the poorest households often face entry barriers to remunerative livelihood activities (Gautam and Andersen, 2016). Consequently, such households tend to engage in “distress-push” diversification that they pursue involuntarily to cope with shocks and crises. Their wealthier counterparts, in contrast, mostly pursue “demand-pull” diversification to create wealth (Sabyrbekov, 2019). In typical agrarian rural areas, the distress-push diversification pathway is predominant and perpetuated by failure in agricultural output resulting from shocks, unfavorable seasons (Ellis, 1998, 1999), missing or incomplete factor markets and market access limitations (Barrett et al., 2001). Households thus pursue the distress-push pathway with a survival-led focus while the demand-pull diversification pathway is opportunity-driven and largely a means of accumulation (Ellis, 1998; Loison, 2015; Etea et al., 2019). In addition to the household-level socio-economic conditions, the biophysical and institutional context within which farmers operate could also influence the choice of diversification pathway that households pursue (Kassie et al., 2017; Asfaw et al., 2019).
In Sub-Saharan Africa, national governments and development partners have consistently embraced livelihood diversification in their rural development agendas as a means to reduce the persistent rural poverty in the region (Loison, 2015; Loison and Bignebat, 2018). In Uganda, the government has embraced it in its national development planning frameworks, notably, the national development plans (MFPED, 2015, MFPED, 2020) and the country’s vision 2040 (NPA, 2013). In Uganda’s forestry sector, the main focus has been on achieving both conservation and rural development goals through involvement of forest-fringe households in conservation activities – especially those that provide alternative income sources. Following Uganda’s forest sector reforms initiated in the late 1990’s, two key CBFM schemes were formulated and promoted: (i) community forestry (CF) and (ii) collaborative forest management (CFM). Under these CBFM schemes, organized and registered community groups sign agreements with the state agency (in the case of CFM) to manage specified areas of a state forest or legally own forests (in the case of CF) on public land or other areas specified in the National Forestry and Tree Planting Act, 2003 (GOU, 2003).
The community groups participating in CFM are registered as Community-Based Organizations (CBOs) while those seeking to manage CFs are mostly registered as Communal Land Associations (CLAs). Following the implementation of pilot initiatives in the late 1990s, the CFM approach has gained prominence and is now practiced in all forest ranges under the National Forestry Authority (Kazoora et al., 2019). The community forestry approach, on the other hand, has had a slow take-off and is currently being actively implemented in only two forests – Ongo and Alimugonza, both of which are situated in the Budongo Forest landscape. These registered groups (CBOs and CLAs) have benefited from their de jure status by appealing to development agencies seeking to promote alternative livelihood schemes (Mawa et al., 2021, 2022). As such, members of these groups have had an advantage over non-members in that they have been more involved in training on alternative livelihood activities and other forms of alternative livelihood support schemes supported by state and non-state development and conservation agencies in the area. Most alternative livelihood schemes in the Budongo forest landscape aim to reduce household reliance on extractive forest resource use through various decoupling interventions such as promotion of apiculture, agroforestry, poultry and other livestock rearing, village savings and cooperative schemes, vegetable growing and business training (Babweteera et al., 2018).
A common feature in the theory of change of such interventions is the diversification of livelihoods in forest-adjacent households to reduce risks associated with peasant agriculture, and subsequently reduce forest dependence. This thinking is premised on the assumption that participating households find the alternative livelihood interventions more attractive than illegal forest-resource extraction or peasant agriculture. Thus, households with more diverse income sources would face a higher opportunity cost in harvesting forests and subsequently rely less on forestry resources (Wei et al., 2016). The reality around the BFR, however, is that households face complex risks ranging from low agricultural output as a result of human wildlife conflict and weather fluctuations, to entry barriers to high-income opportunities, as well as institutional factors that restrict access to more lucrative forest products. This combination of factors, as well as household attributes, could significantly increase the chances of distress-push diversification. Whereas, the households participating in CBFM schemes have had privileged access to these alternative livelihood schemes, it remains unclear whether interventions supported by CBFM schemes have inhibited or enhanced rural livelihood diversification. Recent studies in other parts of sub-Saharan Africa (e.g., Kassie et al., 2017; Kimengsi et al., 2019) and Asia (e.g., Park and Yeo-Chang, 2021) show positive associations which are largely context-specific.
Community Based Forest Management remains an important tool for managing protected landscapes like Budongo. However, whether the interventions deployed by such schemes are contributing to more equitable management, by diversifying and thus transforming livelihoods of households near protected areas remains gray, which limits opportunities for improving CBFM as a forest management strategy that has been widely implemented but with mixed results for conservation and livelihoods in Uganda.
This study therefore sought to contribute to the existing body of knowledge on outcomes of CBFM initiatives by examining the determinants of livelihood diversification in the Budongo Forest landscape, which harbors the longest successful sites of community forestry and Collaborative Forest Management in Uganda. Specifically, the study was guided by the following research questions: (i) what differences exist in the livelihood activities and pathways pursued by households of conservation group members (CLA and CFM) vis-à-vis non-members? (ii) what socio-demographic characteristics influence the levels of household livelihood diversification in the Budongo forest landscape?
1.1. Analytical approach
Following an extensive review of literature on rural livelihood diversification in sub-Saharan Africa, Loison (2015) reported two dominant approaches that scholars have frequently used to study household livelihood diversification behavior in the region: the “household economic model” (Taylor and Adelman, 2003) and the “livelihoods approach” (Chambers and Conway, 1991; Scoones, 1998; Ellis, 2000). The household economic model views the farming household as a dual-purpose (both producer and consumer) decision-making unit that makes production, labor allocation and consumption decisions that may be interdependent. A key assumption of this model is that such decisions are made to maximize utility. While conceptually sound, the household economic model fails to capture the reality of livelihood activity and strategy choices made by households in stressed environments (Ellis, 2000), and does not account for social relationships between household members that in many cases influence those choices (Ellis, 1998).
Therefore, with its people-centered focus, the livelihoods approach has dominated empirical studies on rural livelihood strategies and diversification in developing countries. The livelihoods approach is premised on the notion that all people have a range of assets (social, physical, financial, human and natural) which determine (i) the options available to them, (ii) the livelihood strategies they adopt, and (iii) their vulnerability to risks and shocks (Ellis, 2000). However, these assets gain their meaning and value through the prevailing social, institutional and organizational environments (DFID, 1999). While many of its components are difficult to measure and have been conceptualized in numerous ways, often using proxies by different authors, the livelihoods approach provides a more realistic picture of rural household-level diversification strategies, constraints faced in their pursuit and the diverse character of livelihoods. This study therefore uses insights from the livelihoods approach to examine household livelihood diversification among forest-fringe rural communities in the Budongo Forest landscape.
2. Materials and methods
2.1. Study area
This study was conducted in rural villages sharing borders with Budongo Central Forest Reserve (BFR) and two community forests (Ongo and Alimugonza) located at the periphery of BFR (Figure 1). BFR is a natural tropical forest located in mid-western Uganda, between 1°37′ and 2°03′ N, 31°22′, and 31°46′ E, spanning an area of 82,510 Ha. The Southern, South-Western and Eastern parts of BFR border farms and settlements. Many of the sections of the forest bordering these farms and settlements have been placed under CFM (Figure 1). There are six registered CBOs (CFM groups) that have signed agreements to co-manage those sections of BFR with the state agency (National Forestry Authority). These are Budongo Good Neighbours Community Association (BUNCA), Nyantonzi-Kamusenene Environment Conservation and Development Association (NECODA), North Budongo Forest Community Association (NOBUFOCA), Siiba Conservation Environment and Development Association (SEDA), Kapeka Integrated Community Development Association (KICODA), and Karujubu Forest Adjacent Community Association (KAFACA).
FIGURE 1

Location map of sampled households in villages adjacent Bugongo Forest Reserve (BFR), Ongo Community Forest (OCF), and Alimugonza Community Forest (ACF) in mid-western Uganda.
Most of the farms in the area are of subsistence nature, dominated by annual crops such as beans, sweet potatoes, cassava, and groundnuts. Over the past two decades, sugarcane plantations belonging to out-growers that supply Kinyara sugar factory have also expanded in the area, especially on the southern edge of the forest (Babweteera et al., 2018; Jeary et al., 2018). The factory is located about 5 km away from the forest edge. Resources accessed from BFR support the daily subsistence, and occasionally, cash needs of the forest-fringe households (Tumusiime et al., 2010; Mawa et al., 2020b).
The two community forests (Ongo and Alimugonza) are natural tropical forests located in the Budongo Forest Landscape. Ongo community forest covers 172.32 Ha and is located on the South-Western side of BFR while Alimugonza community forest is 28 Ha and is located on the Eastern side. Both community forests provide resources that are important for the daily subsistence needs of households in the surrounding villages (Mawa et al., 2020a,2021). Each of the community forests is managed by a Communal Land Association (CLA). The CLAs are formed by community members drawn from villages that have historically accessed resources from the respective forests. Most households in these villages are sedentary subsistence farmers.
The Budongo forest landscape is ethnically diverse with over 50 ethnic groups. The Banyoro who speak the Runyoro dialect are the indigenous inhabitants. The others comprise of immigrants from other parts of the country, Democratic Republic of Congo and South Sudan. The widely spoken languages in the area are Runyoro, Kiswahili, Lugbara, and Alur.
2.2. Data collection
We conducted a cross-sectional survey in 17 villages located in the Budongo forest landscape. Ten of the villages were in Kapeeka, Kibwona, Kyaguzi, and Nyabyeya parishes that border Budongo Central Forest Reserve. The remaining seven shared boundaries with the two community forests. The survey was conducted between September and December 2018. We sought clearance and permission to conduct the study from the Uganda National Council of Science and Technology, Masindi District Forest Service and National Forestry Authority. A multistage sampling strategy was used to select households for interviews. First, a list of households was obtained from the respective village Local Council Chairpersons. These lists were stratified based on membership to CBFM schemes as CFM or CLA member households and non-members. Following Krejcie and Morgan (1970), a total of 423 households were selected for the two strata using systematic random sampling technique. This sample comprised of 96 CFM member households, 196 non-CFM members, 40 CLA member-households, and 91 non-CLA members. We adapted the Poverty Environment Network (PEN) household questionnaires (CIFOR, 2008) to collect data on household livelihood assets, activities, strategies, income sources and household socio-demographics. Interviews were held with household heads or any other adult member of the household who was knowledgeable about the household livelihood assets and activities. The interviews were held in the local languages by trained research assistants.
2.3. Data analysis
2.3.1. Propensity score matching
We used the Propensity Score Matching (PSM) technique to obtain suitable counterfactuals for comparison of livelihood diversification among conservation group member-households (participants) and non-members (non-participants). We fitted a binary logistic regression model for each site (CFM and non-CFM) to generate a propensity score for each respondent based on relevant socio-demographic and biophysical characteristics (number of years of education of Household Head, number of years since the household was formed, age of Household Head, Household size (Adult Equivalent Units), distance of the household to the nearest forest, market and motorable road). The response variable (participation in CBFM) was a dummy i.e., 1 if at least one household member belonged to a community-based forest conservation group and 0 otherwise. We then used the nearest-neighbor algorithm in the matchIt Package (Ho et al., 2011) in R Programming language (R Core Team, 2020) to create groups of CFM/CLA members and non-members that were as closely matched as possible. Following Rosenbaum (2010), we used a caliper distance of 0.2 of the standard deviation of the estimated propensity scores. We ran sensitivity analyses to check for possible bias due to confounders using the rbounds package (Keele, 2014), in the R Programming language. The unmatched dataset from the CF sites was well-balanced on the selected covariates, rendering PSM unnecessary. However, for the CFM sites, 85 CFM-participating households were matched to the same number of non-participating households and used for the subsequent analyses.
2.3.2. Livelihood activities
Guided by insights from similar recent studies in Africa (Tumusiime et al., 2011; Loison, 2015; Gebru et al., 2018; Loison and Bignebat, 2018; Kimengsi et al., 2019, 2020) and Asia (Khatun and Roy, 2012; Gautam and Andersen, 2016; Dai et al., 2020), household income sources were disaggregated into 11 categories: (i) Commercial crop farming (ii) Food crop farming (iii) Subsistence forest product extraction (iv) Commercial forest product extraction (v) Poultry farming (vi) Small livestock farming (vii) Large livestock farming (viii) Off-farm agricultural wage (ix) Petty business (x) Non-farm self-employment and (xi) Non-farm salaries and wages. These income sources were compared among CFM/CLA member households and non-members using the non-parametric Wilcoxon Rank Sum Test.
Various indices have been used in the livelihood diversification literature to compute levels of diversification. Common indices include: Shannon-Weiner Diversity Index, the Gini-Simpson Index, Share of non-farm income, number of livelihood activities (or income sources), Herfindahl index, Ogive index, Entropy index, Modified Entropy index, Composite Entropy index (Shiyani and Pandya, 1998; Khatun and Roy, 2012; Loison and Bignebat, 2018; Asfaw et al., 2019). In this study, four measures of livelihood diversification were computed: (i) the number of livelihood activities pursued, (ii) the share of non-farm income (iii) Shannon-Weiner Diversity Index and, (iv) Gini-Simpson Index. The Shannon-Weiner Diversity Index (H’) is a widely accepted diversity measurement index, commonly used in community ecology. Several previous authors of livelihood diversification (Wan et al., 2016; Etea et al., 2019; Sabyrbekov, 2019) have also used it as a measure of household livelihood diversification. Its key strength is that it accounts for equity and richness of livelihood strategies and activities. Shannon-Weiner Diversity Index (H’) was computed as:
Where pi = proportion of household income generated by activity i to the total income. N = total number of different income sources. An increase in the value of H’ implies an increasing diversity of household income sources.
The Gini-Simpson Index is particularly popular due to its computational simplicity, robustness and ease of interpretation. Thus, it was computed and used as a dependent variable in the Tobit regression models. The index takes into account both the number of activities and the evenness of the income shares across the activities. The Gini-Simpson index has also been severally used by previous authors (Debela et al., 2012; Khatun and Roy, 2012; Chilongo, 2014; Etea et al., 2019). The index computes unbiased estimates of diversification, especially when the samples are randomly drawn from populations (Caso and Gil, 1988). The Gini-Simpson Index (D1) was computed as:
Where a D1 value of 0 indicates a single source of income, while a value of 1 indicates an infinite number of income sources of equal size. Thus, as D1 approaches 1, it reveals an increasingly diversified household income portfolio. We also compared and visualized the levels of diversification among conservation group members and non-members by constructing five categories of the levels of diversification based on values of the Gini-Simpson index as shown in Table 1.
TABLE 1
| Category | Gini-Simpson Index |
| No diversification | ≤0.01 |
| Low level diversification | 0.01–0.25 |
| Medium level diversification | 0.26–0.50 |
| High level diversification | 0.51–0.75 |
| Very high-level diversification | >0.75 |
Categories of livelihood diversification.
2.3.3. Determinants of livelihood diversification
Since the Gini-Simpson Index value is limited between zero and one, ordinary least square regression is not suitable to explain the determinants of livelihood diversification. Therefore, we ran two Tobit regression models (Tobin, 1958) to assesses and explain the determinants of livelihood diversification among forest-fringe rural households in the Budongo forest landscape: one model for CF and the other for CFM sites. Recent studies on livelihood diversification (Awotide et al., 2010; Torres et al., 2018) have also used the Tobit model due to its ability to provide consistent estimates for censored response variables (Hill et al., 2018; Wooldridge, 2019) as it is in our case.
The set of predictor variables (Table 2) used in the models were selected following an extensive review of literature on rural livelihood diversification (Ellis, 1999; Block and Webb, 2001; Awotide et al., 2010; Debela et al., 2012; Loison, 2015; Gautam and Andersen, 2016; Wan et al., 2016; Baffoe and Matsuda, 2017a; Kassie et al., 2017; Gebru et al., 2018; Asfaw et al., 2019; Kimengsi et al., 2019, 2020; Sabyrbekov, 2019; Žakevièiûtë, 2019; Dai et al., 2020; Dedehouanou and McPeak, 2020; Senganimalunje et al., 2020).
TABLE 2
| Variable | Variable description | Description of variable coding | Expected effect on D1 |
| X2 | Sex of household head | Dummy, takes the value of 1 if household is male-headed and 0 otherwise | + |
| X3 | Duration of residence in the village | Continuous (number of years) | + |
| X4 | Number of parcels of land | Continuous | + |
| X5 | Dependency ratio | Continuous (computed as the number of household members aged 15 or below or above 64, divided by the number of household members aged between 15 and 64) | + |
| X6 | Total value of durable fixed assets | Continuous | + |
| X7 | Membership in CFM or CLA | Dummy, takes the value of 1 if yes and 0 otherwise | + |
| X8 | Access to finance | Dummy, takes the value of 1 if yes and 0 otherwise | + |
| X9 | Membership in other social groups | Dummy, takes the value of 1 if yes and 0 otherwise | + |
| X10 | Leadership position in the village | Dummy, takes the value of 1 if yes and 0 otherwise | + |
Predictor variables used in the Tobit regression models.
All statistical analyses were conducted using R version 4.0.3 (R Core Team, 2020). Table 2 presents a list of variables used in the model with a priori sign expectations. The Marginal effects were computed and reported to ease interpretation.
3. Results
3.1. Livelihood activities of forest-fringe households in the budongo forest landscape
Both conservation group member and non-member households undertook similar livelihood activities. These were dominated by on-farm activities such as food and commercial crop farming, poultry and small livestock farming. Over 40% of the households in the sample (Figure 2) were engaged in each of these activities. Rearing of large livestock (cattle) was not popular in the study area. Forest environmental income was dominated by subsistence forest product extraction that over 70% of the households in our sample engaged in. Commercial forest product (timber and charcoal) extraction was practiced by 13% of the households in the villages adjacent to BFR while only 2% of those located in villages adjacent to the community forests were engaged in it. Non-farm income was dominated by petty businesses (20 and 10% in the CFM and community forestry sites, respectively). Salaries and wages, just like large livestock farming were not major sources of income for the average household in our sample. About 40% of the households in both CFM and community forestry sites obtained part of their household income from off-farm wage labor (offered on other farms in the area) as shown in Figure 2.
FIGURE 2
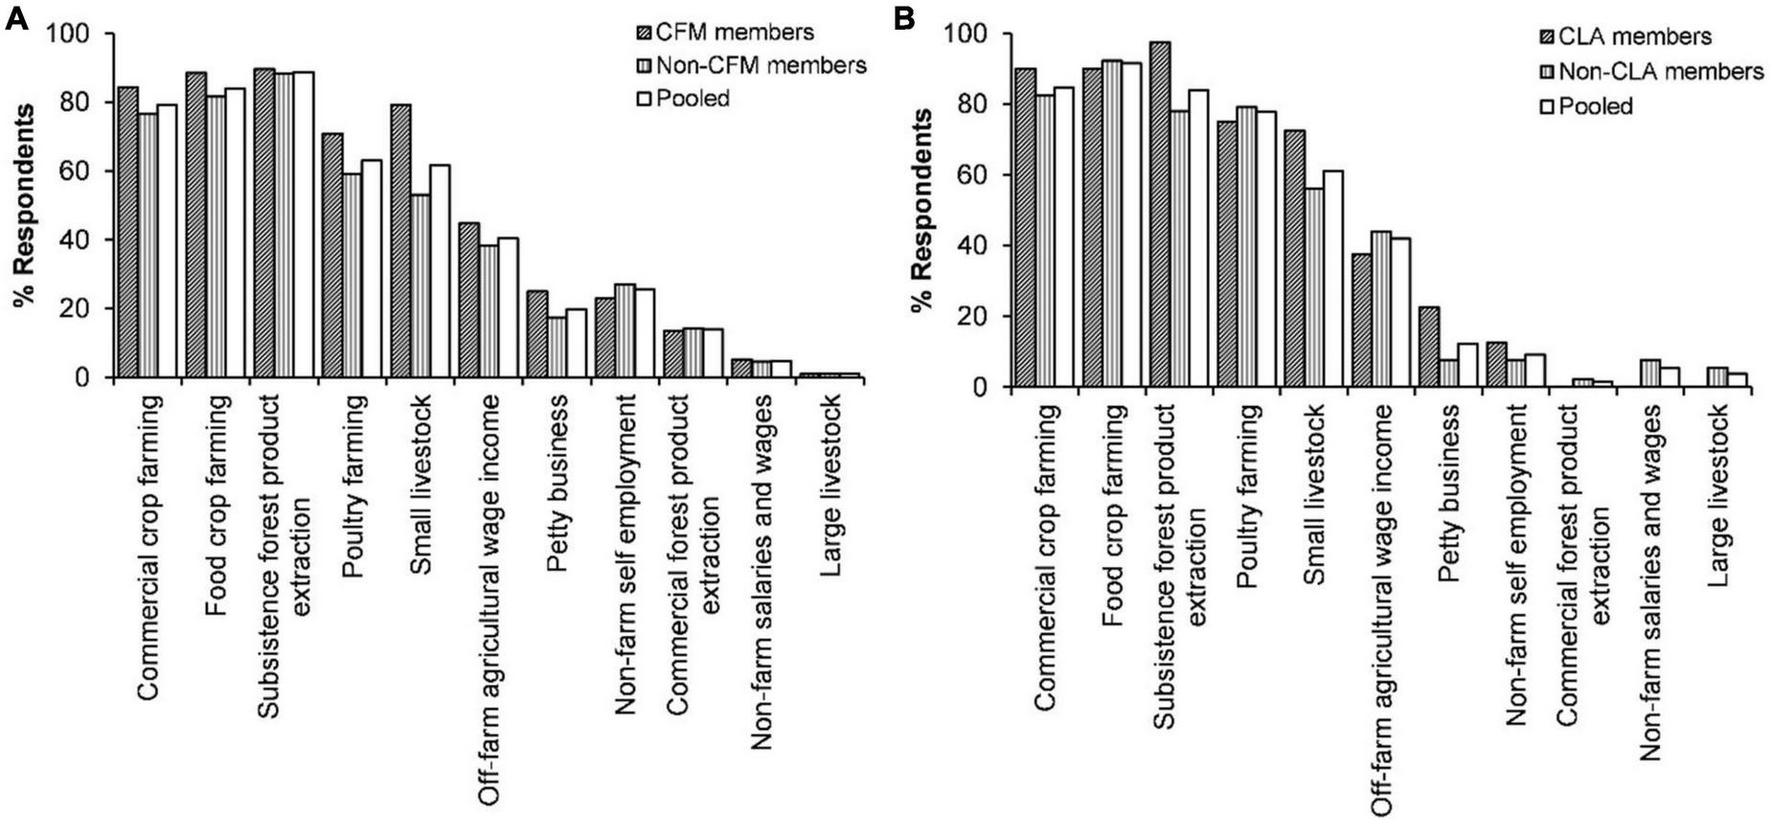
Livelihood activities of forest-fringe rural communities around Bugongo Forest Reserve (BFR) (A) and community forests (B) in mid-western Uganda.
For households in the CFM sites, subsistence forest resource extraction was the most important income source for both CFM-member households (Median = UGX 92,000) and non-member households (Median = UGX 89,846). This was followed by small livestock farming (Median = UGX 68,210 for CFM-member households and Median = UGX 35,571 for non-CFM member households), poultry farming (Median = UGX 22,000 for CFM member households and Median = UGX 19,090 for non-CFM member households), commercial and subsistence crops were the least important household income sources (Table 3).
TABLE 3
| Commer- cial crop farming |
Food crop farming | Subsistence forest product extraction | Poultry farming | Small livestock farming | Off-farm agricul- tural wage |
Petty business | Non-farm self-employ- ment |
Commer- cial forest product extraction |
Non-farm salaries and wages | Large livestock farming | |
| CFM members (n = 85) | |||||||||||
| Mean | 67,373 | 507,196 | 241,099 | 55,441 | 89,322 | 194,922 | 56,952 | 78,713 | 29,222 | 28,956 | 4,364 |
| Standard deviation | 137,129 | 1,591,960 | 550,478 | 115,125 | 95,982 | 390,695 | 159,157 | 272,326 | 136,583 | 126,309 | 40,234 |
| Median | 17,500 | 13,750 | 92,000 | 22,000 | 68,210 | 0 | 0 | 0 | 0 | 0 | 0 |
| Interquartile range | 50,556 | 62,294 | 114,165 | 64,311 | 121,572 | 210,526 | 0 | 0 | 0 | 0 | 0 |
| Non-CFM members (n = 85) | |||||||||||
| Mean | 31,517 | 107,165 | 186,346 | 106,337 | 73,887 | 126,119 | 50,047 | 99,676 | 49,501 | 56,491 | 6,745 |
| Standard deviation | 66,784 | 372,578 | 364,412 | 549,779 | 118,292 | 312,117 | 155,213 | 351,036 | 148,818 | 305,290 | 62,187 |
| Median | 9,429 | 12,500 | 89,846 | 19,090 | 35,571 | 0 | 0 | 0 | 0 | 0 | 0 |
| Interquartile range | 24,647 | 37,643 | 125,867 | 59,529 | 100,000 | 60,000 | 0 | 0 | 0 | 0 | 0 |
| V | 1,098 | 1,352 | 1,708.5 | 1,296.5 | 1,201 | 609.5 | 266 | 283.5 | 150 | 26 | 2 |
| P-value | 0.012** | 0.107 | 0.877 | 0.626 | 0.176 | 0.125 | 0.803 | 0.722 | 0.237 | 0.722 | 0.997 |
| CLA members (n = 40) | |||||||||||
| Mean | 89,648 | 106,363 | 443,003 | 65,921 | 124,914 | 108,357 | 30,036 | 304,013 | 0 | 0 | 0 |
| Standard deviation | 285,649 | 221,360 | 2,012,381 | 123,567 | 342,537 | 332,156 | 87,807 | 1,816,481 | 0 | 0 | 0 |
| Median | 22,455 | 106,363 | 91,125 | 30,821 | 49,135 | 0 | 15,182 | 0 | 0 | 0 | 0 |
| Interquartile range | 80,871 | 83,119 | 141,771 | 68,083 | 93,443 | 85,417 | 103,556 | 0 | 0 | 0 | 0 |
| Non-CLA members (n = 91) | |||||||||||
| Mean | 33,921 | 55,712 | 83,952 | 74,836 | 62,318 | 97,297 | 36,996 | 59,268 | 8,106 | 46,119 | 91,477 |
| Standard deviation | 51,246 | 74,976 | 104,053 | 145,612 | 92,509 | 231,483 | 289,414 | 474,086 | 75,997 | 183,662 | 428,502 |
| Median | 20,000 | 28,500 | 44,308 | 40,615 | 32,364 | 0 | 0 | 0 | 0 | 0 | 0 |
| Interquartile range | 35,311 | 58,000 | 116,873 | 70,286 | 88,000 | 83,750 | 0 | 0 | 0 | 0 | 0 |
| W | 1,578 | 1,643.5 | 1,307.5 | 1,992.5 | 1,590 | 1,914.5 | 1,554 | 1,725 | 1,860 | 1,960 | 1,920 |
| P-value | 0.227 | 0.379 | 0.001*** | 0.387 | 0.237 | 0.601 | 0.020** | 0.345 | 0.353 | 0.074* | 0.134 |
Household income from the different livelihood activities among forest-fringe communities in mid-western Uganda.
The per capita incomes are presented in Uganda Shilling (UGX), a local currency. The asterisks *, **, and *** denote statistically significant difference in Median incomes at 10, 5, and 1% levels, respectively, following Wilcoxon rank sum test with continuity correction [for the community forestry (CF) dataset] and Wilcoxon signed rank test with continuity correction [for the Collaborative Forest Management (CFM) dataset]. Weighted Average Inter-Bank Foreign Exchange Market Mid-rate for the year 2018 was UGX 3727.79≈USD 1.0.
For households in villages bordering the community forests, food crop farming was the main income source among CLA member households (Median = UGX 106,363). While the livelihood activities that non-CLA member households engaged in were similar to those observed in the CFM sites, CLA member households obtained significantly higher median incomes from subsistence forest product extraction (Wilcoxon rank sum test, W = 1,307.5; p = 0.001) and petty businesses (Wilcoxon rank sum test, W = 1,554, p = 0.020) as shown in Table 3.
3.2. Levels of household livelihood diversification
The average CFM member household in our sample was engaged in significantly higher number of livelihood activities (Mean = 5.25; SE = 0.13) compared to non-CFM member households (Mean = 4.61; SE = 0.10) (p < 0.05). However, their average Shannon’s and Gini-Simpson indices were not significantly different from those of non-CFM member households (p > 0.05). In the CF sites, there were no significant differences in the average number of livelihood activities that CLA member households and non-members engaged in (p > 0.05). Non-farm livelihood activities contributed marginally to the total household income, especially among communities surrounding the community forests, where its average contribution was less than 10% (Table 4).
TABLE 4
| Measures of diversification | Collaborative forest management | Community forestry | ||||
| CFM members (n = 85) | Non-CFM members (n = 85) | P-value | CLA members (n = 40) | Non-CLA members (n = 91) | P-value | |
| Number of livelihood activities | 5.21 @ 0.13 | 4.66 @ 0.16 | 0.009*** | 4.98 @ 0.19 | 4.63 @ 0.14 | 0.138 |
| Share of non-farm income | 0.14 @ 0.02 | 0.19 @ 0.02 | 0.127 | 0.08 @ 0.02 | 0.09 @ 0.02 | 0.680 |
| Shannon’s diversity index | 1.10 @ 0.04 | 1.01 @ 0.05 | 0.166 | 1.22 @ 0.06 | 1.12 @ 0.05 | 0.193 |
| Gini-Simpson diversity index | 0.57 @ 0.02 | 0.54 @ 0.02 | 0.222 | 0.62 @ 0.03 | 0.59 @ 0.02 | 0.339 |
Descriptive summary of levels of household livelihood diversification among forest-fringe communities in mid-western Uganda.
The mean ± SE are reported together with p-values following independent samples t-test [for the community forestry (CF) dataset] and dependent samples t-test [for the Collaborative Forest Management (CFM) dataset]. The asterisk (***) denotes statistical significance at 5% level.
Over 55% of the households around both BFR and the two community forests practiced high to very high levels of livelihood diversification (Figure 3). This pattern was consistent for all households regardless of membership in conservation groups.
FIGURE 3
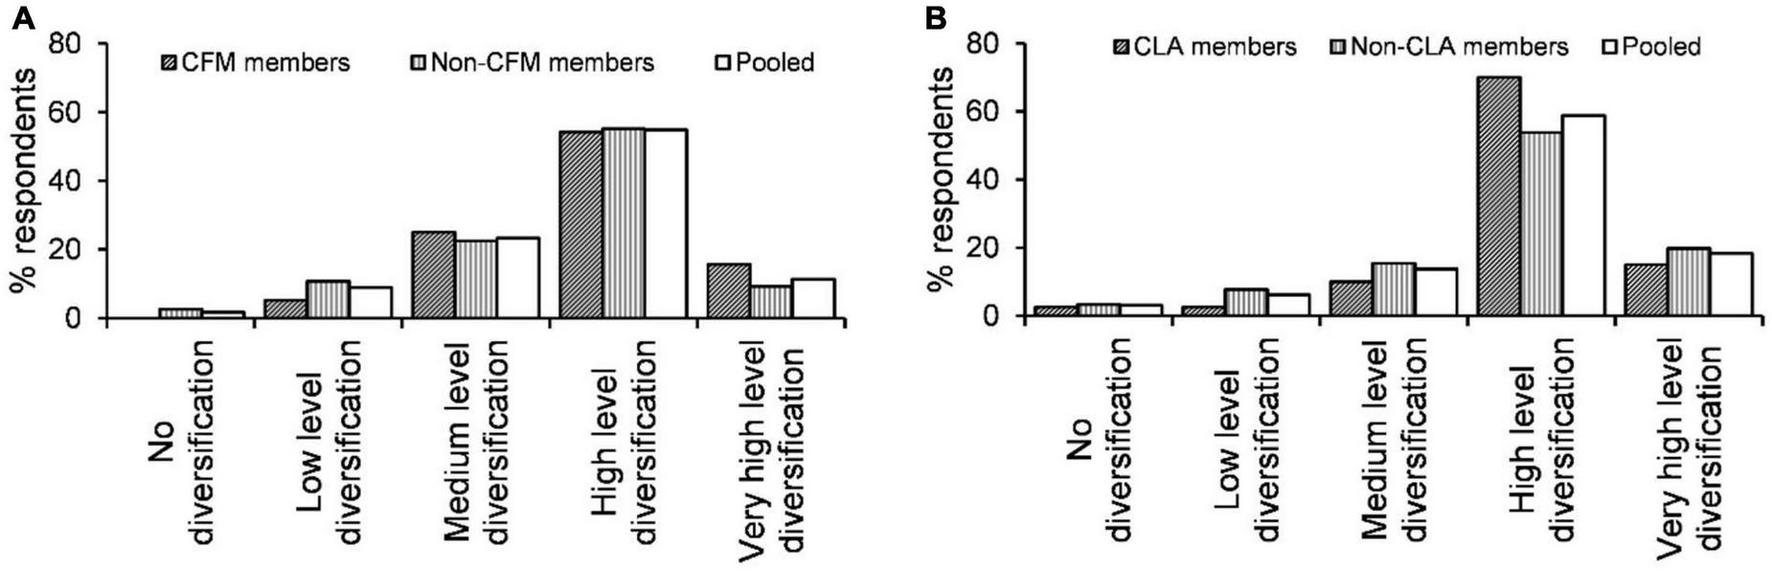
Levels of livelihood diversification among forest-fringe rural households around Bugongo Forest Reserve (BFR) (A) and community forests (B) in mid-western Uganda.
3.3. Determinants of household livelihood diversification
The number of years of residence of a household head and membership in other social groups in the village significantly influenced a household’s level of livelihood diversification in the villages bordering BFR. For households in villages surrounding the two community forests, a household’s dependency ratio had a statistically significant influence (p < 0.05) (Table 5). For households in the CFM sites, each additional year of residence of the household head in the village increased their Gini-Simpson index of diversification by 0.0023 (p = 0.025). Similarly, having a household member belonging to other social groups in the village increased the household’s Gini-Simpson index of diversification by 0.081 (p = 0.025). For households in villages bordering the CFs, an additional increase in a household’s dependency ratio increased their Gini-Simpson index of diversification by 0.0001 (p = 0.037). The rest of the predictors did not significantly influence a household’s level of livelihood diversification (p ≥ 0.05).
TABLE 5
| Predictor | Collaborative forest management | Community forestry | ||||||
| dy/dx | Standard error | z | P-value | dy/dx | Standard error | z | P-value | |
| Household is male-headed | 0.0622 | 0.0456 | 1.36 | 0.173 | -0.0189 | 0.0611 | -0.31 | 0.757 |
| Duration of residence in the village | 0.0029 | 0.0011 | 2.61 | 0.009*** | 0.0006 | 0.0012 | 0.50 | 0.614 |
| Number of parcels of land | -0.0038 | 0.0175 | -0.22 | 0.829 | -0.0302 | 0.0333 | -0.91 | 0.365 |
| Dependency ratio | -0.0002 | 0.0001 | -1.59 | 0.113 | 0.0003 | 0.0001 | 2.08 | 0.037** |
| Total value of durable fixed assets | −6.05 × 10–09 | 0.0000 | -0.71 | 0.476 | −4.36 × 10–09 | 0.0000 | -0.46 | 0.647 |
| Membership in CFM or CLA | 0.0204 | 0.0305 | 0.67 | 0.503 | 0.0282 | 0.0418 | 0.67 | 0.500 |
| Household accesses finance | 0.0163 | 0.0326 | 0.50 | 0.617 | 0.0023 | 0.0378 | 0.06 | 0.952 |
| Membership in other social groups | 0.0812 | 0.0362 | 2.25 | 0.025** | -0.0012 | 0.0481 | -0.03 | 0.980 |
| Leadership position in the village | 0.0416 | 0.0370 | 1.12 | 0.261 | 0.0108 | 0.0484 | 0.22 | 0.823 |
| N | 170 | − | − | − | 131 | − | − | − |
| Log likelihood | 38.919 | − | − | − | 27.95 | − | − | − |
| Prob > chi2 | 0.0003 | − | − | − | 0.0010 | − | − | − |
| AIC | -83.838 | − | − | − | 2.44 | − | − | − |
Tobit estimates of determinants of livelihood diversification among forest-fringe rural households in mid-western Uganda.
The asterisks *** and ** denote statistical significance at at 1 and 5% levels, respectively.
3.4. Relationship between total household per capita income and livelihood diversification
Total household per capita income was negatively correlated with Gini-Simpson index in villages bordering BFR (Kendall’s tau-b = −0.133; p = 0.010) among both CFM-member households (Kendall’s tau-b = −0.148; p = 0.042) and non-member households (Kendall’s tau-b = −0.133; p = 0.049). However, there was no clear association between total household per capita income and Gini-Simpson index of diversification among households in villages bordering the community forests (Kendall’s tau-b = −0.031; p = 0.601). This was observed among both CLA member households (Kendall’s tau-b = −0.082; p = 0.456) and non-CLA members (Kendall’s tau-b = −0.089; p = 0.212).
4. Discussion
4.1. Livelihood activities pursued by forest-fringe households
Our findings reveal a precarious set of livelihood activities that dominate the Budongo forest landscape, an area that has been a hub for field experimentation of community-based forest management approaches in the country. A typical household in the area, regardless of membership in conservation groups, tends to engage in several agricultural enterprises. These enterprises are largely subsistence in nature and typify the rural agrarian landscape in Uganda. The only notable difference between conservation group member households and non-members was the increased value of income from commercial crop farming accruing to the households participating in CFM (Table 3). This is attributed to the increased efforts of actors, especially Non-Governmental Organizations (NGOs), toward supporting alternative livelihood activities through various schemes in the communities adjacent to BFR. Provision of alternative livelihood schemes dominate decoupling interventions in the area. These interventions aim to increase options available to their beneficiaries and reduce household dependence on the forest for subsistence. For example, Budongo Conservation Field Station (BCFS) through its alternative livelihoods projects has promoted small livestock rearing and supported production of high-value non-traditional crops such as rice, cabbage and soybean for commercial farming (Babweteera et al., 2018). Other NGOs such as Village Enterprise and the Jane Goodall Institute have also actively implemented related alternative livelihoods schemes in the area.
Previous studies on the effects of the alternative livelihood schemes in the Budongo forest landscape have reported mixed results. On one hand, success stories have been documented e.g., for project that supported ex-hunters (Hsiao et al., 2013; Tumusiime et al., 2010) while failures and negative externalities in an earlier intervention meant to curb human-wildlife conflict in the area have also been reported (Webber et al., 2007). Lessons from these interventions could be used to achieve better livelihood outcomes. However, given their fragmented, time-bound, small and short-term nature of the predominantly donor-funded grants that such projects often rely on Wicander and Coad (2018), Kazoora et al. (2019), best practices may be too costly to implement within their personnel, time and budget constraints. Therefore, dedicated state support in terms of adequately funding community-based conservation and development activities and ensuring a minimum level of coordination for projects promoting alternative livelihoods schemes in these areas is required.
In the community forest sites, CLA member households obtained higher income from subsistence forest products sourced from the community forests and petty businesses. Subsistence forest resource extraction is therefore an important livelihood activity in the BFR landscape, which equally offers other lucrative livelihood activities mostly pursued by wealthier and ‘more-connected’ households in covert ways (Mawa et al., 2020b). Because it is largely extractive in nature, the high dependence on subsistence forest resources in the adjacent communities could jeopardize forest conservation goals in the long run, leading to forest degradation (Mawa et al., 2020a) or forest conversion to other land uses.
In such rural landscapes, that are characterized by significant entry barriers for the poorest segments to meaningfully benefit from high return non-farm or farm-based activities, diversification interventions targeting specific socio-economic segments of the rural population should be promoted with a view of enhancing access to sustainable economic activities, credit and markets (Asfaw et al., 2019). This would enable the households to secure better living standards by engaging in activities that generate cash, expand their asset portfolios and enhance their ability to diversify across both farm and non-farm sectors (Ellis and Freeman, 2004). Consequently, such households would be more resilient in the face of the risky farming decisions that characterize the rural space (Barrett et al., 2001; Ellis and Bahiigwa, 2003).
4.2. Determinants of household livelihood diversification in budongo forest landscape
4.2.1. Years of residence of household head in the village
Household heads in the villages bordering BFR, who had spent more years in the village, were in better position to diversify. This is because such households tend to have more knowledge about the village — a key attribute that new projects and related development initiatives tend to consider for inclusion as key informants during situational analyses and later, as beneficiaries. This inevitably predisposes them to new development opportunities, compared to those that are relatively new in the village. Similar findings were reported by Park and Yeo-Chang (2021) in their study in South Korea where new settlers around Southern Seoul National University forest faced restricted access to forest resources under the country’s Collaborative Forest Management arrangement.
4.2.2. Membership in other social groups
Membership in other social groups positively influenced household livelihood diversification in the CFM sites. The common social groups in the area are those related to religious activities, credit and savings, and gender-specific groups such as women’s groups and youth groups that benefit from initiatives that require such levels of organization to promote alternative livelihood activities. Involvement in these social group activities exposes the household members to new opportunities since social gatherings (e.g., in group meetings) are commonly utilized for disseminating information and exchanging ideas (Johnson, 2007).
4.2.3. Dependency ratio
The effect of the dependency ratio on the level of livelihood diversification was only significant among households in villages bordering the community forests. In the literature on rural livelihoods, higher dependency ratio is a common indicator of poor household wellbeing (Dutta and Kumar, 2016) and low human capital (Angelsen et al., 2014). These households are often unintentionally driven to pursue survival-led livelihood diversification pathways. In the study area, their reliance on the forest is for subsistence. These households are mostly headed by uneducated women, children or sickly persons with limited access to land for farming. Their members often engage in provision of low-paying off-farm labor, for survival. These characteristics present significant entry barriers to lucrative livelihood activities, rendering them locked up in survival-led diversification pathway. In a recent study in Ethiopia, households with high dependency ratios were reported to have lower probabilities of participating in high-return off-farm and non-farm income-generating livelihood activities (Gebru et al., 2018) that are commonly pursued for accumulation (Barrett et al., 2001).
5. Conclusion and policy implications
This study sought to determine the levels of household livelihood diversification among forest conservation group members and non-members in Budongo Forest landscape and document its determinants. Households in the study area pursued high to very high levels of diversification. While membership in a CFM group or CLA was hypothesized to be associated with high levels of livelihood diversification, this was only witnessed in the CFM sites, where CFM member households engaged in more livelihood activities compared to their non-CFM member counterparts.
Households where the household head had resided in the village for extended periods and those that had members who belonged to other social groups in the village tended to diversify more. However, the livelihood activities that they pursued were mostly farm-based and practiced for survival, not wealth creation or accumulation. Therefore, state and non-state actors need to design deliberate development interventions targeting these poor households to generate cash, build assets and diversify across both farm and non-farm activities. Such initiatives could be incorporated into the management plans of the existing conservation groups. In addition, market linkages and non-extractive forest uses such as ecotourism need to be developed to achieve meaningful livelihood transformations in the Budongo Forest landscape.
The current alternative livelihood schemes that are promoted by state and non-state actors are disjointed. The Collaborative Forest Management and Community Forestry coordination desks of the state agencies should be strengthened to streamline alternative livelihood schemes being promoted to achieve conservation and development goals. Additionally, the existing governance platforms such as Uganda Network of Community Forest Associations should be strengthened to coordinate CFM/CLA activities at regional and national levels. For future research, we recommend that a more detailed sociological assessment be undertaken to better understand how the rural households in our study area negotiate contextual factors to shape the observed livelihood diversification pathways.
Statements
Data availability statement
The raw data supporting the conclusions of this article will be made available by the authors, without undue reservation.
Ethics statement
The studies involving human participants were reviewed and approved by National Council of Science and Technology, Uganda. The participants provided their written informed consent to participate in this study.
Author contributions
CM and EO collected the field data. CM led the analysis and write-up of the manuscript. All authors contributed to the design and implementation of the research, writing of the manuscript, and approved the submitted version.
Funding
This work was supported by NORAD through the NORHED project (UGA-13/0019).
Conflict of interest
The authors declare that the research was conducted in the absence of any commercial or financial relationships that could be construed as a potential conflict of interest.
Publisher’s note
All claims expressed in this article are solely those of the authors and do not necessarily represent those of their affiliated organizations, or those of the publisher, the editors and the reviewers. Any product that may be evaluated in this article, or claim that may be made by its manufacturer, is not guaranteed or endorsed by the publisher.
References
1
Angelsen A. Jagger P. Babigumira R. Belcher B. Hogarth N. J. Bauch S. et al (2014). Environmental income and rural livelihoods: A global-comparative analysis.World Dev.64S12–S28. 10.1016/j.worlddev.2014.03.006
2
Asfaw S. Scognamillo A. Di Caprera G. Sitko N. Ignaciuk A. (2019). Heterogeneous impact of livelihood diversification on household welfare: Cross-country evidence from Sub-Saharan Africa.World Dev.117278–295. 10.1016/j.worlddev.2019.01.017
3
Awotide O. D. Kehinde A. L. Agbola P. O. (2010). Poverty and rural livelihood diversification among farming households in southwest Nigeria.J. Food Agric. Environ.8367–371.
4
Babweteera F. Mawa C. Asiimwe C. Okwir E. Muhanguzi G. Okimat J. P. et al (2018). “Budongo forest: A paradigm shift in conservation?,” in Conservation and development in Uganda, edsSandbrookC.CavanaghJ. C.TumusiimeD. M. (Oxfordshire: Routledge), 276. 10.4324/9781315200538
5
Baffoe G. Matsuda H. (2017a). Why do rural communities do what they do in the context of livelihood activities? Exploring the livelihood priority and viability nexus.Commun. Dev.48715–734. 10.1080/15575330.2017.1366927
6
Baffoe G. Matsuda H. (2017b). An empirical assessment of rural livelihood assets from gender perspective: Evidence from Ghana.Sustain. Sci.13815–828. 10.1007/s11625-017-0483-8
7
Barrett C. B. Reardon T. Webb P. (2001). Nonfarm income diversification and household livelihood strategies in rural Africa: Concepts, dynamics, and policy implications.Food Policy26315–331.
8
Block S. Webb P. (2001). The dynamics of livelihood diversification in post-famine Ethiopia.Food Policy26333–350.
9
Caso C. Gil M. A. (1988). The gini-simpson index of diversity: Estimation in the stratified sampling.Commun. Stat. Theory Methods172981–2995. 10.1080/03610928808829784
10
Chambers R. Conway G. R. (1991). Sustainable rural livelihoods: Practical concepts for the 21st century (No. 296).Brighton: IDS.
11
Chilongo T. (2014). Livelihood strategies and forest reliance in Malawi.For. Trees Livelihoods23188–210. 10.1080/14728028.2014.922449
12
CIFOR (2008). PEN prototype questionnaire version 4.4.Bogor: CIFOR.
13
Dai X. Wu Z. Fan Y. Li B. Yang Z. Nan B. et al (2020). Characteristics and determinants of livelihood diversification of different household types in far northwestern China.Sustainability121–20. 10.3390/SU12010064
14
Debela B. Shively G. Angelsen A. Wik M. (2012). Economic shocks, diversification, and forest use in Uganda.Land Econ.88139–154. 10.3368/le.88.1.139
15
Dedehouanou S. F. A. McPeak J. (2020). Diversify more or less? Household income generation strategies and food security in rural Nigeria.J. Dev. Stud.56560–577. 10.1080/00220388.2019.1585814
16
DFID (1999). Framework of sustainable livelihoods.London: Department for International Development.
17
Dutta S. Kumar L. (2016). Is poverty stochastic or structural in nature? Evidence from rural India.Soc. Indic. Res.128957–979. 10.1007/s11205-015-1064-9
18
Ellis F. (1998). Household strategies and rural livelihood diversification.J. Dev. Stud.351–38. 10.1080/00220389808422553
19
Ellis F. (1999). Rural livelihood diversity in developing countries: Evidence and policy implications.London: Overseas Development Institute.
20
Ellis F. (2000). The determinants of rural livelihood diversification i n developing countries.J. Agric. Econ.51289–302. 10.1111/j.1477-9552.2000.tb01229.x
21
Ellis F. Bahiigwa G. (2003). Livelihoods and rural poverty reduction in Uganda.World Dev.31997–1013. 10.1016/S0305-750X(03)00043-3
22
Ellis F. Freeman H. A. (2004). Rural livelihoods and poverty reduction strategies in four African countries.J. Dev. Stud.401–30.
23
Etea B. G. Zhou D. Abebe K. A. Sedebo D. A. (2019). Is income diversification a means of survival or accumulation? Evidence from rural and semi-urban households in Ethiopia.Environ. Dev. Sustain.225751–5769. 10.1007/s10668-019-00449-7
24
Gautam Y. Andersen P. (2016). Rural livelihood diversification and household well-being: Insights from Humla, Nepal.J. Rural Stud.44239–249. 10.1016/j.jrurstud.2016.02.001
25
Gebru G. W. Ichoku H. E. Phil-Eze P. O. (2018). Determinants of livelihood diversification strategies in Eastern Tigray Region of Ethiopia.Agric. Food Secur.7:62. 10.1186/s40066-018-0214-0
26
GOU (2003). The national forestry and tree planting act.Uganda: Uganda Legal Information Institute.
27
Hill R. C. Griffiths W. E. Lim G. C. (2018). Principles of econometric, 5th Edn. Hoboken, NJ: John Wiley & Sons, Inc.
28
Ho D. Imai K. King G. Stuart E. A. (2011). MatchIt: Nonparametric preprocessing for parametric causal inference.J. Stat. Softw.421–28.
29
Hsiao S. S. Ross C. Hill C. M. Wallace G. E. (2013). Crop-raiding deterrents around Budongo forest reserve: An evaluation through farmer actions and perceptions.Oryx47569–577. 10.1017/S0030605312000853
30
Jeary K. Kandel M. Martiniello G. Twongyirwe R. (2018). “Conservation and agriculture: Finding an optimal balance?,” in Conservation and development in Uganda, edsSandbrookC.CavanaghC. J.TumusiimeD. M. (London: Routledge), 17.
31
Johnson C. A. (2007). Social capital and the search for information: Examining the role of social capital in information seeking behavior in Mongolia.J. Am. Soc. Inf. Sci. Technol.58883–894. 10.1002/asi.20561
32
Kassie G. W. Kim S. Fellizar F. P. (2017). Determinant factors of livelihood diversification: Evidence from Ethiopia.Cogent Soc. Sci.31–16. 10.1080/23311886.2017.1369490
33
Kazoora C. Irumba D. Smith N. Mutamba M. Nkabiheebwa P. Katumba G. et al (2019). A review of collaborative forest management in Uganda: Final report.Uganda: National Forestry Authority.
34
Keele L. J. (2014). rbounds: Perform Rosenbaum bounds sensitivity tests for matched and unmatched data. R package version 2.1.
35
Khatun D. Roy B. C. (2012). Rural livelihood diversification in West Bengal: Determinants and constraints.Agric. Econ. Res. Rev.25115–124.
36
Kimengsi J. N. Mukong A. K. Balgah R. A. (2020). Livelihood diversification and household well- being: Insights and policy implications for forest- based communities in cameroon.Soc. Nat. Resour.33876–895. 10.1080/08941920.2020.1769243
37
Kimengsi J. N. Pretzsch J. Kechia M. A. Ongolo S. (2019). Measuring livelihood diversification and forest conservation choices: Insights from rural Cameroon.Forests10:81. 10.3390/f10020081
38
Krejcie R. V. Morgan D. W. (1970). Determining sample size for research activities.Educ. Psychol. Meas.30607–610. 10.1177/001316447003000308
39
Loison A. S. (2015). Rural livelihood diversification in Sub-Saharan Africa: A literature review.J. Dev. Stud.511125–1138. 10.1080/00220388.2015.1046445
40
Loison A. S. Bignebat C. (2018). Patterns and determinants of household income diversification in rural Senegal and Kenya.J. Poverty Alleviation Int. Dev.893–126.
41
Mawa C. Babweteera F. Tumusiime D. M. (2020b). Conservation Outcomes of Collaborative Forest Management in a Medium Altitude Semideciduous Forest in Mid-western Uganda.J. Sustain. For.41461–480. 10.1080/10549811.2020.1841006
42
Mawa C. Babweteera F. Tabuti J. R. S. Tumusiime D. M. (2020a). Changes in vegetation characteristics following a decade of community forest management in mid-western Uganda.Int. For. Rev.22323–338. 10.1505/146554820830405636
43
Mawa C. Babweteera F. Tumusiime D. M. (2022). Livelihood outcomes after two decades of co-managing a state forest in Uganda.For. Policy Econ.135:102644. 10.1016/j.forpol.2021.102644
44
Mawa C. Tumusiime D. M. Babweteera F. (2021). Are community forests delivering livelihood benefits? Insights from Uganda.For. Trees Livelihoods30133–150. 10.1080/14728028.2021.1904010
45
MFPED (2015). Second national development plan (NDP II) 2015/16-2019/20.Uganda: Ministry of Finance, Planning and Economic Development.
46
MFPED (2020). Third national development plan (NDP III) 2020/21 – 2024/25.Uganda: National Planning Authority.
47
NPA (2013). Uganda vision 2040.National Planning Authority: Kampala.
48
Park S.-H. Yeo-Chang Y. (2021). Impact of collaborative forest management on rural livelihood: A case study of maple sap collecting households in South Korea.Sustainability13:1594. 10.3390/su13041594
49
R Core Team (2020). R: A language and environment for statistical computing.Vienna: R Foundation for Statistical Computing.
50
Rosenbaum P. R. (2010). Design of observational studies.New York, NY: Springer.
51
Sabyrbekov R. (2019). Income diversification strategies among pastoralists in Central Asia: Findings from Kyrgyzstan.Pastoralism9:14. 10.1186/s13570-019-0152-x
52
Scoones I. (1998). Sustainable rural livelihoods: A framework for analysis, development.Brighton: IDS.
53
Senganimalunje T. C. Chirwa P. W. Babalola F. D. (2020). Exploring the role of forests as natural assets in rural livelihoods and coping strategies against risks and shocks in Dedza East, Malawi.J. Sustain. For.41503–525. 10.1080/10549811.2020.1745654
54
Shiyani R. L. Pandya H. R. (1998). Diversification of agriculture in Gujarat: A spatio-temporal analysis.Indian J. Agric. Econ.53627–639.
55
Taylor J. E. Adelman I. (2003). Agricultural household models: Genesis, evolution, and extensions.Rev. Econ. Househ.133–58. 10.1023/A:1021847430758
56
Tobin J. (1958). Estimation of relationships for limited dependent variables.Econometrica3124–36. 10.2307/1907382
57
Torres B. Günter S. Acevedo-Cabra R. Knoke T. (2018). Livelihood strategies, ethnicity and rural income: The case of migrant settlers and indigenous populations in the Ecuadorian Amazon.For. Policy Econ.8622–34. 10.1016/j.forpol.2017.10.011
58
Tumusiime D. M. Eilu G. Tweheyo M. Babweteera F. (2010). Wildlife snaring in budongo forest reserve, Uganda.Hum. Dimens. Wildl.15129–144. 10.1080/10871200903493899
59
Tumusiime D. M. Vedeld P. Gombya-Ssembajjwe W. (2011). Breaking the law? Illegal livelihoods from a Protected Area in Uganda.For. Policy Econ.13273–283. 10.1016/j.forpol.2011.02.001
60
Walelign S. Z. (2016). Livelihood strategies, environmental dependency and rural poverty: The case of two villages in rural Mozambique.Environ. Dev. Sustain.18593–613. 10.1007/s10668-015-9658-6
61
Walelign S. Z. Jiao X. (2017). Dynamics of rural livelihoods and environmental reliance: Empirical evidence from Nepal.For. Policy Econ.83199–209. 10.1016/j.forpol.2017.04.008
62
Wan J. Li R. Wang W. Liu Z. Chen B. (2016). Income diversification: A strategy for rural region risk management.Sustainability8:1064. 10.3390/su8101064
63
Webber A. D. Hill C. M. Reynolds V. (2007). Assessing the failure of a community-based human-wildlife conflict mitigation project in Budongo Forest Reserve, Uganda.Oryx41177–184. 10.1017/S0030605307001792
64
Wei D. Chao H. Yali W. (2016). Role of income diversification in reducing forest reliance: Evidence from 1838 rural households in China.J. For. Econ.2268–79. 10.1016/j.jfe.2015.12.002
65
Wicander S. Coad L. (2018). Can the provision of alternative livelihoods reduce the impact of wild meat hunting in West and Central Africa?.Conserv. Soc.16441–458. 10.4103/cs.cs_17_56
66
Wooldridge J. M. (2019). Introductory econometrics: A modern approach, 7th Edn. Boston, MA: Cengage Learning.
67
Žakevičiūtė R. (2019). Rural livelihood diversification: A solution for poverty in the post-soviet rural Baltic states?.Sociol. Rural.59560–580. 10.1111/soru.12259
Summary
Keywords
livelihood diversification, collaborative forest management, community forestry, livelihood strategies, community-based forest management
Citation
Mawa C, Tumusiime DM, Babweteera F, Okwir E and Tabuti JRS (2023) Community-based forest management promotes survival-led livelihood diversification among forest-fringe communities in Uganda. Front. For. Glob. Change 6:1125247. doi: 10.3389/ffgc.2023.1125247
Received
16 December 2022
Accepted
26 April 2023
Published
19 May 2023
Volume
6 - 2023
Edited by
Renata Sõukand, Ca’ Foscari University of Venice, Italy
Reviewed by
Giulia Mattalia, Ca’ Foscari University of Venice, Italy; Yibeltal Walle, University of Gondar, Ethiopia; Carsten Schusser, TU - Dresden, Germany
Updates
Copyright
© 2023 Mawa, Tumusiime, Babweteera, Okwir and Tabuti.
This is an open-access article distributed under the terms of the Creative Commons Attribution License (CC BY). The use, distribution or reproduction in other forums is permitted, provided the original author(s) and the copyright owner(s) are credited and that the original publication in this journal is cited, in accordance with accepted academic practice. No use, distribution or reproduction is permitted which does not comply with these terms.
*Correspondence: Christopher Mawa, mawachris@gmail.com, christopher.mawa@mak.ac.ug
†Present address: David Mwesigye Tumusiime, Makerere University Biological Field Station (MUBFS), College of Agricultural and Environmental Sciences, Makerere University, Kampala, Uganda
Disclaimer
All claims expressed in this article are solely those of the authors and do not necessarily represent those of their affiliated organizations, or those of the publisher, the editors and the reviewers. Any product that may be evaluated in this article or claim that may be made by its manufacturer is not guaranteed or endorsed by the publisher.