 Aleksei Trubin1*
 Giorgi Kozhoridze1Khodabakhsh Zabihi1
 Roman Modlinger1
 Vivek Vikram Singh1Peter Surový1Rastislav Jakuš1,2
- 1Faculty of Forestry and Wood Sciences, Czech University of Life Sciences Prague, Prague, Czechia
- 2Institute of Forest Ecology, Slovak Academy of Sciences, Zvolen, Slovakia
Climate change-related acute or long-term drought stress can weaken forest ecosystems and result in widespread bark beetle infestations. Eurasian spruce bark beetle (Ips typographus L.) infestations have been occurring in Norway spruce [Picea abies (L.) Karst.]-dominated forests in central Europe including the Czechia. These infestations appear regularly, especially in homogeneous spruce stands, and the impact varies with the climate-induced water stress conditions. The removal of infected trees before the beetles leave the bark is an important step in forest pest management. Early identification of susceptible trees to infestations is also very important but quite challenging since stressed tree-tops show no sign of discolouration in the visible spectrum. We investigated if individual spectral bandwidths or developed spectral vegetation indices (SVIs), can be used to differentiate non-attacked trees, assumed to be healthy, from trees susceptible to attacks in the later stages of a growing season. And, how the temporal-scale patterns of individual bands and developed SVIs of susceptible trees to attacks, driven by changes in spectral characteristics of trees, behave differently than those patterns observed for healthy trees. The multispectral imagery from the PlanetScope satellite coupled with field data were used to statistically test the competency of the individual band and/or developed SVIs to differentiate two designated classes of healthy and susceptible trees. We found significant differences between SVIs of the susceptible and healthy spruce forests using the Enhanced Vegetation Index (EVI) and Visible Atmospherically Resistant Index (VARI). The accuracy for both indices ranged from 0.7 to 0.78; the highest among all examined indices. The results indicated that the spectral differences between the healthy and susceptible trees were present at the beginning of the growing season before the attacks. The existing spectral differences, likely caused by water-stress stimuli such as droughts, may be a key to detecting forests susceptible to early infestations. Our introduced methodology can also be applied in future research, using new generations of the PlanetScope imagery, to assess forests susceptibility to bark beetle infestations early in the growing season.
1. Introduction
Forests worldwide are becoming increasingly more sensitive to dieback due to physiological stress driven by heat and drought (McDowell et al., 2008), which is frequently coupled with increased growth of forest insect pests (Allen et al., 2010; DeRose et al., 2013). Several studies found two most significant abiotic factors, wind and drought, have been impacting the health of spruce forests in Europe, (e.g., Komonen et al., 2011; Kärvemo et al., 2014; Marini et al., 2017). However, the physiological processes underlying conifer survival and mortality under drought conditions are yet to be fully understood (McDowell et al., 2008). Conifers have a wide range of drought tolerance; however, prolonged water deficit frequency in trees may significantly increase their susceptibility to bark beetle infestation (Krokene, 2015). Critical environmental factors thought to expedite bark beetle outbreaks are the combination of more frequent droughts and warmer temperatures, directly impacting insect population dynamics and host plant development and resistance (Jactel et al., 2012; Weed et al., 2013; Bentz and Jönsson, 2015; Meddens et al., 2015; Raffa et al., 2015). For example, prolonged dry periods accompanied by high temperatures might decrease tree water supplies and make them more vulnerable to Ips typographus L. attacks (Wermelinger, 2004; Netherer et al., 2015). Plant defense chemicals may rise during periods of moderate drought whereas these chemicals may decrease during prolonged severe drought (Gely et al., 2020).
One of Eurasia’s most economically significant forest pests (Wermelinger, 2004) is the European spruce bark beetle (I. typographus), which is severely damaging coniferous forests in the Palearctic region (Christiansen and Bakke, 1988).
For most bark beetle species, the females deposit their eggs inside the bark and intracortical layer of trees, consisting of phloem and cambium zone tissues, where larvae develop (Keeling, 2016). The first generation of bark beetle exits the bark when the accumulated thermal sum on average passes a threshold for several weeks (Öhrn et al., 2014), highly variable on regional- and continental-scales, starting from the early growing season (May to October; Zabihi et al., 2021b).
Factors such as tree aging and density, and drought effects were found to be important in weakening trees’ resistance to bark beetle attacks (Christiansen and Bakke, 1988; Raffa, 1988; Fettig et al., 2007; Bentz et al., 2010). The tree- and stand-level factors such as tree vigor and size and stand density are critical in the endemic level of infestation at which infestation occurs locally (Raffa and Berryman, 1983; Simard et al., 2012). However, landscape-level factors facilitate the transition of infestation from a local eruption toward regional outbreaks (Wallin and Raffa, 2004; Raffa et al., 2008; Simard et al., 2012). Some of the influential landscape-level variables on beetle outbreaks were found to be favorable climatic conditions, adjacency to the incipient populations, surface terrain, an abundance of mature host trees, and former disturbances, such as fire and outbreaks (Aukema et al., 2006). The spread of outbreaks was also found to be autocorrelated within the spatial- and temporal-scales despite the host tree vigor (Aukema et al., 2006, 2008; Simard et al., 2012).
Recent bark beetle outbreaks in spruce-dominated forests have significantly outperformed previously known frequencies and consequences, despite their crucial role in forest regeneration and succession (Bače et al., 2015; Zeppenfeld et al., 2015; Zabihi et al., 2021a). The number of I. typographus generations per year may increase due to climate change (i.e., increased temperature) which could also drive further outbreaks than previously documented (Hlásny et al., 2011; Marini et al., 2013). For example, at least two generations and sister broods were found to occur in central European forests due to favorable summer temperatures (Netherer et al., 2019). The most devastating I. typographus outbreak in Central Europe to date was found to be in the Czechia from 2014 to 2015, which was initialized and led mainly by climatic factors (Hlásny et al., 2021). Due to the shift of climatic conditions in Europe, with more extreme weather anomalies, such as severe droughts, storms, floods (Lindner et al., 2010), and intense heat, mortality for most tree species in forests, including spruce, is expected to rise (Hlásny et al., 2022).
Precise up-to-date spatial information on the presence and dynamics of infestations is essential to make an efficient plan for the removal and sanitation of infested trees, aiming to keep the remaining forest intact. Gathering such data in large areas with limited access is still challenging (Stereńczak et al., 2019). The spatio-temporal dynamics of the bark beetle population have been investigated in Europe, (e.g., Kärvemo et al., 2014; Havašová et al., 2017; Mezei et al., 2017), and in North America, (e.g., Meddens and Hicke, 2014; Senf et al., 2015). However, the success in detecting and mapping tree mortality related to bark beetle infestations highly depends on the forest composition and structure (Koontz et al., 2021). For example, the detection and monitoring of infested forest stands composed only of coniferous host species are rather straightforward. In such stands or forests, newly infested trees appear mostly in large and easily definable groups as bark beetles continue to attack mostly nearby infested trees (Lausch et al., 2011). One of the most effective ways to track vegetation stress is using remote sensing (RS) data (Lawley et al., 2016). Multispectral aerial and satellite imagery has been successfully used for mapping insect outbreaks and other forest disturbances (Väisänen and Heliövaara, 1994; White et al., 2007; Long and Lawrence, 2016). To characterize tree health status, the integrated approach of using RS data from different sources, such as imagery acquired by active (e.g., synthetic aperture radar; SAR) and passive sensors (e.g., multi- and hyper-spectral imagery) could be applied (Niemann et al., 2015). For example, Ortiz et al. (2013), Abdullah et al. (2019a), and Ali et al. (2021) used satellite imagery, and Ortiz et al. (2013) used X-band SAR, to detect early infestations.
The availability of RS data at various spectral, temporal, and spatial resolutions plays an important role in detecting forest infestation phenomena (Zabihi et al., 2021b). For example, coarse-resolution Landsat imagery (Meddens et al., 2013), medium-resolution SPOT-5 and Sentinel-2 imagery (Abdullah et al., 2019a), and fine-resolution aerial photography (Minařík and Langhammer, 2016; Brovkina et al., 2018; Klouček et al., 2019; Abdollahnejad and Panagiotidis, 2020) have been used to map infested trees. PlanetScope imagery with a spatial resolution of 3.7 meters (Planet Labs, Inc, 2022), allows better tracking of small changes in the land cover within a relatively broad area. The daily image acquisition of the PlanetScope (at the nadir) allows prompt monitoring of forests susceptible to beetle attacks. All these specifications of the PlanetScope help to avoid or minimize labor-intensive visual surveys and/or costly UAVs- or aircrafts-use to detect susceptible- or already attacked trees. The PlanetScope satellite initially launched in 2014, and its second generation that we used, known as Dove-R or PS2.SD, provides imagery at four spectral bands, including Blue, Green, Red, and near-infrared (NIR) wavelengths (Planet Labs, Inc, 2022).
Most individual bandwidths [e.g., visible, red-edge, NIR, and shortwave-infrared (SWIR)] and several SVIs that were developed, were found to be useful for detecting changes in needle pigments, including chlorophyll content, degree of greenness, and water content due to bark beetle attacks (Zabihi et al., 2021b). In general, beetle-induced water-stressed trees reflect a higher amount of visible light than healthy trees (Ortiz et al., 2013). The severe stress in infested trees causes chlorophyll loss that consequently reduces the absorption rate of visible light by photosynthetically active pigments (Blackburn, 1998, 2006; Carter and Knapp, 2001; Mullen, 2016; Mullen et al., 2018). Similarly, water-stressed trees reflect more red-edge light than healthy trees due to a decrease in chlorophyll a contents (Ortiz et al., 2013), and changes in the structure of spongy mesophyll (Mullen et al., 2018). The changes in the structure of spongy mesophyll, so-called foliage desiccation, also reduce the absorption rate of NIR wavelengths in water-stressed infested trees (Ortiz et al., 2013; Mullen et al., 2018), and a similar pattern was observed for SWIR wavelengths (Immitzer et al., 2016).
Some of the top-ranked indices used to represent changes in needle pigments and greenness were found to be Red-Edge NDVI (RENDVI or NDVI705; Ortiz et al., 2013), and Normalized Difference Red-Edge (NDRE 2 and 3; Abdullah et al., 2019a,b). Disease-Water Stress Index (DWSI), Normalized Difference Water Index (NDWI), Leaf Water Content Index (LWCI), Ratio Drought Index (RDI), and Moisture Stress Index (MSI) were found to be top-ranked indices, used in former research (Abdullah et al., 2019a,b; Yang, 2019) to detect changes in leaf water contents due to bark beetle attacks (Zabihi et al., 2021b). A normalized distance red and shortwave infrared (NDRS; Huo et al., 2021), developed based on red and SWIR wavelengths, was found to be a useful index to estimate forest susceptibility to bark beetle attacks in April, or to detect infested trees during the attacks from May to October. However, changes in forest parameters affect the reflectance of longer wavelengths such as SWIR, greater than shorter wavelengths such as visible lights in healthy coniferous forests (Rautiainen et al., 2018). Those forest parameters include forest structure, needle age and intracellular structure of air-to-cell wall interfaces, moisture content of forest floors, and tree physiological changes over the growing seasons (Rautiainen et al., 2018; Zabihi et al., 2021b). Thus, SWIR-dependent indices may propagate uncertainty to some extent in the model developments and validations (Zabihi et al., 2021b). In a recent review by Zabihi et al. (2021b), using visible bands such as RGB and red-edge (a bandwidth close to NIR) were recommended to develop SVIs in order to map the early stage of bark beetle infestations. We based our study on the assumption that some trees may be more susceptible to I. typographus attacks, than others, in uninfested forests. And, those trees can be detected/predicted using SVIs derived from high spatial and multispectral resolution imagery acquired by PlanetScope satellite. We also assumed non-attacked trees, within the vicinity of attacked trees, as healthy trees over a growing season.
We proposed to investigate if trees susceptible to beetle attacks can be detected before or early in the growing season. If so, what spectral bands and/or SVIs, developed using individual wavelengths, could be used to indicate significant differences between healthy trees and those susceptible to attacks. We eventually aim to develop a methodology for using remotely-sensed and ground-truth data to characterize the health status of Norway spruce on a temporal scale before and during the course of infestations.
2. Materials and methods
2.1. Study area
The study was conducted in forests, approximately 50 km southeast of Prague (Czechia or the Czech Republic) (Figure 1), owned and managed by the Czech University of Life Sciences (CULS). The CULS forests cover a total area of ∼ 5,700 ha, lie in the temperate climate zone. The mean annual temperature and sum of precipitation ranged 7–7.5°C and 600–650 mm, respectively, with a vegetation period lasts 150–160 days (Tolasz et al., 2007). In recent years, periodic droughts negatively affected the vitality of forests (Remeš, 2017). The forest stands consist of 70% conifers, mainly spruce (50%) followed by pine (16%), and the rest for other species. In terms of broadleaved trees (the remaining 30% cover), beech covers the most, 14%, followed by oak at 10%, and the rest for other species. If the area was not managed by the CULS, beech and oak may have been dominated, followed by pine and spruce trees, similar to nearby unmanaged forest composition. The CULS forests are managed using a clearcutting silvicultural system in a combination with the shelterwood system (Remeš, 2017). Due to the extreme drought in 2018, the whole area was affected by the bark beetle outbreak, mainly by I. typographus; however, other species such as I. duplicatus, I. amitinus, and Pityogenes chalcographus may have been infesting some local spots (Hlásny et al., 2021). The forest management strategy has been recently focusing on sanitary logging to promptly remove infested trees, as soon as observed.
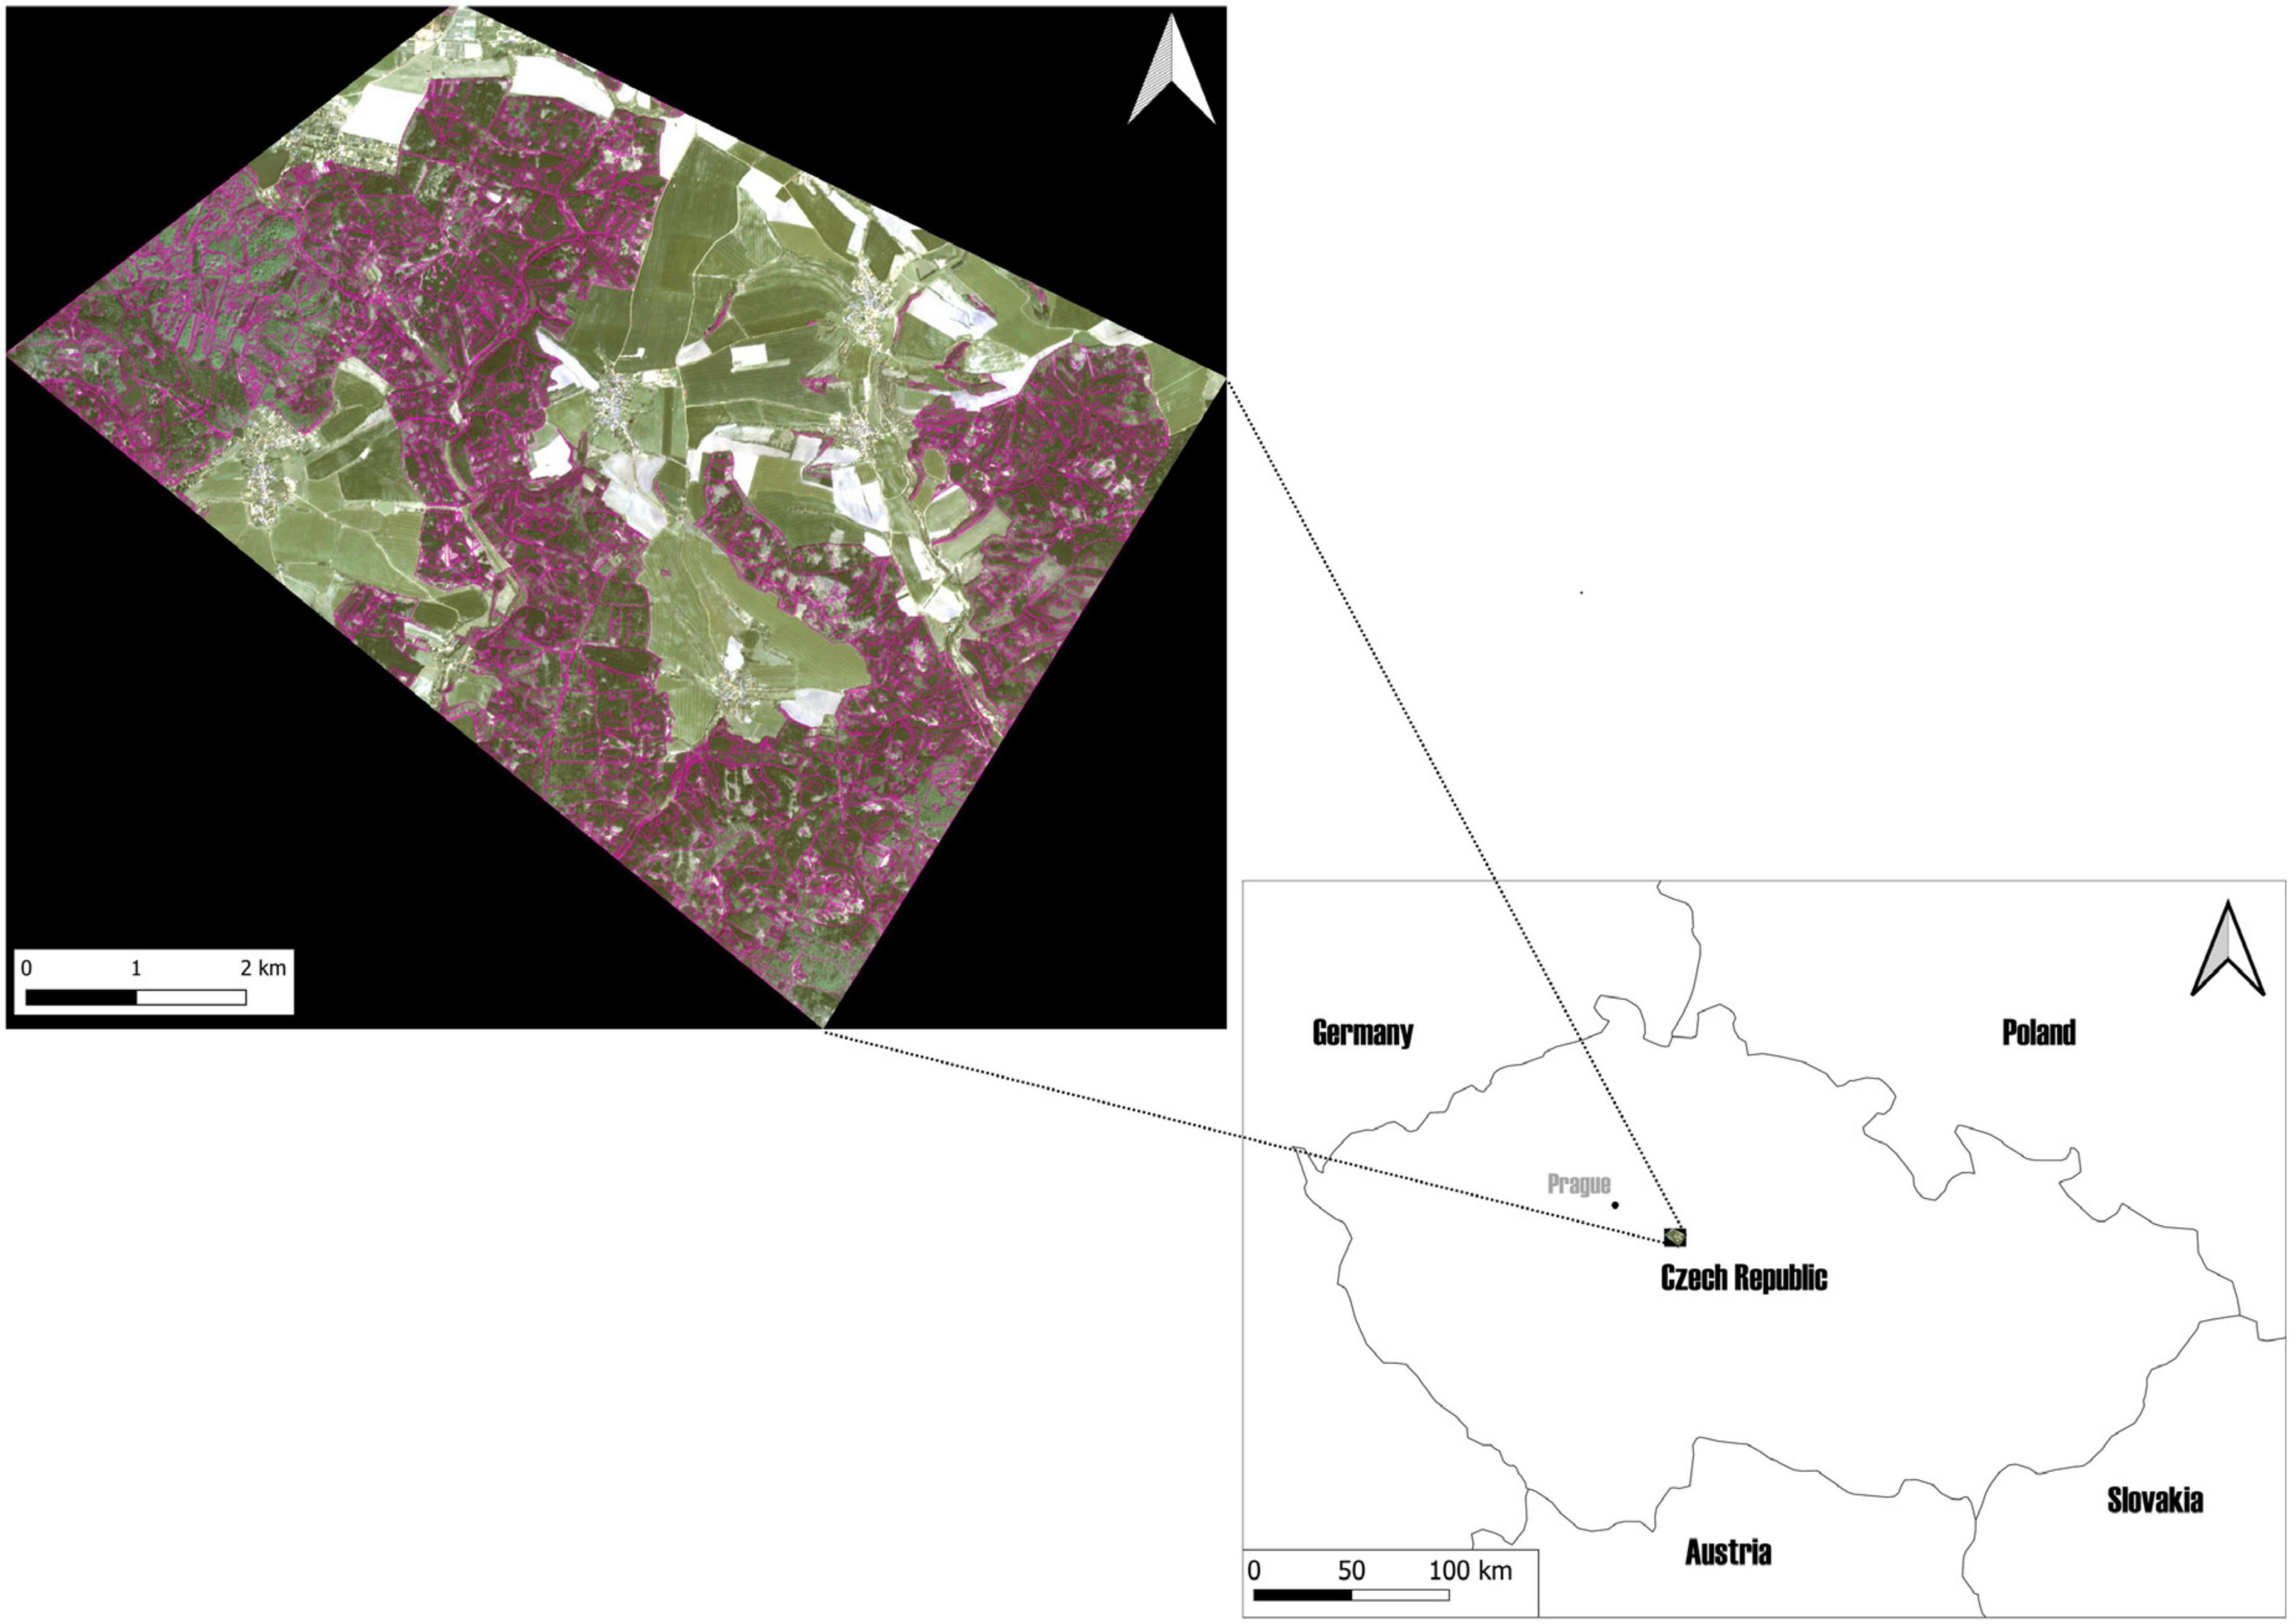
Figure 1. The study area, located in The School Forest Enterprise in Kostelec nad Černými lesy, in the Czechia. The forest management layer, cropped by the border of the study area, is marked in purple on the RGB true-color composite of planet imagery (9 April 2020).
2.2. Satellite data acquisition and processing
We used 22 PlanetScope imagery [instrument–Dove Classic (PS2)] from April 2 to 5 September 2020 (Table 1). Only cloud-free images were used for further analysis; the image acquired on Day 145 was excluded due to having cloud cover. All imageries were downloaded in the GeoTIFF format and surface reflectance data type (harmonized to Sentinel-2 for consistent radiometry) was selected as the initial product option. Every image had four bands including Red, Green, Blue (RGB), and Near Infrared (NIR) with a spatial resolution of 3 m.
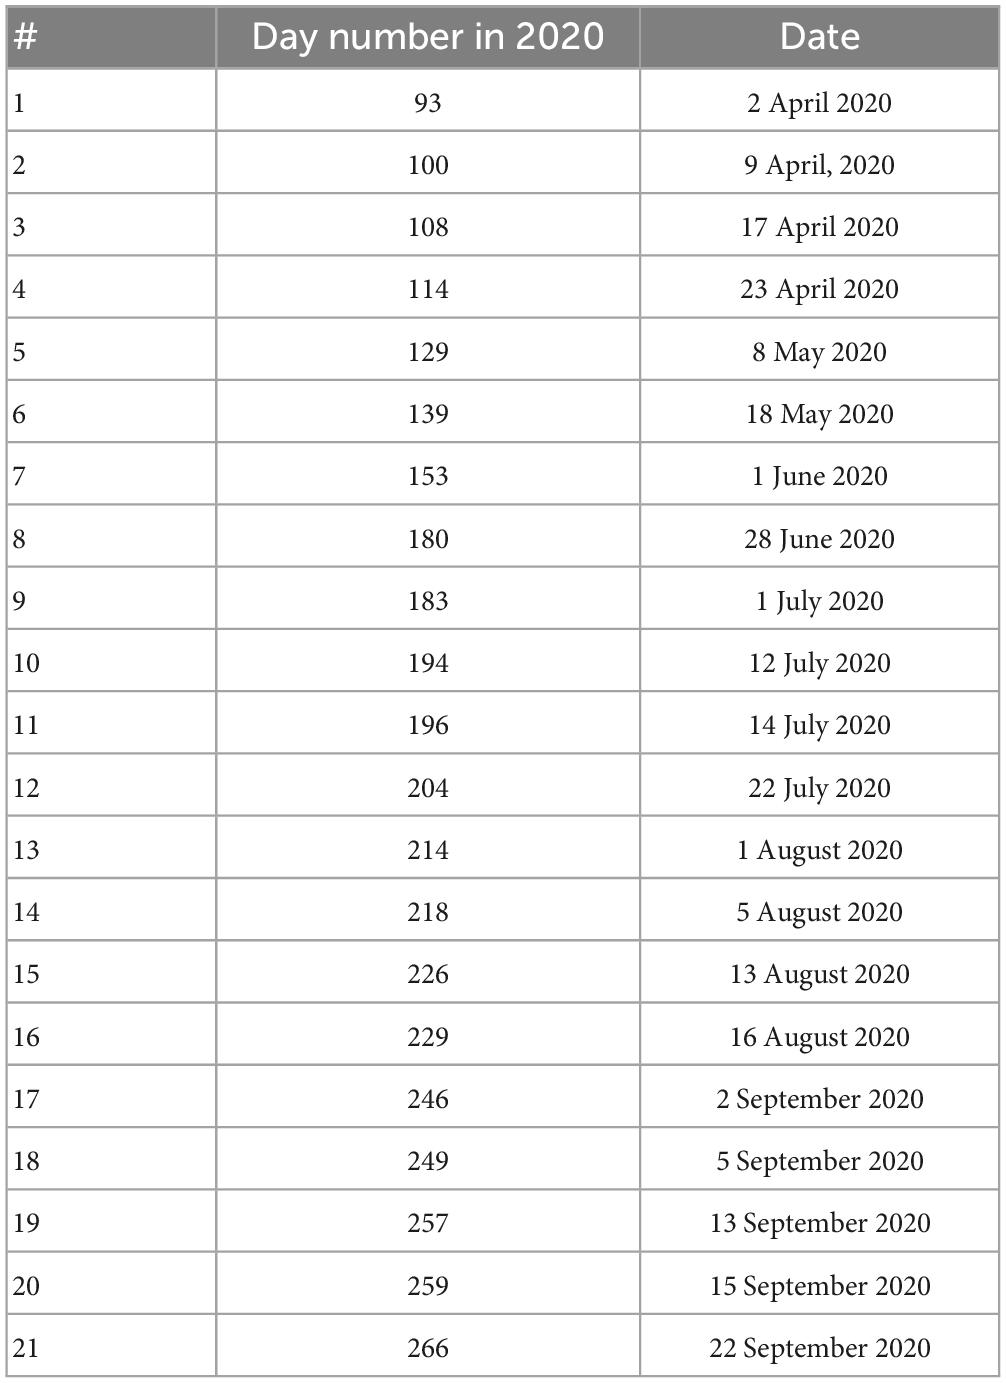
Table 1. Day number in 2020 with the associated dates of planet images used; imagery after July 14 were removed at the later stage of analyses because of having clearcuts due to bark beetle attacks.
For each acquisition in the time series (Table 1), we calculated 23 SVIs (Table 2) using the Raster Calculator plugin in QGIS version 3.16.16 (QGIS Development Team, 2009).
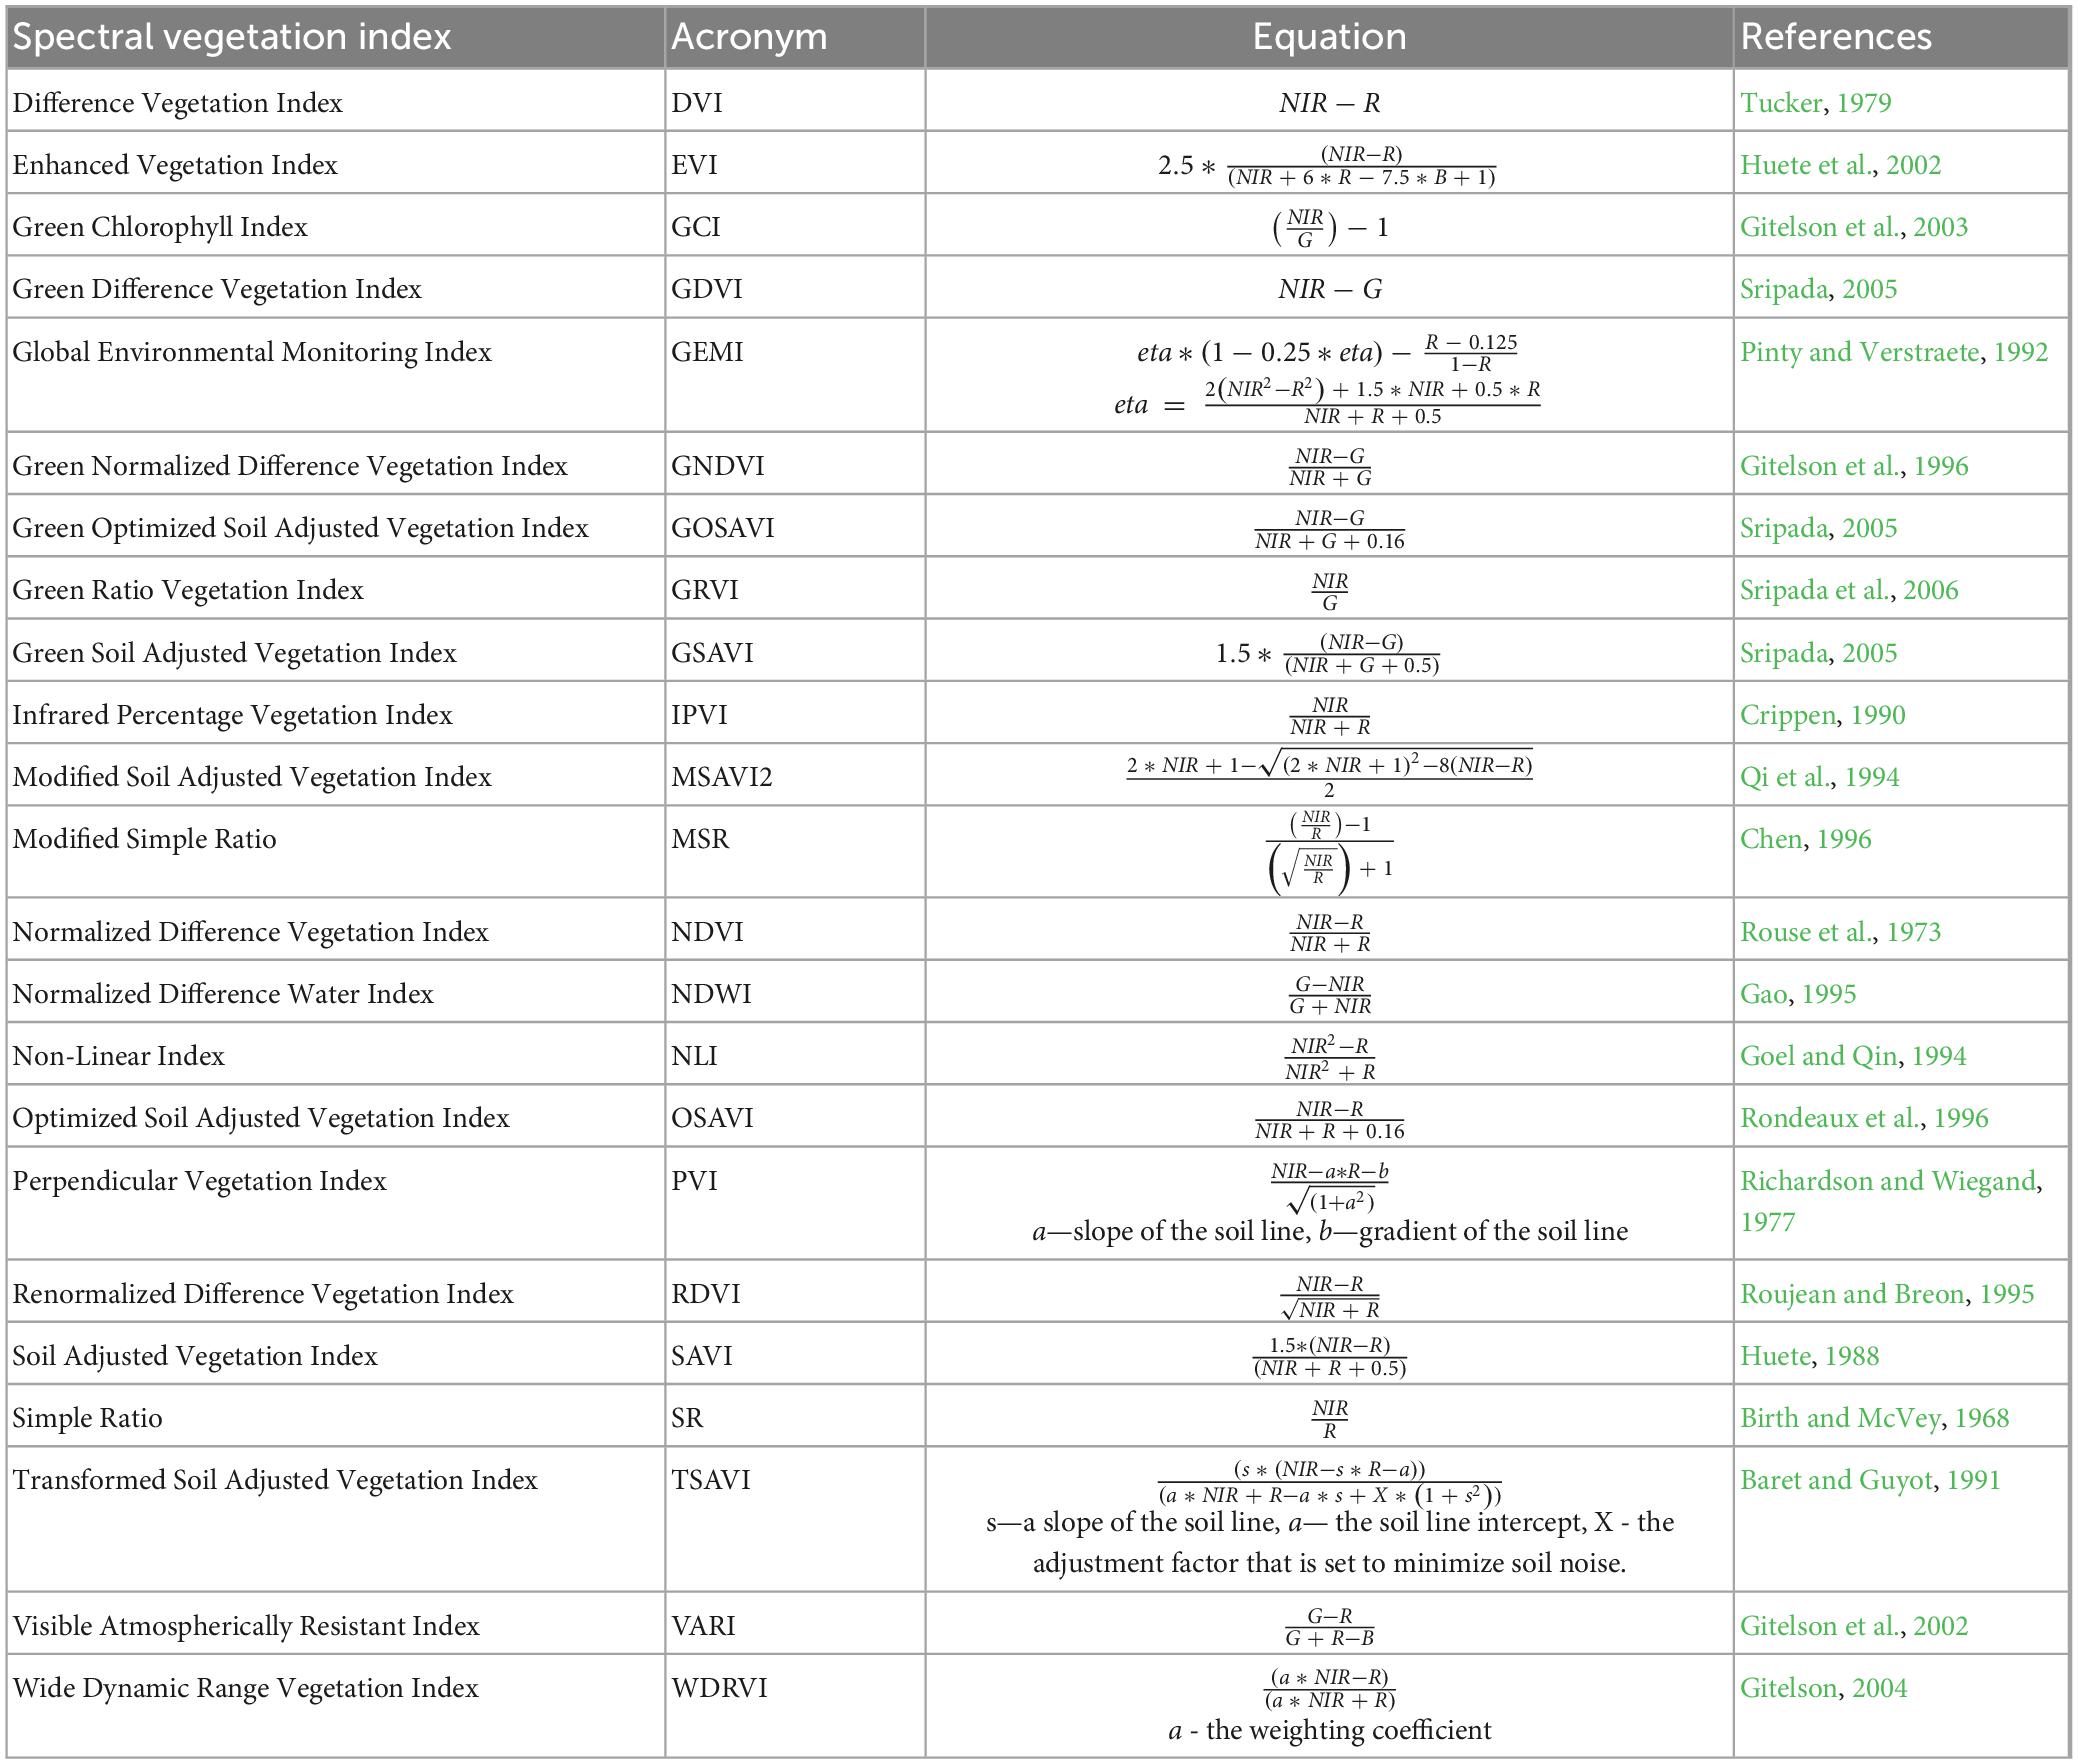
Table 2. Spectral vegetation indices (SVIs), their acronyms, equations, and publishers, used to detect trees susceptible to bark beetle attack.
The individual four bands and the SVIs computed from Table 2 were used to differentiate two defined classes. These two classes were non-attacked trees during our year of study, assumed and considered as the “Healthy” class, and trees were attacked in the later stages of the growing season, assumed and considered as the “Susceptible” class.
All individual bands and SVIs (Table 2) developed using individual bands, were merged into a single GeoTIFF file to make a cube image of 27-bands, for further statistical analysis.
2.3. GIS data collection and validation
The spatial position (X- and Y-coordinates) of attacked trees, named as susceptible trees, were recorded by foresters and researchers using the ArcGIS Collector application developed and installed on smartphones. The date of the attack, the name of the bark beetle species, and the number of attacked trees per day were also recorded using the ArcGIS Collector app. Foresters have been detecting early infestations on a weekly basis in their designated areas. Researchers from the EXTEMIT-K project were also recording the same datasets around six experimental plots designed and established by the EXTEMIT-K project. Researchers used both visual observations and detection by a sniffer dog to detect early-attacked trees within the 500-m zone around the experimental plots (Vošvrdová et al., 2023).
The EXTEMIT-K project was proposed to conduct research experiments aiming to provide potential science-based approaches to deal with current and future challenges of protecting forest ecosystems in the Czechia. The bark beetle infestations and drought effects on spruce trees and beetle activities were found to be the core challenges, and have been investigated by the research team.
Every experimental plot consisted of four subplots, with 8–10 neighbor trees selected within (Özçelik et al., 2022; Stříbrská et al., 2022). All the field survey data were stored and visualized in the Online Web version of ArcGIS. This allowed us to export field survey data for further analyses in QGIS at the end of the season.
The spatial positions of total sample points of 61 areas with attacked trees, at the later stages of the growing season, were used to create polygons/boundaries of these trees, which were assumed as susceptible to attacks before and during the first half of the growing season.
On the last PlanetScope imagery in the dataset (September 22), the K-means clustering algorithm was performed to detect unbiased, square-like (pixelated) borders of 61 objects, based on the clear-cut year in 2020 detection cluster (which has different spectral features, comparing to forest stand) and points locations of areas with attacked trees using the open-source Orfeo ToolBox (OTB) package (version 7.2.0; Grizonnet et al., 2017). Sizes and shapes of the 61 areas, identified as clear-cuts on the last imagery in the dataset were used for further analysis on the other imageries. We overlaid each PlanetScope image with very high spatial resolutions (20-cm) UAV orthophotos to ensure the accurate spatial positioning of target objects. The vectorization of 61 boundaries was visually validated to avoid any error in tree positions, collected by the ArcGIS collector app, in addition to potential misclassified areas among trees such as bare soil, using the Poligonize (GDAL) plugin.
We generated a random sampling for the class “Healthy” with similar characteristics found for the class “Susceptible” (Table 3). For example, similarity in the age ranges, percentage of Norway spruce (based on forest management data), sample size, and average area (Table 3). Sixty-one circle-shaped samples with an area of 0.165 ha each in forest management units at the age ranging from 78 to 130 years were randomly selected within the forest management units with 80–100% Norway spruce cover. Based on forest inventory data, spruce cover in the forest management units is more than 80%, therefore we assume that the sample polygons and related spectral signal represent spruce stands.
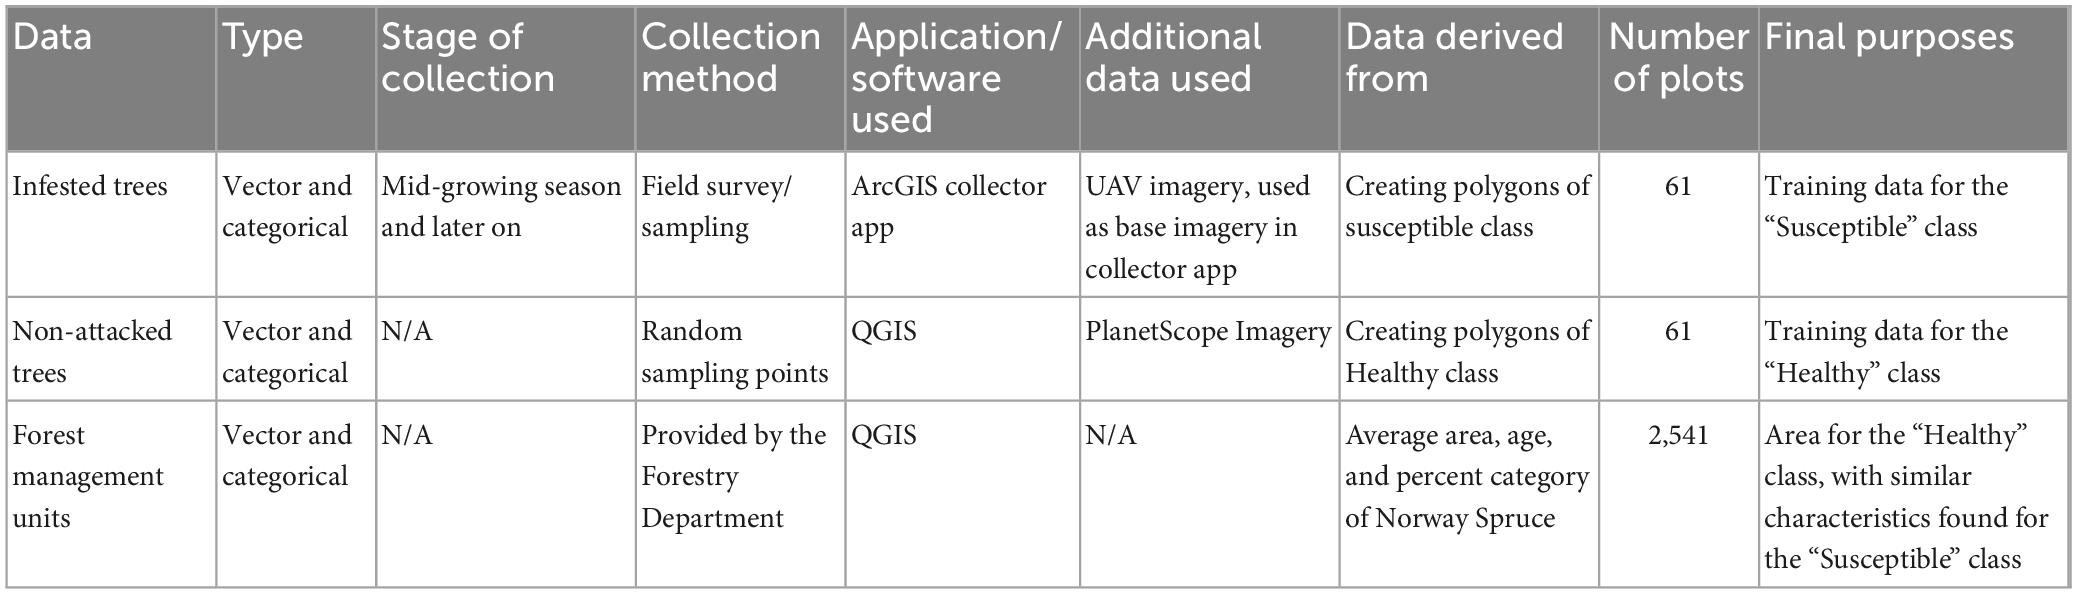
Table 3. List of sampling (training) and ancillary data used, with their types, stage and method of collection, application or software used to drive data from, required for further steps in the statistical analyses and classifications.
2.4. Data cleaning
The sample size of the “Healthy” class (61 trees) was the same for every image, with no need for any data cleaning. For the “Susceptible” class, we initially removed samples with traces of later on logging found on any date of imagery, and thus, we only kept those samples not reaching the start date of the green-attack phase during our temporal-scale analyses. The criteria of having a balanced sample size between two classes of “Healthy” and “Susceptible” trees caused us to exclude the last five dates of imagery from the time-series datasets (all imagery after July 14; Figure 2). However, we kept imagery from days no. 180 to 196, to complete our proposed temporal-scale analyses, even though the sample size for the “Susceptible” class decreased more than twice that of the earlier dates. The data cleaning and plotting were performed in VSCode 1.73.1 in Jupiter Notebook using, Python programming language (ver. 3.8.5; Van Rossum and Drake, 2010), and pandas 1.5.0 and Matplotlib 3.6.0, respectively.
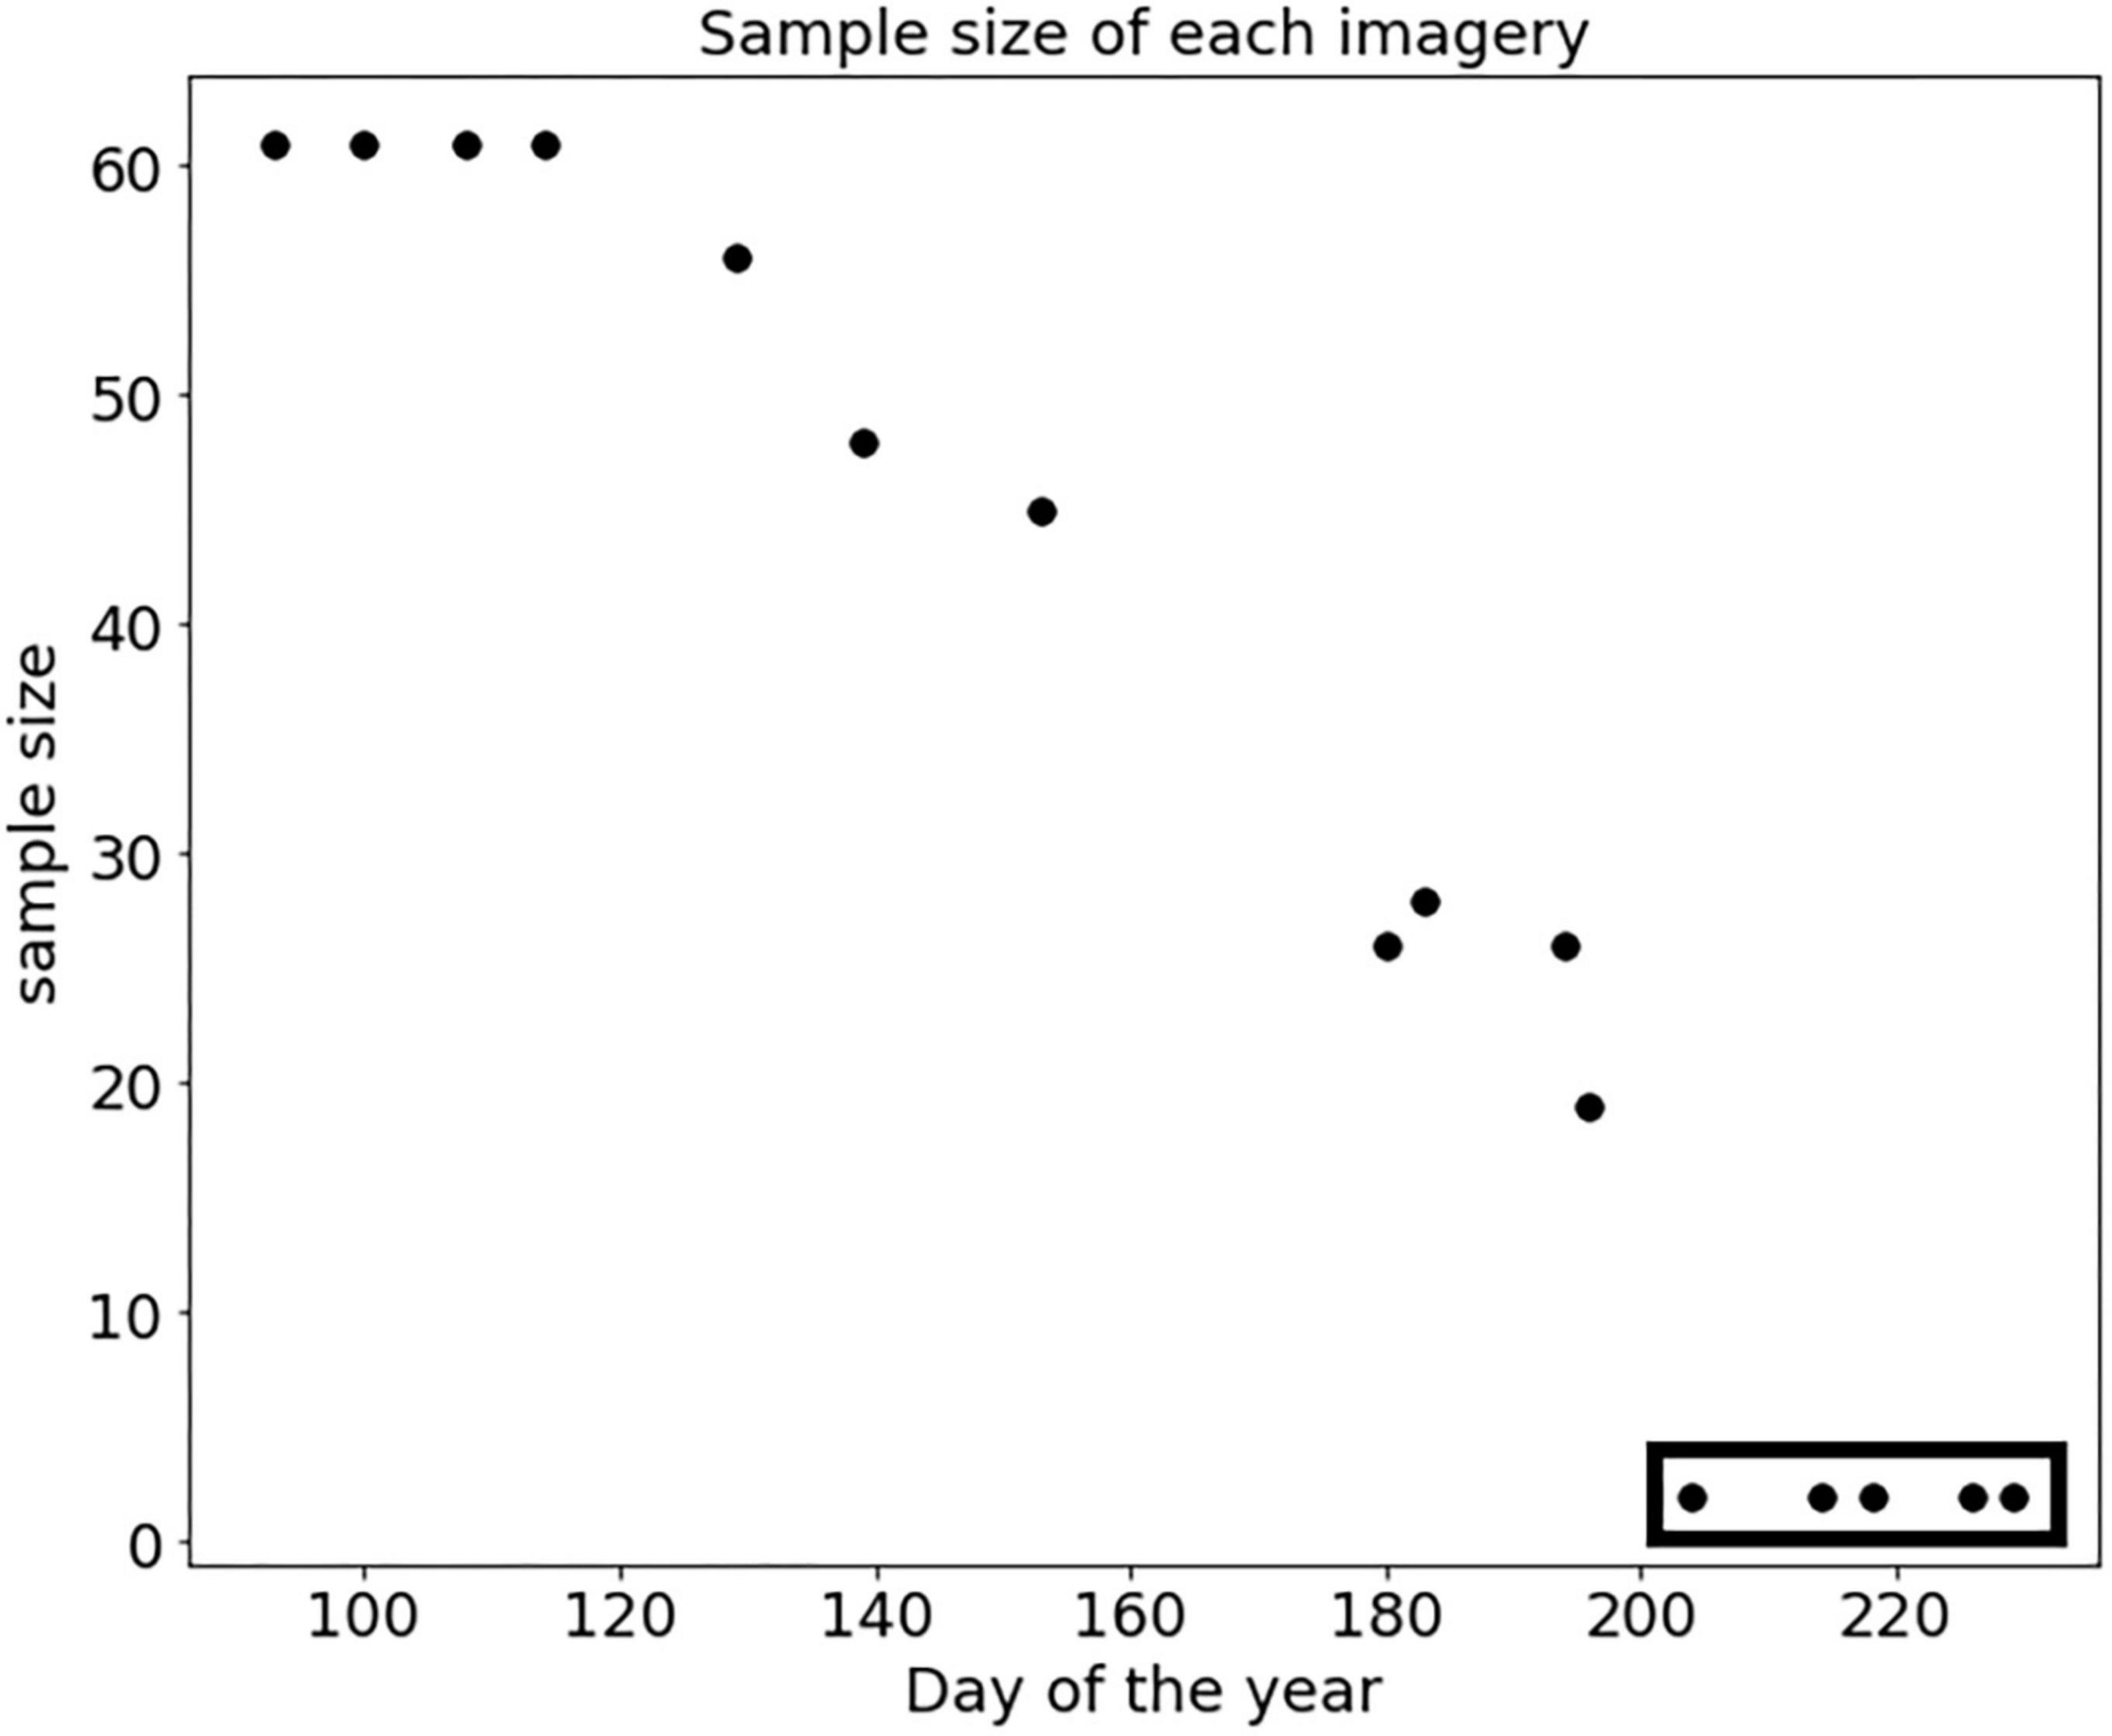
Figure 2. Sample size scatterplot of the time-series dataset of the “Susceptible” class. Five images with a sample size of 2, records after day no. 196 corresponding to July 14, were excluded from the analyses (highlighted in the rectangle).
2.5. Statistical analyses
We extracted the mean value for 4 bands of spectral reflectance and the proposed 23 SVIs (Table 2) for every polygon of the “Healthy” and “Susceptible” class, using the Zonal Statistics-plugin from the OTB package in QGIS.
The Welch’s t-test was used to determine if the means of spectral reflectance of individual bands and developed SVIs for the “Healthy” and “Susceptible” classes were statistically different for each date of imagery, using the SciPy library (ver. 1.7.1; Virtanen et al., 2020).
Linear discriminant analysis (LDA) was used to evaluate the separability of individual bands and/or SVIs to differentiate two classes, using the scikit-learn library (ver. 1.1.2; Pedregosa et al., 2011). The LDA is a supervised classification that uses a linear classifiers algorithm based on the distribution of features (Hastie et al., 2009).
The LDA maximizes the distance among classes and minimizes the variance within classes, and was performed on every band of the 27-bands-cube imagery. The leave-one-out cross-validation accuracy (LOOCV) was performed to examine the overall classification accuracy (CA) of the performed LDA on either individual bands or SVIs of two designated classes.
3. Results
Based on the frequency plot of daily attacks, using the datasets from the ArcGIS Collector app., the emergence and initial attacks of bark beetles on trees were found to be from April 27 to 4 May 2020 (Figure 3). There seemed to be two peaks of beetle swarming and infestations during the growing seasons; the first peak occurred around mid-June and the second peak seemed to be around mid-July to early-August (Figure 3).
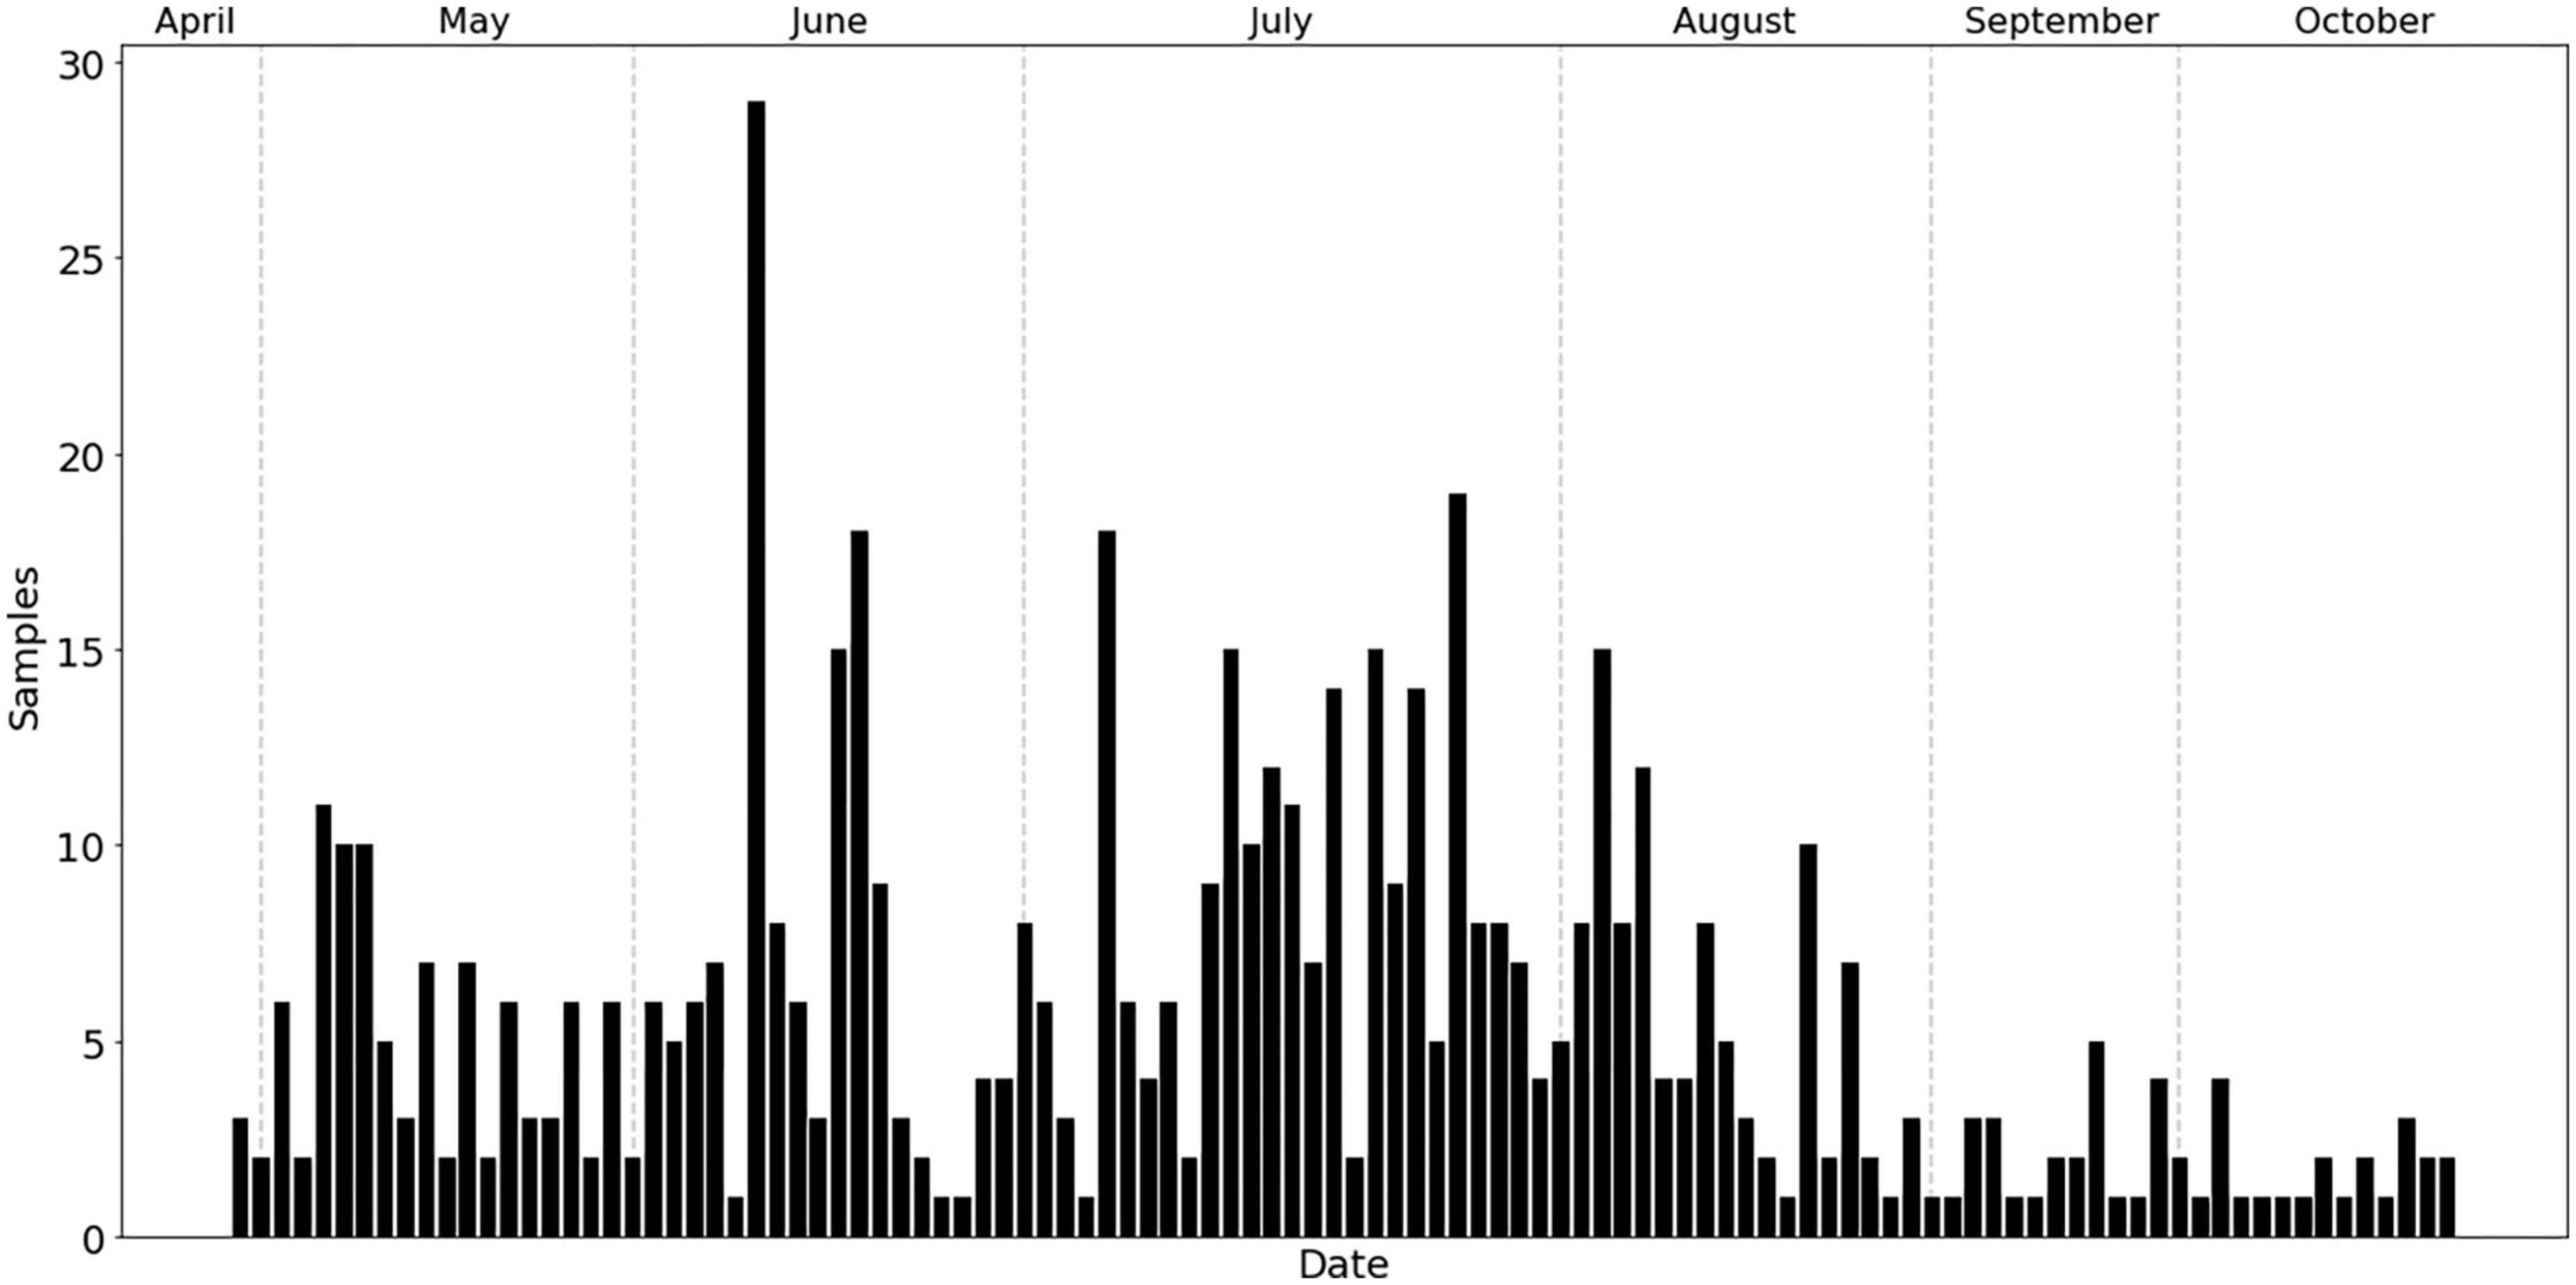
Figure 3. The frequency of bark beetle infestations observed throughout the 2020 growing season (May to October).
The class of trees susceptible to attacks generally revealed a higher mean value, for individual bands, than the class of healthy trees, before and during the first half of the growing season (early April to late July; Figure 4 and Supplementary Table 1).
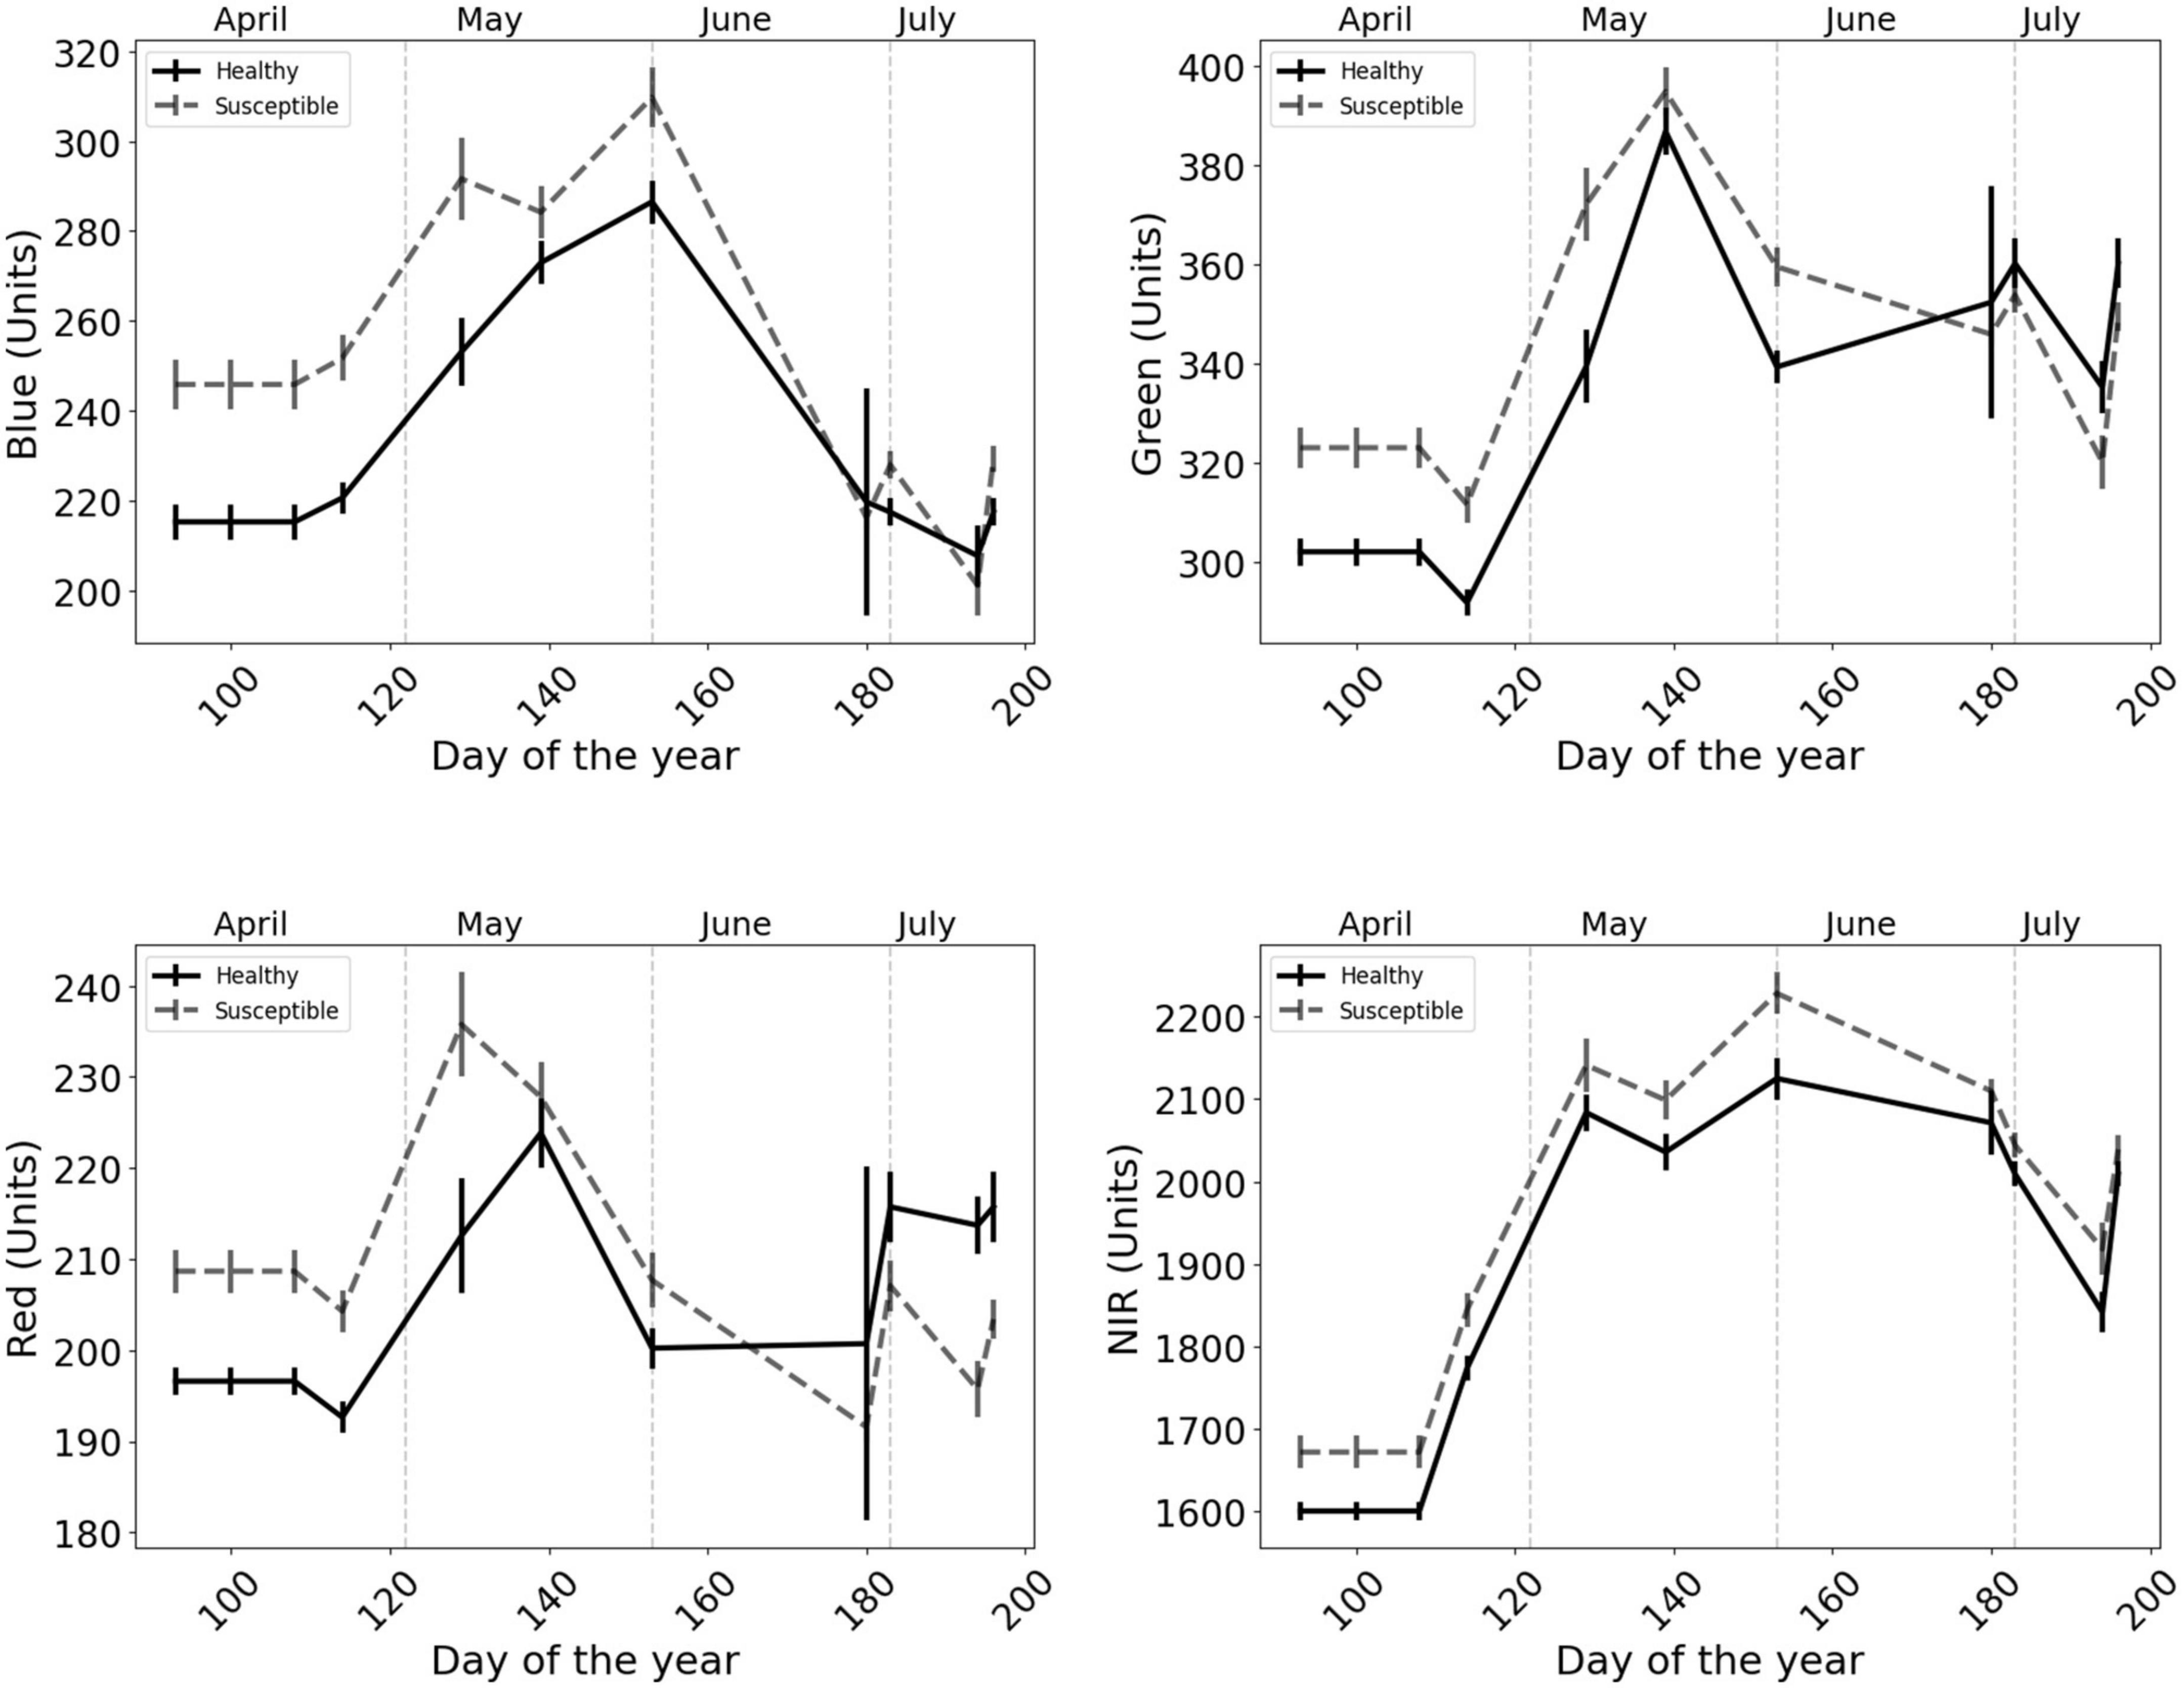
Figure 4. Behavior of the single bands (mean and standard error) before and during the first half of the growing season for healthy trees and trees predicted to be attacked by bark beetles. Solid vertical lines on the trend lines represent the standard error of the mean and dashed vertical lines represent the monthly division.
For the top-ranked SVIs, EVI and VARI, the observed patterns between the two classes were opposite to that observed in individual bands; the “Healthy” class generally revealed higher values than the “Susceptible” class (Figure 5 and Supplementary Table 1).
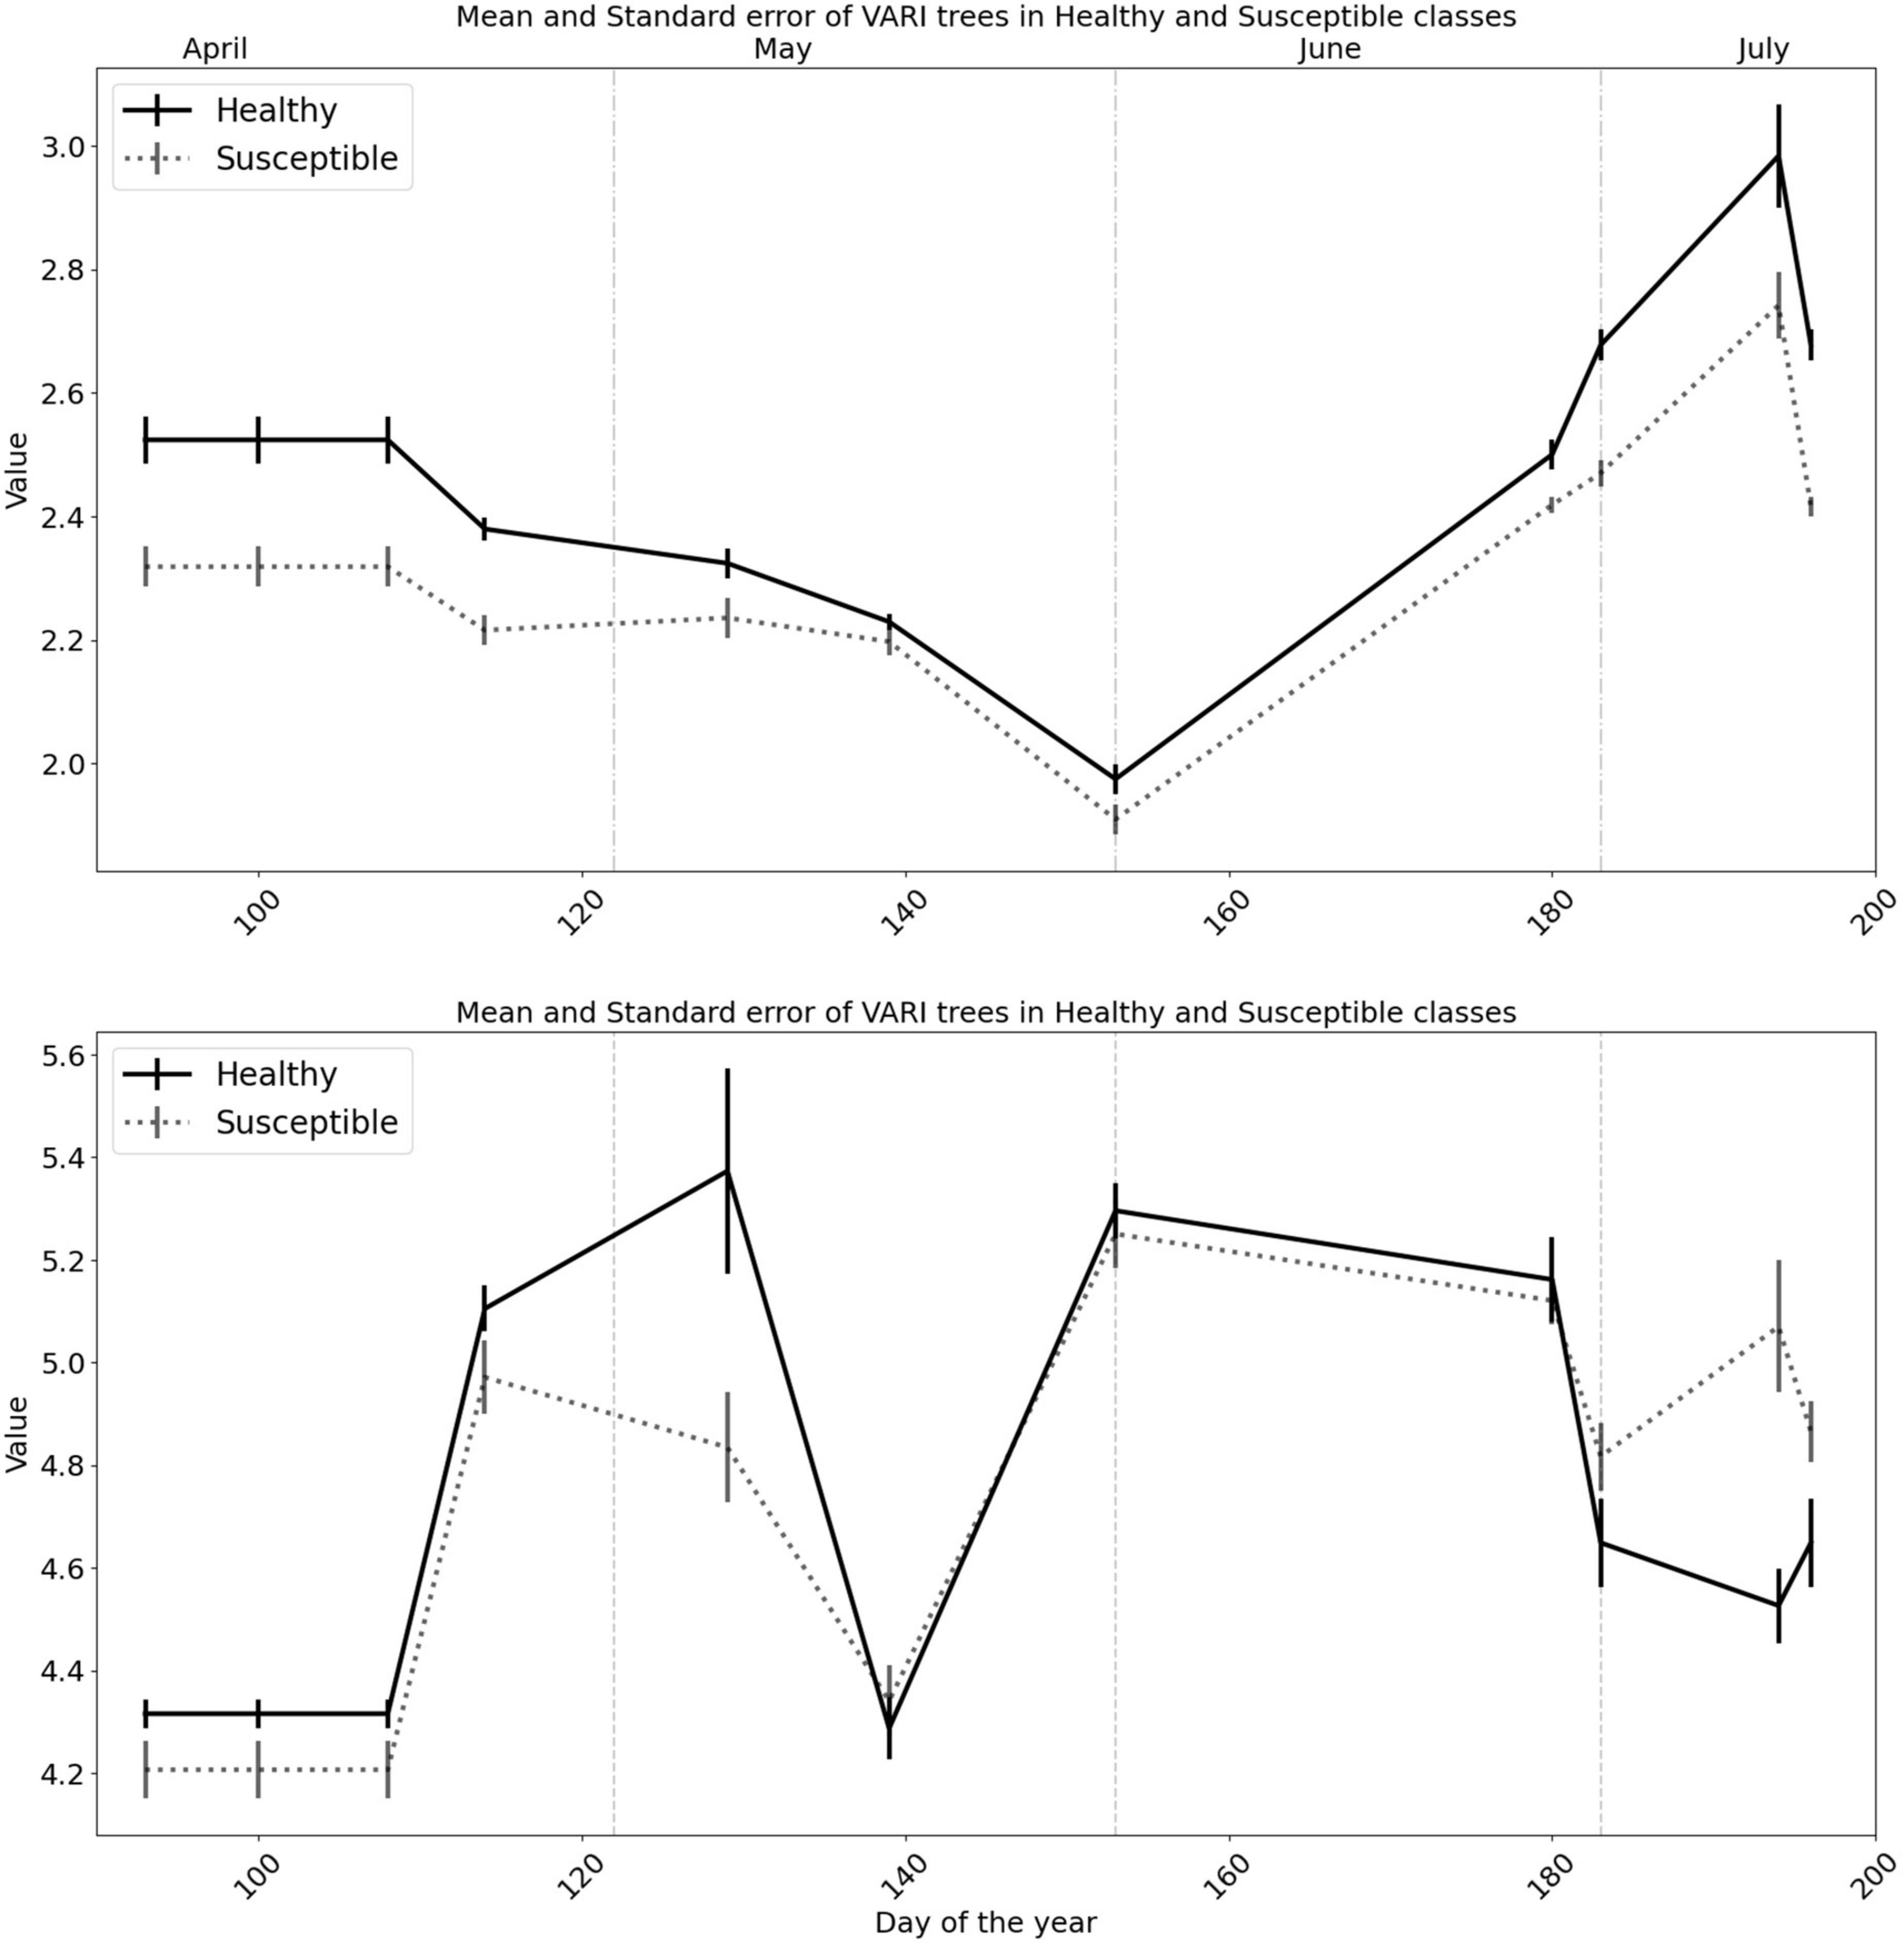
Figure 5. The behavior of the spectral vegetation indices of the Enhanced Vegetation Index (EVI) and Visible Atmospherically Resistant Index (VARI) before and during the first half of the growing season for healthy trees, and trees predicted to be attacked by bark beetles. Solid vertical lines on the trend lines represent the standard error of the mean and dashed vertical lines represent the monthly division.
The differentiation between the mean value for the polygons of the two classes followed a more steady pattern for the EVI, similar to the NIR, whereas the values sometimes overlapped for the VARI, mostly after May 18 (Figure 5 and Supplementary Table 1).
3.1. Individual bands
Individual bands showed statistically significant differences between the two classes of healthy and susceptible trees, mostly for Days 93 to 114 (p < 0.05 for the Welch’s t-test; Figure 6).
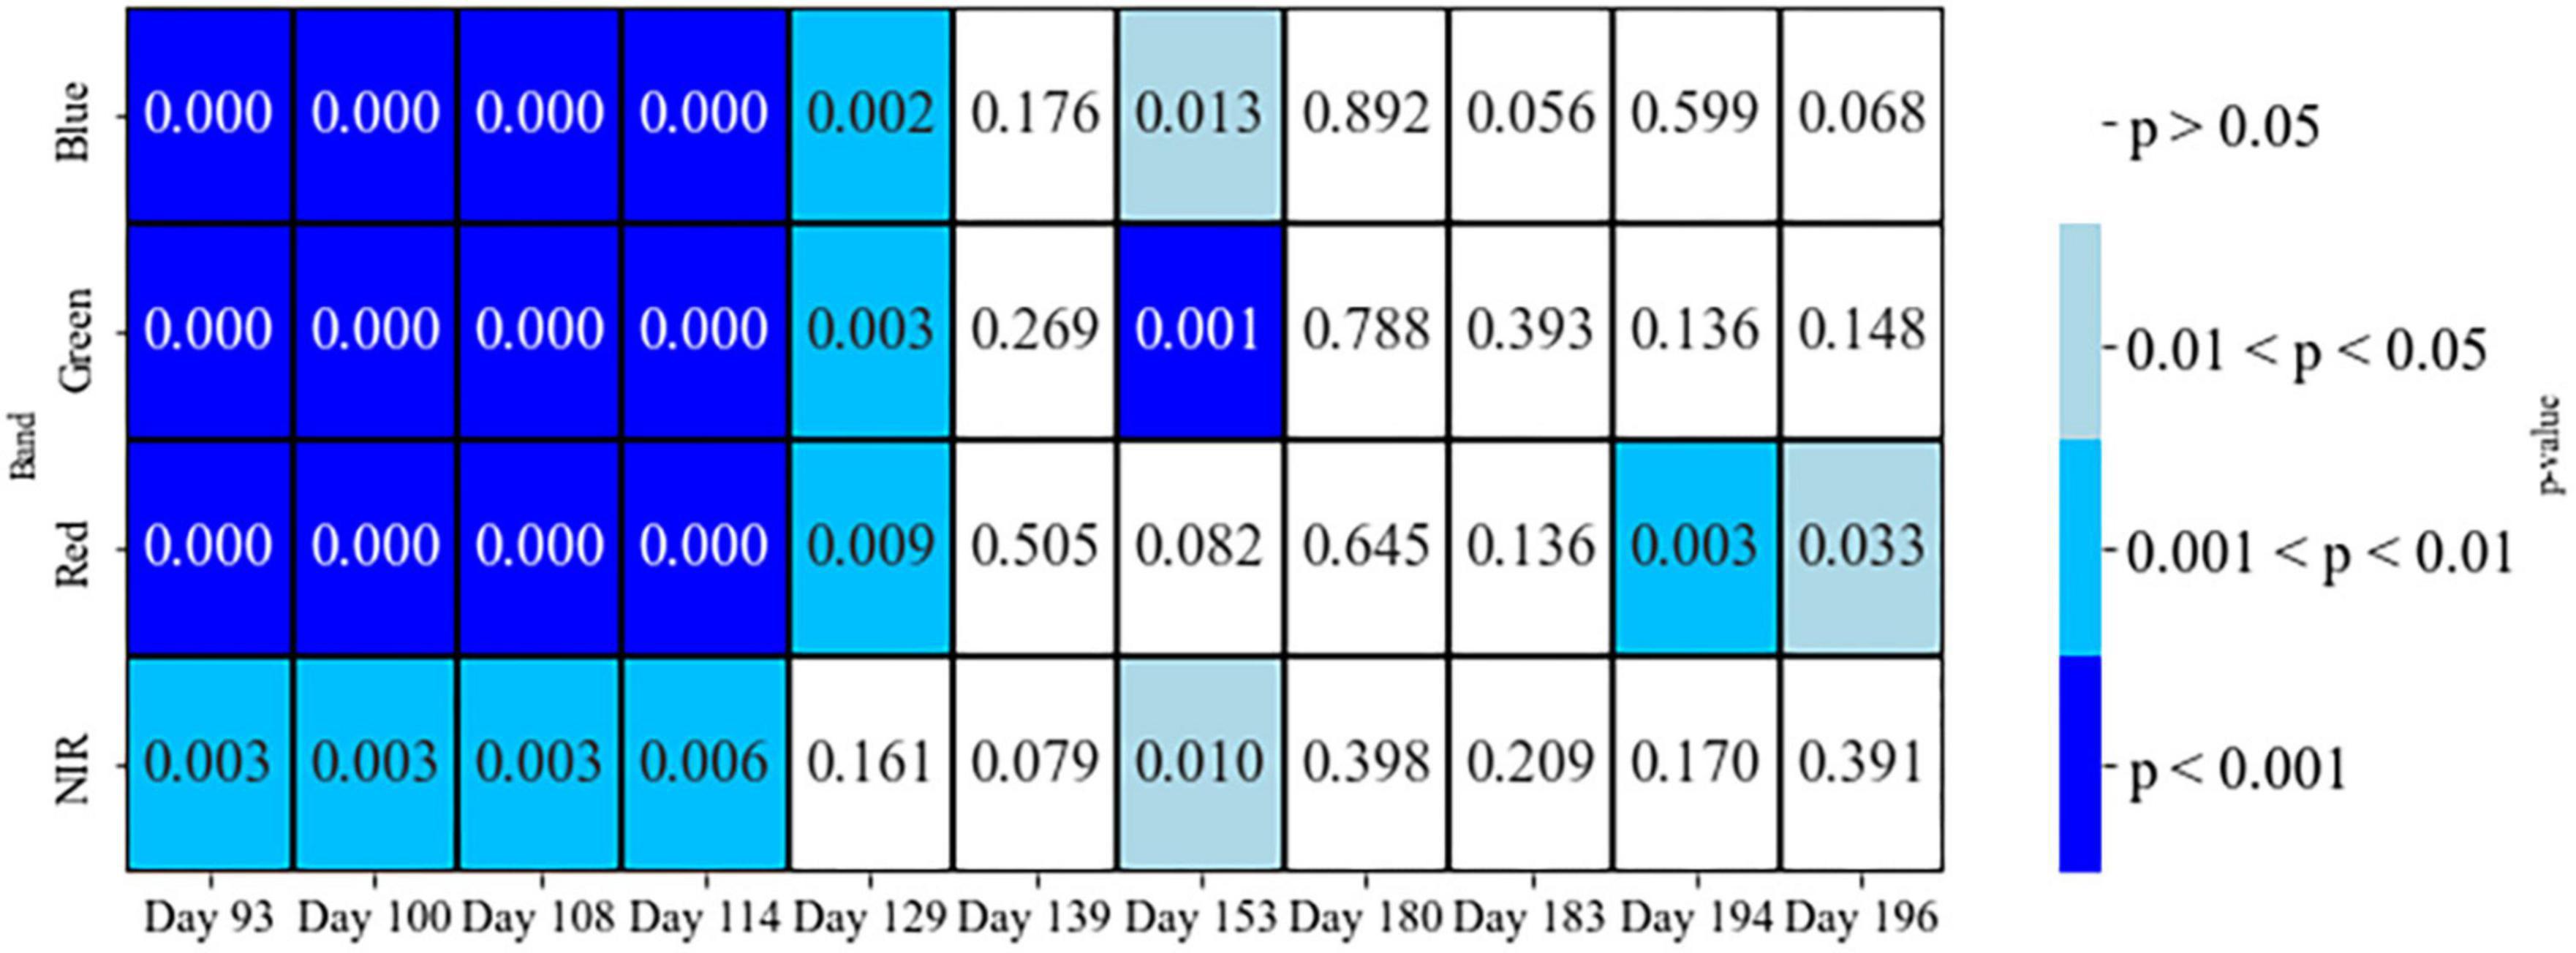
Figure 6. Welch’s t-test p-values between two classes of healthy and susceptible trees to attacks, on different days before and during the first half of the growing season, using individual bands.
Results for the linear discriminant analysis, LDA, showed high accuracy for individual bands on only days 194 and 196 (CA 64–76%; Figure 7). However, we may not be able to validate these results as the sample size of the susceptible class for these days dropped more than twice that for earlier dates. Therefore, “Healthy” and “Susceptible” classes may not be sufficiently distinguished using only individual bands (Figure 7) as the CA values from the LDA test did not reach the 70% threshold for any bands.
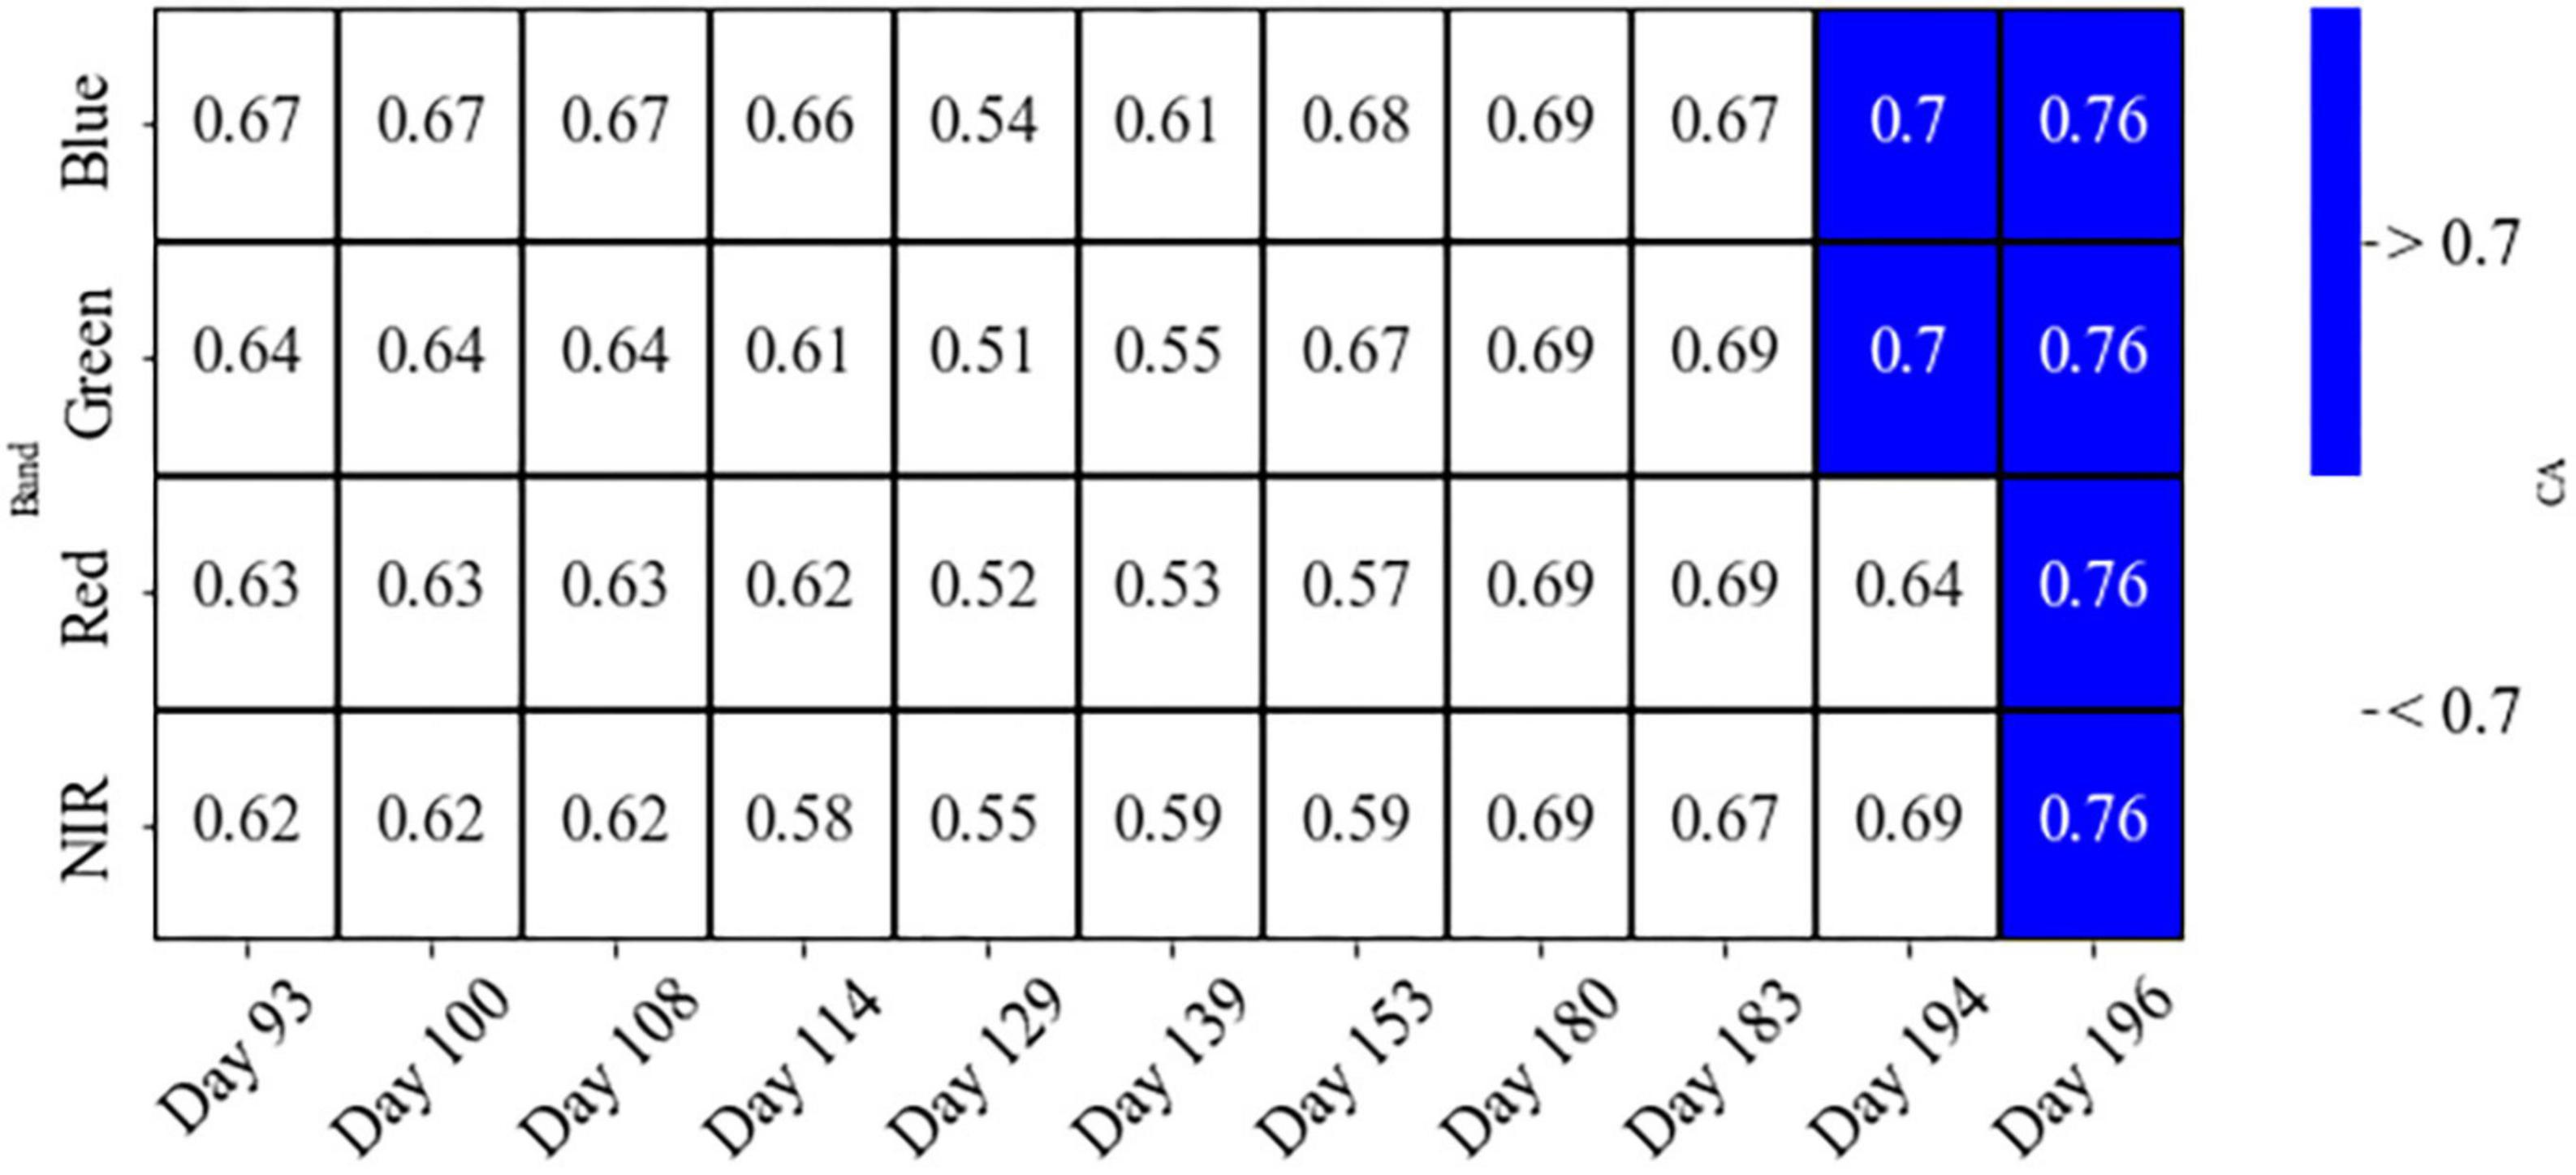
Figure 7. The overall classification accuracy (CA), using leave-one-out cross-validation on the LDA test for individual bands, to differentiate two classes of healthy and susceptible trees to attacks, on different days before and during the first half of the growing season.
3.2. Spectral vegetation indices (SVIs)
Spectral vegetation indices, such as DVI, EVI, MSAVI, NDVI, PVI, SAVI, TSAVI, VARI, and WDRVI, showed statistically significant differences between two classes of healthy and susceptible trees, mostly for Days 93 to 129, at a different rate of type I error for the Welch’s t-test (Figure 8). However, the EVI and VARI were the only two indices showed significant differences between classes at other dates during the first half of the growing season (Figure 8).
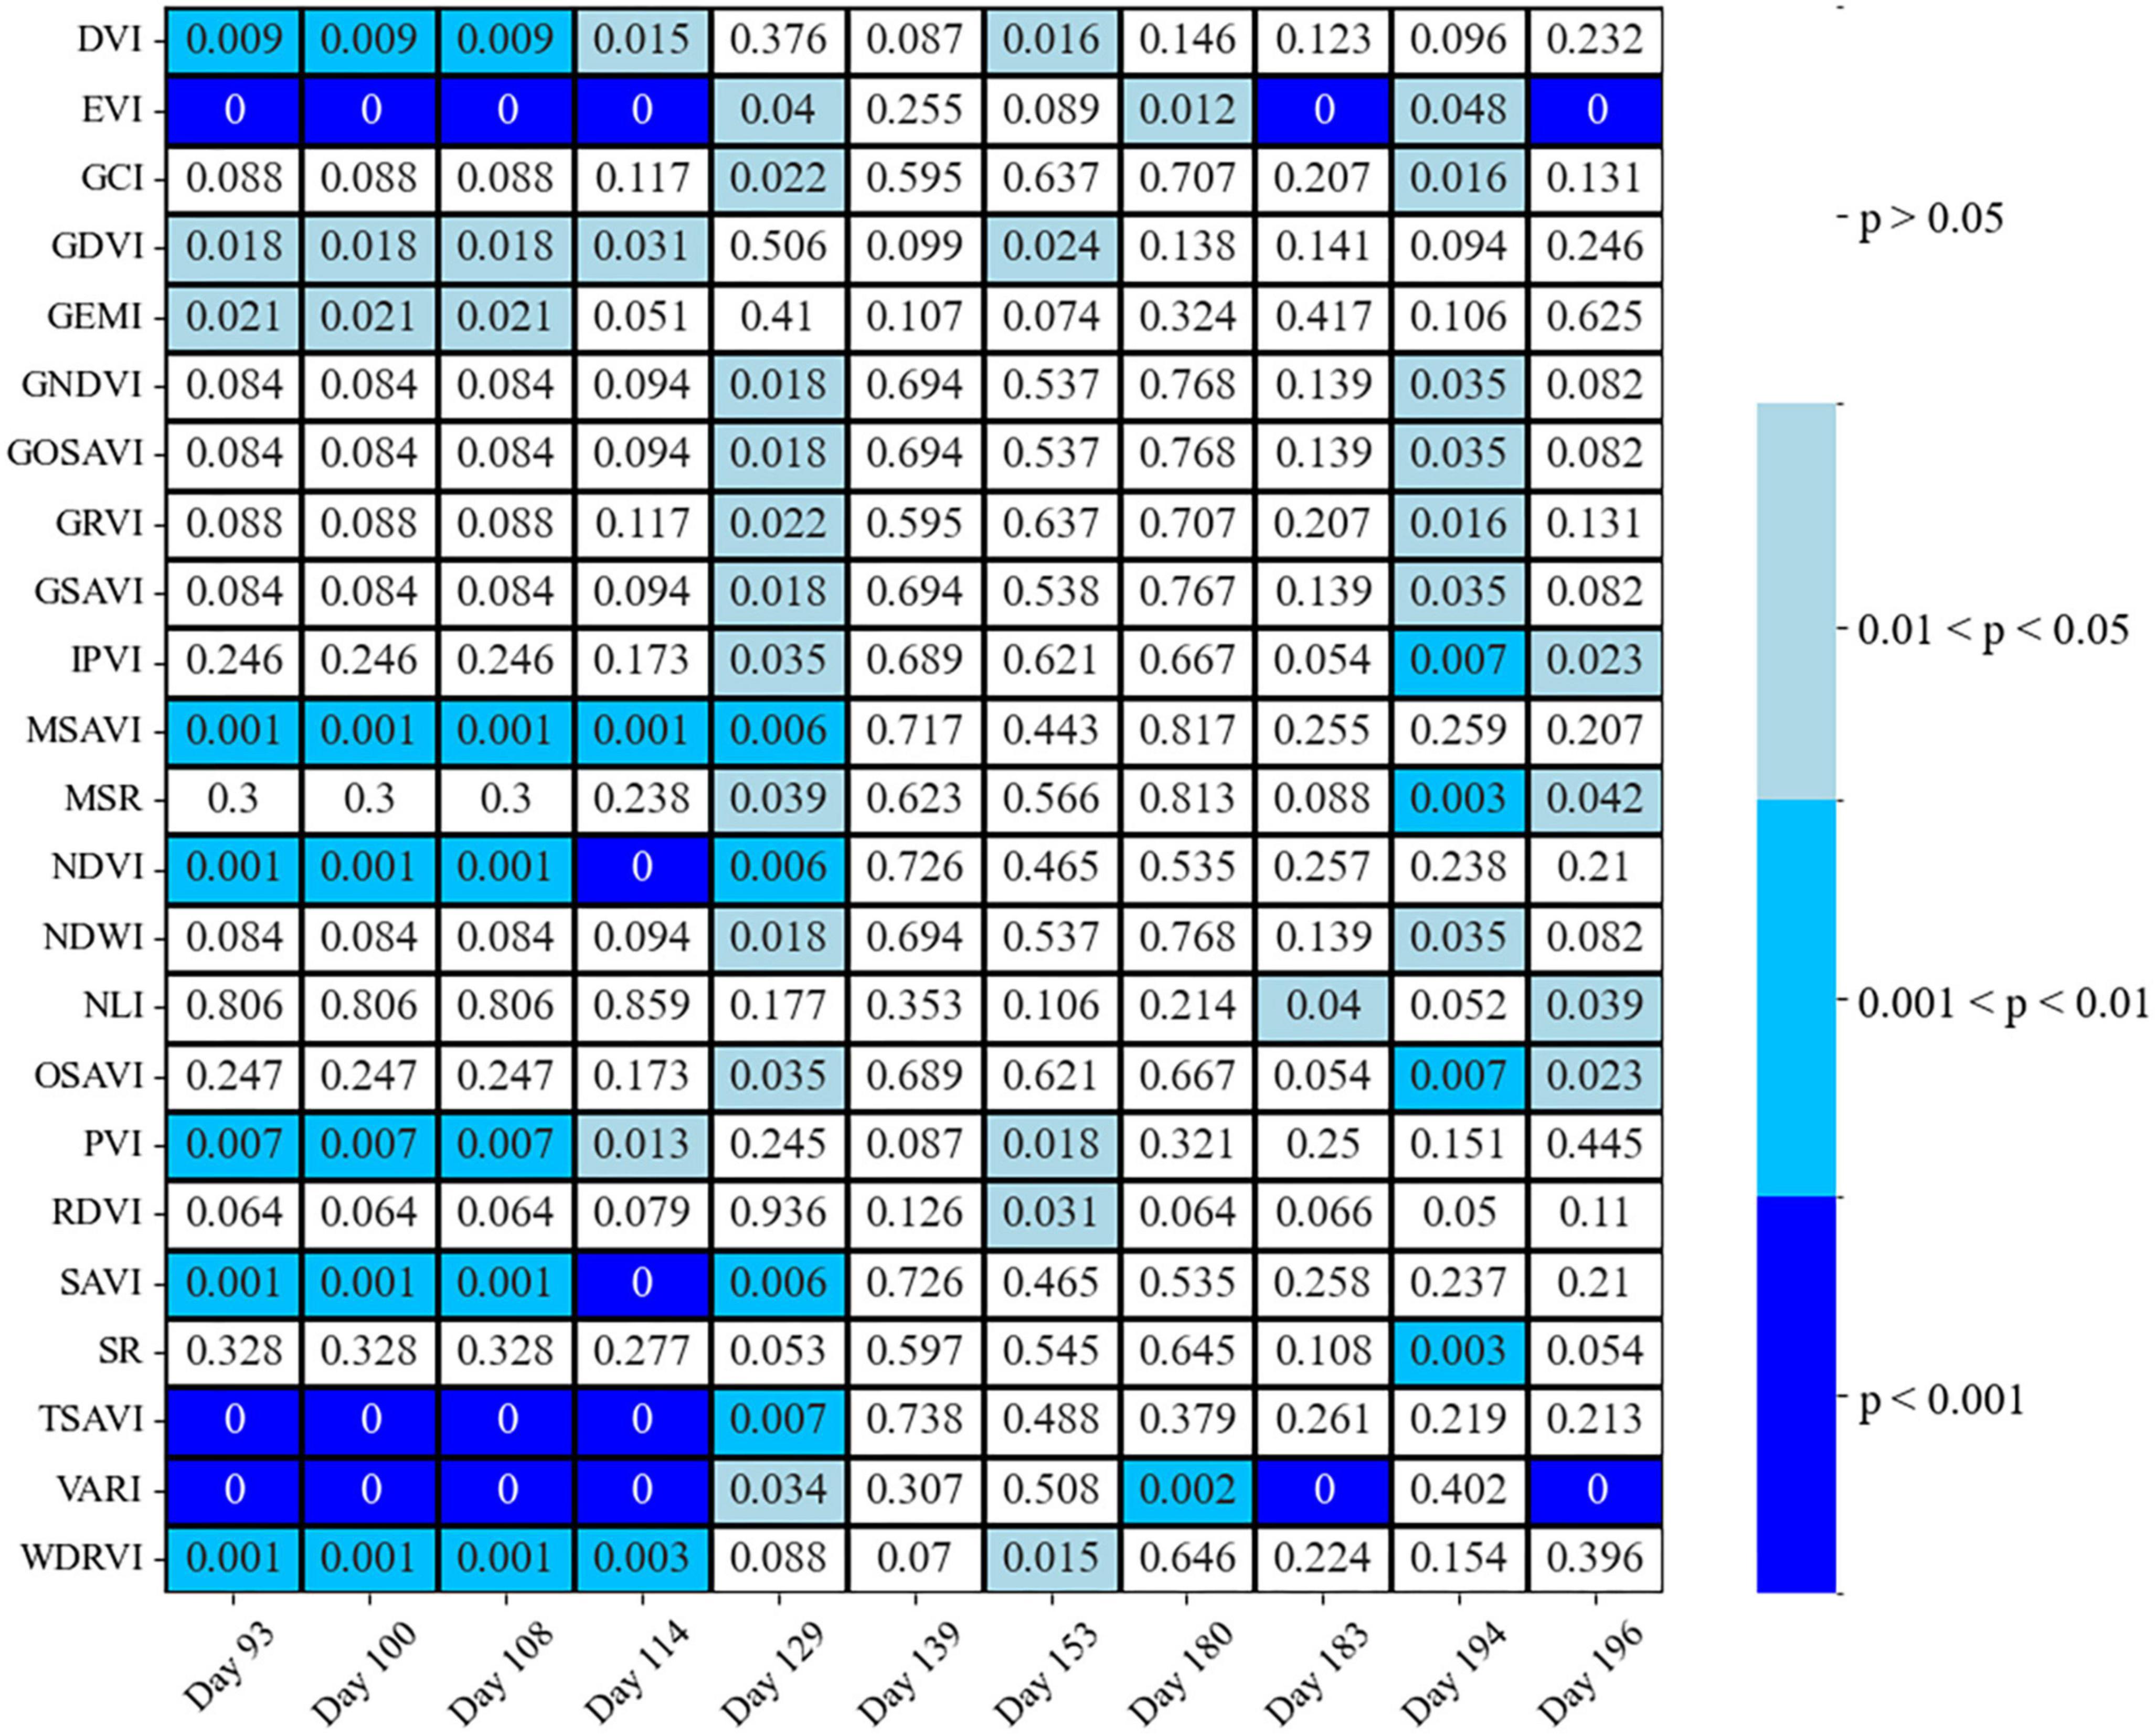
Figure 8. Welch’s t-test p-values between two classes of healthy and susceptible trees to attacks, on different days before and during the first half of the growing season, using different spectral vegetation indices.
Results for the linear discriminant analysis, LDA, were showing high accuracy for the most of SVIs on days 194 and 196 (CA 68–83%; Figure 9). However, we may not be able to validate these results as the sample size of the susceptible class for these days decreased more than twice that for earlier dates, similar to individual bands. Beyond these dates, the accuracy of the LDA test passed or almost reached the 70% threshold only for the VARI and EVI, respectively, at days 93 to 114 (Figure 9).
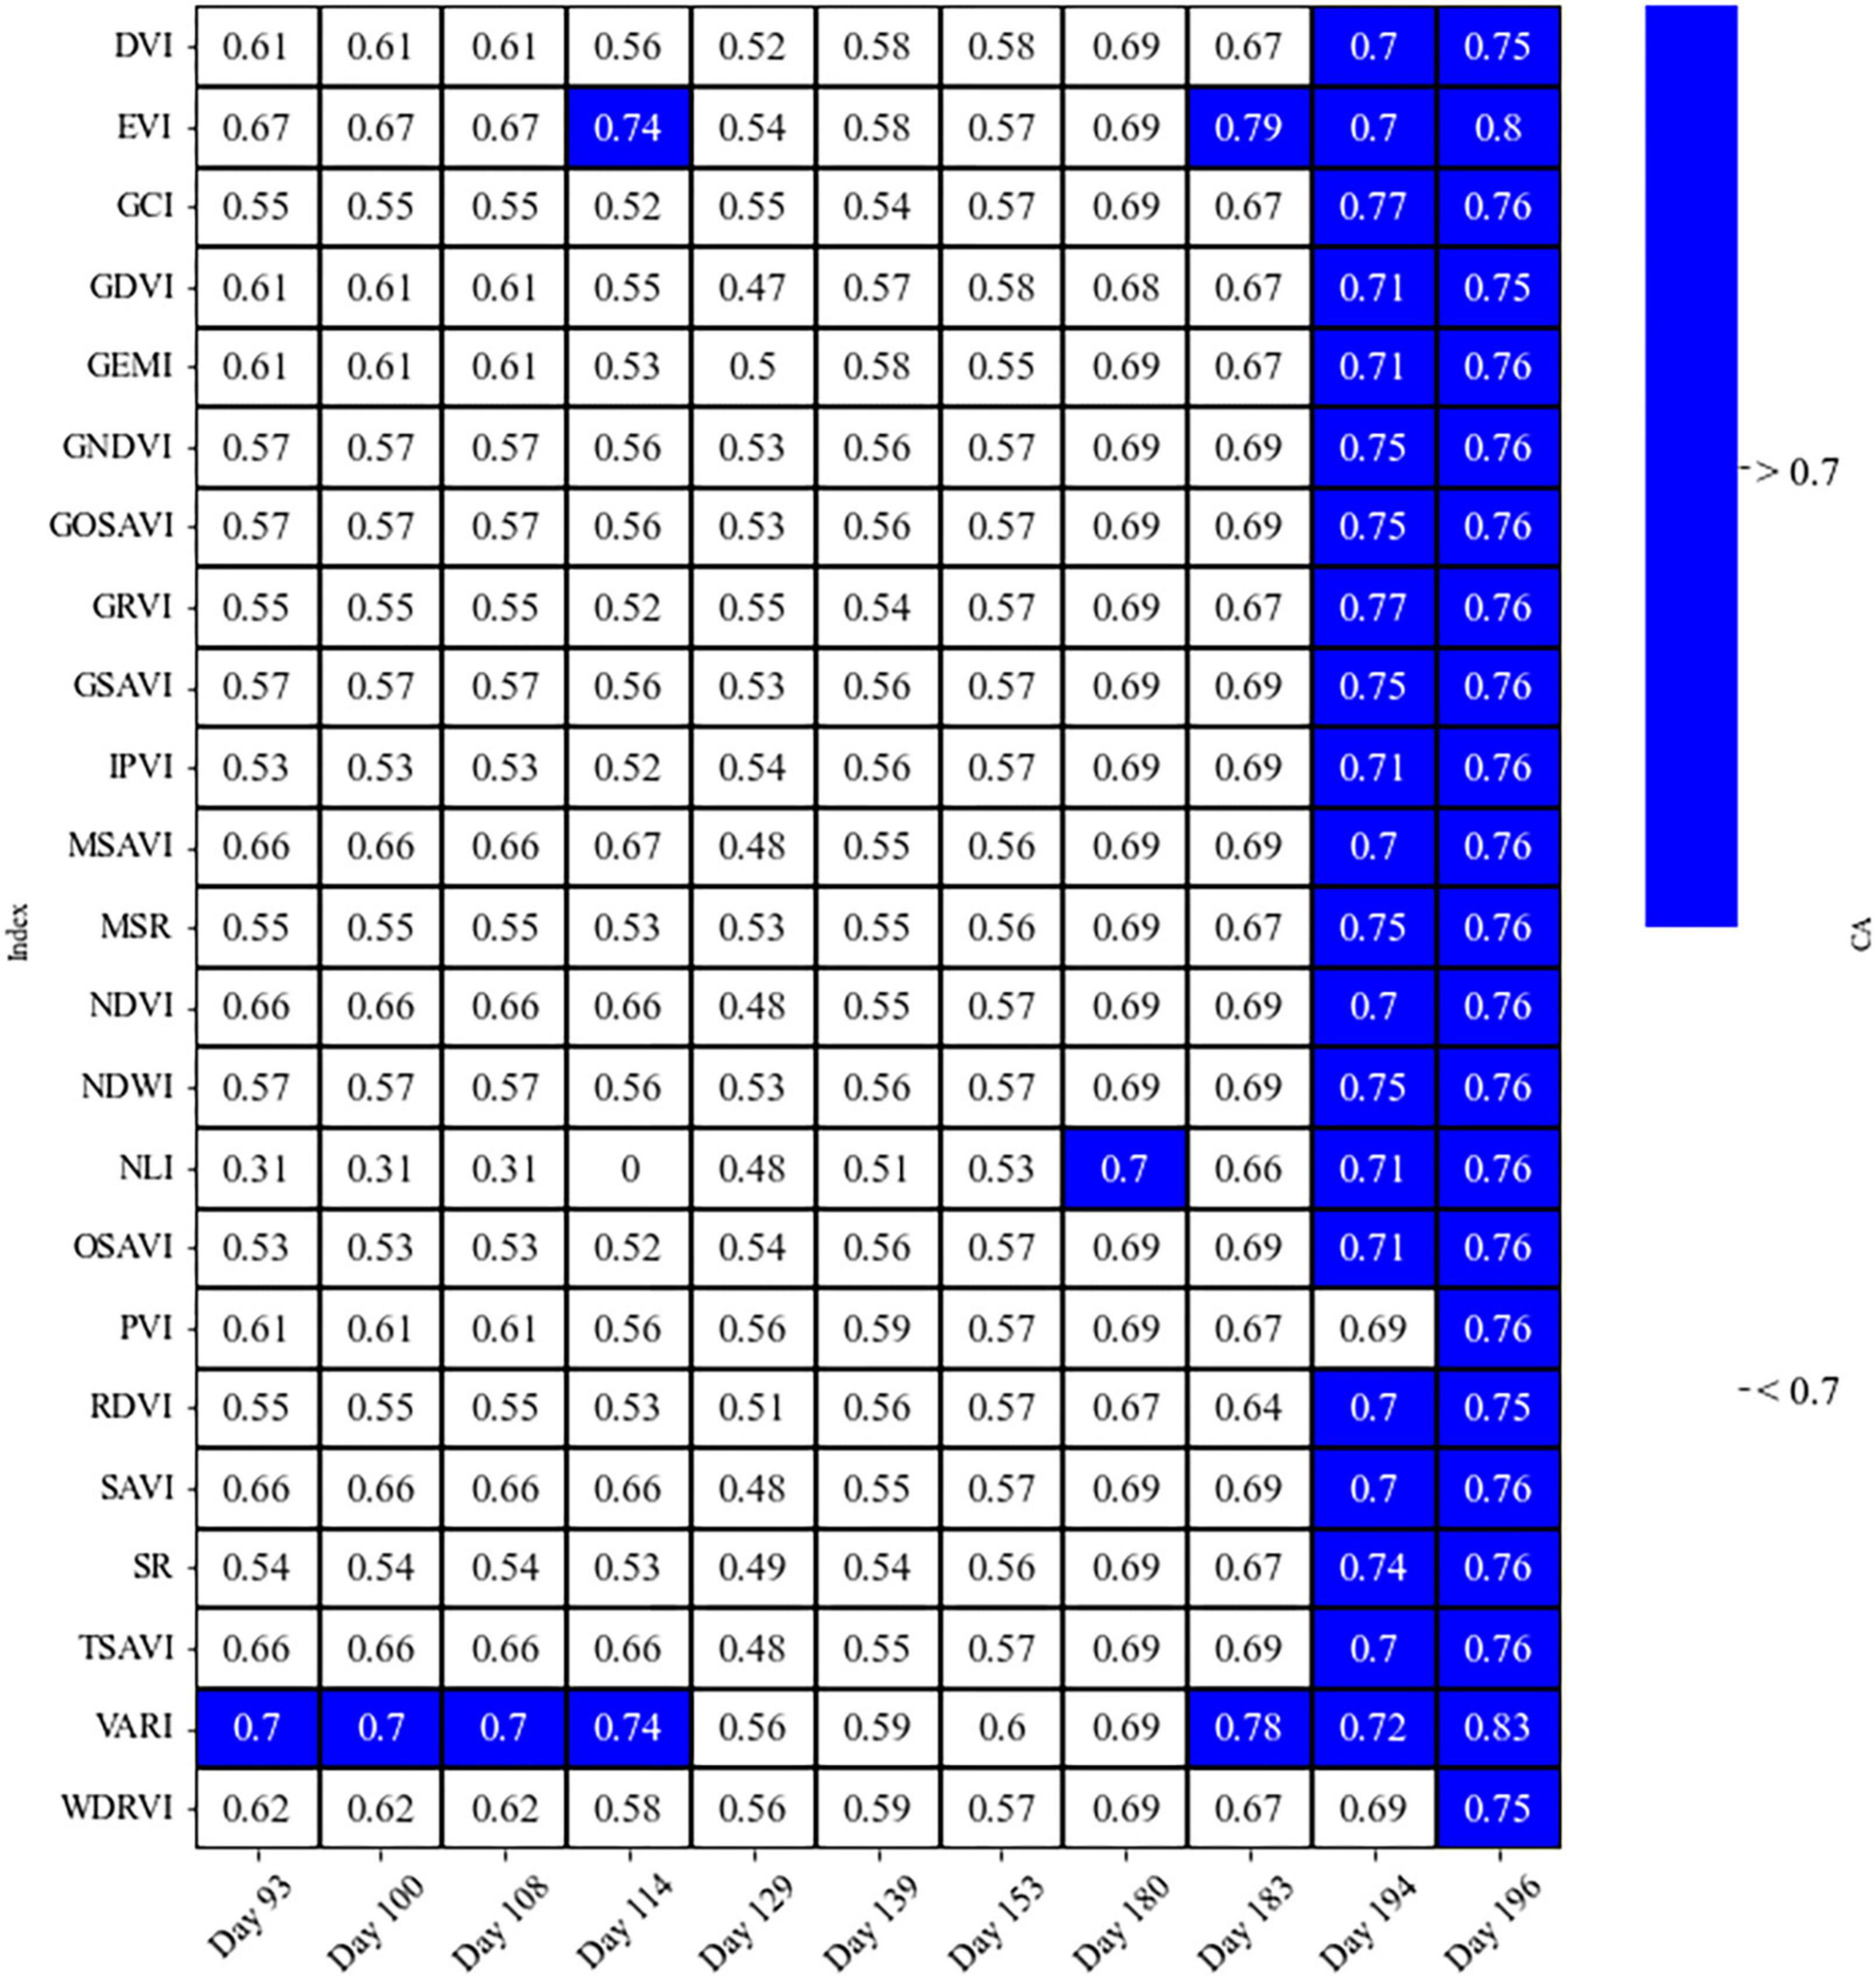
Figure 9. The overall classification accuracy (CA), using leave-one-out cross-validation on the LDA test for SVIs, to differentiate two classes of healthy and susceptible trees to attacks, on different days before and during the first half of the growing season.
3.2.1. Evaluations of SVIs using combined Welch’s t-test and LDA
The two classes were found to be differentiated at most using two SVIs based on combined evaluations of using Welch’s t-test and LDA; the EVI on Days 114 and 183, and the VARI on Days 93, 100, 108, 114, and 183 resulted in the LDA accuracy greater than 0.7 and p-value for the Weltch’s t-test less than 0.05 (Figures 8, 9).
4. Discussion
4.1. Wavelengths and spectral vegetation indices suitable for prediction of bark beetle attack
Our results show that all four wavebands of PlantScope, including Red, Green, Blue, and NIR, have the potential to detect susceptible trees and thus predict the occurrences of bark beetle attacks (Welch’s t-test; Figure 6). Nevertheless, the CA for none of them passed the defined 70% threshold. Considering the overall temporal patterns from early April to late July, the differentiation between the two classes of healthy and susceptible trees followed a more steady pattern for NIR than other visible bands (Figure 4). This may indicate that the NIR could be a more reliable spectral reflectance than other visible lights to detect susceptible trees, before and during the first half of a growing season (Figure 4).
Among all spectral vegetation indices we investigated, EVI and VARI were found to be the best indices to detect trees susceptible to attacks (Figures 8, 9; the lowest Welch’s t-test p-value and the highest CA), similar to Huo et al. (2021). The VARI Index on Day 183 was significantly different between healthy and susceptible trees (significant Welch’s t-test and LDA with the CA higher than 70%) so the values for the susceptible trees were much higher than the healthy/control trees. However, the EVI shows the best performance during the entire season. In contrast to the VARI, susceptible trees were always showing lower values for the EVI than healthy trees. The observed patterns may indicate that the EVI could be the best index for the prediction of bark beetle attack occurrences within a forest, which could also be used for general applications in forest pest management to detect water-stressed trees. For example, Kim (2013) found EVI sensitive to drought and rising temperatures in the ecosystems of northern Arizona, USA. In addition, Scots pine (Pinus sylvestris L.), a sensitive species to drought effects (Seidel et al., 2016), showed early signs of vitality decline in Italy, which may be remotely detected using the EVI (Vacchiano et al., 2012).
4.2. Seasonal changes of spectral characteristics of susceptible trees to attacks
The overall patterns of the SVIs behavior before and during the first half of the growing season were found to be increasing, without any significant declines from early April to mid-season. However, the patterns slowed down by late July and early August. Most of the SVIs, even the most significant (for both classes), had declines as well.
Generally, the value of SVIs has been showing a seasonal trend (Karkauskaite et al., 2017; Yang et al., 2017). We found all the mean values of EVI of the predisposed trees were significantly lower than for non-attacked trees (Figure 5), and thus, suggesting the EVI as a potential spectral vegetation index to predict bark beetle-infestation occurrences.
4.3. Limitations of the study
The spectral resolution of the available remote sensing products that we used was limited by the choice of the sensor with 4 bands due to the year of our observation, a period in 2020. For future research, it is preferable to use datasets with SWIR band in addition to NIR, visible, and red-edge spectral reflectances due to their effectiveness in tracking early stressed trees, though with different levels of detection uncertainty (Zabihi et al., 2021b). This could be achieved with the PlanetScope products of the 3rd generation sensors, known as SuperDove or PSB.SDafter, available from mid-March 2020. The 3rd generation sensors acquire imagery at eight bands, including Coastal Blue, Green I, Yellow, and Red Edge plus the four bands we have already used (Planet Labs, Inc, 2022). The specified 8-bands allow computing more spectral vegetation indices than we were able to. In addition to the PlanetScope imagery, there are other satellites, e.g., Sentinel-2, which acquires imagery in the SWIR band even though its spatial resolution is coarser than the PlanetScope. Given this very important advantage, we recommend comparing products, e.g., SVIs, developed on imagery acquired from Sentinel-2 and the 3rd generation of PlanetScope, for future research investigations. Vegetation indices such as PVI, TSAVI and WDRVI have additional coefficients, which are not connected with band values. Those coefficients, such as slope, gradient, and intercept of the soil line and others, were set as recommended (default) values due to limitations in GIS data collection campaigns. More precise ground truth data with these additional parameter records could improve index performances.
Ground truth data with the locations of all bark beetle infestations were identified by foresters and researchers on a weekly frequency. Nevertheless, the cause of the infestation has not been determined. Each bark beetle infestation area potentially could be triggered by the internal and/or neighboring tree(s), attacked but not harvested in 2019.
The mechanism of bark beetle-induced Norway spruce mortality under drought conditions, such as changes in the physiological and biochemical processes of trees susceptible to attacks, is yet to be fully understood (Netherer et al., 2021). However, our findings of two spectral vegetation indices, EVI and VARI, may offer key indices to detect trees that are under water-stressed conditions, causing changes in the physiological and biochemical processes in trees. For example, Wei et al. (2023) found a positive correlation between spatial and temporal variations of tree-ring width (TRW) and the Enhanced Vegetation Index (EVI). The relationship between the TRW and EVI became stronger in more arid regions where trees were under more drought and subsequent water-stress conditions (Wei et al., 2023).
5. Conclusion
In the warming climate, drought and drought-induced bark beetle outbreaks may become more severe. Therefore, forest managers and policymakers need to provide monitoring of forest health status on a continuous, e.g., bidaily to weekly basis with subsequent sanitation measures, which otherwise may result in further bark beetle infestations with its ongoing rapid developments (Zabihi et al., 2021b). Our study was conducted to examine and thus offer the best indices, EVI and possibly VARI, to detect trees susceptible to attacks, likely due to water-stress conditions, before and/or during the first half of the growing season. Thus, a proactive management strategy can be practiced at this stage to better suppress or control the infestations.
We may still be able to distinguish the phase of attack from the spot initialization, at which very few trees are attacked, toward spot spreading, when the attacked area includes several adjacent trees (Colombari et al., 2013). In the phase of spot initialization, bark beetles attack stressed trees, while in the phase of spot spreading, the infestation spreads to neighbor trees regardless of their resistance to attack, considered as spatial and temporal autocorrelation of attacks (Aukema et al., 2006, 2008; Jakuš et al., 2011; Simard et al., 2012). These spatial and temporal patterns of attack likely result in different spectral signatures observed during different phases of attacks in addition to different spectral signatures observed from non-attacked trees but highly susceptible. This complexity may impact the level of uncertainty in detecting susceptible trees, using a single SVI, during the period of beetle flight activities at which different phases of attacks may co-occur. Therefore, we recommend using an integrated approach of employing several SVIs, e.g., sensitive to healthy vs. susceptible trees, and different phases of attacks, simultaneously.
We finally recommend defining thresholds for these two vegetation indices, EVI and VARI, to provide a classified map for practical applications in forestry. The classified map would be used as a spatial tool to predict trees vulnerable to attacks and thus, to highlight hotspots regions with a high probability of infestation occurrences. Our proposed methodology offers an approach for future research to replicate using additional bands coming from new generations of PlantScope satellites. Further investigations of formulating and developing new SVIs, more sensitive to water-stressed- and thus susceptible-trees to attacks, are also recommended to improve the mapping accuracy.
The spectral difference based on SVI could be used to detect stress before attacks using the methods proposed in the present paper. Also, the new broadband SVI formula should be researched for more precise identification of predisposition to the bark beetle infestations.
Data availability statement
The raw data supporting the conclusions of this article will be made available by the authors, without undue reservation.
Author contributions
AT, GK, KZ, VVS, PS, and RJ contributed to the conception and design of the study. AT organized the database. AT and GK performed the statistical analysis. AT and RJ wrote the first draft of the manuscript. AT, GK, KZ, RM, VVS, and RJ wrote sections of the manuscript. All authors contributed to the manuscript revision, read, and approved the submitted version.
Funding
This research was supported by grant No. CZ.02.1.01/0.0/0.0/15_003/0000433, “EXTEMIT–K project”, financed by the Operational Program Research, Development and Education (OP RDE), grant no. 43950/1312/3128, “Green attack identification with the use of multi- and hyperspectral data” financed by Internal Grant Agency FFWS CULS in Prague and grant “Development of integrated modern and innovative diagnostic and protection methods of spruce stands with the use of semiochemicals and methods of molecular biology”, No. QK1910480 financed by the Ministry of Agriculture of Czechia.
Conflict of interest
The authors declare that the research was conducted in the absence of any commercial or financial relationships that could be construed as a potential conflict of interest.
Publisher’s note
All claims expressed in this article are solely those of the authors and do not necessarily represent those of their affiliated organizations, or those of the publisher, the editors and the reviewers. Any product that may be evaluated in this article, or claim that may be made by its manufacturer, is not guaranteed or endorsed by the publisher.
Supplementary material
The Supplementary Material for this article can be found online at: https://www.frontiersin.org/articles/10.3389/ffgc.2023.1130721/full#supplementary-material
References
Abdollahnejad, A., and Panagiotidis, D. (2020). Tree species classification and health status assessment for a mixed broadleaf-conifer forest with UAS multispectral imaging. Remote Sens. 12:3722. doi: 10.3390/rs12223722
Abdullah, H., Skidmore, A. K., Darvishzadeh, R., and Heurich, M. (2019a). Sentinel-2 accurately maps green-attack stage of European spruce bark beetle (Ips typographus. L.) compared with Landsat-8. Remote Sens. Ecol. Conserv. 5, 87–106. doi: 10.1002/rse2.93
Abdullah, H., Skidmore, A. K., Darvishzadeh, R., and Heurich, M. (2019b). Timing of red-edge and shortwave infrared reflectance critical for early stress detection induced by bark beetle (Ips typographus, L.) attack. Int. J. Appl. Earth Observ. Geoinform. 82, 101900. doi: 10.1016/j.jag.2019.101900
Ali, A. M., Abdullah, H., Darvishzadeh, R., Skidmore, A. K., Heurich, M., Roeoesli, C., et al., (2021). Canopy chlorophyll content retrieved from time series remote sensing data as a proxy for detecting bark beetle infestation. Remote Sens. Appl. Soc. Envi. 22:100524.
Allen, C. D., Macalady, A. K., Chenchouni, H., Bachelet, D., McDowell, N., Vennetier, M., et al., (2010). A global overview of drought and heat-induced tree mortality reveals emerging climate change risks for forests. For. Ecol. Manag. 259, 660–684. doi: 10.1016/j.foreco.2009.09.001
Aukema, B. H., Carroll, A. L., Zheng, Y., Zhu, J., Raffa, K. F., Moore, R. D., et al., (2008). Movement of outbreak populations of mountain pine beetle: Influences of spatiotemporal patterns and climate. Ecography 31, 348–358.
Aukema, B. H., Carroll, A. L., Zhu, J., Raffa, K. F., Sickley, T., and Taylor, S. W. (2006). Landscape level analysis of mountain pine beetle in British Columbia, Canada: Spatiotemporal development and spatial synchrony within the present out-break. Ecography 29, 427–441.
Bače, R., Svoboda, M., Janda, P., Morrissey, R. C., Wild, J., Clear, J. L., et al., (2015). Legacy of pre-disturbance spatial pattern determines early structural diversity following severe disturbance in montane spruce forests. PLoS One 10:e0139214. doi: 10.1371/journal.pone.0139214
Baret, F., and Guyot, G. (1991). Potentials and limits of vegetation indices for LAI and APAR assessment. Remote Sens. Environ. 35, 161–173.
Bentz, B. J., and Jönsson, A. M. (2015). “Modeling bark beetle responses to climate change,” in Bark beetles, eds F. E. Vega and R. W. Hofstetter (London: Elsevier), 533–553. doi: 10.1016/B978-0-12-417156-5.00013-7
Bentz, B. J., Régnière, J., Fettig, C. J., Hansen, E. M., Hayes, J. L., Hicke, J. A., et al., (2010). Climate change and bark beetles of the western United States and Canada: Direct and indirect effects. BioScience 60, 602–613.
Birth, G., and McVey, G. (1968). Measuring the color of growing turf with a reflectance spectrophotometer. Agron. J. 60, 640–643.
Blackburn, G. A. (1998). Spectral indices for estimating photosynthetic pigment concentrations: A test using senescent tree leaves. Int. J. Remote Sens. 19, 657–675. doi: 10.1080/014311698215919
Blackburn, G. A. (2006). Hyperspectral remote sensing of plant pigments. J. Exp. Bot. 58, 855–867. doi: 10.1093/jxb/erl123
Brovkina, O., Cienciala, E., Surový, P., and Janata, P. (2018). Unmanned aerial vehicles (UAV) for assessment of qualitative classification of Norway spruce in temperate forest stands. Geospatial Inform. Sci. 21, 12–20. doi: 10.1080/10095020.2017.1416994
Carter, G. A., and Knapp, A. K. (2001). Leaf optical properties in higher plants: Linking spectral characteristics to stress and chlorophyll concentration. Am. J. Bot. 88, 677–684. doi: 10.2307/2657068
Chen, J. (1996). Evaluation of vegetation indices and modified simple ratio for boreal applications. Can. J. Remote Sens. 22, 229–242.
Christiansen, E., and Bakke, A. (1988). “The spruce bark beetle of Eurasia,” in Dynamics of forest insect populations, ed. A. A. Berryman (Boston, MA: Springer US), 479–503. doi: 10.1007/978-1-4899-0789-9_23
Colombari, F., Schroeder, M. L., Battisti, A., and Faccoli, M. (2013). Spatio-temporal dynamics of an Ips acuminatus outbreak and implications for management. Agric. For. Entomol. 15, 34–42. doi: 10.1111/j.1461-9563.2012.00589.x
DeRose, R. J., Bentz, B. J., Long, J. N., and Shaw, J. D. (2013). Effect of increasing temperatures on the distribution of spruce beetle in Engelmann spruce forests of the Interior West USA. For. Ecol. Manag. 308, 198–206. doi: 10.1016/j.foreco.2013.07.061
Fettig, C. J., Klepzig, K. D., Billings, R. F., Munson, A. S., Nebeker, T. E., Negrón, J. F., et al., (2007). The effectiveness of vegetation management practices for prevention and control of bark beetle infestations in coniferous forests of the western and southern United States. For. Ecol. Manag. 238, 24–53.
Gao, B.-C. (1995). “Normalized difference water index for remote sensing of vegetation liquid water from space,” in Proceedings of the SPIE, eds M. R. Descour, J. M. Mooney, D. L. Perry, and L. R. Illing (Orlando, FL), 225. doi: 10.1117/12.210877
Gely, C., Laurance, S. G. W., and Stork, N. E. (2020). How do herbivorous insects respond to drought stress in trees? Biol. Rev. 95, 434–448. doi: 10.1111/brv.12571
Gitelson, A. A. (2004). Wide dynamic range vegetation index for remote quantification of biophysical characteristics of vegetation. J. Plant Physiol. 161, 165–173. doi: 10.1078/0176-1617-01176
Gitelson, A. A., Kaufman, Y. J., and Merzlyak, M. N. (1996). Use of a green channel in remote sensing of global vegetation from EOS-MODIS. Remote Sens. Environ. 58, 289–298. doi: 10.1016/S0034-4257(96)00072-7
Gitelson, A., Gritz, Y., and Merzlyak, M. (2003). Relationships between leaf chlorophyll content and spectral reflectance and algorithms for non-destructive chlorophyll assessment in higher plant leaves. J. Plant Physiol. 160, 271–282. doi: 10.1078/0176-1617-00887
Gitelson, A., Stärk, R. F., Grits, U., Rundquist, D. C., Kaufman, Y. J., and Derry, D. (2002). Vegetation and soil lines in visible spectral space: A concept and technique for remote estimation of vegetation fraction. Int. J. Remote Sens. 23, 2537–2562.
Goel, N., and Qin, W. (1994). Influences of canopy architecture on relationships between various vegetation indices and LAI and Fpar: A computer simulation. Remote Sens. Rev. 10, 309–347.
Grizonnet, M., Michel, J., Poughon, V., Inglada, J., Savinaud, M., and Cresson, R. (2017). Orfeo ToolBox: Open source processing of remote sensing images. Open Geospatial Data Softw. Stand. 2:15. doi: 10.1186/s40965-017-0031-6
Hastie, T., Tibshirani, R., and Friedman, J. H. (2009). The elements of statistical learning: Data mining, inference, and prediction, 2nd Edn. New York, NY: Springer.
Havašová, M., Ferenčík, J., and Jakuš, R. (2017). Interactions between windthrow, bark beetles and forest management in the TATRA national parks. For. Ecol. Manag. 391, 349–361. doi: 10.1016/j.foreco.2017.01.009
Hlásny, T., Barka, I., Merganičová, K., Køístek, Š, Modlinger, R., Turčáni, M., et al., (2022). A new framework for prognosing forest resources under intensified disturbance impacts: Case of the Czech Republic. For. Ecol. Manag. 523:120483. doi: 10.1016/j.foreco.2022.120483
Hlásny, T., Zajíčková, L., Turčáni, M., Holuša, J., and Sitková, Z. (2011). Geographical variability of spruce bark beetle development under climate change in the Czech Republic. J. For. Sci. 57, 242–249. doi: 10.17221/104/2010-JFS
Hlásny, T., Zimová, S., Merganičová, K., Štěpánek, P., Modlinger, R., and Turčáni, M. (2021). Devastating outbreak of bark beetles in the Czech Republic: Drivers, impacts, and management implications. For. Ecol. Manag. 490:119075. doi: 10.1016/j.foreco.2021.119075
Huete, A., Didan, K., Miura, T., Rodriguez, E. P., Gao, X., and Ferreira, L. G. (2002). Overview of the radiometric and biophysical performance of the MODIS vegetation indices. Remote Sens. Environ. 83, 195–213.
Huo, L., Persson, H. J., and Lindberg, E. (2021). Early detection of forest stress from European spruce bark beetle attack, and a new vegetation index: Normalized distance red & SWIR (NDRS). Remote Sens. Environ. 255:112240. doi: 10.1016/j.rse.2020.112240
Immitzer, M., Vuolo, F., and Atzberger, C. (2016). First experience with Sentinel-2 data for crop and tree species classifications in central Europe. Remote Sens. 8:166. doi: 10.3390/rs8030166
Jactel, H., Petit, J., Desprez-Loustau, M.-L., Delzon, S., Piou, D., Battisti, A., et al., (2012). Drought effects on damage by forest insects and pathogens: A meta-analysis. Glob. Change Biol. 18, 267–276. doi: 10.1111/j.1365-2486.2011.02512.x
Jakuš, R., Zajíčkova, L., Cudlín, P., Blaženec, M., Turčani, M., Ježík, M., et al., (2011). Landscape-scale Ips typographus attack dynamics: From monitoring plots to GIS-based disturbance models. iForest 4, 256–261. doi: 10.3832/ifor0589-004
Karkauskaite, P., Tagesson, T., and Fensholt, R. (2017). Evaluation of the plant phenology index (PPI), NDVI and EVI for start-of-season trend analysis of the Northern Hemisphere boreal zone. Remote Sens. 9:485. doi: 10.3390/rs9050485
Kärvemo, S., Van Boeckel, T. P., Gilbert, M., Grégoire, J.-C., and Schroeder, M. (2014). Large-scale risk mapping of an eruptive bark beetle – Importance of forest susceptibility and beetle pressure. For. Ecol. Manag. 318, 158–166. doi: 10.1016/j.foreco.2014.01.025
Keeling, C. I. (2016). “Bark beetle research in the postgenomic Era,” in Advances in Insect physiology, Vol. 50, eds T. Claus and G. J. Blomquist (Cambridge, MA: Academic Press), 265–293.
Kim, Y. (2013). Drought and elevation effects on MODIS vegetation indices in northern Arizona ecosystems. Int. J. Remote Sens. 34, 4889–4899. doi: 10.1080/2150704X.2013.781700
Klouček, T., Komárek, J., Surový, P., Hrach, K., Janata, P., and Vašíček, B. (2019). The use of UAV mounted sensors for precise detection of bark beetle infestation. Remote Sens. 11:1561. doi: 10.3390/rs11131561
Komonen, A., Schroeder, L. M., and Weslien, J. (2011). Ips typographus population development after a severe storm in a nature reserve in southern Sweden: Ips typographus after storm disturbance. J. Appl. Entomol. 135, 132–141. doi: 10.1111/j.1439-0418.2010.01520.x
Koontz, M. J., Latimer, A. M., Mortenson, L. A., Fettig, C. J., and North, M. P. (2021). Cross-scale interaction of host tree size and climatic water deficit governs bark beetle-induced tree mortality. Nat. Commun. 12:129. doi: 10.1038/s41467-020-20455-y
Krokene, P. (2015). “Conifer defense and resistance to bark beetles,” in Bark beetles, eds F. E. Vega and R. W. Hofstetter (Amsterdam: Elsevier), 177–207. doi: 10.1016/B978-0-12-417156-5.00005-8
Lausch, A., Fahse, L., and Heurich, M. (2011). Factors affecting the spatio-temporal dispersion of Ips typographus (L.) in Bavarian Forest National Park: A long-term quantitative landscape-level analysis. For. Ecol. Manag. 261, 233–245. doi: 10.1016/j.foreco.2010.10.012
Lawley, V., Lewis, M., Clarke, K., and Ostendorf, B. (2016). Site-based and remote sensing methods for monitoring indicators of vegetation condition: An Australian review. Ecol. Indic. 60, 1273–1283. doi: 10.1016/j.ecolind.2015.03.021
Lindner, M., Maroschek, M., Netherer, S., Kremer, A., Barbati, A., Garcia-Gonzalo, J., et al., (2010). Climate change impacts, adaptive capacity, and vulnerability of European forest ecosystems. For. Ecol. Manag. 259, 698–709. doi: 10.1016/j.foreco.2009.09.023
Long, J. A., and Lawrence, R. L. (2016). Mapping percent tree mortality due to mountain pine beetle damage. For. Sci. 62, 392–402. doi: 10.5849/forsci.15-046
Marini, L., Lindelöw, Å, Jönsson, A. M., Wulff, S., and Schroeder, L. M. (2013). Population dynamics of the spruce bark beetle: A long-term study. Oikos 122, 1768–1776. doi: 10.1111/j.1600-0706.2013.00431.x
Marini, L., Økland, B., Jönsson, A. M., Bentz, B., Carroll, A., Forster, B., et al., (2017). Climate drivers of bark beetle outbreak dynamics in Norway spruce forests. Ecography 40, 1426–1435. doi: 10.1111/ecog.02769
McDowell, N., Pockman, W. T., Allen, C. D., Breshears, D. D., Cobb, N., Kolb, T., et al., (2008). Mechanisms of plant survival and mortality during drought: Why do some plants survive while others succumb to drought? New Phytol. 178, 719–739. doi: 10.1111/j.1469-8137.2008.02436.x
Meddens, A. J. H., and Hicke, J. A. (2014). Spatial and temporal patterns of Landsat-based detection of tree mortality caused by a mountain pine beetle outbreak in Colorado USA. For. Ecol. Manag. 322, 78–88. doi: 10.1016/j.foreco.2014.02.037
Meddens, A. J. H., Hicke, J. A., Macalady, A. K., Buotte, P. C., Cowles, T. R., and Allen, C. D. (2015). Patterns and causes of observed piñon pine mortality in the southwestern United States. New Phytol. 206, 91–97. doi: 10.1111/nph.13193
Meddens, A. J. H., Hicke, J. A., Vierling, L. A., and Hudak, A. T. (2013). Evaluating methods to detect bark beetle-caused tree mortality using single-date and multi-date Landsat imagery. Remote Sens. Environ. 132, 49–58. doi: 10.1016/j.rse.2013.01.002
Mezei, P., Jakuš, R., Pennerstorfer, J., Havašová, M., Škvarenina, J., Ferenčík, J., et al., (2017). Storms, temperature maxima and the Eurasian spruce bark beetle Ips typographus—An infernal trio in Norway spruce forests of the Central European High Tatra Mountains. Agric. For. Meteorol. 242, 85–95. doi: 10.1016/j.agrformet.2017.04.004
Minařík, R., and Langhammer, J. (2016). Use of a multispectral uav photogrammetry for detection and tracking of forest disturbance dynamics. Int. Arch. Photogramm. Remote Sens. Spatial Inf. Sci. XLI-B 8, 711–718. doi: 10.5194/isprsarchives-XLI-B8-711-2016
Mullen, K. E. (2016). Early detection of mountain pine beetle damage in ponderosa pine forests of the black hills using hyperspectral and worldview-2 data. Master’s thesis. Mankato, MN: Minnesota State University.
Mullen, K., Yuan, F., and Mitchell, M. (2018). The mountain pine beetle epidemic in the black hills, South Dakota: The consequences of long term fire policy, climate change and the use of remote sensing to enhance mitigation. JGG 10:69. doi: 10.5539/jgg.v10n1p69
Netherer, S., Kandasamy, D., Jirosová, A., Blanka, K., Schebeck, M., and Schlyter, F. (2021). Interactions among Norway spruce, the bark beetle Ips typographus and its fungal symbionts in times of drought. J. Pest Sci. 94, 591–614. doi: 10.1007/s10340-021-01341-y
Netherer, S., Matthews, B., Katzensteiner, K., Blackwell, E., Henschke, P., Hietz, P., et al., (2015). Do water-limiting conditions predispose Norway spruce to bark beetle attack? New Phytol. 205, 1128–1141. doi: 10.1111/nph.13166
Netherer, S., Panassiti, B., Pennerstorfer, J., and Matthews, B. (2019). Acute drought is an important driver of bark beetle infestation in Austrian Norway spruce stands. Front. For. Glob. Change 2:39. doi: 10.3389/ffgc.2019.00039
Niemann, K. O., Quinn, G., Stephen, R., Visintini, F., and Parton, D. (2015). Hyperspectral remote sensing of mountain pine beetle with an emphasis on previsual assessment. Can. J. Remote Sens. 41, 191–202. doi: 10.1080/07038992.2015.1065707
Öhrn, P., Langstrom, B., LindelÖw, A., and Bjrklund, N. (2014). Seasonal flight patterns of Ips typographus in southern Sweden and thermal sums required for emergence. Agric. For. Entomol. 16, 1–23.
Ortiz, S., Breidenbach, J., and Kändler, G. (2013). Early detection of bark beetle green attack using terraSAR-X and rapideye data. Remote Sens. 5, 1912–1931. doi: 10.3390/rs5041912
Özçelik, M. S., Tomášková, I., Surový, P., and Modlinger, R. (2022). Effect of forest edge cutting on transpiration rate in Picea abies (L.) H. Karst. For. 13:1238. doi: 10.3390/f13081238
Pedregosa, F., Varoquaux, G., Gramfort, A., Michel, V., Thirion, B., Grisel, O., et al., (2011). Scikit-learn: Machine learning in python. J. Mach. Learn. Res. 12, 2825–2830.
Pinty, B., and Verstraete, M. (1992). GEMI: A non-linear index to monitor global vegetation from satellites. Vegetation 101, 15–20.
Planet Labs, Inc (2022). Planet planet imagery product specifications. San Francisco, CA: Planet Labs, Inc.
QGIS Development Team (2009). QGIS geographic information system. Open source geospatial foundation. Pittsburgh, PA: Q Development Team.
Qi, J., Chehbouni, A., Huete, A., Kerr, Y., and Sorooshian, S. (1994). A modified soil adjusted vegetation index. Remote Sens. Environ. 48, 119–126.
Raffa, K. F. (1988). “The mountain pine beetle in western North America,” in Dynamics of forest insect populations: Patterns, causes, and implications, ed. A. A. Berryman (New York, NY: Plenum), 556–576.
Raffa, K. F., and Berryman, A. A. (1983). The role of host plant resistance in the colonization behavior and ecology of bark beetles (Coleoptera: Scolytidae). Ecol. Monogr. 53, 27–49.
Raffa, K. F., Aukema, B. H., Bentz, B. J., Carroll, A. L., Hicke, J. A., Turner, M. G., et al., (2008). Crossscale drivers of natural disturbances prone to anthropogenic amplification: The dynamics of bark beetle eruptions. Bioscience 58, 501–517.
Raffa, K. F., Grégoire, J.-C., and Staffan Lindgren, B. (2015). “Natural history and ecology of bark beetles,” in Bark beetles, eds F. E. Vega and R. W. Hofstetter (San Diego, CA: Elsevier), 1–40. doi: 10.1016/B978-0-12-417156-5.00001-0
Rautiainen, M., Lukeš, P., Homolová, L., Hovi, A., Pisek, J., and Mõttus, M. (2018). Spectral properties of coniferous forests: A review of in situ and laboratory measurements. Remote Sens. 10:207. doi: 10.3390/rs10020207
Remeš, J. (2017). “The university forest enterprise in Kostelec nad Černými Lesy – a basis for practical education and research at the Faculty of forestry and wood sciences in Prague,” in Proceedings of the Forests for university education: Examples and experiences – SILVA network conference, Faculty of forestry and wood sciences, Czech university of live sciences, Prague, Jun 26th – 28th, 2017, Technische Universität Dresden and Sächsische Landesbibliotek, Dresden, eds P. Schmidt, S. Lewark, J. Remeš, and N. Weber (Prague), 17–22.
Richardson, A. J., and Wiegand, C. L. (1977). Distinguishing vegetation from soil background information. Photogram. Eng. Remote Sens. 43, 1541–1552.
Rondeaux, G., Steven, M., and Baret, F. (1996). Optimization of soil-adjusted vegetation indices. Remote Sens. Environ. 55, 95–107.
Roujean, J., and Breon, F. (1995). Estimating PAR absorbed by vegetation from bidirectional reflectance measurements. Remote Sens. Environ. 51, 375–384.
Rouse, J., Haas, R., Schell, J., and Deering, D. (1973). “Monitoring vegetation systems in the great plains with ERTS,” in Proceedings of the 3rd ERTS Symposium, NASA, (Washington, DC), 309–317.
Seidel, H., Schunk, C., Matiu, M., and Menzel, A. (2016). Diverging drought resistance of scots pine provenances revealed by infrared thermography. Front. Plant Sci. 7:1247. doi: 10.3389/fpls.2016.01247
Senf, C., Pflugmacher, D., Wulder, M. A., and Hostert, P. (2015). Characterizing spectral–temporal patterns of defoliator and bark beetle disturbances using Landsat time series. Remote Sens. Environ. 170, 166–177. doi: 10.1016/j.rse.2015.09.019
Simard, M., Powell, E. N., Raffa, K. F., and Turner, M. G. (2012). What explains landscape patterns of bark beetle outbreaks in Greater Yellowstone? Glob. Ecol. Biogeogr. 21, 556–567.
Sripada, R. (2005). Determining in-season nitrogen requirements for corn using aerial color-infrared photography. Ph.D. dissertation. Raleigh, NC: North Carolina State University.
Sripada, R., Heiniger, R. W., White, J. G., and Meijer, A. D. (2006). Aerial color infrared photography for determining early in-season nitrogen requirements in corn. Agron. J. 98, 968–977.
Stereńczak, K., Mielcarek, M., Modzelewska, A., Kraszewski, B., Fassnacht, F. E., and Hilszczański, J. (2019). Intra-annual Ips typographus outbreak monitoring using a multi-temporal GIS analysis based on hyperspectral and ALS data in the Białowieża Forests. For. Ecol. Manag. 442, 105–116. doi: 10.1016/j.foreco.2019.03.064
Stříbrská, B., Hradecký, J., Čepl, J., Tomášková, I., Jakuš, R., Modlinger, R., et al., (2022). Forest margins provide favourable microclimatic niches to swarming bark beetles, but Norway spruce trees were not attacked by Ips typographus shortly after edge creation in a field experiment. Remote Sens. Environ. 506:119950. doi: 10.1016/j.foreco.2021.119950
Tolasz, R., Míková, T., Valeriánová, A., and Voženílek, V. (eds) (2007). Climate atlas of Czechia, 1st Edn. Prague: Olomouc: Czech Hydrometeorological Institute, Palackého University, 255.
Tucker, C. (1979). Red and photographic infrared linear combinations for monitoring vegetation. Remote Sens. Environ. 8, 127–150.
Vacchiano, G., Garbarino, M., Borgogno Mondino, E., and Motta, R. (2012). Evidences of drought stress as a predisposing factor to Scots pine decline in Valle d’Aosta (Italy). Eur. J. For. Res. 131, 989–1000. doi: 10.1007/s10342-011-0570-9
Väisänen, R., and Heliövaara, K. (1994). Assessment of insect occurrence in boreal forests based on satellite imagery and field measurements. Acta For. Fenn. 243:7505. doi: 10.14214/aff.7505
Van Rossum, G., and Drake, F. L. (2010). The Python language reference. Release 3.0.1 [Repr.]. Hampton, NH: Python Software Foundation.
Virtanen, P., Gommers, R., Oliphant, T. E., Haberland, M., Reddy, T., Cournapeau, D., et al., (2020). SciPy 1.0: Fundamental algorithms for scientific computing in Python. Nat. Methods 17, 261–272. doi: 10.1038/s41592-019-0686-2
Vošvrdová, N., Johansson, A., Turčáni, M., Jakuš, R., Tyšer, D., Schlyter, F., et al., (2023). Dogs trained to recognise a bark beetle pheromone locate recently attacked spruces better than human experts. For. Ecol. Manag. 528:120626. doi: 10.1016/j.foreco.2022.120626
Wallin, K. F., and Raffa, K. (2004). Feedback between individual host selection behavior and population dynamics in an eruptive herbivore. Ecol. Monogr. 74, 101–116.
Weed, A. S., Ayres, M. P., and Hicke, J. A. (2013). Consequences of climate change for biotic disturbances in North American forests. Ecol. Monogr. 83, 441–470. doi: 10.1890/13-0160.1
Wei, M., Jiao, L., Zhang, P., Wu, X., Xue, R., and Du, D. (2023). Spatio-temporal diversity in the link between tree radial growth and remote sensing vegetation index of qinghai spruce on the northeastern margin of the tibetan plateau. Forests 14:260. doi: 10.3390/f14020260
Wermelinger, B. (2004). Ecology and management of the spruce bark beetle Ips typographus—a review of recent research. For. Ecol. Manag. 202, 67–82. doi: 10.1016/j.foreco.2004.07.018
White, J. C., Coops, N. C., Hilker, T., Wulder, M. A., and Carroll, A. L. (2007). Detecting mountain pine beetle red attack damage with EO-1 Hyperion moisture indices. Int. J. Remote Sens. 28, 2111–2121. doi: 10.1080/01431160600944028
Yang, H., Yang, X., Zhang, Y., Heskel, M. A., Lu, X., Munger, J. W., et al., (2017). Chlorophyll fluorescence tracks seasonal variations of photosynthesis from leaf to canopy in a temperate forest. Glob. Change Biol. 23, 2874–2886. doi: 10.1111/gcb.13590
Yang, S. (2019). Detecting bark beetle damage with Sentinel-2 multi-temporal data in Sweden. Master’s thesis. Lund: Lund University.
Zabihi, K., Surovy, P., Trubin, A., Singh, V. V., and Jakuš, R. (2021b). A review of major factors influencing the accuracy of mapping green-attack stage of bark beetle infestations using satellite imagery: Prospects to avoid data redundancy. Remote Sens. Appl. 24:100638. doi: 10.1016/j.rsase.2021.100638
Zabihi, K., Huettmann, F., and Young, B. (2021a). Predicting multi-species bark beetle (Coleoptera: Curculionidae: Scolytinae) occurrence in Alaska: First use of open access big data mining and open source GIS to provide robust inference and a role model for progress in forest conservation. Biodiv. Inf. 16, 1–19. doi: 10.17161/bi.v16i1.14758
Keywords: Picea abies, Ips typographus, spectral vegetation indices, bark beetle infestations, Enhanced Vegetation Index, Visible Atmospherically Resistant Index
Citation: Trubin A, Kozhoridze G, Zabihi K, Modlinger R, Singh VV, Surový P and Jakuš R (2023) Detection of susceptible Norway spruce to bark beetle attack using PlanetScope multispectral imagery. Front. For. Glob. Change 6:1130721. doi: 10.3389/ffgc.2023.1130721
Received: 23 December 2022; Accepted: 19 May 2023;
Published: 02 June 2023.
Edited by:
Paal Krokene, Norwegian Institute of Bioeconomy Research (NIBIO), NorwayReviewed by:
Johannes Schumacher, Norwegian Institute of Bioeconomy Research (NIBIO), NorwayRoman Sitko, Technical University in Zvolen, Slovakia
Copyright © 2023 Trubin, Kozhoridze, Zabihi, Modlinger, Singh, Surový and Jakuš. This is an open-access article distributed under the terms of the Creative Commons Attribution License (CC BY). The use, distribution or reproduction in other forums is permitted, provided the original author(s) and the copyright owner(s) are credited and that the original publication in this journal is cited, in accordance with accepted academic practice. No use, distribution or reproduction is permitted which does not comply with these terms.
*Correspondence: Aleksei Trubin, dHJ1YmluQGZsZC5jenUuY3o=