 Shenshen Guo
 Zhixiang Wu
 Wenjie Liu
 Zhongyi Sun
 Lan Wu
 Mengyang Fang4
 Peng Wang
- 1College of Ecology and Environment, Hainan University, Haikou, Hainan, China
- 2Hainan Danzhou Tropical Agro-ecosystem National Observation and Research Station, Danzhou, Hainan, China
- 3Rubber Research Institute, Chinese Academy of Tropical Agricultural Sciences (CATAS), Haikou, Hainan, China
- 4Haikou Marine Geological Survey Center, China Geological Survey, Haikou, China
Understanding the water use efficiency (WUE) of rubber plantations to seasonal fluctuations is critical for understanding the water, energy, and carbon cycle in tropical regions. In this study, we examine the exchange of water and heat fluxes between land and atmosphere in rubber plantation ecosystems during monsoon and drought seasons, employing data collected from eddy covariance towers. Further attribution analysis demonstrates that drought-induced alterations in the water use efficiency are predominantly governed by changes in surface resistance (positive contribution). The contributions of incoming shortwave radiation are virtually counteracted by air temperature and longwave radiation. It is noteworthy that the light use efficiency presents the most conspicuous negative contribution; however, this effect is predominantly counterbalanced by vapor pressure deficit (VPD) and aerodynamic resistance. The elevated water use efficiency (WUE) observed in rubber plantation ecosystems during the drought season raises concerns regarding the potential implications of anthropogenic forests on food and water security in tropical regions.
1. Introduction
Tropical forests serve as crucial components in terrestrial energy, water, and carbon cycles (FAO, 2020). Land ecosystems in tropical regions act as significant terrestrial carbon sinks (Nakicenovic and Swart, 2000; Friedlingstein et al., 2006; Tagesson et al., 2020). Consequently, it is essential to thoroughly examine the water and heat flux exchange mechanisms, as well as the associated physical processes that govern surface energy balance within tropical forest ecosystems. Such investigations will enhance our understanding of climate change dynamics and their intricate relationships with carbon cycling (Mitchard, 2018; Uuh-Sonda et al., 2022).
In tropical regions, the interplay between land and atmosphere significantly influences local climatic conditions (Dirmeyer, 2011; Gentine et al., 2019). Exhibiting pronounced isohydric behavior, tropical forests stringently modulate stomatal conductance as a response to augmented atmospheric vapor pressure deficit (VPD) arising from elevated air temperatures (Novick et al., 2016; Gerken et al., 2018). Predominantly, energy limitations constrain the evapotranspiration of tropical forests (Mallick et al., 2016); nevertheless, moisture limitations manifest during drought episodes (Gatti et al., 2014). This underlines the imperative of concurrently addressing energy and water variables within the context of ecosystem water constraints (Green et al., 2019; Denissen et al., 2022). Water use efficiency (WUE), delineated as the proportion of carbon assimilation through photosynthesis relative to water loss via transpiration, functions as an indicator of the correlative exchange rate of CO2 and water between vegetation and the atmosphere (Morison, 1985; Eamus, 1991; Lavergne et al., 2019), namely.
Where WUE is water use efficiency (gC/m2/mm), GPP (gC/m2) is the gross primary productivity, ET (mm) is evapotranspiration.
Besides soil moisture, plants display a marked sensitivity to variations in atmospheric moisture content (Sulman et al., 2016). Notably, atmospheric water demand, as indicated by the vapor pressure deficit, has a direct bearing on the stomatal interface responsible for water passage. Under high vapor pressure deficit conditions, plants respond by closing their stomata to avoid excessive water loss (Bachofen et al., 2023). In a study examining the influence of atmospheric moisture on forests, Liu et al. (2017) analyzed 13 temperate and tropical forest biomes globally using a soil-plant-atmosphere dynamic model and found that increased atmospheric moisture plays a pivotal role in reducing forest mortality risk. Moreover, it has been established that, under warming conditions, an escalation in vapor pressure deficit diminishes forest CO2 uptake, resulting in a decline in aggregate forest primary productivity (Restaino et al., 2016; Sulman et al., 2016), which subsequently impacts forest vegetation growth. Lansu et al. (2020) observed that in the presence of higher vapor pressure deficit and concomitant elevated temperature conditions, forests exhibit reduced evapotranspiration and increased sensible heat flux release. This feedback mechanism concerning vapor pressure deficit can substantially augment forest temperature by up to 2K. Chen et al. (2021) postulated that the vapor pressure deficit triggers the seasonality of leaf phenology and photosynthesis. Some studies integrating soil and atmospheric moisture found that greater soil water content and atmospheric moisture correlated with increased plant diversity (Deng et al., 2016). Thus, examining the spatial and temporal variability of water in forest ecosystems and its influencing factors is crucial in climate change prediction, woodland ecohydrological processes, and ecosystem services research (Chang et al., 2021).
The rubber plantation is one of the native species in the tropical forest in Amazonia, with its successful introduced in Southeast Asia in the late 19th century, it has been a major economic plantation in the locality. The rubber plantation generally consumes about 72% of net radiation for evapotranspiration (Giambelluca et al., 2016; Pierret et al., 2016; Ruairuen et al., 2021), which raises concerns about water security in the plantation region (Tan et al., 2011; Niu et al., 2019). Studies have demonstrated that atmospheric dryness, rather than soil water is the major driver leading to canopy evaporation during drought season (Sopharat et al., 2015). Guardiola-Claramonte et al. (2010) revealed that vapor pressure deficit and air temperature have direct influences on water consumption. However, it remains to be examined whether sustained transpiration rates or the decoupling of transpiration and photosynthesis is widespread in monsoon season and sensitive to biophysical processes rather than enough water availability.
Considering the distinct characteristics of rubber plantations within tropical ecosystems, the objectives of this study are to: (1) obtain the seasonal variation of WUE, biophysical factors and water flux; (2) employ an attribution method to identify the dominant controlling factors of seasonal differences induced changes in WUE. This paper is organized as follows: (Section “2. Data and methods”) introduces the eddy covariance data and the attribution framework; (Section “3. Results and discussion”) presents the difference in environmental and biophysical factors between monsoon and drought seasons, and engages in a discussion of the implications of the attribution results derived from this study; (Section “4. Conclusion”) summarizes the study.
2. Data and methods
2.1. Flux measurement and data processing
The eddy covariance data was collected at Danzhou Tropical Agro-ecosystem National Observation and Research Station (short for DZ), located in Danzhou, Hainan Province, China (109°28′06″E, 19°32′16″N, altitude 114 m, Figure 1) from Jan 2010 to Dec 2020. The experimental site located at a typical tropical monsoon climate zone, which has an extraordinarily monsoon season (May to Sep) and pronounced drought seasons (Oct to Apr). The annual temperature at the DZ site ranges from 21.5 to 28.5°C. The site receives 1504.7 mm of annual precipitation, with the majority (80%) occurring between July and September. The forest canopy at this location reaches an approximate height of 20 meters.
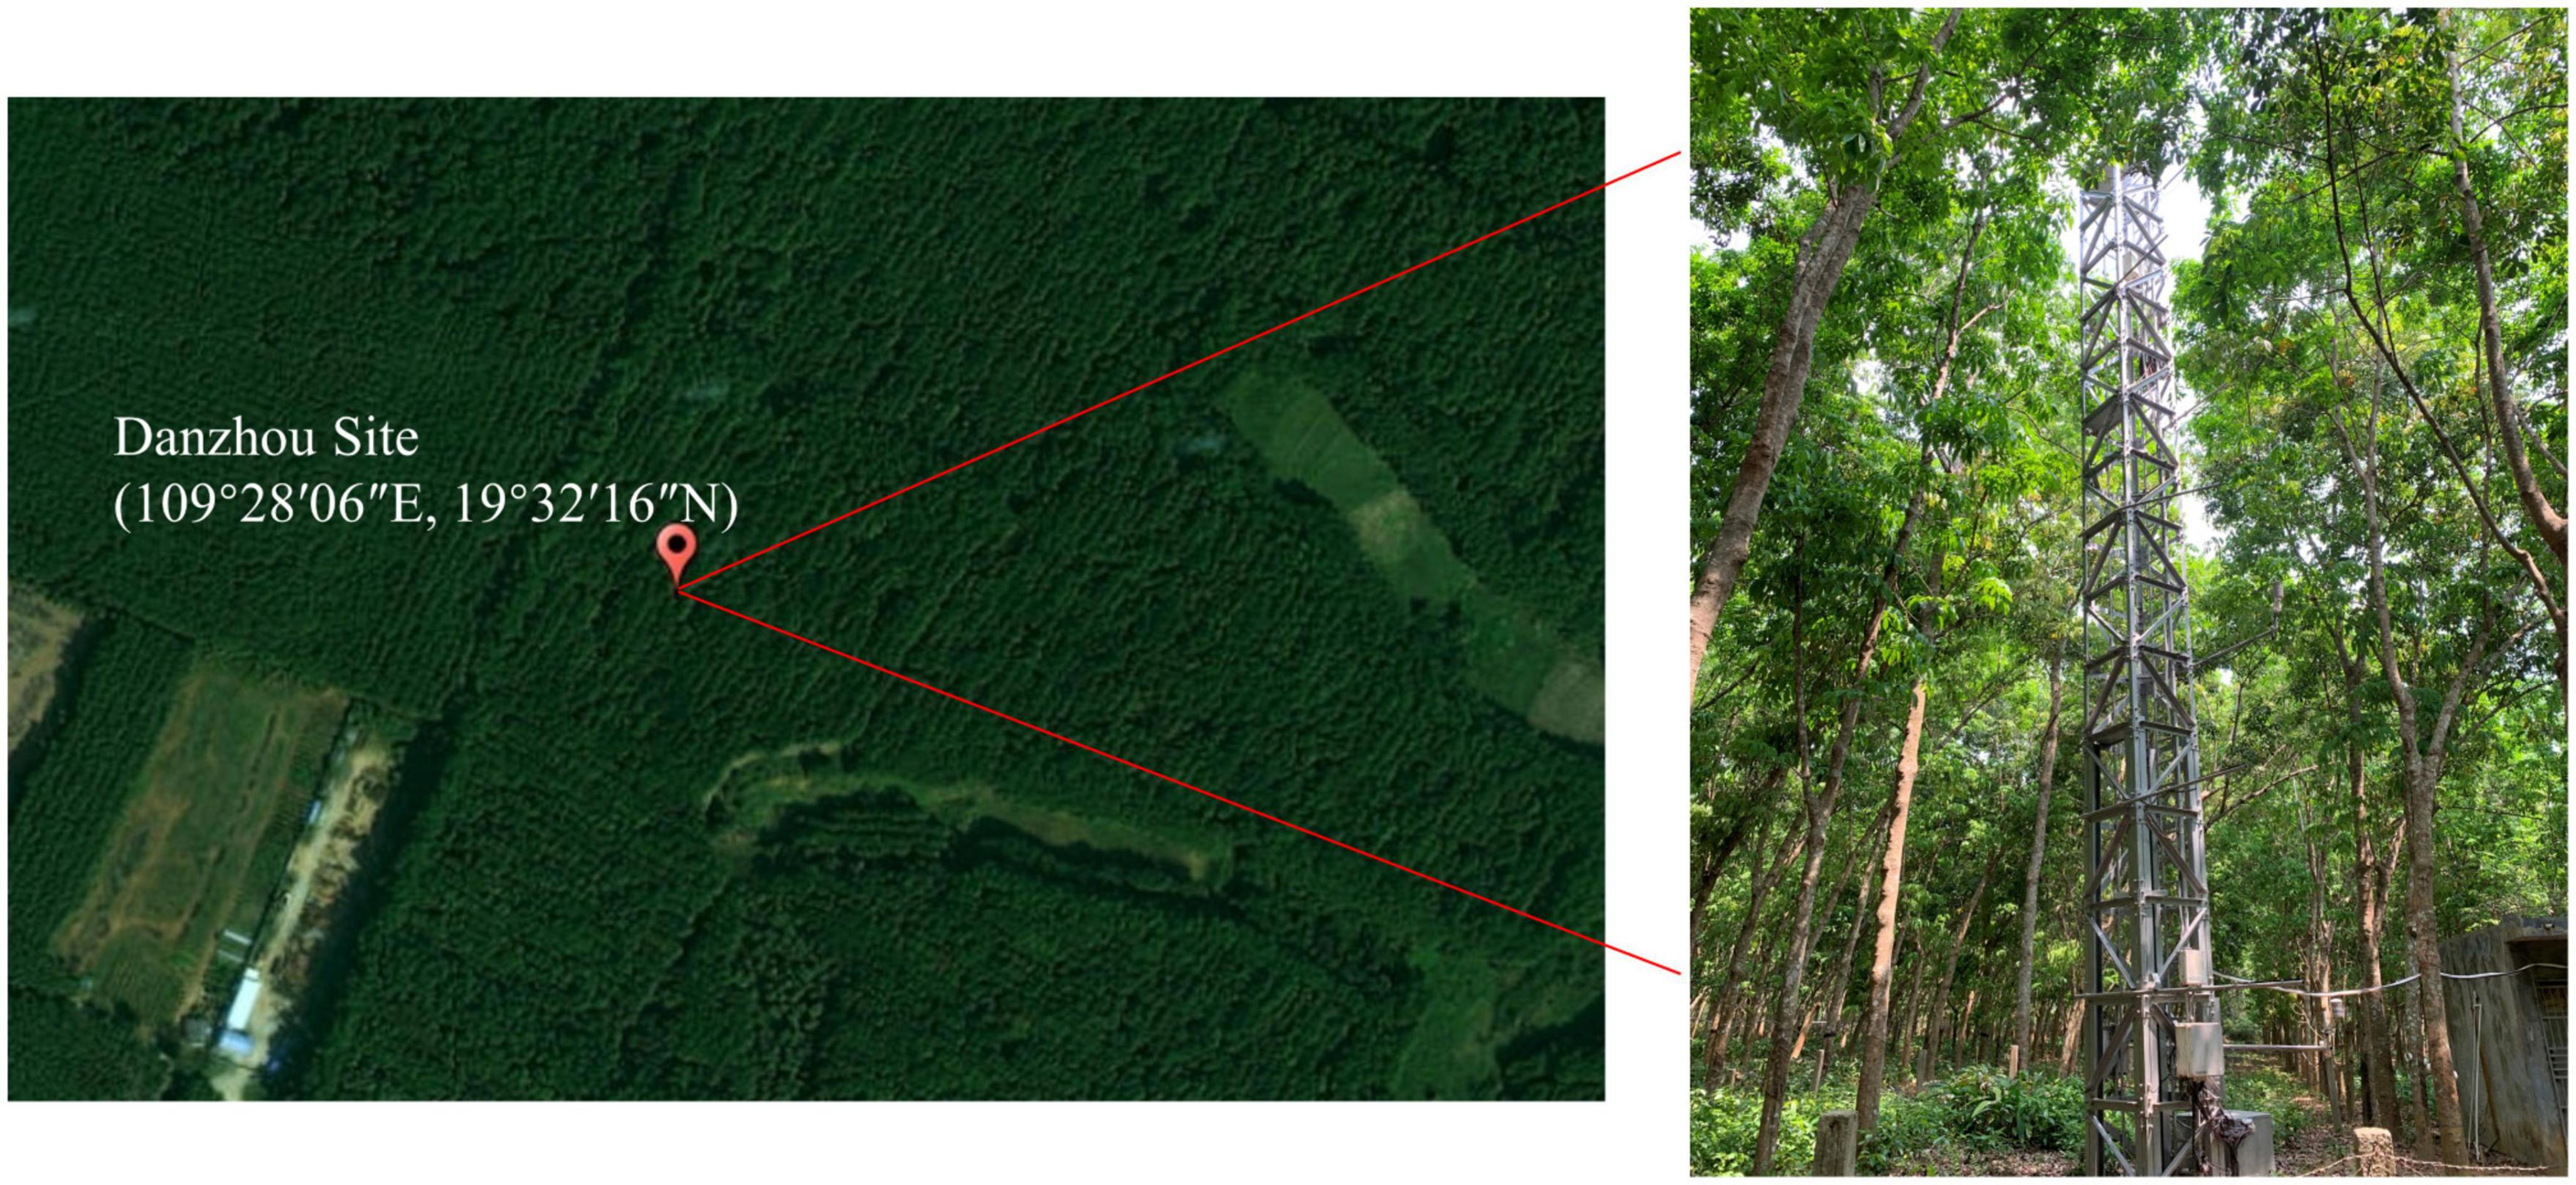
Figure 1. The location of Danzhou Tropical Agro-ecosystem National Observation and Research Station.
The vorticity flux system at this study site has been conducting near-surface flux observations since November 2009, from 1 m below ground to 50 m at the top of the observation tower. The measured data contain both above- and below-ground components. The above-ground section mainly measures wind speed (three-cup anemometer, Met 010C-1, Met One, Inc., USA), temperature and humidity (hygrometer, HMP45C; Inc., Vaisala, Finland), wind direction (anemometer, Met 020C-1, Met One, USA), CO2 and water vapor fluxes (open-circuit infrared CO2/H2O gas analyzer, LI-7500, Li-cor Inc. H2O gas analyzer, LI-7500, Li-Cor Inc., USA), incident long-wave and short-wave radiation, and outgoing long-wave and short-wave radiation (Radiation Observation Sensor (CNR-1, Kipp and Zonen, Inc., Holland). The subsurface part of the measurement objects are soil moisture (Soil Moisture Sensor, CS616-L, Campbell Scientific Inc., Logan, UT, USA), soil temperature (Soil Temperature Observer, 109, Campbell Scientific Inc., Logan, UT, USA), soil heat flux (Soil Heat Flux Plate, HFP01. Hukseflux, Inc., Holland). In addition, we obtain the fPAR data from the MODIS15A2H data product (2010 to 2020) with a spatial resolution of 500 m. The temporal compositing period is 8 days; it can be downloaded at NASA EARTHDATA1 and processed as daily scale data when used.
2.2. Identification of monsoon season
Numerous methodologies have been established for determining the onset of monsoon seasons in tropical regions (Liebmann et al., 2007; Butt et al., 2011). Stern and Coe (1982) characterized the onset of the monsoon season as the initial day when precipitation reaches or exceeds 20 mm/day for two or three consecutive days, provided that there is no subsequent 7-day or longer period with zero precipitation within the following month.
The DZ exhibits a pronounced monsoon season from May to Oct, driven by the southwest monsoon originating from the Indian Ocean, and a drought period spanning from Nov to Apr. In contrast to previous studies that defined the monsoon season as beginning in May and ending in October (Lu et al., 2014; Titlyanov et al., 2019; Bahadur et al., 2022), we adopted and modify the definition provided by Stern and Coe (1982). According to their criteria, the onset of the monsoon season is marked by the first day on or after May 1st, when daily precipitation exceeds 1mm, followed by at least one additional rain event (daily precipitation greater than 1 mm) within the subsequent 3-day period and we define the end of the rainy season as the time in October when there is a consecutive 7-day period with 0 mm of rainfall. If this does not occur, the end of the rainy season is set as October 30th.
2.3. Quantify attribution method
The latent heat flux is calculated from Penman’s equation (Monteith, 1965):
where λ is the latent heat of vaporization of water (2.45 × 10⁶ J/kg); Δ is the slope of the vapor pressure deficit and temperature, Rn is the net radiation (W/m2); G is the soil heat flux (W/m2), ρ is the mean air density (1.2 kg/m3), Cp is the specific heat of air at constant pressure (1,005 J/kg/K), VPD means the vapor pressure deficit (kPa), γ is the dry wet constant, ra is the aerodynamic resistance (s/m), rs is the surface resistance (s/m).
ra was calculated using the method proposed by Thom (1972):
where Zm is the wind speed measurement height (m), Zh is the humidity measurement height (m), d is the zero-plane displacement height (m), Zom=0.1 h; Zoh=0.01 h, d=0.63 h, h is the canopy height (m), k(0.41) is the von Karman constant, and U is the wind speed measured at height Zm.
And then, we can obtain the rs calculation by inverting the PM formula:
Where, Hs is the measured sensible heat flux (W/m2), which is calculated as:
Where Ts is the surface temperature, and to ensure the relative independence of the influencing factors, we decompose them into functions composed of different variables by referring to Liao et al. (2018):
Where ε is the surface emissivity and equal to 0.92, , , , .
According to the EC-LUE model proposed by Yuan et al. (2007), the GPP can be calculated as follows:
where PAR is photosynthetically active radiation (can be calculated by incoming shortwave radiation), fPAR is the proportion of photosynthetically active radiation absorbed by the vegetation canopy, which is MODIS 15A2 from USGS [LP DAAC–MOD15A2H (usgs.gov)] with a temporal resolution of 8 days and a spatial resolution of 500 m. and LUE is light use efficiency.
Then, we substitute the calculation of each variable into the WUE equation to see that WUE is a function variable consisting of different influencing factors:
where a1,a2,⋅,an represents atmospheric factors, b1, b2,⋅,bn represents biophysical factors.
This study addresses two main issues: (1) the status of the change in WUE from monsoon to drought season; and (2) the role and specific contribution of each atmospheric and biophysical factor in the change of WUE. In the analysis, the change in WUE from the monsoon to drought season is considered the result of changes in several variables. Based on this, the article quantifies the role of critical atmospheric and surface biophysical factors in WUE variability by referring to the analytical framework of the TRM method (Liao et al., 2018). A first-order derivation of Eq. (9):
where delta represents change (e.g., △WUE=WUEdrought-WUEmonsoon), the partial deritive represent the sensitivities of WUE to changes in biophysical and atmospheric parameters. Each term on the right side of Equation 8 can be thought of as “contribution” with two components: (1) sensitivity (partial derivative) and (2) change. The contribution of a variable xi to WUE correspond to dWUE/dxi*Δxi (e.g., the contribution of Ta to WUE corresponds to dWUE/dTa*Δ Ta).
2.4. Application of the attribution method to observational data
This paper focuses only on the 9-h period during the day when the heat flux is high (8:00 to 17:00 local time). To ensure the representativeness of the data, at least 50% of the data amount is available for each calculation day during the 9 h.
Because the imputation method is based on the first-order Taylor expansion, it ignores higher-order and cross-order terms. In general, the error of this method is acceptable only when the variation of the imputed variables is slight. However, the biophysical and atmospheric factors are highly variable, and the estimated partial derivatives in the reference state (monsoon season) can easily cause significant errors. Therefore, we introduced a weighted average method to optimize the results (Liao et al., 2018), which can minimize the error in the WUE variation:
where X is the optimal partial differential term used in the model and m is the average weighting factor, m is the average weight. xmonsoon is the partial derivatives calculated only using data in monsoon season, and xdrought is the partial derivatives calculated only using data in drought season.
3. Results and discussion
3.1. Seasonal variations in water use efficiency
Our examination of the annual variation in water use efficiency, gross primary productivity, and evapotranspiration in rubber forests, as well as the differences between monsoon and drought seasons (Figure 2), revealed a distinct “unimodal” distribution of gross primary productivity throughout the year. The highest values were observed during the monsoon season, with a considerable seasonal difference (P < 0.01) in the daily average values between monsoon and drought seasons. The daily average gross primary productivity was approximately 20.76 gC/m2 in the monsoon season and 11.46 gC/m2 in the drought season, representing a 44.80% decrease in ecosystem gross primary productivity from monsoon to drought season (Figures 2A, D).
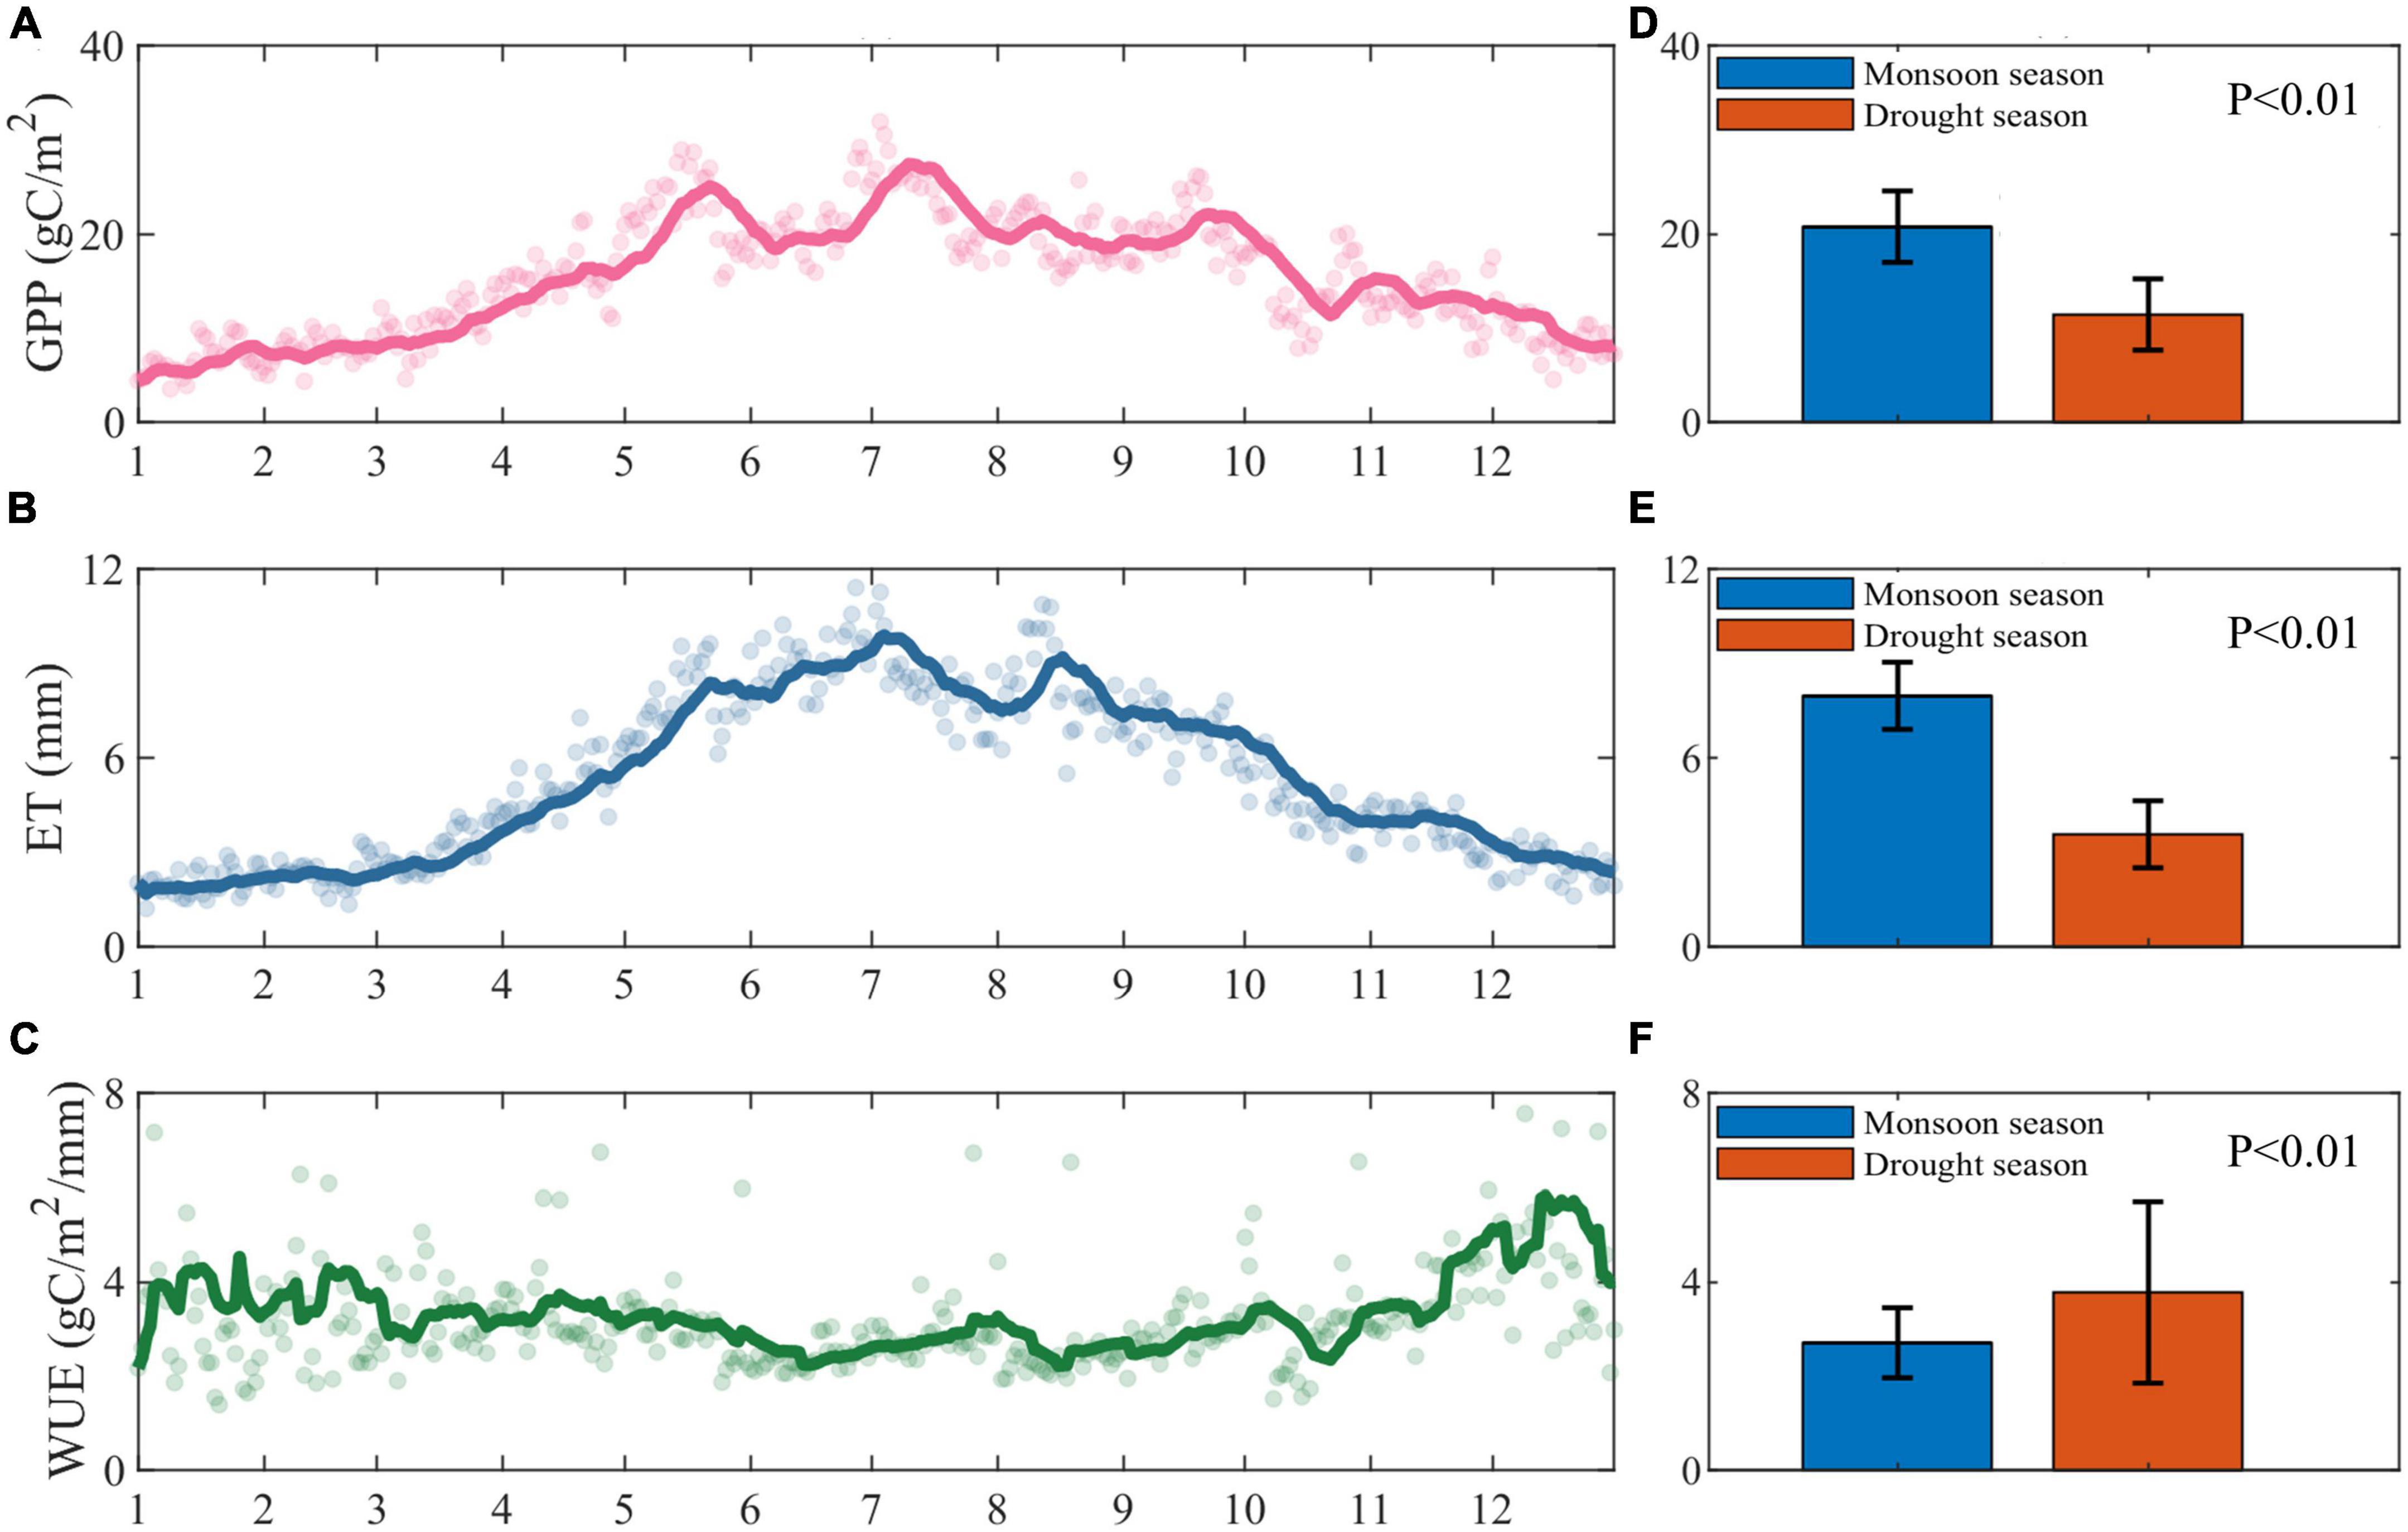
Figure 2. Annual changes in (A) gross primary productivity (GPP), (B) evapotranspiration (ET), and (C) water use efficiency (WUE) from 2010 to 2020, with the dots indicating the daily means of the variables, the line representing the 14-day moving average of the variables, and (D–F) the blue and orange bars of the three representing the multi-year daily means of the monsoon and drought seasons, respectively. The error bars represent the standard deviations of the variables in the monsoon and drought seasons, respectively.
Similarly, evapotranspiration exhibited a “unimodal” intra-annual distribution, with the highest values occurring during the monsoon season and a significant seasonal difference (P < 0.01) in the mean values of evapotranspiration between monsoon and drought seasons. The average daily evapotranspiration was approximately 7.75 mm in the monsoon season and 3.25 mm in the drought season, with the monsoon season values being 4.61 mm higher than those in the drought season (Figures 2B, E). This resulted in a 58.06% reduction in evapotranspiration from the monsoon season to the drought season.
Overall, the intra-annual variation in water use efficiency demonstrated low values during the monsoon season and high values during the drought season, characterized by significant fluctuations in the drought season and modest oscillations in the monsoon season. Water use efficiency displayed a monotonic decrease from the beginning of the drought season in January until the onset of the monsoon season, reaching its lowest point midway through the monsoon season, and subsequently gradually increasing to its maximum level during the drought season. By averaging water use efficiency for the drought and monsoon seasons from 2010 to 2020, it becomes evident that the means of water use efficiency for the monsoon and drought seasons differ significantly (P < 0.01). The multi-year mean for the drought season is markedly higher than that of the monsoon season, with the drought season mean being approximately 3.77 gC/m2/mm and the monsoon season mean at around 2.71 g C/m2/mm. The drought season mean is higher than the monsoon season mean by 1.07 g C/m2/mm (Figures 2C, F).
3.2. Variability in physiological and biological drivers of water use efficiency
Figure 3 illustrates the intra-annual variation and daily observations of environmental parameters at the DZ site from 2010 to 2020. Vapor pressure deficit (VPD) (Figures 3A, F), incoming shortwave radiation (Figures 3B, G), incoming longwave radiation (Figures 3C, H), precipitation (Figures 3D, I) and light use efficiency (Figures 3E, J) both display prominent seasonal fluctuations, increasing prior to the monsoon season, peaking during the monsoon season, and subsequently decreasing to drought season levels. The average incoming shortwave radiation during the monsoon season is 111.49 W/m2 greater than that observed in the drought season, while the mean incoming longwave radiation is 39.34 W/m2 higher in the monsoon season compared to the drought season (Table 1). Similarly, the vapor pressure deficit gradually increases before the monsoon season and begins to decrease after entering the monsoon season (Figures 3B, H), with the monsoon season mean value being 1.05 kPa higher than the drought season (Table 1).
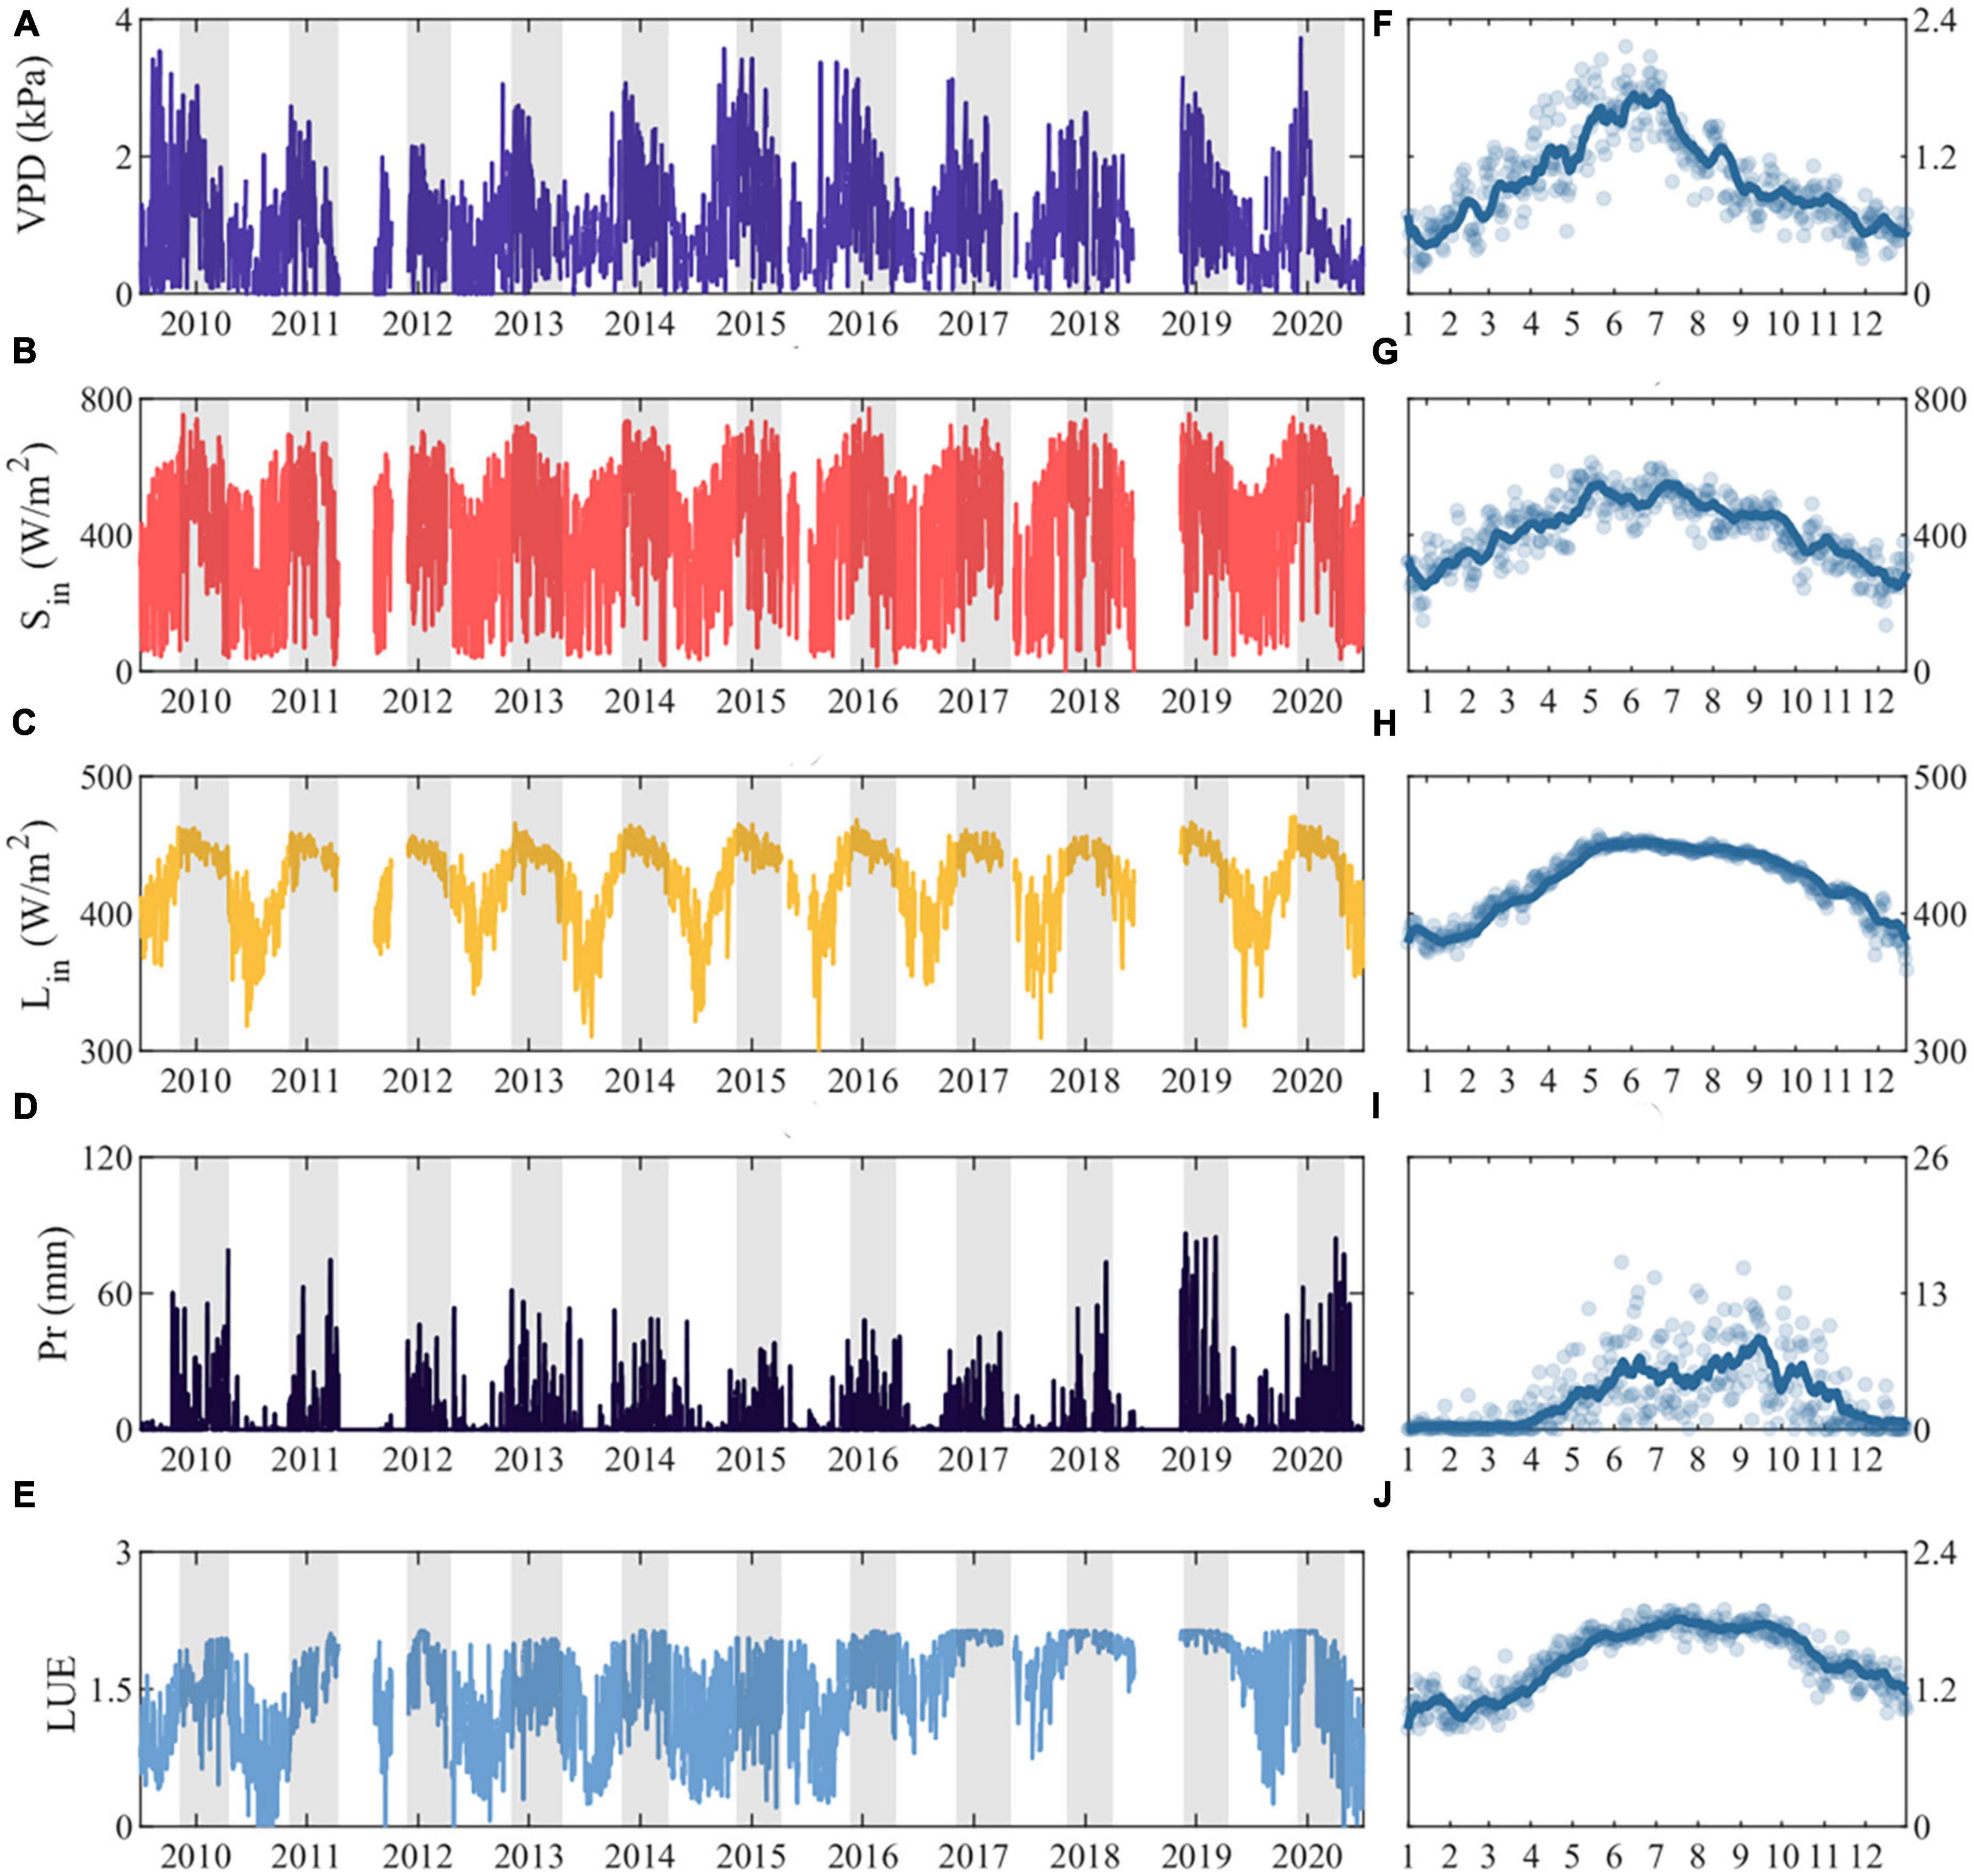
Figure 3. Interannual variation of (A) Vapor pressure deficit (VPD), (B) incoming shortwave radiation (Sin), (C) incoming longwave radiation (Lin), (D) Precipitation (Pr), (E) Light use efficiency (LUE) for 2010–2020, with shaded areas showing the monsoon season periods for each year, (F–J) represent the intra-annual variations of the multi-year daily mean values for each variable, with the line depicting the 14-day moving average.

Table 1. Changes in atmospheric and biophysical factors from monsoon to drought season.
3.3. Attribution of seasonal differences in water use efficiency
Changes in the WUE from monsoon season to drought season (short for △WUE) are decomposed to contributions from into five atmospheric factors (air temperature, air pressure, vapor pressure deficit, incoming shortwave radiation, incoming longwave radiation) and six biophysical factors (fraction of absorbed photosynthetically active radiation, surface albedo, light use efficiency, soil heat flux, surface resistance, and aerodynamic resistance). As shown in Figure 4, Part I demonstrates that the model △WUE closely aligns with the observed △WUE. Next, we summarize the contributions of atmospheric and biophysical factors. Part II reveals that the total contributions of both atmospheric and biophysical factors are positive, indicating that these factors tend to enhance WUE upon entering the drought season. Notably, the contribution of atmospheric factors surpasses that of biophysical factors.
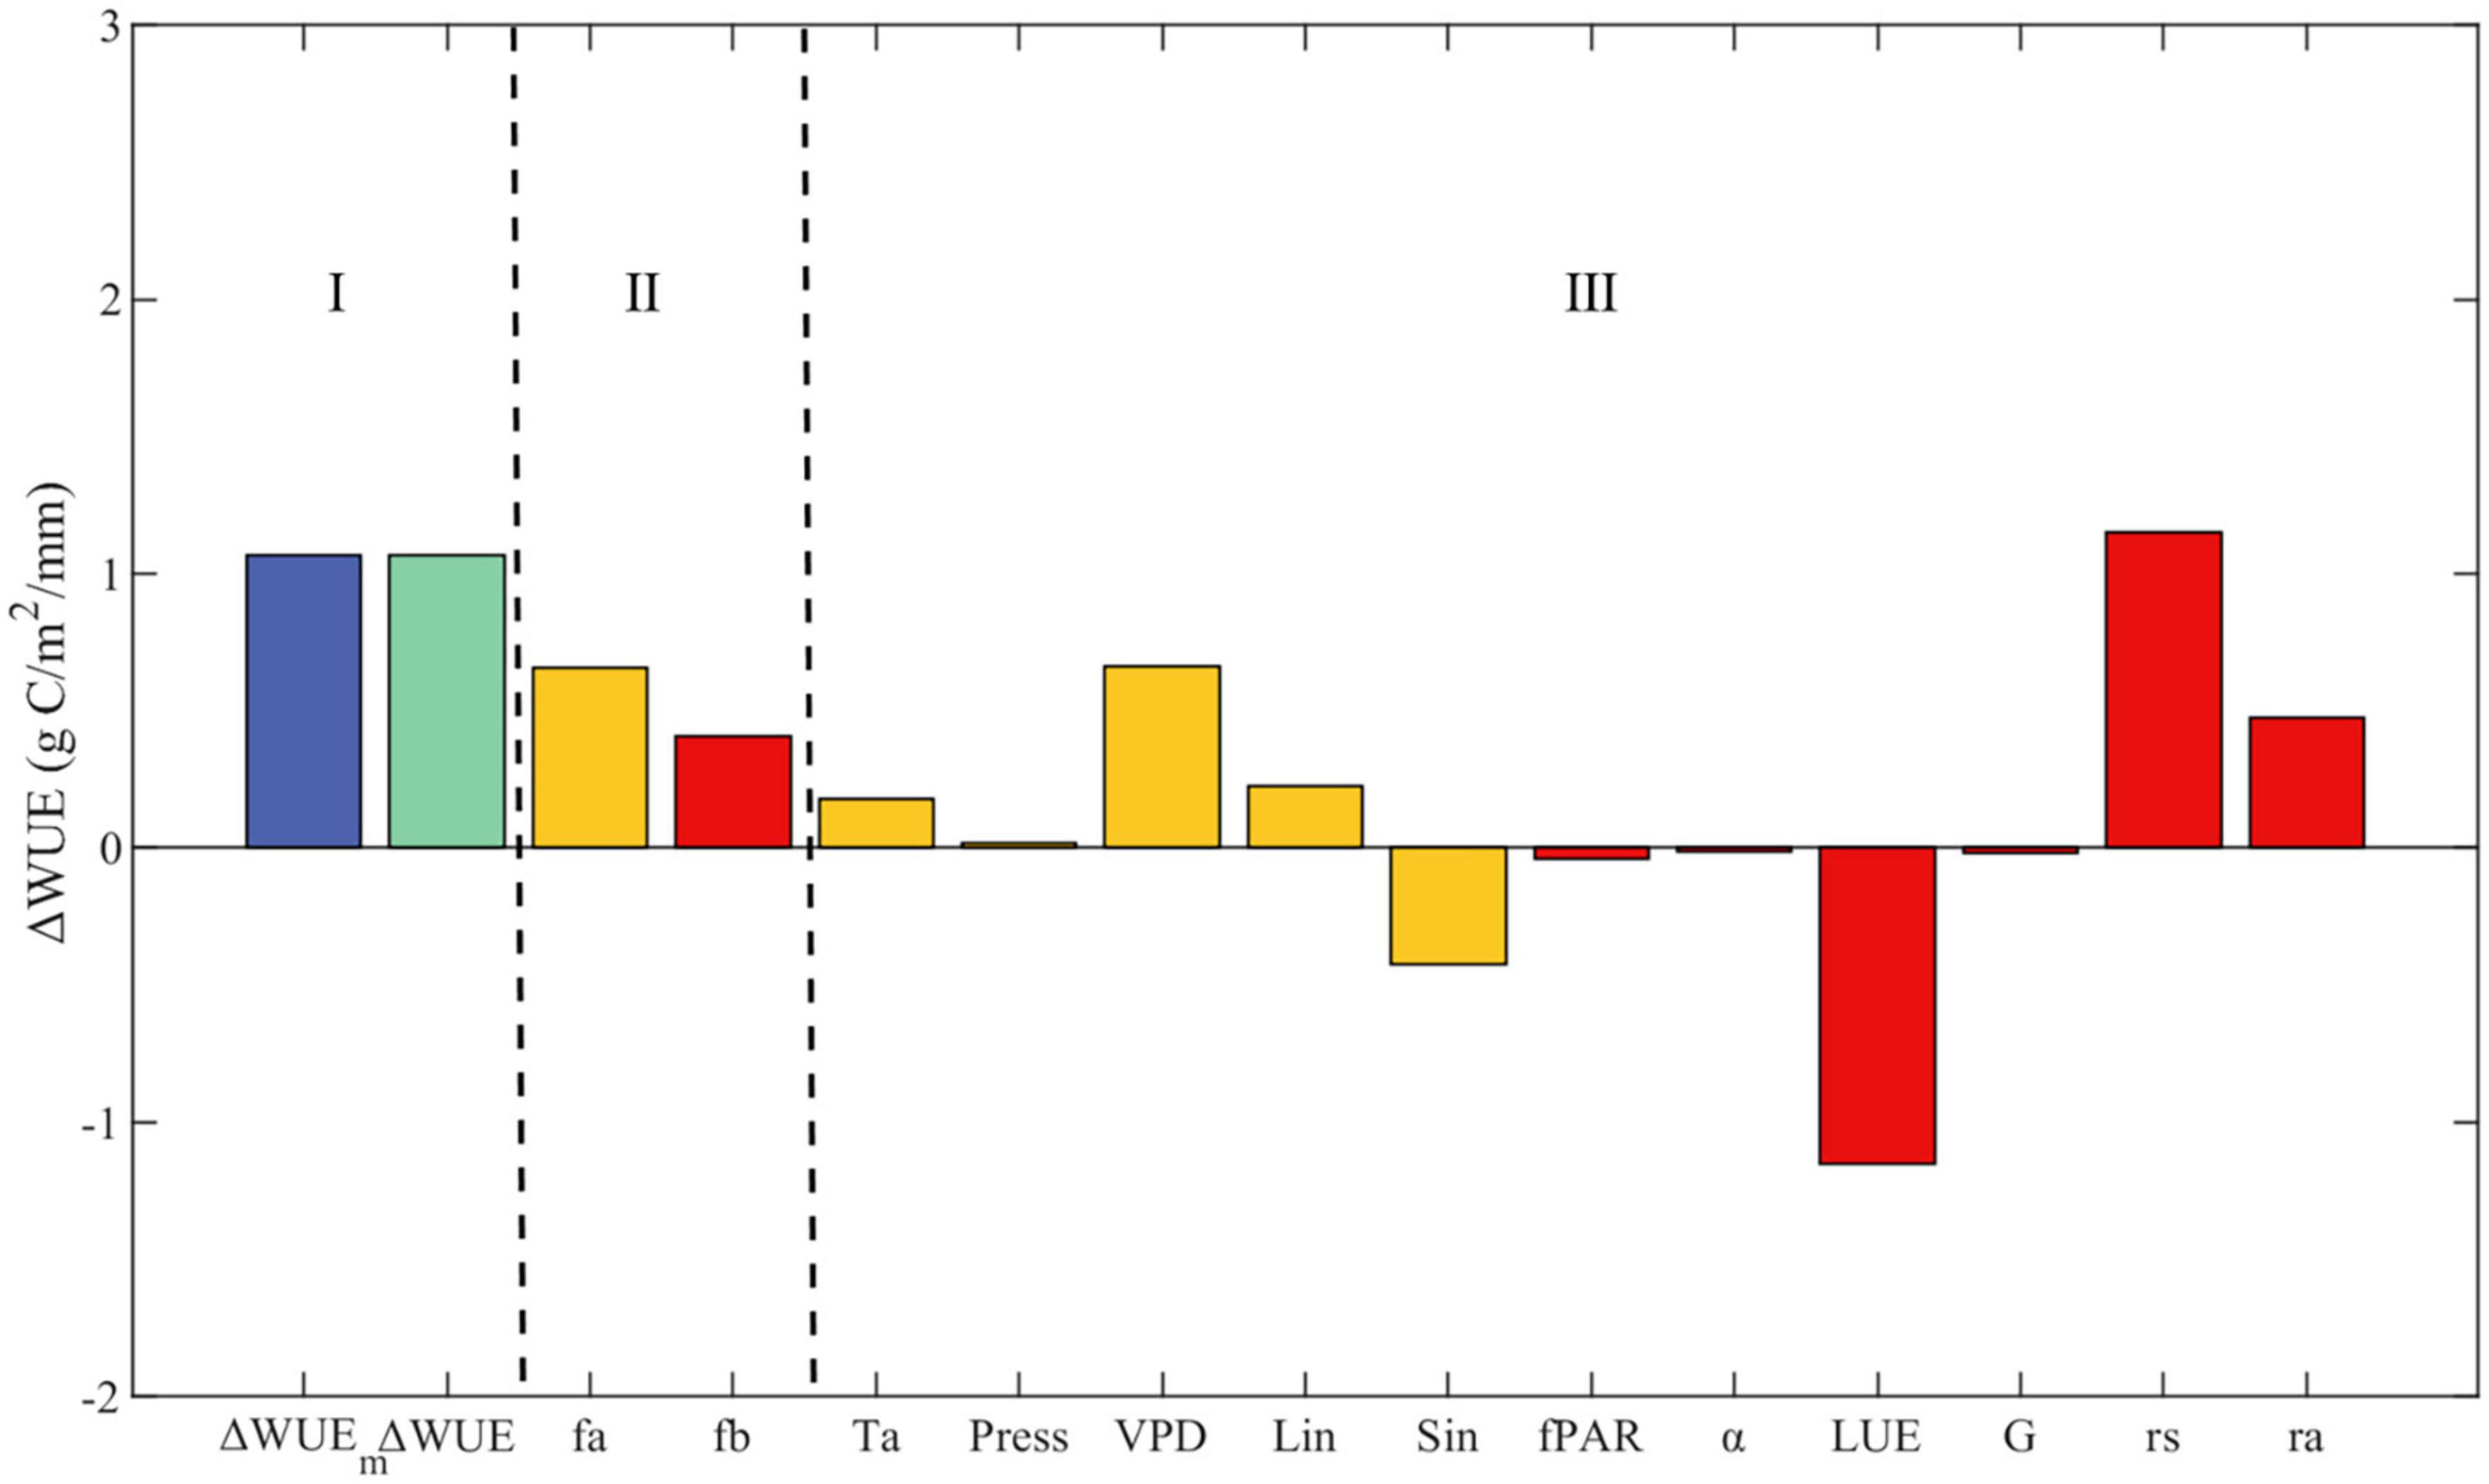
Figure 4. Attribution of changes in water use efficiency. ΔWUE and ΔWUEm are the water use efficiency and model-calculated variation based on the measured values, respectively. Ta, Press, VPD, Lin, Sin, fPAR, α, LUE, G, rs, ra represent the contributions of air temperature, atmospheric pressure, vapor pressure deficit, incoming longwave radiation, incoming shortwave radiation, fraction of absorbed photosynthetically active radiation, surface albedo, light use efficiency, soil heat flux, surface resistance, and aerodynamic resistance, respectively.
Among the atmospheric factors third part in Figure 4, yellow bars, temperature, vapor pressure deficit, and incoming longwave radiation contribute positively. As illustrated in Table 2, the sensitivity of WUE to temperature, incoming longwave radiation, and vapor pressure deficit is negative; thus, a decrease in these three factors during the drought season results in an increase in WUE at this time of year. Moreover, the sensitivity of WUE to changes in incoming shortwave radiation in Table 2 is positive. Consequently, a decrease in incoming shortwave radiation during the drought season leads to diminished WUE during this period, which accounts for the negative contribution of incoming shortwave radiation. This negative contribution is counterbalanced by the positive contributions from temperature, VPD, and incoming longwave radiation, while the effect of atmospheric pressure is negligible.

Table 2. Sensitivities of the evaporative fraction to changes in atmospheric and biophysical factors.
Among the biophysical factors part III in Figure 4, red bars, the mean value of the fraction of absorbed photosynthetically active radiation (fPAR) by the vegetation canopy is only 0.01 higher in the drought season than in the monsoon season (Table 1). The sensitivity of WUE to fPAR is greater (4.81) and positive, leading to a negative contribution from the increasing fPAR. Light use efficiency (LUE) in the drought season is 0.48 lower than in the monsoon season, and the sensitivity of WUE to this change is higher at 2.37, implying that the decrease in LUE during the drought season results in a reduction in WUE. Surface resistance (rs) increases in the drought season, which enhances WUE (the sensitivity of WUE to change is positive, and rs is higher in the drought season than in the monsoon season). According to Table 2, the sensitivity of WUE to aerodynamic resistance is negative, which means that a decrease in aerodynamic resistance during the drought season leads to an increase in WUE during the same period. The positive contributions from aerodynamic resistance and surface resistance together offset the negative contribution from LUE.
3.4. The mechanism of environmental factors affecting WUE
As the transition from the monsoon to the drought season occurs, the interplay between LUE, rs, and WUE becomes more prominent. The underlying mechanisms responsible for these changes involve a complex interplay of various factors rather than being controlled by a single variable. The dynamics between photosynthetic capacity and water use efficiency serve as critical components of plant adaptation to varying environmental conditions.
As shown in Figure 5, when LUE increases, it implies a higher efficiency in converting absorbed light energy into biomass, which can result in reduced rs, as the stomata tend to open more to facilitate carbon assimilation. This relationship between LUE and rs can consequently influence WUE, as higher LUE coupled with lower rs can improve the efficiency of water use in the ecosystem. Conversely, when LUE decreases, rs may increase, leading to reduced WUE. The interaction of these variables with the atmospheric and soil processes governs the overall performance of the ecosystem in terms of carbon and water cycles. Although atmospheric factors play a role in modulating WUE, it is the biophysical factors, particularly the interplay between LUE and rs, that predominantly determine the changes in WUE. In general, the influence of LUE and rs on WUE highlights the critical balance between photosynthetic capacity and water conservation strategies in response to fluctuating environmental conditions.
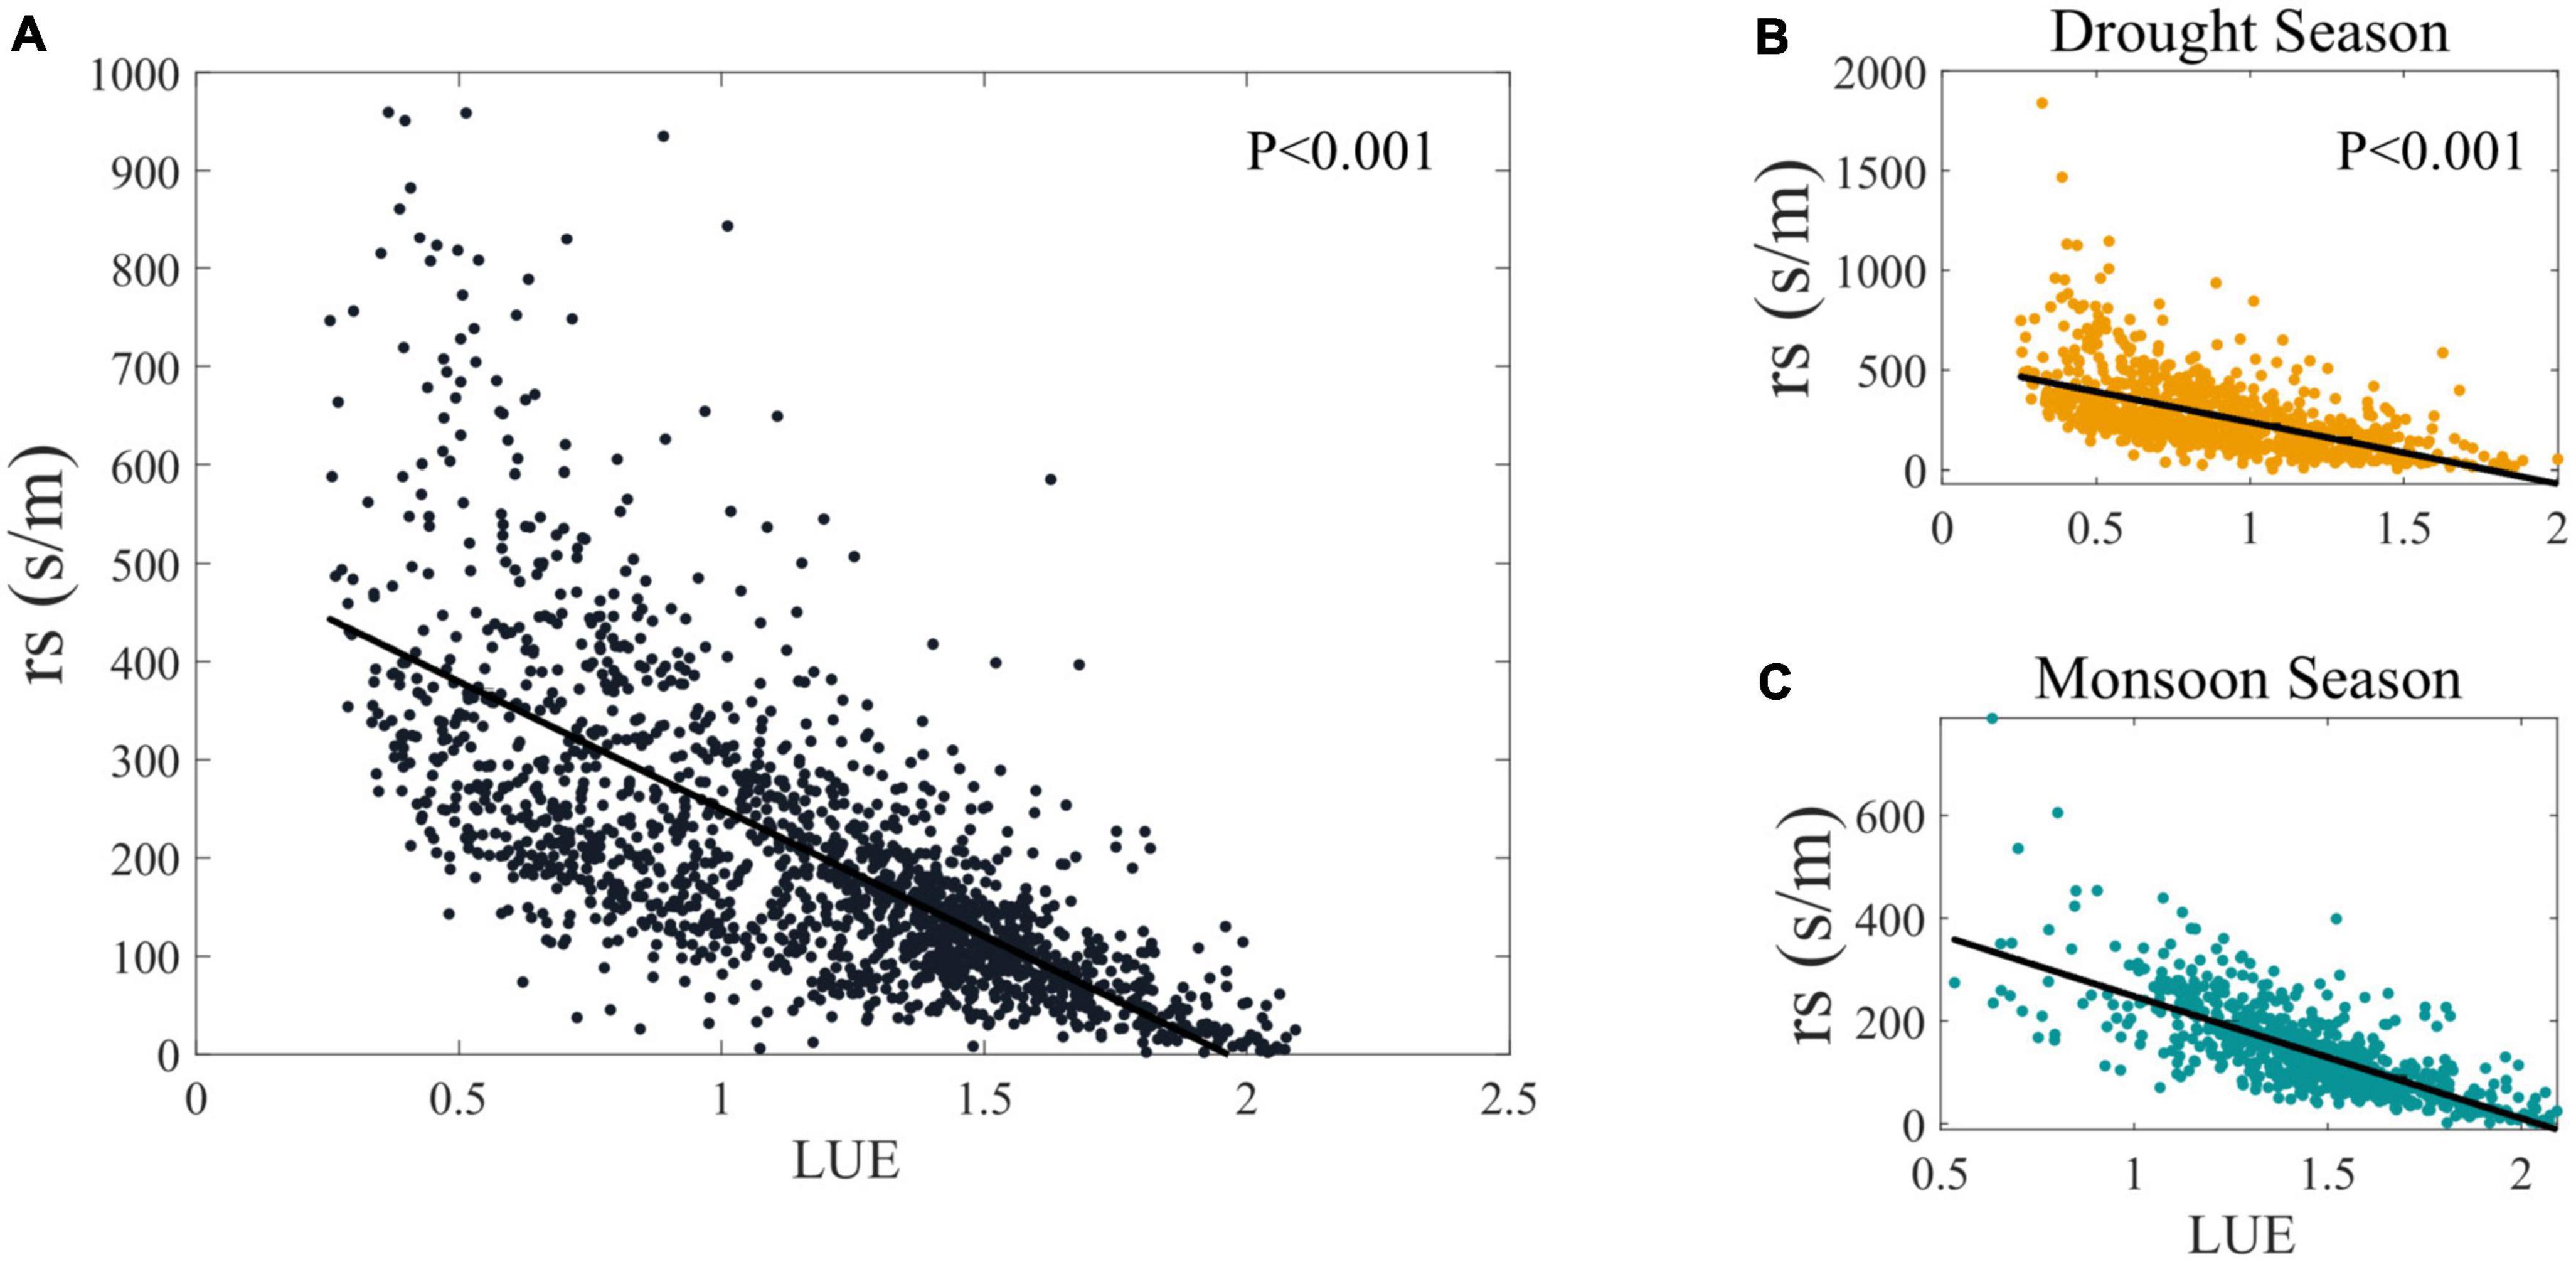
Figure 5. The Intercomparison of the rs and LUE for (A) all time; (B) drought season; (C) monsoon season.
The attribution result of biophysical factors suggests that rs plays a central role in determining changes in WUE, which are consistent with existing theory and results from previous empirical studies (Wilson and Baldocchi, 2000; Li et al., 2013). The rubber plantation has large xylem vessels to gain competitive advantages under well-watered conditions (Isarangkool Na Ayutthaya et al., 2011); thus, the rubber plantations act as water pumps, as suggested by locals (Tan et al., 2011). Moreover, the research by Clermont-Dauphin et al. (2013) found that rubber plants’ growth was limited mainly by soil waterlogging in the monsoon season. The DZ site is located at the northern edge of tropical, with annual mean precipitation of 1504.7 mm (1255.4 mm on monsoon days), which means the rubber plantation growing areas have adequate rainfall. Given the rs is a bulk parameter and no water stress occurred, which implies that under monsoon days (1) there has enough available water for evapotranspiration (including soil moisture, intercepted water on canopy surfaces, and puddles on the ground), (2) rubber plants tends to keep their stomata open and the leaf area index (LAI) is increased, or (3) a combination of both (Wang et al., 2019).
4. Conclusion
In summary, we employ an analytical attribution method, separating and quantifying the differential impacts of concurrent and interacting changes in atmospheric and biophysical factors on water use efficiency and apply it to rubber plantation sites in the northern edge of tropics. The results suggest that biophysical factors and energy balance changes are strongly coupled with atmospheric processes during the monsoon-drought season trans. The rs is the dominant driver leading to an increase in WUE during the monsoon-drought season transition. Changes in Lin and Ta effectively increase WUE but virtually counteracted by Sin contributions. It is worth noting that light use efficiency exhibits the most significant negative contribution to the water use efficiency. Nevertheless, this adverse impact is predominantly offset by the interplay between VPD and aerodynamic resistance. These two factors work in tandem to compensate for the decrease in WUE due to the reduction in light use efficiency, thereby maintaining a balance in the overall efficiency of the system. The next challenge is incorporating the observations to constrain the representation of water and energy stress on plants in models, which would further address what actors majorly regulate the bulk surface resistance response to monsoon rainfall.
Data availability statement
The data analyzed in this study is subject to the following licenses/restrictions: Access to the dataset is available upon request for researchers with a valid and reasonable research purpose. To request access to the dataset, please contact the corresponding author via email. The corresponding author will review the request, and if deemed appropriate, will provide access to the data. Requests to access these datasets should be directed to emhpeGlhbmd3dUBjYXRhcy5jbg==; d2FuZ3BlbmdAaGFpbmFudS5lZHUuY24=.
Author contributions
SG: methodology, software, and writing original draft preparation. PW: supervision, review and editing, and funding acquisition. ZW: data collection and formal analysis. WL: investigation, resources, and review and editing. ZS: writing—methodology and review and editing. LW: supervision and writing—review. MF: formal analysis and software. All authors contributed to the article and approved the submitted version.
Funding
SG and PW acknowledge financial support from Fund for Less Developed Regions of the National Natural Science Foundation of China (Grant No. 32160320) and Youth Foundation of the Natural Science Foundation of Hainan Province of China (Grant No. 421QN197); ZW acknowledge financial support from China Agriculture Research System (Grant No. CARS-33-ZP3); ZS, LW, and MF acknowledge also financial support from the Youth Foundation of the National Natural Science Foundation of China (Grant No. 42101101).
Acknowledgments
We would like to thank reviewers and the editor-in-charge for valuable time on the article. We thank ZW for his contribution to the data collection. And we are grateful to all the foundations that support us.
Conflict of interest
The authors declare that the research was conducted in the absence of any commercial or financial relationships that could be construed as a potential conflict of interest.
Publisher’s note
All claims expressed in this article are solely those of the authors and do not necessarily represent those of their affiliated organizations, or those of the publisher, the editors and the reviewers. Any product that may be evaluated in this article, or claim that may be made by its manufacturer, is not guaranteed or endorsed by the publisher.
Footnotes
References
Bachofen, C., Poyatos, R., Flo, V., Martínez-Vilalta, J., Mencuccini, M., Granda, V., et al. (2023). Stand structure of Central European forests matters more than climate for transpiration sensitivity to VPD. J. Appl. Ecol. 60, 886–897. doi: 10.1111/1365-2664.14383
Bahadur, S., Taj, S., Long, W., and Hanif, U. (2022). Pollen morphological peculiarities of selected mimosoideae taxa of Hainan Island and their taxonomic relevance. Agronomy 12:1122. doi: 10.3390/agronomy12051122
Butt, N., De Oliveira, P. A., and Costa, M. H. (2011). Evidence that deforestation affects the onset of the rainy season in Rondonia, Brazil. J. Geophys. Res. 116:D11120. doi: 10.1029/2010JD015174
Chang, Q. Q., He, H. L., Niu, Z. E., Ren, X. L., Zhang, L., Sun, W. X., et al. (2021). Spatio-temporal variation of soil moisture and its influencing factors in Chinese typical forest ecosystems. Acta Ecol. Sin. 41, 490–502. doi: 10.5846/stxb201910182191
Chen, N., Song, C., Xu, X., Wang, X., Cong, N., Jiang, P., et al. (2021). Divergent impacts of atmospheric water demand on gross primary productivity in three typical ecosystems in China. Agric. For. Meteorol. 307:108527. doi: 10.1016/j.agrformet.2021.108527
Clermont-Dauphin, C., Suvannang, N., Hammecker, C., Cheylan, V., Pongwichian, P., and Do, F. C. (2013). Unexpected absence of control of rubber tree growth by soil water shortage in dry subhumid climate. Agron. Sustain. Dev. 33, 531–538. doi: 10.1007/s13593-012-0129-2
Deng, L., Wang, K., Li, J., Zhao, G., and Shangguan, Z. (2016). Effect of soil moisture and atmospheric humidity on both plant productivity and diversity of native grasslands across the Loess Plateau, China. Ecol. Eng. 94, 525–531. doi: 10.1016/j.ecoleng.2016.06.048
Denissen, J., Teuling, A. J., Pitman, A. J., Koirala, S., Migliavacca, M., Li, W., et al. (2022). Widespread shift from ecosystem energy to water limitation with climate change. Nat. Clim. Change 12, 677–684. doi: 10.1038/s41558-022-01403-8
Dirmeyer, P. A. (2011). The terrestrial segment of soil moisture–climate coupling. Geophys. Res. Lett. 38:L16702. doi: 10.1029/2011GL048268
Eamus, D. (1991). ‘The interaction of rising CO2 and temperatures with water use efficiency’. Plant Cell Environ. 14, 843–852. doi: 10.1111/j.1365-3040.1991.tb01447.x
Friedlingstein, P., Cox, P., Betts, R., Bopp, L., von Bloh, W., Brovkin, V., et al. (2006). Climate–carbon cycle feedback analysis: results from the C4MIP model intercomparison. J. Clim. 19, 3337–3353. doi: 10.1175/JCLI3800.1
Gatti, L. V., Gloor, M., Miller, J. B., Doughty, C. E., Malhi, Y., Domingues, L. G., et al. (2014). Drought sensitivity of Amazonian carbon balance revealed by atmospheric measurements. Nature 506, 76–80. doi: 10.1038/nature12957
Gentine, P., Massmann, A., Lintner, B. R., Hamed Alemohammad, S., Fu, R., Green, J. K., et al. (2019). Land–atmosphere interactions in the tropics–a review. Hydrol. Earth Syst. Sci. 23, 4171–4197. doi: 10.5194/hess-23-4171-2019
Gerken, T., Ruddell, B. L., Fuentes, J. D., Araújo, A., Brunsell, N. A., Maia, J., et al. (2018). Investigating the mechanisms responsible for the lack of surface energy balance closure in a central Amazonian tropical rainforest. Agric. For. Meteorol. 255, 92–103. doi: 10.1016/j.agrformet.2017.03.023
Giambelluca, T. W., Mudd, R. G., Liu, W., Ziegler, A. D., Kobayashi, N., Kumagai, T. O., et al. (2016). Evapotranspiration of rubber (Hevea brasiliensis) cultivated at two plantation sites in Southeast Asia. Water Resour. Res. 52, 660–679. doi: 10.1002/2015WR017755
Green, J. K., Seneviratne, S. I., Berg, A. M., Findell, K. L., Hagemann, S., Lawrence, D. M., et al. (2019). Large influence of soil moisture on long-term terrestrial carbon uptake. Nature 565, 476–479. doi: 10.1038/s41586-018-0848-x
Guardiola-Claramonte, M., Troch, P. A., Ziegler, A. D., Giambelluca, T. W., Durcik, M., Vogler, J. B., et al. (2010). Hydrologic effects of the expansion of rubber (Hevea brasiliensis) in a tropical catchment. Ecohydrology 3, 306–314. doi: 10.1002/eco.110
Isarangkool Na Ayutthaya, S., Do, F. C., Pannangpetch, K., Junjittakarn, J., Maeght, J. L., Rocheteau, A., et al. (2011). Water loss regulation in mature Hevea brasiliensis: Effects of intermittent drought in the rainy season and hydraulic regulation. Tree Physiol. 31, 751–762. doi: 10.1093/treephys/tpr058
Lansu, E. M., van Heerwaarden, C. C., Stegehuis, A. I., and Teuling, A. J. (2020). Atmospheric aridity and apparent soil moisture drought in European forest during heat waves. Geophys. Res. Lett. 47:e2020GL087091. doi: 10.1029/2020GL087091
Lavergne, A., Graven, H., De Kauwe, M. G., Keenan, T. F., Medlyn, B. E., and Prentice, I. C. (2019). Observed and modelled historical trends in the water-use efficiency of plants and ecosystems. Glob. Change Biol. 25, 2242–2257. doi: 10.1111/gcb.14634
Li, S., Kang, S., Zhang, L., Li, F., Du, T., Tong, L., et al. (2013). Greater effect of canopy conductance in regulating the energy partition above the maize field in arid northwest China. Hydrol. Proc. 27, 3452–3460. doi: 10.1002/hyp.9413
Liao, W., Rigden, A. J., and Li, D. (2018). Attribution of local temperature response to deforestation. J. Geophys. Res. 123, 1572–1587. doi: 10.1029/2018JG004401
Liebmann, B., Camargo, S. J., Seth, A., Marengo, J. A., Carvalho, L. M., Allured, D., et al. (2007). Onset and end of the rainy season in South America in observations and the ECHAM 4.5 atmospheric general circulation model. J. Clim. 20, 2037–2050. doi: 10.1175/JCLI4122.1
Liu, Y., Parolari, A. J., Kumar, M., Huang, C. W., Katul, G. G., and Porporato, A. (2017). Increasing atmospheric humidity and CO2 concentration alleviate forest mortality risk. Proc. Natl. Acad. Sci. U.S.A. 114, 9918–9923. doi: 10.1073/pnas.1704811114
Lu, H., Lu, F. P., Xu, X. L., and Chen, Q. (2014). “The control technique of rubber borers by pheromone traps in Hainan,” in Advanced materials research, Vol. 962, (Bäch: Trans Tech Publications Ltd), 699–702. doi: 10.4028/www.scientific.net/AMR.962-965.699
Mallick, K., Trebs, I., Boegh, E., Giustarini, L., Schlerf, M., Drewry, D. T., et al. (2016). Canopy-scale biophysical controls of transpiration and evaporation in the Amazon Basin. Hydrol. Earth Syst. Sci. 20, 4237–4264. doi: 10.5194/hess-20-4237-2016
Mitchard, E. T. (2018). The tropical forest carbon cycle and climate change. Nature 559, 527–534. doi: 10.1038/s41586-018-0300-2
Monteith, J. L. (1965). “The state and movement of water in living organisms,” in Proceedings of the 19th symposia of the society for experimental biology, (London: Cambridge University Press), 205–234.
Morison, J. I. L. (1985). Sensitivity of stomata and water use efficiency to high CO2. Plant Cell Environ 8, 467–474. doi: 10.1111/j.1365-3040.1985.tb01682.x
Nakicenovic, N., and Swart, R. (2000). Emissions scenarios-special report of the intergovernmental panel on climate change. England: N.p. Web.
Niu, Z., He, H., Zhu, G., Ren, X., Zhang, L., Zhang, K., et al. (2019). An increasing trend in the ratio of transpiration to total terrestrial evapotranspiration in China from 1982 to 2015 caused by greening and warming. Agric. For. Meteorol. 279:107701. doi: 10.1016/j.agrformet.2019.107701
Novick, K. A., Ficklin, D. L., Stoy, P. C., Williams, C. A., Bohrer, G., Oishi, A. C., et al. (2016). The increasing importance of atmospheric demand for ecosystem water and carbon fluxes. Nat. Clim. Change 6, 1023–1027. doi: 10.1038/nclimate3114
Pierret, A., Maeght, J. L., Clément, C., Montoroi, J. P., Hartmann, C., and Gonkhamdee, S. (2016). Understanding deep roots and their functions in ecosystems: An advocacy for more unconventional research. Ann. Bot. 118, 621–635. doi: 10.1093/aob/mcw130
Restaino, C. M., Peterson, D. L., and Littell, J. (2016). Increased water deficit decreases Douglas fir growth throughout western US forests. Proc. Natl. Acad. Sci. U.S.A. 113, 9557–9562. doi: 10.1073/pnas.1602384113
Ruairuen, W., Fochesatto, G. J., Kasemsap, P., and Chayawat, C. (2021). Energy fluxes and evapotranspiration in a rubber agroecosystem of the Southern Thailand. Walailak J. Sci. Technol. 18, 6541–6549. doi: 10.48048/wjst.2021.6541
Sopharat, J., Gay, F., Thaler, P., Sdoodee, S., Isarangkool Na Ayutthaya, S., Tanavud, C., et al. (2015). A simple framework to analyze water constraints on seasonal transpiration in rubber tree (Hevea brasiliensis) plantations. Front. Plant Sci. 5:753. doi: 10.3389/fpls.2014.00753
Stern, R. D., and Coe, R. (1982). The use of rainfall models in agricultural planning. Agric. Meteorol. 26, 35–50. doi: 10.1016/0002-1571(82)90056-5
Sulman, B. N., Roman, D. T., Yi, K., Wang, L., Phillips, R. P., and Novick, K. A. (2016). High atmospheric demand for water can limit forest carbon uptake and transpiration as severely as dry soil. Geophys. Res. Lett. 43, 9686–9695. doi: 10.1002/2016GL069416
Tagesson, T., Schurgers, G., Horion, S., Ciais, P., Tian, F., Brandt, M., et al. (2020). Recent divergence in the contributions of tropical and boreal forests to the terrestrial carbon sink. Nat. Ecol. Evol. 4, 202–209. doi: 10.1038/s41559-019-1090-0
Tan, Z. H., Zhang, Y. P., Song, Q. H., Liu, W. J., Deng, X. B., Tang, J. W., et al. (2011). Rubber plantations act as water pumps in tropical China. Geophys. Res. Lett. 38:L24406. doi: 10.1029/2011GL050006
Thom, A. S. (1972). Momentum, mass and heat exchange of vegetation. Q. J. R. Meteorol. Soc. 98, 124–134. doi: 10.1002/qj.49709841510
Titlyanov, E. A., Titlyanova, T. V., Scriptsova, A. V., Ren, Y., Li, X., and Huang, H. (2019). Interannual and seasonal changes in the benthic algae flora of coral reef in Xiaodong Hai (Hainan Island, China). J. Mar. Sci. Eng. 7:243. doi: 10.3390/jmse7080243
Uuh-Sonda, J. M., Figueroa-Espinoza, B., Gutiérrez-Jurado, H. A., and Méndez-Barroso, L. A. (2022). Ecosystem productivity and evapotranspiration dynamics of a seasonally dry tropical forest of the Yucatan Peninsula. J. Geophys. Res. 127:e2019JG005629. doi: 10.1029/2019JG005629
Wang, P., Li, D., Liao, W., Rigden, A., and Wang, W. (2019). Contrasting evaporative responses of ecosystems to heatwaves traced to the opposing roles of vapor pressure deficit and surface resistance. Water Resour. Res. 55, 4550–4563. doi: 10.1029/2019WR024771
Wilson, K. B., and Baldocchi, D. D. (2000). Seasonal and interannual variability of energy fluxes over a broadleaved temperate deciduous forest in North America. Agric. For. Meteorol. 100, 1–18. doi: 10.1016/S0168-1923(99)00088-X
Keywords: water use efficiency, rubber plantation ecosystem, surface resistance, monsoon season, gross primary productivity
Citation: Guo S, Wu Z, Liu W, Sun Z, Wu L, Fang M and Wang P (2023) Attribution analysis of water use efficiency in tropical rubber plantations during drought-monsoon season transition. Front. For. Glob. Change 6:1208595. doi: 10.3389/ffgc.2023.1208595
Received: 19 April 2023; Accepted: 12 June 2023;
Published: 28 June 2023.
Edited by:
Xiaowei Guo, Chinese Academy of Sciences (CAS), ChinaReviewed by:
Enliang Guo, Inner Mongolia Normal University, ChinaHanchen Zhang, Ningxia University, China
Copyright © 2023 Guo, Wu, Liu, Sun, Wu, Fang and Wang. This is an open-access article distributed under the terms of the Creative Commons Attribution License (CC BY). The use, distribution or reproduction in other forums is permitted, provided the original author(s) and the copyright owner(s) are credited and that the original publication in this journal is cited, in accordance with accepted academic practice. No use, distribution or reproduction is permitted which does not comply with these terms.
*Correspondence: Peng Wang, d2FuZ3BlbmdAaGFpbmFudS5lZHUuY24=