Abstract
Introduction:
The stability of forest productivity is an important management goal in order to sustain ecosystem services for an expanding human population and in the face of global climate change. Evidence from theoretical, observational, and experimental studies has demonstrated that higher biodiversity promotes stability of forest productivity. However, the majority of these studies have focused solely on tree diversity and have neglected the potentially important role of understory plant and soil biodiversity.
Methods:
In this study, we explain the effect of tree, understory woody and herbaceous plant, and soil biota (fauna, fungi, and bacteria) species diversity on forest productivity and its stability over time (2000–2020) across an area of Northeast China covering 145 million hectares. We explore the eight stand structure variables for stability of forest productivity and the relationship between productivity stability and tree, understory plant, and soil biota species diversity.
Results:
Our results show no significant, direct impact of understory plant, soil fungi, and bacteria species diversity on the stability of the forest ecosystem. Tree species diversity indirectly affects productivity stability by directly influencing stand structure, whereas soil fauna species diversity indirectly influences stability through its relationship with tree species diversity. Stand structure is more important than tree and soil fauna species diversity for forest productivity stability. Specifically, increasing crown height (CH) from its minimum to maximum value leads to a substantial gain of 20.394 in forest productivity stability. In contrast, raising tree species diversity (α-Tree) and soil fauna species diversity (α-Fauna) from their minimum to maximum values results in a modest reduction of only 0.399 and 0.231 in forest productivity stability, respectively.
Discussion:
To increase the stability of forest productivity in response to climate change, we should adjust the stand structure more in the process of management rather than just considering biodiversity. Overall, this study highlights the ecological risks associated with large-scale biotic homogenization under future climate change and management practices.
1 Introduction
In the face of global climate change and an expanding human population, maintaining preserving forest productivity stability is an important management goal for sustaining ecosystem services. Temporal stability, or a forest’s capacity to sustain ecosystem functionality over time, has gradually become a major focus of theoretical and empirical research within forest ecology and management (Jucker et al., 2014; Morin et al., 2014; Liang et al., 2016; Schnabel et al., 2021; Qiao et al., 2022, 2023). However, the specific contributions of abiotic and biotic factors to large-scale productivity stability remain subjects of extensive debate. There is mounting evidence of the role of biodiversity in bolstering productivity stability and enhancing ecosystem functioning and services (Hautier et al., 2014; Isbell et al., 2015; Yuan et al., 2021). However, the majority of these studies have focused solely on tree species diversity, overlooking the potentially pivotal role of understory plant species diversity and encompassing both woody and herbaceous plants, which represent a significant portion of plant species diversity in temperate and northern conifer forests (Halpern and Spies, 1995; Echiverri and Macdonald, 2019). Furthermore, soil biodiversity, including soil biota such as soil fauna, fungi, and bacteria, serves as a vital reservoir of biodiversity in terrestrial ecosystems (Decaens, 2010; Orgiazzi et al., 2016; Yang et al., 2018; Liu et al., 2020; Chen et al., 2021; Wu et al., 2023). These organisms provide crucial ecological services such as decomposition, nutrient cycling, and plant nutrient acquisition, which ultimately affect plant performance and terrestrial ecosystem functioning more broadly (Bardgett and van der Putten, 2014; Wagg et al., 2014, 2019; Jing et al., 2015; Delgado-Baquerizo et al., 2020). Although some of these mechanisms have been examined in small-scale experiments or grass ecosystems (Yang et al., 2014, 2016; Pellkofer et al., 2016), there is limited research that explores their role in forest ecosystems across large scales.
The effects of species diversity on productivity stability have been reported extensively, but structural diversity has received less investigation (Ouyang et al., 2021). Stand structure is a direct object for management, link management, and function. During the forest management process, various functions of the forest can be changed by adjusting the structure of the forest stand through cutting and replanting (Larson and Churchill, 2012). Stand structure—encompassing factors such as size, number, composition, and heterogeneity—is a critical component of ecosystem resilience and functionality (Churchill et al., 2013) and represents an important component of habitat complexity (Penone et al., 2019; Loke and Chisholm, 2022). As such, changes in stand structure strongly influence understory plant species diversity (Yu and Sun, 2013; Su et al., 2021) and belowground soil microbial communities (Turner and Franz, 1985). Variations in understory vegetation and soil biota development can arise due to differences in stand structure, even under similar climates and site conditions (Su et al., 2021), resulting in an array of diversity–stability mechanisms. Therefore, it is crucial to understand the complex interplay between stand structure and diversity in order to anticipate and manage the effects of climate change on forest ecosystems.
In this study, we assess how different subsets of species diversity contribute to productivity stability in temperate forests across China. Our hypotheses are as follows: (i) diversity—measured in terms of tree species, understory plant, belowground soil biota, and stand structure diversity—has a direct impact on forest productivity stability and varies across taxonomic groups; randomness also plays a significant role, (ii) tree species diversity has the strongest influence on forest productivity stability (Figure 1); and (iii) tree species diversity indirectly affects the productivity stability of the forest ecosystem through its impact on stand structure. We tested these hypotheses using a unique dataset of forest communities in the temperate region of China. Our methods were as follows: First, we investigated the patterns of species diversity in multiple taxa. Second, we evaluated the direct and indirect effects of climate, soil properties, species diversity, and stand structure on forest productivity stability. Specifically, we analyzed variable importance to explore which variables affect forest productivity stability most strongly and assessed whether the observed patterns differed from what would be expected by chance. Finally, to provide guidance for effective forest management, we calculated the net gain or loss of forest productivity stability by changing diversity or stand structure values.
Figure 1

Illustration of forest ecosystem, sampling of understory plant and belowground soil biota, and conceptual model of research hypothesis; (A) forest ecosystem, including tree, understory woody and herbaceous plant, soil fauna, fungi and bacteria, stand structure mean tree size, number, and composition; (B) sampling for understory plant and soil biota diversity; (C) conceptual model of climate, soil, and tree species diversity and stand structure effect in understory plant and soil biota species diversity; arrow width is proportional to the strength of the relationship; (D) conceptual model of climate, soil property, species diversity, and stand structure effect on productivity stability.
2 Materials and methods
2.1 Study area and field data collection
The study area encompasses the entirety of Northeastern China (Figure 2A) located between 40–53°N latitude and 120–135°E longitude. It includes the Heilongjiang, Jilin, and Liaoning provinces, as well as the eastern part of the Inner Mongolia Autonomous Region (Zhang and Liang, 2014). The forests in this area are predominantly found in three regions: Changbai Mountain (CB), Xiao Hingan Ling (XH), and Da Hingan Ling (DH) (Zhang and Liang, 2014) (Figure 2B). The Northeastern region of China (NE China) encompasses a forest area of more than 82.42 million ha2 (Figure 2B). It encompasses a range of forest types, from temperate forests in the south to boreal forests in the far north, representing all of the major forest types in temperate East Asia (Zhang and Liang, 2014). We obtained 1 km-resolution spatial data of the area representing mean annual temperature (MAT), mean annual precipitation (MAP), and mean annual potential evapotranspiration (PET) for the period of 2000–2020 from the National Earth System Science Data Center, National Science & Technology Infrastructure of China dataset.1 Data of soil physicochemical properties including pH value (pH), soil organic carbon (Soc), total nitrogen (Tn), total phosphorus (Tp), total potassium (Tk), bulk density (Bd), and coarse fragments (Cf) at various depths (0–5, 5–15, 15–30, 30–60, 60–100, and 100–200 cm) were obtained from the study by Liu et al. (2021) (90 m spatial resolution; available at National Earth System Science Data Center, http://www.geodata.cn/). We applied weightage to synthesize the soil data from each layer (0–5, 5–15, 15–30, 30–60, 60–100, 100–200 cm), considering that layer weight is equal to layer depth/200 cm. Finally, we summed the weighted values of each layer to generate the soil physicochemical property values of the sample plot.
Figure 2
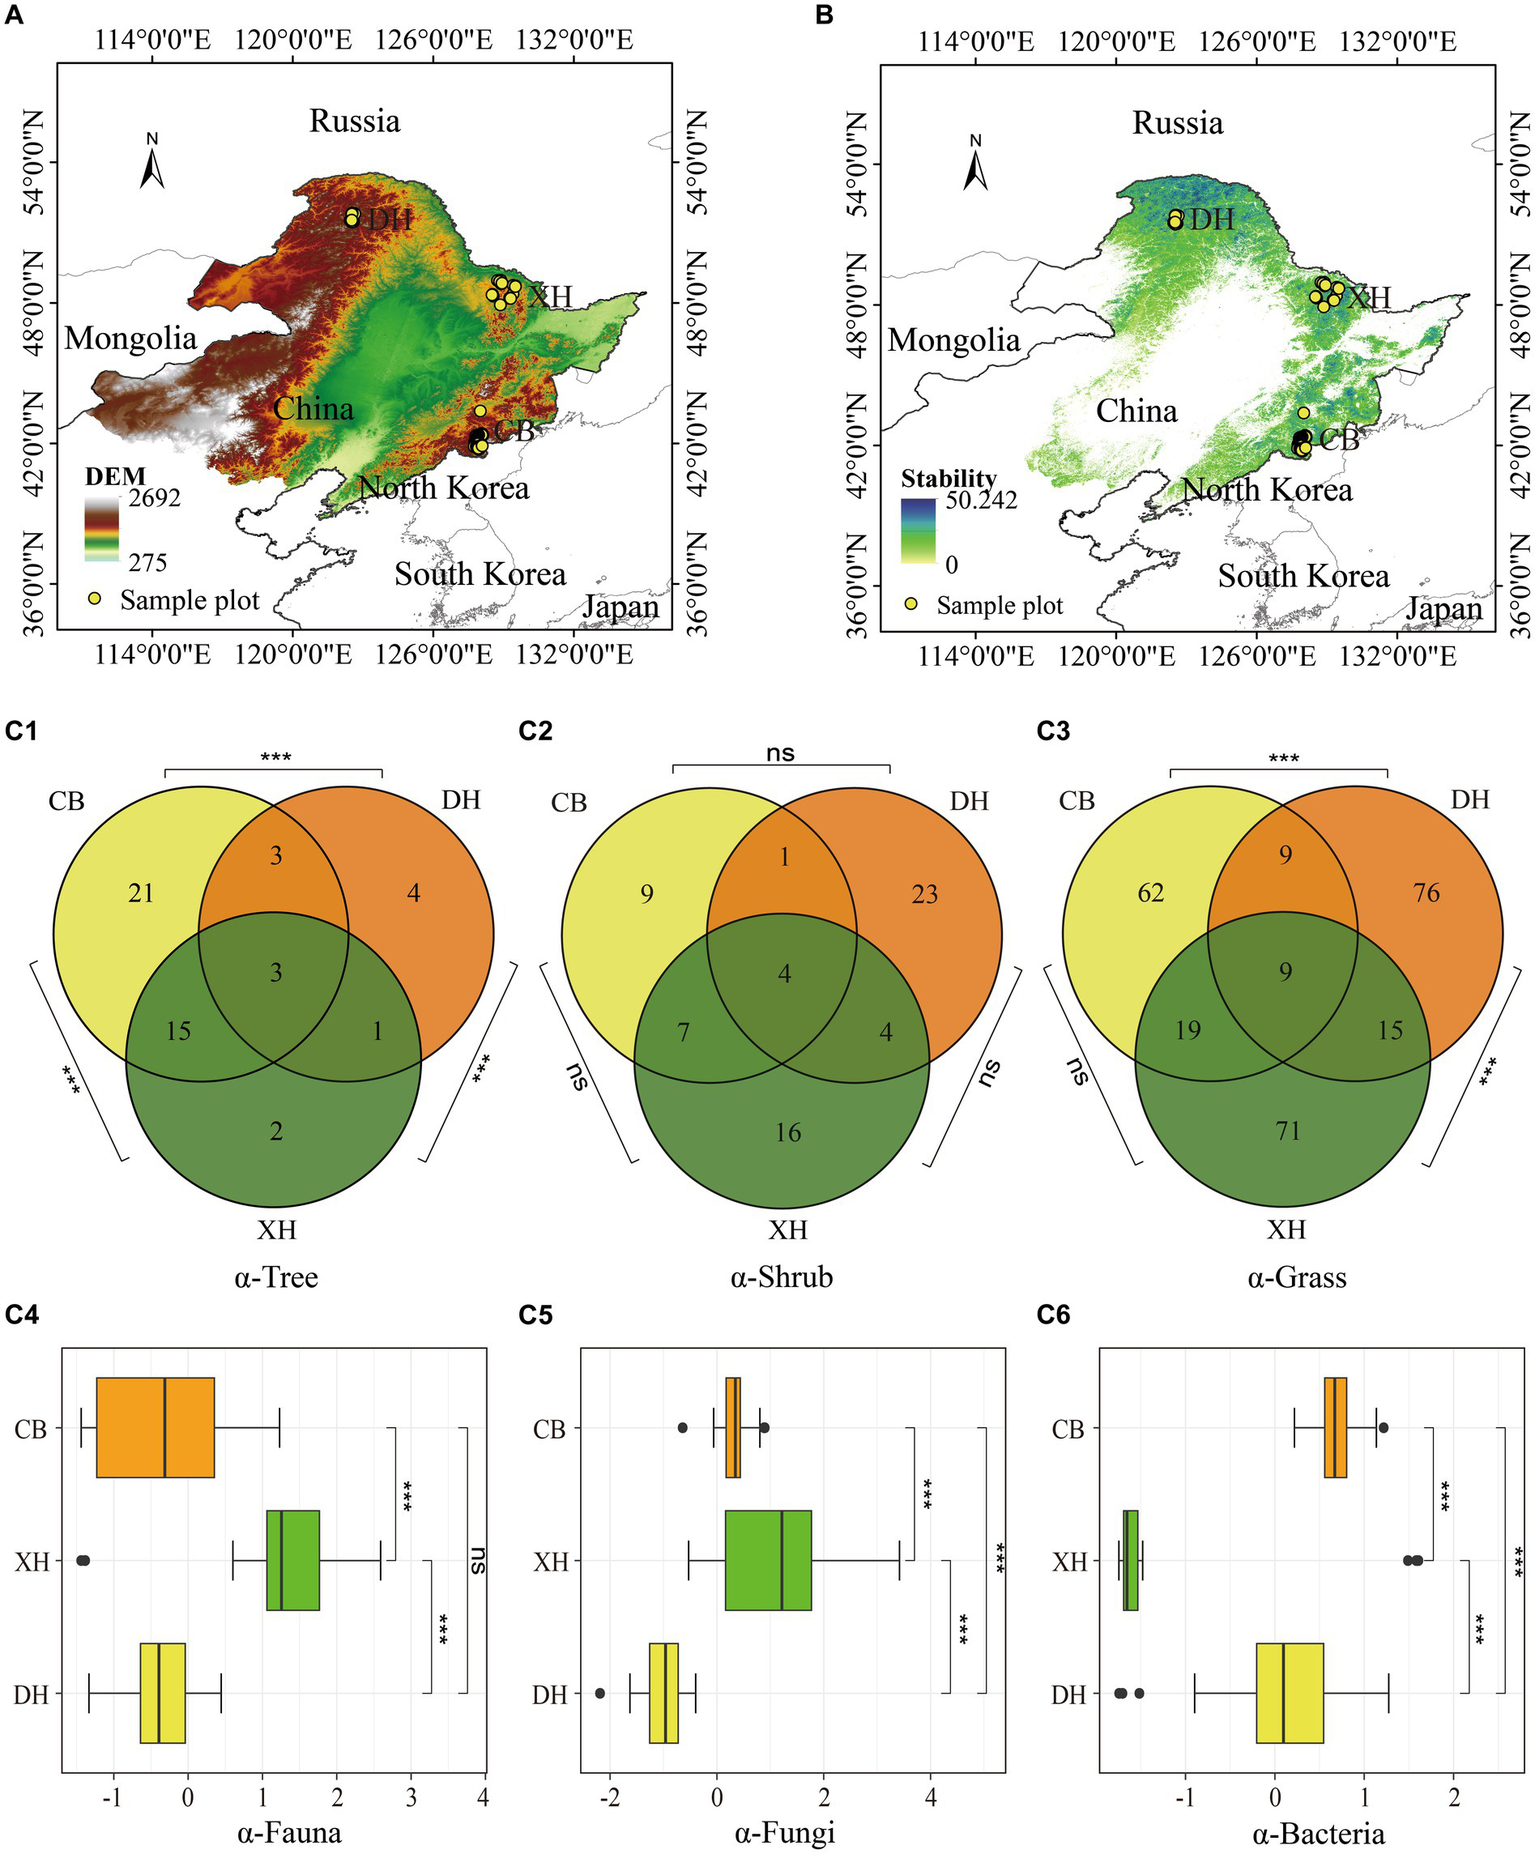
Sample plot (A), productivity stability (B), and patterns of species diversity across the study area (C). (A) Study area and sample plot: observation sites (marked with yellow dots) distributed across Northeast China were monitored from 2015 to 2018. The background color represents the Digital Elevation Model (DEM) of the area, with a resolution of 30 m. CB denotes the Changbai Mountain region, XH represents the Xiao Hingan Ling region, and DH signifies the Da Hingan Ling region; the coordinate system is WGS84. (B) Forest productivity stability across the study area. (C) Patterns of species diversity; the specific diversity aspects assessed are as follows: (C1) tree species diversity; (C2) understory woody plant species diversity; (C3) understory herbaceous species diversity; (C4) soil fauna species diversity; (C5) soil fungi species diversity; and (C6) soil bacteria species diversity. Statistical analysis was performed using a t-test, with significance levels indicated as follows: p < 0.001 (***), p < 0.01 (**), p < 0.05 (*), and p > 0.05 (ns).
2.2 Sampling of tree and understory plant species diversity
This study utilized publicly available data from the National Ecology Science Data Center, National Science & Technology Infrastructure of China (NESDC, http://www.geodata.cn). This database comprises 122 sample plots of different forest types and disturbance classes that were established in Northeast China between 2015 and 2018 (Figure 2A). The forest layer with height (H) ≥ 1.3 m is designated as the tree layer, within which the species, status, diameter at breast height (DBH), and height of each tree are recorded in 36 quadrats of 5 × 5 m each. Ten quadrats were selected as survey plots to investigate understory wood plant diversity. The species, DBH, and height of each plant in the understory wood plant layer are investigated and recorded. We randomly set a 1 × 1 m understory herbaceous vegetation survey plot within the understory wood plant survey plot. The types, average height, coverage, and other relevant details of the understory herbaceous vegetation were recorded following the guidelines outlined in LY/T 3128–2019 (“The Regulations for Classification, Survey, and Mapping of Forest Vegetation, Forestry Industry Standard of the People’s Republic of China”).
2.3 Sampling of soil fauna, fungi, and bacteria species diversity
Soil fauna were identified from three sieved soil core samples of 5 cm diameter each. Soil cores were taken from the upper 15 cm of soil in each plot, and the three cores were pooled as a composite sample for the plot (NESDC, http://www.geodata.cn). The samples collected in the field were placed on a sieve equipped with a funnel. The lower part of the funnel was connected to a device containing 75% alcohol by mass to collect and preserve the separated soil fauna. The separation time was 7 to 12 days. The device containing the soil sample was then poured into another glass bottle and heated in a water bath (Wu et al., 2021). After boiling the alcohol in the bottle, the suspended springtail sample sank and was removed for soil fauna sorting. Soil fauna were sorted by morphology, and the number of individuals was recorded before storing in centrifuge tubes containing 75% alcohol (Chen, 1983). The separated soil fauna were made into slide specimens and identified following slide specimen preparation processes such as fading, washing, and making (Xu et al., 2017). Species morphological characteristics were documented with photographs that were captured using a field microscope with high depth. Finally, two types and four trophic levels of soil fauna were collected from the soil under different forest types. The two types included large soil fauna and small and medium-sized soil fauna (such as Nematodes, Oribatida, and Collembola).
Soil fungi and bacteria were identified from sieved and freeze-dried soil core samples. Ten cores of 3 cm diameter each were taken from the upper 10 cm of soil per plot and pooled as the composite sample of the plot. The samples were then passed through a 2-mm soil sieve, placed into a ziplock bag, and cooled in a − 20°C refrigerator (NESDC, http://www.geodata.cn, Li P. et al., 2019). The PowerSoil DNA Isolation Kit (MoBio, United States) was used to extract total soil fungi DNA. The primers ITSF1-GCATCGATGAAGAACGCAG and ITSR1-TCCTCCGCTTATTGATATGC were employed to amplify the hypervariable region of fungal ITS2. The sequencing of paired-end 250 bp was conducted using the Illumina HiSeq platform (Li et al., 2020). The barcoded Illumina paired-end sequencing (BIPES) process was then employed for initial data processing to reverse the complementary assembly of the ITS2 sequence. The sequence was split into corresponding samples based on barcodes, and low-quality data such as primer mismatch, N-containing sequences, and excessively short sequences were eliminated. The UCHIME program was employed to screen out chimera sequences, and diversity analyses, such as clustering, were performed using the QIIME process. Operational taxonomic unit (OTU) clustering was conducted using the UCLUST method with a sequence similarity threshold of 97% (Li P. et al., 2019). The representative sequence for each OTU was selected using the highest frequency, and systematic classification was performed using the Amazon Relational Database Service (RDP) and UNITE databases.
The primers 515F/806R were similarly used to amplify the V4 hypervariable region of the bacterial 16S rRNA gene (Tamaki et al., 2011), and the above steps were repeated, except the SILVA database which was used to perform the systematic classification (Li et al., 2020). All measurements for trees, understory vegetation, and soil biodiversity reported in this study were taken from the same sample plot.
2.4 Quantization of stand structure and forest productivity stability
Tree and understory plant species diversity for each plot was determined by counting the unique species present in the tree and understory wood and herbaceous layers within each sample plot. Varieties within each species were aggregated (Zhou et al., 2017). In this study, we defined eight stand structure features, including β diversity of trees (β-Tree), stem abundance (SA), mean DBH (m-DBH), tree size variation (CV DBH), variation of height on crown base (CV HCB), height of crown (CH), stand basal area (SBA), basal area of deadwood (BAD), and the stand structural complexity index (SSCI). β-Tree measures the variation in species composition among sites, reflecting species turnover and nestedness (Baselga and Orme, 2012) and is calculated using the Jaccard dissimilarity index following the method stated by Zhang et al. (2022); SA represents stand density and is measured in individuals ha−1; m-DBH is a proxy for stand age (Penone et al., 2019); CV DBH is calculated as the coefficient of variation for tree DBH within a given sample plot (Chu et al., 2019); CV HCB is used to assess the physical space under the tree canopy; CH is measured using the method stated by Liu X. Q. et al., 2022; SBA is calculated as the sum of individual stem basal area (Dolezal et al., 2020); BAD is the sum of deadwood basal area; and the aim of the SSCI to quantify the distribution of trees and their canopies in three-dimensional space as a function of leaf area and heterogeneity of biomass distribution (Ehbrecht et al., 2021). Each feature was calculated as the mean or sum of all individuals in the sample plot (Table 1) (Krebs et al., 2019).
Table 1
| Variable group | Name | Unit | Min | Max | Mean or interval | Scaling method |
|---|---|---|---|---|---|---|
| Climate | MAT | °C | −54.00 | 39.00 | −5.02 ± 31.32 | Plot |
| MAP | mm | 413.00 | 730.00 | 529.67 ± 97.09 | Plot | |
| PET | μmol/m2*s | 543.00 | 712.00 | 628.29 ± 48.38 | Plot | |
| Soil | Thickness | cm | 81.00 | 45.00 | 60.57 ± 7.01 | Plot |
| pH | - | 592.10 | 637.50 | 610.61 ± 10.09 | Plot | |
| Soc | g/kg−1 | 862.30 | 1809.03 | 1162.23 ± 222.31 | Plot | |
| Tn | g/kg−1 | 81.63 | 225.83 | 104.97 ± 24.67 | Plot | |
| Tp | g/kg−1 | 29.33 | 64.35 | 44.77 ± 6.30 | Plot | |
| Tk | g/kg−1 | 1698.63 | 2780.62 | 2136.39 ± 279.42 | Plot | |
| Bd | g/kg−1 | 1198.18 | 1352.27 | 1283.64 ± 37.67 | Plot | |
| Cf | g/kg−1 | 21.67 | 46.68 | 36.42 ± 6.19 | Plot | |
| Stand structure | β-Tree | – | 0 | 0.98 | 0.84 ± 0.27 | Plot |
| SA | n/ha−2 | 1.00 | 256.00 | 90.16 ± 49.34 | Plot sum | |
| m-DBH | cm | 3.33 | 30.10 | 15.31 ± 5.28 | Plot mean | |
| CV DBH | – | 0 | 1.27 | 0.66 ± 0.27 | Plot | |
| CV HCB | – | 0 | 1.59 | 0.65 ± 0.25 | Plot | |
| CH | m | 0 | 29.60 | 16.95 ± 8.24 | Plot mean | |
| SBA | m2 | 0.02 | 23.01 | 9.82 ± 5.54 | Plot sum | |
| BAD | m2 | 0 | 9.01 | 0.79 ± 1.54 | Plot sum | |
| SSCI | – | 3.06 | 3.89 | 3.43 ± 0.28 | Plot | |
| Productivity Stability | m-NDVI | – | 91.00 | 229.00 | 212.29 ± 17.03 | Plot |
| SD-NDVI | – | 11.00 | 47.00 | 20.75 ± 5.32 | Plot | |
| Stability | – | 2.00 | 21.00 | 10.93 ± 2.87 | Plot |
List of variables and their scaling method.
MAT: mean annual temperature; MAP: mean annual precipitation; PET: mean annual potential evapotranspiration; Soc: soil organic carbon; Tn: total nitrogen; Tp: total phosphorus; Tk: total potassium; Bd: bulk density; Cf: coarse fragments; β-Tree: variation in species composition among tree sites; SA: stem abundance or stem density; m-DBH: mean diameter at breast height; CV DBH: coefficient of variation in tree size within sample plot; CV HCB: coefficient of variation in height of crown base within sample plot; CH: crown height; SBA: stand basal area, the total basal area of individual stems; BAD: basal area of deadwood; SSCI: stand structural complexity index; m-NDVI: mean peak NDVI during 2000–2020; SD-NDVI: standard deviation of peak NDVI during 2000–2020; Stability: the ratio of the mean NDVI from 2000 to 2020 to the SD of NDVI.
Temporal stability of forest productivity is generally quantified as the ratio of the temporal mean of productivity to its standard deviation (SD; Tilman et al., 2006; Hautier et al., 2015; Craven et al., 2018; Liu S. et al., 2022). In our study, we used the peak Normalized Difference Vegetation Index (NDVI) from the period 2000–2020 as a proxy for aboveground plant biomass (following Yang et al. (2019) at the National Ecology Science Data Center of China2). The NDVI data had a spatial resolution of 30 × 30 m, which aligned with the area of our field survey sites. We calculated ecosystem temporal stability as the ratio of the mean NDVI from 2000–2020 to the SD of NDVI (Wu et al., 2023) (Figure 2B). The NDVI time scale is consistent with the climate data time scale.
2.5 Statistical analysis
We employed a piecewise structural equation model (SEM) as a linear mixed-effects model (Li Z. L. et al., 2019; Jin et al., 2022) to evaluate the direct and indirect effects of environmental factors and stand structure features on forest productivity stability, considering the effects of climate gradients as random. Response variables were summarized to the plot level for analysis. We then considered various alternative reduced models that shared the same causal structure as the initial model and were constructed by eliminating non-significant variables one at a time. The decision to remove a path was based on the performance of the overall model fit and the p-value for the path (p > 0.05) (Wang et al., 2023). The models were evaluated according to the following two criteria: (1) pathway significance (p < 0.05) and satisfactory fit (p > 0.05) and (2) the goodness of fit of the model (chi-square test (χ2) (p > 0.05) and 0 ≤ Fisher’s C/df ≤ 2). Finally, we removed non-significant paths with p > 0.05 in SEMs with satisfactory model fit and then reassessed the model fit (Chu et al., 2019).
Due to the high correlations between climate variables (MAT, MAP, and PET) (r = 0.782–0.945) and soil physicochemical properties (Soc, Tn, and Tk) (r = 0.689–0.856), we conducted principal component analyses (PCA) (Chu et al., 2019; Chen et al., 2021) and used the score of the first axis to represent climate (explaining 90.0% of the variation) and the scores of the first three axes to represent soil factors in each plot (explaining 77.4% of the variation) (Supplementary Figures S1, S2). We used separate analyses to account for collinearity among environmental variables and stand structure factors (Supplementary Figures S3–S6). We removed highly correlated variables (Pearson r > 0.60) and then performed principal component analysis (PCA) (Chu et al., 2019). To make model coefficients comparable in multi-predictor regressions, we normalized the response variables and all the predictors using the z-score (overall mean of 0 and SD of 1) before analyses (Penone et al., 2019; Chen et al., 2021; Zhang et al., 2022). To account for diversity–stability variation with multiple-taxon of relative importance, we calculated the proportions of variance components in a mixed-effects model as follows: lme (Stability – Climate_PCA1 + Soil_PCA1 + Soil_PCA2 + Soil_PCA3 + α-Tree + α-Shrub + α-Herbs + α-Fauna + α-Fungi + α-Bacteria + Stand structure, random = ~ 1|site regions (see Part 2.1)). Using R package glmm.hp (Lai et al., 2022), we calculated the contributions of these predictors (Liu C. et al., 2023), and the relative importance of the predictors was grouped into four identifiable variance fractions: climatic, soil, biodiversity, and stand structure (Table 1). Following the approach in a previous study (Carol Adair et al., 2018), we computed the gain or loss in biomass carbon and soil organic carbon stocks (via direct and indirect effects) by multiplying the unstandardized effect size by the range of that variable (Table 1) (Chen et al., 2023).
The analyses were carried out in RStudio 4.2.3 (Rstudio Inc) (R Core Team, 2023). The SEM analysis was implemented using the ‘piecewiseSEM 2.1.0’ package (Lefcheck, 2016), and LMM analysis was implemented using the ‘nlme 3.1–162’ package (Pinheiro et al., 2021) and ‘glmm. hp. 0.0–9’ package (Lai et al., 2022). All results were visualized with the ‘ggplot2’ package (Wickham, 2016).
3 Results
Forest productivity stability was driven indirectly by tree species diversity to a greater extent than understory woody and herbaceous vegetation species diversity or soil fungi and bacteria species diversity (Figure 3A, p = 0.38, Fisher’s C/df < 2). Furthermore, forest productivity stability was affected by environmental factors via the following four paths: (1) the stand structure variables of crown height (CH), variation of height on crown base (CV HCB), and soil physicochemical properties (Tn) positively influenced productivity stability, while the stand basal area (SBA), soil physicochemical properties (Tp), and climate variable TMP negatively influenced productivity stability; (2) the stand structure m-DBH, tree size variation (CV DBH), soil factor Tn, and climate variable TMP first increased CH; m-DBH, stand density (SA), CV DBH, and Tn increased SBA; and β-Tree, CV DBH, and Tp first increased CV HCB; in contrast, m-DBH and SA reduced CV HCB; (3) enhancement in tree richness further increased SA, CV DBH, and β-Tree; and (4) enhancement in climate variables (TMP) and soil physicochemical properties (Tn) further increased tree species diversity (α-Tree), while m-DBH, Tp, and fauna species diversity decreased α-Tree.
Figure 3
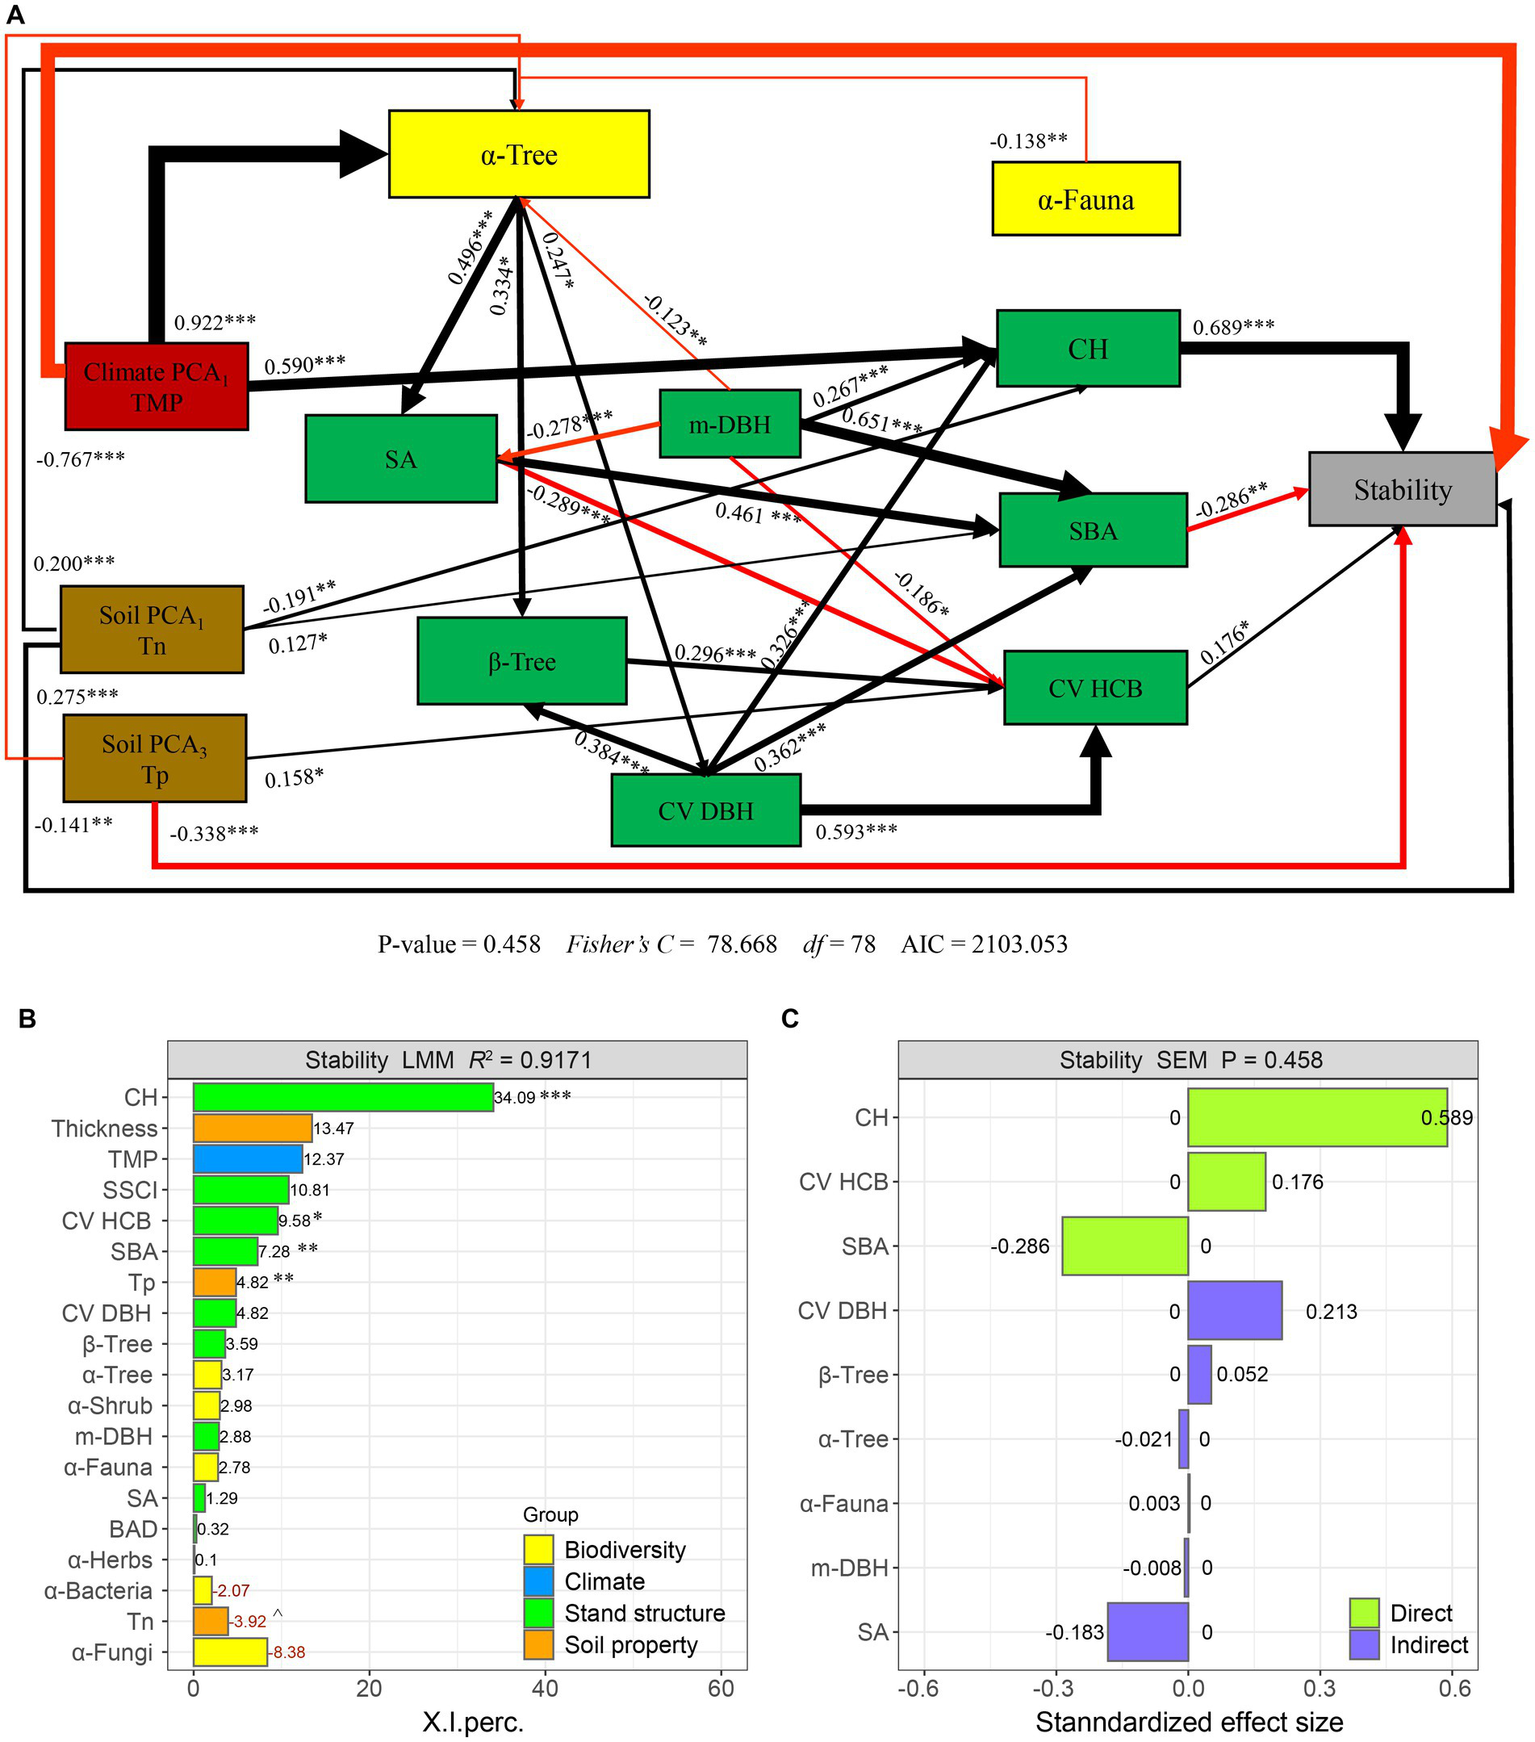
Structural equation models: impact of climate, soil physicochemical properties, species diversity, and stand structure variables on forest productivity stability (A). The red and black arrows represent significant positive and negative pathways, respectively. The path coefficients are denoted by bold numbers, and the width of the arrows reflects the strength of the relationship. (B) Variance decomposition analysis was conducted using a linear mixed-effects model (LMM), where positive values are indicated in black and negative values are indicated in red. I. Precision is reported as variance decomposition values for each variable. The relative importance of predictors was categorized into four identifiable variance fractions: climatic, soil, diversity, and forest structure. (C) The direct or indirect effect size of species diversity and stand structure variables. Significance levels are indicated as p < 0.001 (***), p < 0.01 (**), and p < 0.05 (*).
The results from the decomposition of the linear mixed-effects model reveal that stand structure factors CH, CV HCB, and SBA are the most significant drivers of forest productivity stability, explaining 34% (p < 0.001), 10% (p < 0.05), and 7% variance (p < 0.01), respectively (Figure 3B). Additionally, soil physicochemical properties Tp account for 5% of the variance (p < 0.01). There is an indirect and negative correlation between forest productivity stability and tree species diversity (α-Tree) as well as soil fauna species diversity (α-Fauna), showing a total effect size of −0.021 and − 0.003, respectively (Figure 3C). Stand structure variables CH, CV HCB, CV DBH, and β-Tree exhibit a positive correlation with forest productivity stability, with CH having the largest overall effect at 0.689. Conversely, stand structure variables SA, SBA, and m-DBH showed a negative correlation with forest productivity stability, with SBA having the smallest overall effect at −0.287. According to the structural equation modeling (SEM) results, increasing α-Tree from its minimum to maximum value (Figure 2C) leads to a decrease of 0.399 in forest productivity stability, while increasing α-Fauna from its minimum to maximum value (Figure 2C) results in a decrease of 0.231 (Table 2). Increasing stem density (SA) from its minimum to maximum value (Table 1) leads to a decrease of −46.665 in forest productivity stability while increasing crown height (CH) from its minimum to maximum value (Table 1) leads to an increase of 20.394 in forest productivity stability (Table 2).
Table 2
| Variable group | Predicter | Effect | Standardized r | Unstandardized r | Stability gain |
|---|---|---|---|---|---|
| Species diversity | α-Tree | Indirect | −0.021 | −0.021 | |
| Total | −0.021 | −0.021 | −0.399 | ||
| α-Fauna | Indirect | −0.003 | −0.003 | ||
| Total | −0.003 | −0.003 | −0.231 | ||
| Stand structure | β-Tree | Indirect | 0.052 | 0.052 | |
| Total | 0.052 | 0.052 | 0.051 | ||
| SA | Indirect | −0.183 | −0.183 | ||
| Total | −0.183 | −0.183 | −46.665 | ||
| m-DBH | Indirect | −0.008 | −0.008 | ||
| Total | −0.008 | −0.008 | −0.214 | ||
| CV DBH | Indirect | 0.213 | 0.213 | ||
| Total | 0.213 | 0.213 | 0.271 | ||
| CV HCB | Direct | 0.177 | 0.177 | ||
| Total | 0.177 | 0.177 | 0.281 | ||
| CH | Direct | 0.689 | 0.689 | ||
| Total | 0.689 | 0.689 | 20.394 | ||
| SBA | Direct | −0.287 | −0.287 | ||
| Total | −0.287 | −0.287 | −6.598 |
Standardized and unstandardized effect sizes and the gain of forest productivity stability by increasing species diversity and stand structure from minimum to maximum.
4 Discussion
Contrary to conventional perspectives that emphasize climate’s dominant role in driving ecosystem function (Zhang and Liang, 2014), our study illustrates that climate and tree diversity indirectly influence forest productivity stability through their effects on stand structure. The model developed in this study incorporates climate, soil, tree, understory plant, soil biota diversity, and stand structure and shows that there is no significant direct impact of understory plant, soil fungi, and bacteria species diversity on the stability of the forest ecosystem. Rather, our findings reveal that tree diversity indirectly influences stability through its impact on stand structure, suggesting an interconnected diversity-structure-stability mechanism. Notably, we observe that stand structure variables are more important than tree and soil fauna species diversity. In sum, our study highlights the potential risks to ecosystem function that are posed by the homogenization of forest communities, particularly in the context of extreme climate events.
4.1 Tree and soil fauna species diversity drive productivity stability rather than understory plant and soil fungi and bacteria species diversity
Determining the contributions of abiotic and biotic factors to productivity stability can greatly improve current forest management and conservation strategies (Nabuurs et al., 2013). Our study provides the first quantitative assessment of the influence of understory vegetation and soil biodiversity on the stability of productivity in Chinese temperate forests. When considering both understory plant and belowground soil biota biodiversity, the best-performing model that includes soil and climatic variables accounts for 92% of the variation in forest productivity stability (Figure 3B). This value is larger than those in several previous large-scale studies that evaluated forest productivity stability using remote sensing to analyze grassland ecosystems (73% of variation in García-Palacios et al., 2018, and 43% in Chen et al., 2021) and studies that applied allometric modeling approaches to analyze China’s temperate and subtropical forest ecosystems (14% of variation in Qiao et al., 2022, and 50% of variation in Ouyang et al., 2021). Several previous studies have observed strong associations between tree species diversity and productivity stability in forest ecosystems (Chen et al., 2021; Qiao et al., 2022, 2023). Many studies have also shown that tree species diversity has a positive effect on productivity stability through a combination of processes such as species asynchrony and interactions (Jucker et al., 2014; Ouyang et al., 2021). Our study reveals that the influence of tree species diversity on productivity stability is mediated by stand structure. These findings are consistent with the study by Dolezal et al. (2020) who found that stand structural attributes significantly enhanced community productivity stability at small scales using stem increment data.
However, the results of this study do not indicate significant direct effects of understory woody and herbaceous plant, soil fungi, and bacteria species diversity on forest productivity stability.
A counterview of the biodiversity-stability relationship holds that dominant species play a major role in driving forest productivity stability (Grman et al., 2010). The stability of dominant species populations can strongly influence community biomass stability, especially in communities dominated by a small number of species (Ma et al., 2017). Although understory vegetation and soil biota exhibit high species diversity, it is worth noting that most of the understory plant species that appeared in response to our experimental treatments were classified as “rare,” contributing only a small fraction to community biomass stability compared to dominant species (Ma et al., 2017). In Northeast China, the biomass of understory vegetation ranges from 2.76 to 9.70 t∙ha−1 (Jin et al., 2022), accounting for only 5–11% of the biomass of the entire forest ecosystem, the mean value of which is 85.24 t∙ha−1 (Su et al., 2016). Large studies have shown that soil biota diversity and plant diversity both contribute to productivity stability in grasslands (Wagg et al., 2014; Chen et al., 2021). Soil biota affected productivity stability via multiple direct and indirect pathways through soil nutrient availability or plant species richness. In some cases, the association between productivity stability and soil biota species diversity is equivalent to that between productivity stability and plant species diversity in grassland ecosystems (Wu et al., 2023). However, the strength and direction of these effects vary between soil biota groups (Chen et al., 2021) and ecosystem types (Gross et al., 2014). One aspect, in particular, is likely to be especially relevant for determining which processes drive productivity stability: the fact that grassland community species change in relative abundance from year to year, whereas shifts in community composition occur much more slowly in forests (Jucker et al., 2014). Furthermore, there are strongly positive linkages between plant species diversity and soil biota species at local scales (Yang et al., 2014, 2016). Our research reveals that soil fauna influence the productivity stability of forest ecosystems through their interactions with tree species diversity at a large scale.
4.2 Stand structure is more important than tree and soil fauna species diversity in driving productivity stability
Our results indicate that CH (34%, p < 0.001), CV HCB (10%, p < 0.05), and SBA (7%, p < 0.01) are the most important drivers of productivity stability. These findings align with García-Palacios et al. (2018) who found that mean height was the most important variable for predicting productivity stability. Across the global network of drylands analyzed in the study, the dominance of particular species was associated with productivity stability, as indicated by the significant quadratic effect of mean plant height (García-Palacios et al., 2018). There are several reasons for this. First, high tree richness (α-diversity) promotes stand density and size difference due to species characteristics. These stand structure factors are critical component of ecosystem resilience, or the capacity of an ecosystem to persist through and re-organize after disturbance, adapt to shifting environmental conditions, and maintain basic structure and function over time (Gonzalez and Loreau, 2009; Churchill et al., 2013). Furthermore, these variables further promote CH, SBA, and CV HCB. Second, higher turnover in tree species diversity (β-diversity) enhances resilience by increasing the variation in canopy height and spatial asynchrony among communities, thereby stabilizing productivity according to the spatial insurance hypothesis (Hautier et al., 2020). Our results also indicate that stand basal area (SBA) and soil property (Tn) negatively affect productivity stability. Higher SBA may promote intraspecific competition and dieback, while higher Tn increases vegetation growth rate. In considering multiple environmental factors together, we found that climate is the ultimate driver of productivity stability in our models because it promotes tree species diversity. Variations in precipitation and temperature (Knapp and Smith, 2001; Dobrowski et al., 2013) create fine-scale mosaics of environmental conditions (Kane et al., 2019) and affect tree species diversity. Various tree species also contribute different heights, crown architecture, and structural complexity, which directly influence the ecological niche and micro-climate within forest communities. Climate factors not only control diversity and productivity but also influence the capacity for diversity to stabilize ecosystem function by altering the mechanisms that link diversity-structure-stability. These findings highlight the crucial roles of climate and diversity in determining forest ecosystem stability. However, it must be acknowledged that we did not calculate the gains of forest productivity stability brought about by changes in climate factors.
5 Conclusion and management implications
Our research is an important step toward understanding the drivers of productivity stability at a large scale and the relative importance of the diversity and stand structure of tree, understory woody and herbaceous plant, soil fauna, and fungi and bacteria species. The findings clearly demonstrate that tree and soil fauna species diversity drives productivity stability by stand structure to a greater extent than the diversity of understory plant, soil fungi, and bacteria species. Furthermore, stand structure is a more important driver of forest productivity stability than the diversity of tree and soil fauna species. This conclusion is evidently quite different from the current understanding of grassland ecosystems. These findings underscore the potential risks associated with the loss of stand structure diversity, which may lead to a reduction in productivity stability, especially in the face of future extreme drought events and disturbances. While the study highlights the significance of species diversity, it is equally crucial to recognize the importance of structural diversity. This awareness highlights the need for enhanced efforts at biodiversity conservation and stability to prevent homogenization of biotic communities and structures. Such efforts should not only focus on local species diversity loss but also encompass the maintenance and restoration of structural diversity in the context of ongoing climate change.
Statements
Data availability statement
The original contributions presented in the study are included in the article/Supplementary material, further inquiries can be directed to the corresponding author.
Author contributions
TW: Data curation, Formal analysis, Software, Writing – original draft. LD: Conceptualization, Project administration, Supervision, Writing – review & editing. ZL: Conceptualization, Funding acquisition, Supervision, Writing – review & editing.
Funding
The author(s) declare financial support was received for the research, authorship, and/or publication of this article. This study was supported by the National Key R&D Program of China [grant number 2022YFD2200502], and the Fundamental Research Funds for the Central Universities of China [grant number 2572021DT07].
Acknowledgments
The authors would like to thank Dr. Daniel Petticord at the University of Cornell for his assistance with the English language and grammatical editing of the manuscript. The National Ecology Science Data Center, the National Earth System Science Data Center, the National Science & Technology Infrastructure of China (NESSDC, http://www.geodata.cn), and the National Tibetan Plateau Data Center (NTPDC, https://data.tpdc.ac.cn/) are acknowledged for the data support.
Conflict of interest
The authors declare that the research was conducted in the absence of any commercial or financial relationships that could be construed as a potential conflict of interest.
Publisher’s note
All claims expressed in this article are solely those of the authors and do not necessarily represent those of their affiliated organizations, or those of the publisher, the editors and the reviewers. Any product that may be evaluated in this article, or claim that may be made by its manufacturer, is not guaranteed or endorsed by the publisher.
Supplementary material
The Supplementary material for this article can be found online at: https://www.frontiersin.org/articles/10.3389/ffgc.2024.1354508/full#supplementary-material
References
1
Bardgett R. D. van der Putten W. H. (2014). Belowground biodiversity and ecosystem functioning. Nature515, 505–511. doi: 10.1038/nature13855
2
Baselga A. Orme C. D. L. (2012). Betapart: an R package for the study of beta diversity. Methods Ecol. Evol.3, 808–812. doi: 10.1111/j.2041-210x.2012.00224.x
3
Carol Adair E. Hooper D. U. Paquette A. Hungate B. A. (2018). Ecosystem context illuminates conflicting roles of plant diversity in carbon storage. Ecol. Lett.21, 1604–1619. doi: 10.1111/ele.13145
4
Chen P. (1983). Methods for collecting and investigating soil animals. Chin. J. Ecol.1983:3. (In Chinese)
5
Chen L. Jiang L. Jing X. Wang J. Shi Y. Chu H. et al . (2021). Above and belowground biodiversity jointly drive ecosystem stability in natural alpine grasslands on the Tibetan plateau. Glob. Ecol. Biogeogr.30, 1418–1429. doi: 10.1111/geb.13307
6
Chen X. Taylor A. R. Reich P. B. Hisano M. Chen H. Y. H. Chang S. X. (2023). Tree diversity increases decadal forest soil carbon and nitrogen accrual. Nature618, 94–101. doi: 10.1038/s41586-023-05941-9
7
Chu C. J. Lutz J. A. Král K. Vrška T. Xue Y. Myers J. A. et al . (2019). Direct and indirect effects of climate on richness drive the latitudinal diversity gradient in forest trees. Ecol. Lett.22, 245–255. doi: 10.1111/ele.13175
8
Churchill D. J. Larson A. J. Dahlgreen M. C. Franklin J. F. Hessburg P. F. Lutz J. A. (2013). Restoring forest resilience: from reference spatial patterns to silvicultural prescriptions and monitoring. For. Ecol. Manag.291, 442–457. doi: 10.1016/j.foreco.2012.11.007
9
Craven D. Eisenhauer N. Pearse W. D. Hautier Y. Isbell F. Roscher C. et al . (2018). Multiple facets of biodiversity drive the diversity-stability relationship. Nat. Ecol. Evol.2, 1579–1587. doi: 10.1038/s41559-018-0647-7
10
Decaens T. (2010). Macroecological patterns in soil communities. Glob. Ecol. Biogeogr.19, 287–302. doi: 10.1111/j.1466-8238.2009.00517.x
11
Delgado-Baquerizo M. Reich P. B. Trivedi C. Eldridge D. J. Abades S. Alfaro F. D. et al . (2020). Multiple elements of soil biodiversity drive ecosystem functions across biomes. Nat. Ecol. Evol.4, 210–220. doi: 10.1038/s41559-019-1084-y
12
Dobrowski S. Z. Abatzoglou J. Swanson A. K. Greenberg J. A. Mynsberge A. R. Holden Z. A. et al . (2013). The climate velocity of the contiguous United States during the 20th century. Glob. Chang. Biol.19, 241–251. doi: 10.1111/gcb.12026
13
Dolezal J. Fibich P. Altman J. Leps J. Uemura S. Takahashi K. et al . (2020). Determinants of ecosystem stability in a diverse temperate forest. Oikos129, 1692–1703. doi: 10.1111/oik.07379
14
Echiverri L. Macdonald S. E. (2019). Utilizing a topographic moisture index to characterize understory vegetation patterns in the boreal forest. For. Ecol. Manag.447, 35–52. doi: 10.1016/j.foreco.2019.05.054
15
Ehbrecht M. Seidel D. Annighöfer P. Kreft H. Köhler M. Zemp D. C. et al . (2021). Global patterns and climatic controls of forest structural complexity. Nat. Commun.12:519. doi: 10.1038/s41467-020-20767-z
16
García-Palacios P. Gross N. Gaitán J. Maestre F. T. (2018). Climate mediates the biodiversity-ecosystem stability relationship globally. Proc. Natl. Acad. Sci.115, 8400–8405. doi: 10.1073/pnas.1800425115
17
Gonzalez A. Loreau M. (2009). The causes and consequences of compensatory dynamics in ecological communities. Annu. Rev. Ecol. Evol. Syst.40, 393–414. doi: 10.1146/annurev.ecolsys.39.110707.173349
18
Grman E. Lau J. A. Schoolmaster D. R. Gross K. L. (2010). Mechanisms contributing to stability in ecosystem function depend on the environmental context. Ecol. Lett.13, 1400–1410. doi: 10.1111/j.1461-0248.2010.01533.x
19
Gross K. Cardinale B. J. Fox J. W. Gonzalez A. Loreau M. Polley H. W. et al . (2014). Species richness and the temporal stability of biomass production: a new analysis of recent biodiversity experiments. Am. Nat.183, 1–12. doi: 10.1086/673915
20
Halpern C. B. Spies T. A. (1995). Plant-species diversity in natural and managed forests of the Pacific-northwest. Ecol. Appl.5, 913–934. doi: 10.2307/2269343
21
Hautier Y. Seabloom E. W. Borer E. T. Adler P. B. Harpole W. S. Hillebrand H. et al . (2014). Eutrophication weakens stabilizing effects of diversity in natural grasslands. Nature508, 521–525. doi: 10.1038/nature13014
22
Hautier Y. Tilman D. Isbell F. Seabloom E. W. Borer E. T. Reich P. B. (2015). Anthropogenic environmental changes affect ecosystem stability via biodiversity. Science348, 336–340. doi: 10.1126/science.aaa1788
23
Hautier Y. Zhang P. F. Loreau M. Wilcox K. R. Seabloom E. W. Borer E. T. et al . (2020). General destabilizing effects of eutrophication on grassland productivity at multiple spatial scales. Nat. Commun.11:5375. doi: 10.1111/j.1744-697x.2009.00143.x
24
Isbell F. Craven D. Connolly J. Loreau M. Schmid B. Beierkuhnlein C. et al . (2015). Biodiversity increases the resistance of ecosystem productivity to climate extremes. Nature526, 574–577. doi: 10.1038/nature15374
25
Jin Y. Liu C. Qian S. S. Luo Y. Zhou R. Tang J. et al . (2022). Large-scale patterns of understory biomass and its allocation across China's forests. Sci. Total Environ.804:150169. doi: 10.1016/j.scitotenv.2021.150169
26
Jing X. Sanders N. J. Shi Y. U. Chu H. Classen A. T. Zhao K. E. et al . (2015). The links between ecosystem multifunctionality and above-and belowground biodiversity are mediated by climate. Nat. Commun.6:8159. doi: 10.1038/ncomms9159
27
Jucker T. Bouriaud O. Avacaritei D. Coomes D. A. (2014). Stabilizing effects of diversity on aboveground wood production in forest ecosystems: linking patterns and processes. Ecol. Lett.17, 1560–1569. doi: 10.1111/ele.12382
28
Kane V. R. Bartl-Geller B. N. North M. P. Kane J. T. Lydersen J. M. Jeronimo S. M. A. et al . (2019). First-entry wildfires can create opening and tree clump patterns characteristic of resilient forests. For. Ecol. Manag.454:117659. doi: 10.1016/j.foreco.2019.117659
29
Knapp A. K. Smith M. D. (2001). Variation among biomes in temporal dynamics of aboveground primary production. Science291, 481–484. doi: 10.1126/science.291.5503.481
30
Krebs M. A. Reeves M. C. Baggett L. S. (2019). Predicting understory vegetation structure in selected western forests of the United States using FIA inventory data. For. Ecol. Manag.448, 509–527. doi: 10.1016/j.foreco.2019.06.024
31
Lai J. S. Zou Y. Zhang S. Zhang X. G. Mao L. F. (2022). Glmm.Hp: an R package for computing individual effect of predictors in generalized linear mixed models. J. Plant Ecol.15, 1302–1307. doi: 10.1093/jpe/rtac096
32
Larson A. J. Churchill D. (2012). Tree spatial patterns in fire-frequent forests of western North America, including mechanisms of pattern formation and implications for designing fuel reduction and restoration treatments. For. Ecol. Manag.267, 74–92. doi: 10.1016/j.foreco.2011.11.038
33
Lefcheck J. S. (2016). piecewiseSEM: piecewise structural equation modelling in r for ecology, evolution, and systematics. Methods Ecol. Evol.7, 573–579. doi: 10.1111/2041-210x.12512
34
Li B. Li Y. S. Wei J. B. Song X. Y. Shi R. J. Hou Y. X. et al . (2020). Effects of different land use Typess on the molecular ecological network of soil bacteria. Environ. Sci.41, 1456–1465. (In Chinses). doi: 10.13227/j.hjkx.201907179
35
Li P. Shi R. J. Zhao F. Yu J. H. Cui X. Y. Jin-gui H. U. et al . (2019). Soil bacterial community structure and predicted functions in the larch forest during succession at the greater Khingan Mountains of Northeast China. Chin. J. Appl. Ecol.30, 95–107. doi: 10.13287/j.1001-9332.201901.010
36
Li Z. L. Tian D. S. Wang B. X. Wang J. S. Wang S. Chen H. Y. H. et al . (2019). Microbes drive global soil nitrogen mineralization and availability. Glob. Chang. Biol.25, 1078–1088. doi: 10.1111/gcb.14557
37
Liang J. Crowther T. W. Picard N. Wiser S. Zhou M. O. Alberti G. et al . (2016). Positive biodiversity-productivity relationship predominant in global forests. Science354:aaf8957. doi: 10.1126/science.aaf8957
38
Liu S. Garcia-Palacios P. Tedersoo L. Guirado E. van der Heijden M. G. Wagg C. et al . (2022). Phylotype diversity within soil fungal functional groups drives ecosystem stability. Nat. Ecol. Evol.6, 900–909. doi: 10.1038/s41559-022-01756-5
39
Liu C. Sack L. Li Y. Zhang J. Yu K. Zhang Q. et al . (2023). Relationships of stomatal morphology to the environment across plant communities. Nat. Commun.14:6629. doi: 10.1038/s41467-023-42136-2
40
Liu X. Q. Su Y. J. Hu T. Y. Yang Q. L. Liu B. B. Deng Y. F. et al . (2022). Neural network guided interpolation for mapping canopy height of China's forests by integrating GEDI and ICESat-2 data. Remote Sens. Environ.269:112844. doi: 10.1016/j.rse.2021.112844
41
Liu S. Wang H. Tian P. Yao X. Sun H. Wang Q. et al . (2020). Decoupled diversity patterns in bacteria and fungi across continental forest ecosystems. Soil Biol. Biochem.144:107763. doi: 10.1016/j.soilbio.2020.107763
42
Liu F. Wu H. Y. Zhao Y. G. Li D. C. Yang J. L. Song X. D. et al . (2021). Mapping high resolution National Soil Information Grids of China. Sci. Bull.67, 328–340. doi: 10.1016/j.scib.2021.10.013
43
Loke L. H. L. Chisholm R. A. (2022). Measuring habitat complexity and spatial heterogeneity in ecology. Ecol. Lett.25, 2269–2288. doi: 10.1111/ele.14084
44
Ma Z. Liu H. Mi Z. Zhang Z. Wang Y. Xu W. et al . (2017). Climate warming reduces the temporal stability of plant community biomass production. Nat. Commun.8:15378. doi: 10.1038/ncomms15378
45
Morin X. Fahse L. de Mazancourt C. Scherer-Lorenzen M. Bugmann H. (2014). Temporal stability in forest productivity increases with tree diversity due to asynchrony in species dynamics. Ecol. Lett.17, 1526–1535. doi: 10.1111/ele.12357
46
Nabuurs G. J. Lindner M. Verkerk P. J. Gunia K. Grassi G. (2013). First signs of carbon sink saturation in european forest biomass. Nat. Clim. Chang.3, 792–796. doi: 10.1038/nclimate1853
47
Orgiazzi A. Bardgett R. D. Barrios E. Behan-Pelletier V. Verheijen F. (2016). Global soil biodiversity atlas. European Commission.
48
Ouyang S. Xiang W. Gou M. Chen L. Lei P. Xiao W. et al . (2021). Stability in subtropical forests: the role of tree species diversity, stand structure, environmental and socio-economic conditions. Glob. Ecol. Biogeogr.30, 500–513. doi: 10.1111/geb.13235
49
Pellkofer S. van der Heijden M. G. A. Schmid B. Wagg C. (2016). Soil communities promote temporal stability and species asynchrony in experimental grassland communities. PLoS One11:e0148015. doi: 10.1371/journal.pone.0148015
50
Penone C. Allan E. Soliveres S. Felipe-Lucia M. R. Gossner M. M. Seibold S. et al . (2019). Specialisation and diversity of multiple trophic groups are promoted by different forest features. Ecol. Lett.22, 170–180. doi: 10.1111/ele.13182
51
Pinheiro J. Bates D. DebRoy S. Sarkar D. R Core Team (2021). Nlme: linear and nonlinear mixed effects models. R package version3, 1–152. Available at:https://CRAN.R-project.org/package=nlme
52
Qiao X. Geng Y. Zhang C. Han Z. Zhang Z. Zhao X. et al . (2022). Spatial asynchrony matters more than alpha stability in stabilizing ecosystem productivity in a large temperate forest region. Glob. Ecol. Biogeogr.31, 1133–1146. doi: 10.1111/geb.13488
53
Qiao X. Lamy T. Wang S. Hautier Y. Geng Y. White H. J. et al . (2023). Latitudinal patterns of forest ecosystem stability across spatial scales as affected by biodiversity and environmental heterogeneity. Glob. Chang. Biol.29, 2242–2255. doi: 10.1111/gcb.16593
54
R Core Team (2023). R: A language and environment for statistical computing. Vienna, Austria: R Development Core Team. Available at: https://www.R-project.org/.
55
Schnabel F. Liu X. Kunz M. Barry K. E. Bongers F. J. Bruelheide H. et al . (2021). Species richness stabilizes productivity via asynchrony and drought-tolerance diversity in a large-scale tree biodiversity experiment. Science. Advances7:eabk1643. doi: 10.1126/sciadv.abk1643
56
Su Y. J. Guo Q. H. Xue B. L. Hu T. Y. Alvarez O. Tao S. L. et al . (2016). Spatial distribution of forest aboveground biomass in China: estimation through combination of spaceborne lidar, optical imagery, and forest inventory data. Remote Sens. Environ.173, 187–199. doi: 10.1016/j.rse.2015.12.002
57
Su X. Li S. Wan X. Huang Z. Liu B. Fu S. et al . (2021). Understory vegetation dynamics of Chinese fir plantations and natural secondary forests in subtropical China. For. Ecol. Manag.483:118750. doi: 10.1016/j.foreco.2020.118750
58
Tamaki H. Wright C. L. Li X. Lin Q. Hwang C. Wang S. et al . (2011). Analysis of 16S rRNA amplicon sequencing options on the Roche/454 next-generation titanium sequencing platform. PLoS One6:e25263. doi: 10.1371/journal.pone.0025263
59
Tilman D. Reich P. B. Knops J. M. (2006). Biodiversity and ecosystem stability in a decade-long grassland experiment. Nature441, 629–632. doi: 10.1038/nature04742
60
Turner D. P. Franz E. H. (1985). The influence of western hemlock and western redcedar on microbial numbers, nitrogen mineralization, and nitrification. Plant Soil88, 259–267. doi: 10.1007/bf02182452
61
Wagg C. Bender S. F. Widmer F. van der Heijden M. G. A. (2014). Soil biodiversity and soil community composition determine ecosystem multifunctionality. Proc. Natl. Acad. Sci.111, 5266–5270. doi: 10.1073/pnas.1320054111
62
Wagg C. Schlaeppi K. Banerjee S. Kuramae E. E. van der Heijden M. G. A. (2019). Fungal-bacterial diversity and microbiome complexity predict ecosystem functioning. Nat. Commun.10:4841. doi: 10.1038/s41467-019-12798-y
63
Wang H. Ding Y. Zhang Y. Wang J. Freedman Z. B. Liu P. et al . (2023). Evenness of soil organic carbon chemical components changes with tree species richness, composition and functional diversity across forests in China. Glob. Change Biol.29, 2852–2864. doi: 10.1111/gcb.16653
64
Wickham H. (2016). ggplot2: Elegant graphics for data analysis. New York: Springer-Verlag.
65
Wu L. Chen H. Chen D. Wang S. Wu Y. Wang B. et al . (2023). Soil biota diversity and plant diversity both contributed to ecosystem stability in grasslands. Ecol. Lett.26, 858–868. doi: 10.1111/ele.14202
66
Wu X. Y. Feng L. C. Li Y. , XuW. C., MengQ. F. (2021). Diversity of soil Collembola of different Forest types and its influence factors in Changbai Mountain nature reserve. Chin. J. Northeast For. Univ., 49: 120–125. (In Chinese)
67
Xu H. Yin X. Q. Chen M. (2017). Community structure and ecological distribution of soil Collembola from typical farmland ecosystems in the Changbai Mountains. Acta Ecol. Sin.37, 8005–8014. (In Chinses). doi: 10.5846/stxb201610242166
68
Yang J. L. Dong J. W. Xiao X. M. Dai J. H. Wu C. Y. Xia J. Y. et al . (2019). Divergent shifts in peak photosynthesis timing of temperate and alpine grasslands in China. Remote Sens. Environ.233:111395. doi: 10.1016/j.rse.2019.111395
69
Yang G. Liu N. Lu W. Wang S. Kan H. Zhang Y. et al . (2014). The interaction between arbuscular mycorrhizal fungi and soil phosphorus availability influences plant community productivity and ecosystem stability. J. Ecol.102, 1072–1082. doi: 10.1111/1365-2745.12249
70
Yang G. W. Wagg C. Veresoglou S. D. Hempel S. Rillig M. C. (2018). How soil biota drive ecosystem stability. Trends Plant Sci.23, 1057–1067. doi: 10.1016/j.tplants.2018.09.007
71
Yang G. Yang X. Zhang W. Wei Y. Ge G. E. Lu W. et al . (2016). Arbuscular mycorrhizal fungi affect plant community structure under various nutrient conditions and stabilize the community productivity. Oikos125, 576–585. doi: 10.1111/oik.02351
72
Yu M. Sun O. J. (2013). Effects of forest patch type and site on herb-layer vegetation in a temperate forest ecosystem. For. Ecol. Manag.300, 14–20. doi: 10.1016/j.foreco.2012.12.039
73
Yuan Z. Ali A. Loreau M. Ding F. Liu S. Sanaei A. et al . (2021). Divergent above-and below-ground biodiversity pathways mediate disturbance impacts on temperate forest multifunctionality. Glob. Chang. Biol.27, 2883–2894. doi: 10.1111/gcb.15606
74
Zhang Y. Z. Liang S. N. (2014). Changes in forest biomass and linkage to climate and forest disturbances over Northeastern China. Glob. Chang. Biol.20, 2596–2606. doi: 10.1111/gcb.12588
75
Zhang R. Tian D. Wang J. Pan J. Zhu J. Li Y. et al . (2022). Dryness weakens the positive effects of plant and fungal β diversities on above-and belowground biomass. Glob. Chang. Biol.28, 6629–6639. doi: 10.1111/gcb.16405
76
Zhou X. Zhu H. Wen Y. Goodale U. M. Li X. You Y. et al . (2017). Effects of understory management on trade-offs and synergies between biomass carbon stock, plant diversity and timber production in eucalyptus plantations. For. Ecol. Manag.410, 164–173. doi: 10.1016/j.foreco.2017.11.015
Summary
Keywords
multiple-taxon, understory plant species diversity, soil biota species diversity, stand structure, species diversity-structure-stability, Chinese temperate forest
Citation
Wang T, Dong L and Liu Z (2024) Stand structure is more important for forest productivity stability than tree, understory plant and soil biota species diversity. Front. For. Glob. Change 7:1354508. doi: 10.3389/ffgc.2024.1354508
Received
12 December 2023
Accepted
29 January 2024
Published
20 February 2024
Volume
7 - 2024
Edited by
Yashwant Singh Rawat, Federal Technical and Vocational Education and Training Institute (FTVETI), Ethiopia
Reviewed by
Xu Han, Beihua University, China
Shengen Liu, Fujian Agriculture and Forestry University, China
Updates
Copyright
© 2024 Wang, Dong and Liu.
This is an open-access article distributed under the terms of the Creative Commons Attribution License (CC BY). The use, distribution or reproduction in other forums is permitted, provided the original author(s) and the copyright owner(s) are credited and that the original publication in this journal is cited, in accordance with accepted academic practice. No use, distribution or reproduction is permitted which does not comply with these terms.
*Correspondence: Zhaogang Liu, lzg19700602@163.com
Disclaimer
All claims expressed in this article are solely those of the authors and do not necessarily represent those of their affiliated organizations, or those of the publisher, the editors and the reviewers. Any product that may be evaluated in this article or claim that may be made by its manufacturer is not guaranteed or endorsed by the publisher.