Abstract
Cytospora canker caused by Cytospora chrysosperma has a wide range of hazards in Xinjiang, seriously affecting the development of Xinjiang’s characteristic forest and fruit industries. Climate change affects the distribution of fungal species and may exacerbate the risk of forest diseases such as cytospora canker. The present study was conducted on C. chrysosperma and makes predictions of potentially suitable area based on 133 records of C. chrysosperma distribution points and 47 environmental factors. We applied the MaxEnt model adjusted by the Kuenm package for feature class parameters (FC) and regularization multipliers (RM) to explore the main environmental factors affecting the geographical distribution of C. chrysosperma. And then we predicted its spatial distribution pattern and centroid change trend in potentially suitable area under three different Representative Concentration Pathways in the current scenario, 2041–2070, and 2071–2,100. The results showed that the optimal model with parameters FC = LQ and RM = 0.3 had the lowest model complexity and overfitting, and the model predicted with very high accuracy, AUC = 0.971 ± 0.0019. Considering the percent contribution, permutation importance of jackknife and single-factor response curve, the main environmental factors affecting its geographical distribution are precipitation seasonality (bio15), aspect cosine (aspectcosine), monthly variability in potential evapotranspiration (PETseasonality), and mean monthly potential evapotranspiration of the coldest quarter (PETColdestQuarter), with a cumulative contribution rate reaching 70.8%. Under the current climate scenarios, the total suitable area for C. chrysosperma is 82.35 × 10⁴ km2, and the highly suitable area is 5.49 × 10⁴ km2, accounting for 6.67% of the total suitable area, primarily located in the Tacheng, Yili, and Changji regions. Meanwhile, centroid transfer analysis indicates a tendency for its distribution to migrate towards lower latitudes under future climatic conditions. The MaxEnt model proposed in this study can be used to predict the distribution and risk of C. chrysosperma in Xinjiang and provide guidance for the prevention and control of cytospora canker.
1 Introduction
Cytospora canker, caused by Cytospora Ehrenb., is a typical forestry disaster, also known as canker disease, mainly damaging parts of trees such as main branches, side branches, and forks. Cytospora Ehrenb. is a forest tree pathogenic fungus widely distributed worldwide (Adams et al., 2002), mainly in temperate and cold temperate zones with continental and extreme continental climates, such as Canada and the United States in the Americas, Russia and the United Kingdom in Europe, China and Japan in Asia (Kobayashi, 1970; Adams et al., 2006), as well as various countries and regions in Africa (Zhang et al., 1999). In China, particularly in the Northwest, North China, and Northeast regions, trees are often subjected to harsh ecological conditions such as low temperatures, drought, wind-sand, and salinization, which can easily lead to tree vigor decline and cause widespread occurrence of canker disease. The occurrence of cytospora canker is the most serious among forestry diseases in Xinjiang, which is due to the unique geographic features and climatic characteristics of Xinjiang that have formed a large area of concentrated cultivation of single species of trees. Moreover, it is affected by persistent low temperatures and freezing in winter and by hot and dry summers, coupled with sloppy management by farmers resulting in a decline in tree growth potential. This has led to the prevalence of canker disease in economically significant trees such as apples, Korla fragrant pears (Tang et al., 2015), walnuts (Liu et al., 2020; Wen et al., 2022), jujubes, and almonds, as well as a widespread outbreak of canker disease in protective forests like poplars, willows, elms, and Populus euphraticas (Guo et al., 2018; Zhu et al., 2019; He et al., 2022). In mild cases, it causes tree branches to die and trees to weaken, leading to the death of the forest, and in severe cases, it directly causes the destruction of the orchard. Studies show that there are 51 species of Cytospora spp. in Xinjiang Province, with distribution records across 11 host tree families in 15 prefectures (cities). The most detrimental and widely spread among these is Cytospora chrysosperma (Pers.) Fr. (Zhao et al., 2019; He et al., 2022).
There is a close relationship between forestry diseases and climate (Jactel et al., 2012; Breshears et al., 2018). Changes in the ecosystem induced by climate change increase the susceptibility of forest plants (Sturrock et al., 2011; Pautasso et al., 2012), which can lead to changes in the internal environment of forests, thereby altering the community structure and species composition of forest tree species, further increasing the risk of forest disease occurrence and spread (Anderson et al., 2004; Allen et al., 2010). Due to the influence of climate change, forest diseases have shown a trend of change. Many diseases traditionally considered temporary or sporadic have become more frequent and persistent globally, even invading new regions in foreign locations (Cobb et al., 2017). As global climate change continues to develop and intensify, forest diseases show a diverse range of manifestations in various regions. Increasing research shows that the impact of climate change on plants and species composition is extremely complex and diverse. Therefore, a deeper understanding of the impact of climate change on forest diseases is a long-term and complex task (Moritz and Agudo, 2013). By simulating species adaptability, species distribution, and disease spread under different environmental conditions, we can better understand the impact of climate change on forest diseases and predict their development trends and possible disastrous effects.
Ecological niche models (ENMs) have become an important tool for assessing and predicting the distribution and impact of forest diseases. The outbreak and prevalence of forest diseases are often influenced by multiple factors, such as climate, vegetation, and other environmental factors, as well as soil and topographic features, and biological factors such as insects and fungi (Cavers and Cottrell, 2015; Bosso et al., 2017; Duque-Lazo et al., 2018). Therefore, ecological niche models need to take these factors into account to determine the potential risks and degree of harm of forest diseases. These models can help researchers and managers better understand the relationships between environmental factors, host species, and disease dynamics. Among them, MaxEnt is a common method that can handle complex non-linear relationships between environmental variables and species occurrence (Phillips et al., 2006). Jiang et al. (2017) used MaxEnt combined with diffusion estimation to predict the spread of sudden oak death in California and identify potential disease hotspots. BIOCLIM is an early ecological niche modeling method that uses a climate envelope to define suitable environmental conditions for a species. Godefroid et al. (2020) used the BIOCLIM model to predict the potential distribution of the Oak Processionary Moth (OPM) in Europe under current and future climate conditions. GARP uses a genetic algorithm to generate a set of rules that describe the relationship between species occurrence and environmental variables. It is particularly suitable for presence-only data and can handle complex non-linear relationships. Sobek-Swant et al. (2012) used GARP to simulate the potential distribution of the emerald ash borer (Agrilus planipennis, EAB) in Canada, the United States, and eastern Asia. Guo et al. (2005) used support vector machines (SVMs) to predict the potential distribution of a newly discovered virulent pathogen (Phytophthora ramorum) in California. Overall, MaxEnt is one of the best performing models by adjusting the regularization multiplier to avoid overfitting (Hernandez et al., 2006; Phillips et al., 2006; Wisz et al., 2008).
These studies all show the universality and importance of ecological niche models in understanding the potential distribution and spread of forest pests and diseases. By incorporating climate variables and considering future climate scenarios, researchers can better understand the possible impacts of these pests and diseases on forests and develop targeted management strategies.
This paper predicts the suitable distribution of C. chrysosperma in Xinjiang based on the MaxEnt model under current and future climate change scenarios, which provides a theoretical basis for decision-making related to the prevention and control of cytospora canker in Xinjiang. The main objectives of this study are: (i) to identify the main environmental factors affecting the geographical distribution of C. chrysosperma, (ii) to study the characteristics of the geographic distribution of C. chrysosperma under the current climatic conditions, and (iii) to predict the geographical distribution and spatial changes of C. chrysosperma under future climate change.
2 Materials and methods
2.1 Overview of the study area
Xinjiang is located in northwestern China, with geographical coordinates ranging from 73°40′ to 96°08′ east longitude and 34°22′ to 49°10′ north latitude, and covers an area of 1.66 million square kilometers. Xinjiang has diverse topographic features, including mountains, deserts, grasslands, and forests. The region includes the Altai Mountains, the Tianshan Mountains, the Kunlun Mountains, and the Turpan Basin. The Tianshan Mountains stretch from west to east across the middle, dividing Xinjiang into southern and northern parts. South of the Tianshan is the Tarim Basin, with the Taklamakan Desert at the center; north of the Tianshan is the Junggar Basin, with the Gurbantunggut Desert at the center. Xinjiang is far from the ocean and has a continental arid climate, with large temperature differences between day and night, as well as between summer and winter. The rainfall is generally low, with the annual precipitation in most areas being less than 200 mm (Guan et al., 2022). Overall, there is relatively little forest vegetation in Xinjiang, and the main types of forest vegetation are coniferous forests, scrub forests, broad-leaved evergreen forests, and desert vegetation (Zhang et al., 2021). Figure 1 shows the location of the study area and the distribution of sampling sites.
Figure 1

(A) Distribution of the C. chrysosperma presence points in Xinjiang, China. (B) Location of the study area. (C,D) Disease symptoms associated with C. chrysosperma.
2.2 Distribution data for Cytospora chrysosperma
From 2018 to 2021, our research team conducted the collection of cytospora canker specimens in the Yili, Tacheng, Altay, Bazhou, Aksu, and Kashgar regions of Xinjiang. In the field, we collected branches with typical symptoms, and more than 1,000 disease specimens were collected from 14 host tree species, including Salix spp., Populus spp., Malus spp., Betula spp., Elaeagnus spp. Then, in the laboratory, we completed the isolation, cultivation, and preservation of the fungal strains, and carried out taxonomic identification work using the same methodology as in Pan et al. (2021). We initially obtained 305 distribution records of C. chrysosperma. To reduce spatial autocorrelation of sample point data and avoid overfitting of the model, we used the Trim duplicate occurrences feature of ENMTools software to remove duplicate and invalid coordinate points in each 2.5 arc-minute grid cell (corresponding to the environmental variable data in the following text), ultimately obtaining 133 valid C. chrysosperma distribution data points in the study area. These were organized and saved in a CSV format file for MaxEnt modeling analysis.
2.3 Data on environmental variables
In this paper, we predicted the distribution pattern of C. chrysosperma based on 47 environmental factors over three periods, i.e., the contemporary scenario (1981–2010), and two future scenarios (2041–2070, 2071–2,100), respectively. The data on environmental variables included 38 bioclimatic factors, 8 topographic and geomorphological factors, and 1 soil factor. In Table 1, the first group of 21 bioclimatic factors was downloaded from the CHELSA database (Karger et al., 2017, 2021),1 and the second group of 17 bioclimatic factors was downloaded from the ENVIREM database (Title and Bemmels, 2018).2 Topographic/geomorphological factors were downloaded from the EarthEnv database (Amatulli et al., 2018),3 and soil factors from the ORNL DAAC database (doi: 10.3334/ORNLDAAC/1304) (Pelletier et al., 2016). Considering the impact of climate scenario selection on the model prediction results, a total of 15 combinations of five Global circulation models (GCMs) and three Shared socio-economic Pathways (SSPs) are included for the next two decades. GCMs included GFDL-ESM4, IPSL-CM6A-LR, MPI-ESM1-2-HR, MRI-ESM2-0, UKESM1-0-L. SSPs included SSP1-RCP2.6, SSP3-RCP7, and SSP5-RCP8.5. The composite prediction layer corresponding to each SSP was then arithmetically averaged to reduce the uncertainty of individual circulation models in predicting C. chrysosperma habitat distribution. All environmental variables were processed at a spatial resolution of 2.5 arc minutes in ArcGIS 10.4.1 to obtain study area-wide data.
Table 1
| NO | Variables | Abbreviation | Unit | Source |
|---|---|---|---|---|
| 1 | Mean annual air temperature | bio01 | °C/10 | CHELSA |
| 2 | Mean diurnal air temperature range | bio02 | °C/10 | |
| 3 | Isothermality | bio03 | °C/10 | |
| 4 | Temperature seasonality | bio04 | °C/10 | |
| 5 | Mean daily maximum air temperature of the warmest month | bio05 | °C/10 | |
| 6 | Mean daily minimum air temperature of the coldest month | bio06 | °C/10 | |
| 7 | Annual range of air temperature | bio07 | °C/10 | |
| 8 | Mean daily mean air temperatures of the wettest quarter | bio08 | °C/10 | |
| 9 | Mean daily mean air temperatures of the driest quarter | bio09 | °C/10 | |
| 10 | Mean daily mean air temperatures of the warmest quarter | bio10 | °C/10 | |
| 11 | Mean daily mean air temperatures of the coldest quarter | bio11 | °C/10 | |
| 12 | Annual precipitation amount | bio12 | kg m−2 | |
| 13 | Precipitation amount of the wettest month | bio13 | kg m−2 | |
| 14 | Precipitation amount of the driest month | bio14 | kg m−2 | |
| 15 | Precipitation seasonality | bio15 | kg m−2 | |
| 16 | Mean monthly precipitation amount of the wettest quarter | bio16 | kg m−2 | |
| 17 | Mean monthly precipitation amount of the driest quarter | bio17 | kg m−2 | |
| 18 | Mean monthly precipitation amount of the warmest quarter | bio18 | kg m−2 | |
| 19 | Mean monthly precipitation amount of the coldest quarter | bio19 | kg m−2 | |
| 20 | Net primary productivity | npp | g C m−2 y−1 10−1 | |
| 21 | Number of days with snowcover | scd | – | |
| 22 | Annual potential evapotranspiration | annualPET | mm / year | ENVIREM |
| 23 | Thornthwaite aridity index | aridityIndexThornthwaite | – | |
| 24 | Climaticmoistureindex | climaticMoistureIndex | – | |
| 25 | Continentality | continentality | °C | |
| 26 | Emberger’s pluviothermic quotient | embergerQ | – | |
| 27 | Sum of mean monthly temperature for months with mean temperature greater than 0°C multiplied by number of days | growingDegDays0 | – | |
| 28 | Sum of mean monthly temperature for months with mean temperature greater than 5°C multiplied by number of days | growingDegDays5 | – | |
| 29 | Max. Temp. of the coldest month | maxTempColdest | °C * 10 | |
| 30 | Mean. Temp. of the coldest month | meanTempColdest | °C * 10 | |
| 31 | Mean. Temp. of the warmest month | meanTempWarmest | °C * 10 | |
| 32 | Min. Temp. of the warmest month | minTempWarmest | °C * 10 | |
| 33 | Mean monthly PET of coldest quarter | PETColdestQuarter | mm / month | |
| 34 | Mean monthly PET of driest quarter | PETDriestQuarter | mm / month | |
| 35 | Monthly variability in potential evapotranspiration | PETseasonality | mm / month | |
| 36 | Mean monthly PET of warmest quarter | PETWarmestQuarter | mm / month | |
| 37 | Mean monthly PET of wettest quarter | PETWettestQuarter | mm / month | |
| 38 | Compensated thermicity index | thermicityIndex | °C | |
| 39 | Aspect Cosine | aspectcosine | – | EarthEnv |
| 40 | Aspect Sine | aspectsine | – | |
| 41 | Elevation | elevation | m | |
| 42 | Roughness | roughness | – | |
| 43 | Slope | slope | ° | |
| 44 | Topographic Position Index | tpi | – | |
| 45 | Terrain Ruggedness Index | tri | – | |
| 46 | Vector Ruggedness Measure | vrm | – | |
| 47 | Averages soil and sedimentary deposit thicknesses across upland hillslopes and valley bottoms in meters | AvgSoilSedimDeposThick | m | ORNL DAAC |
Environment variables for MaxEnt modeling.
The final selected environment variable is shown in bold.
To reduce multicollinearity among environmental variables, we analyzed the correlation of candidate variables using the ENMTools.pl. software. We used the Pearson correlation coefficient and the Jackknife method to screen the most important environmental factors affecting the potential habitat distribution of C. chrysosperma. First, we assessed the Pearson correlation coefficients between the 47 environmental factors for 133 records and used |R| ≥ 0.8 as the threshold for determining significant correlations between factors (Fan et al., 2022). Then, for each pair of significantly correlated variables, only the variable with the greatest contribution was retained (Yu et al., 2020; Wei et al., 2021). Eventually, we chose bio15, aspectcosine, PETseasonality, PETColdestQuarter, scd, npp, PETDriestQuarter, bio07, AvgSoilSedimDeposThick, and elevation as the 10 environmental variables for constructing the C. chrysosperma distribution model.
2.4 Optimization of model parameters
Feature class parameters (FC) and regularization multipliers (RM) are crucial for modeling species distributions using MaxEnt, and we selected the most appropriate model by evaluating different combinations of them (Morales et al., 2017). In R version 3.6.3, we used the Kuenm package to optimize FC and RM (Cobos et al., 2019). First, the four FCs of the MaxEnt model [linear (L), quadratic (Q), hinge (H), and product (P)] were combined into 15 FC combinations [L, Q, P, H, LQ, LP, LH, QP, QH, PH, LQP, LQH, LPH, QPH, QPH, LQP, LQH, LPH, QPH, and LQPH], and next, the RMs were set to be 0.1–4 at intervals of 0.1 each for a total of 40 RM values. By combining the FC and RM parameters, a total of 600 candidate models were evaluated. We then selected significant models with an omission rate less than the threshold of 5% and a Delta AICc value not greater than 2 as the basis for determining the optimal model (Akpoti et al., 2020; Arenas-Castro et al., 2020). All models with Delta AICc <2 had high reliability, and the model with the smallest Delta AICc value (Delta AICc = 0) was considered the final model (Figure 2).
Figure 2
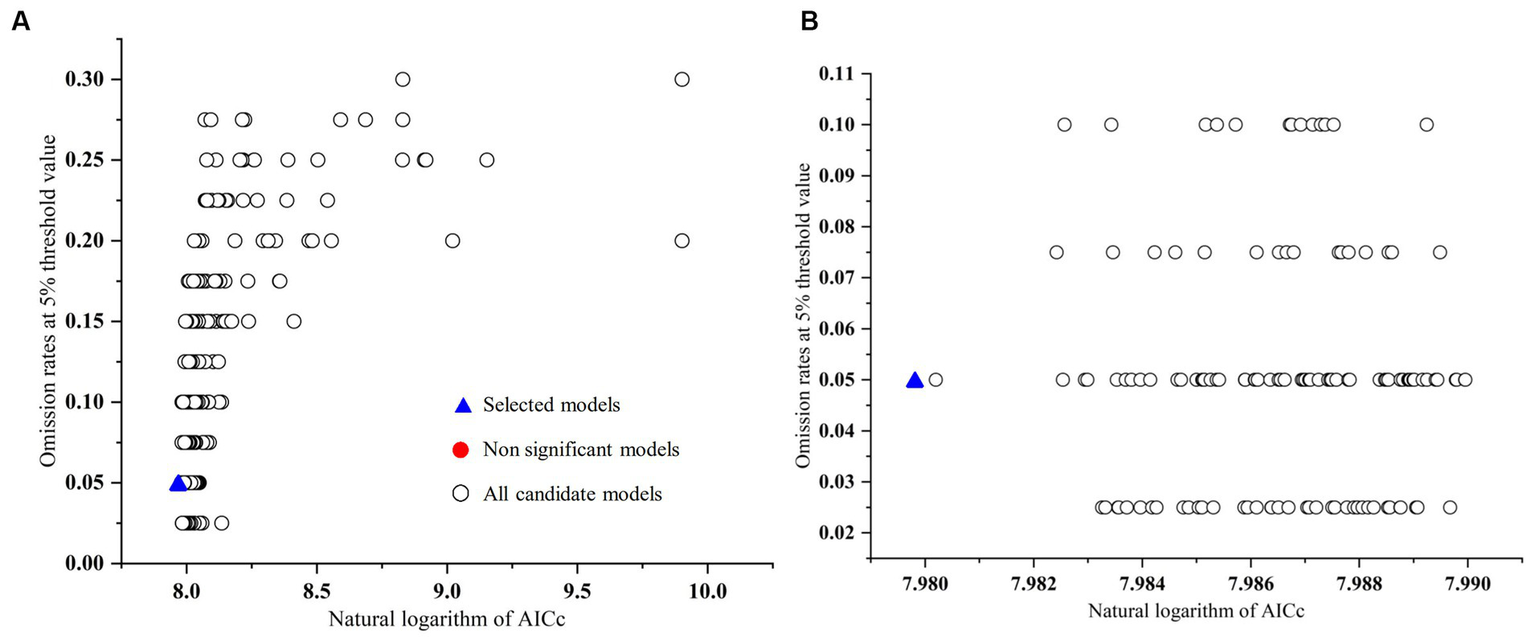
Omission rates and AICc values for all, non-significant, and selected “best” candidate models for the C. chrysosperma. (A) Global view; (B) local view.
2.5 Species distribution model
The final model was constructed using MaxEnt 3.4.4 and the selected parameters, with the combination of FC as LQ and FM as 0.3. During the modeling process, 75% of the data was used for training, and 25% of the data was used for testing. To reduce the uncertainty of the MaxEnt model, 20 repeated runs of cross-validation were used to construct the model (Maximum iterations: 5000, Max number of background points: 10000), The performance of the model is usually evaluated using the Area Under the ROC curve (AUC) of the Receiver Operating Characteristic (ROC) (Fielding and Bell, 1997; Elith et al., 2006). The accuracy of the model simulation results is proportional to the AUC value. The AUC value ranges from 0 to 1, with higher values indicating higher accuracy of model predictions. The relative contribution of each environmental variable was assessed using the Jackknife test (Phillips et al., 2017). To further evaluate the model performance, True Skill Statistics (TSS) (Allouche et al., 2006) and Kappa (Freeman and Moisen, 2008) were calculated using the R package PresenceAbsence. When the TSS and Kappa values were above 0.85, the model performance was excellent; when they were below 0.55, the model performance was poor (Monserud and Leemans, 1992). Finally, we used the Fixed cumulative value 10 Logistic threshold of 0.0912 to establish 4 suitability levels for C. chrysosperma habitats: 0–0.0912 as unsuitable, 0.0912–0.3941 as low suitability, 0.3941–0.6971 as medium suitability, and 0.6971–1 as high suitability.
To analyze the impact of climate change on the geographic distribution of C. chrysosperma, a Raster to Polygon operation was performed in ArcGIS on the raster data of the suitable areas, and then the spatial analysis function was used to calculate the position of the centroid in suitable areas under different scenarios.
3 Results
3.1 Model evaluation and significant environmental variables
The average AUC of the final model’s 20 repeated runs is 0.971, with a standard deviation of 0.0019, as shown in Figure 3. The values of TSS and Kappa are 0.879 and 0.913, respectively, and these indicate that the model performs excellently, with good performance and high prediction accuracy (Swets, 1988; Fielding and Bell, 1997).
Figure 3
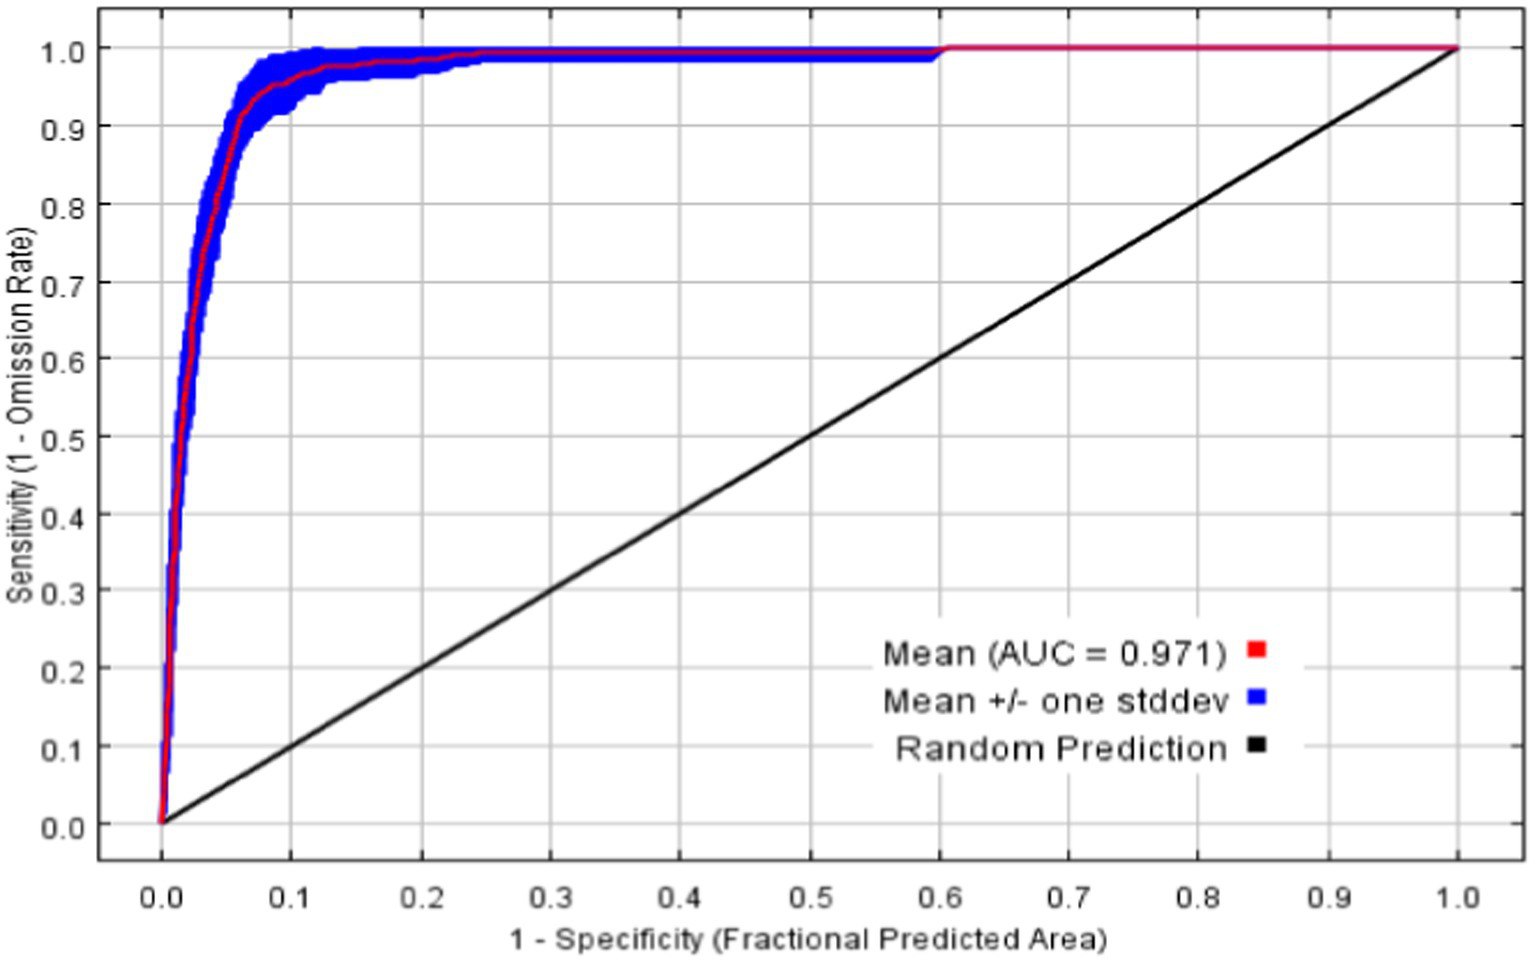
ROC curves and AUC averages for MaxEnt with 20 repeated runs.
Through the model output results, the percent contribution and permutation importance based on the Jackknife regularized training, and the single-factor response curves are obtained (refer to Table 2; Figures 4, 5). From the Percent contribution and Permutation importance in Table 2 and Figure 4, the percent contributions of bio15, aspectcosine, PETseasonality, and PETColdestQuarter are 30.3, 16, 13.1, and 11.4% respectively, with a total contribution reaching as high as 70.8%. The permutation importance of bio15, aspectcosine, PETseasonality, and PETColdestQuarter are 12.9, 0, 23, and 29.3% respectively, accumulating to 65.2%. This indicates that these four environmental factors are the dominant factors affecting the distribution of C. chrysosperma.
Table 2
| No | Variables | Percent contribution (%) | Permutation importance (%) | Suitable range |
|---|---|---|---|---|
| 1 | bio15 | 30.3 | 12.9 | <895.95 |
| 2 | Aspectcosine | 16 | 0 | all |
| 3 | PETseasonality | 13.1 | 23 | >0.94 × 10⁶ |
| 4 | PETColdestQuarter | 11.4 | 29.3 | 7882.52–14115.35 |
| 5 | scd | 7.9 | 0.7 | all |
| 6 | npp | 7.7 | 9 | <13758.64 |
| 7 | PETDriestQuarter | 6.5 | 5.1 | 5411.94–24679.73 |
| 8 | bio07 | 3.4 | 10.6 | <504.24 |
| 9 | AvgSoilSedimDeposThick | 2.6 | 3.7 | <73.03 |
| 10 | Elevation | 1 | 5.7 | <2814.53 |
Major environmental variables affecting the habitat suitability of C. chrysosperma.
Figure 4
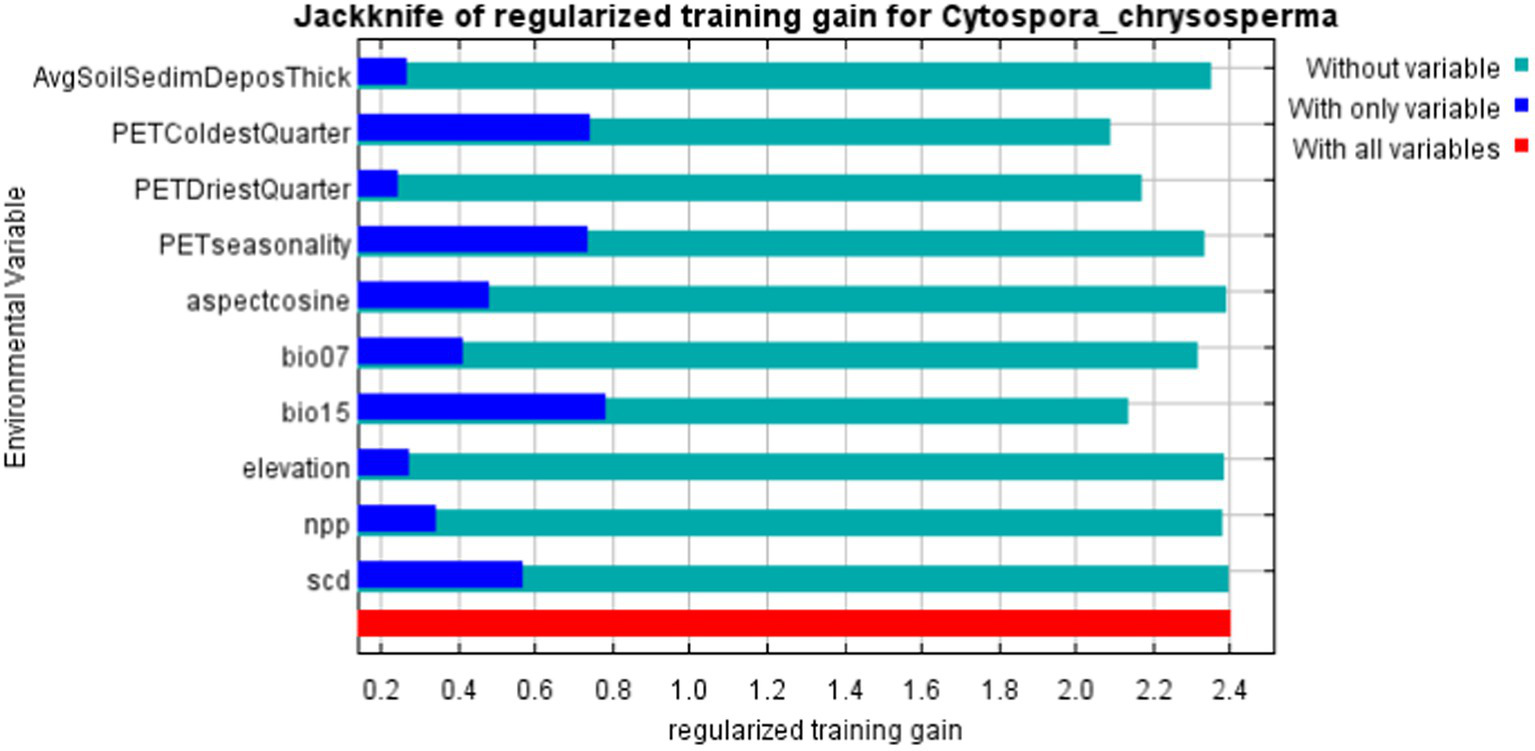
The importance of jackknife analysis of environmental variables.
Figure 5
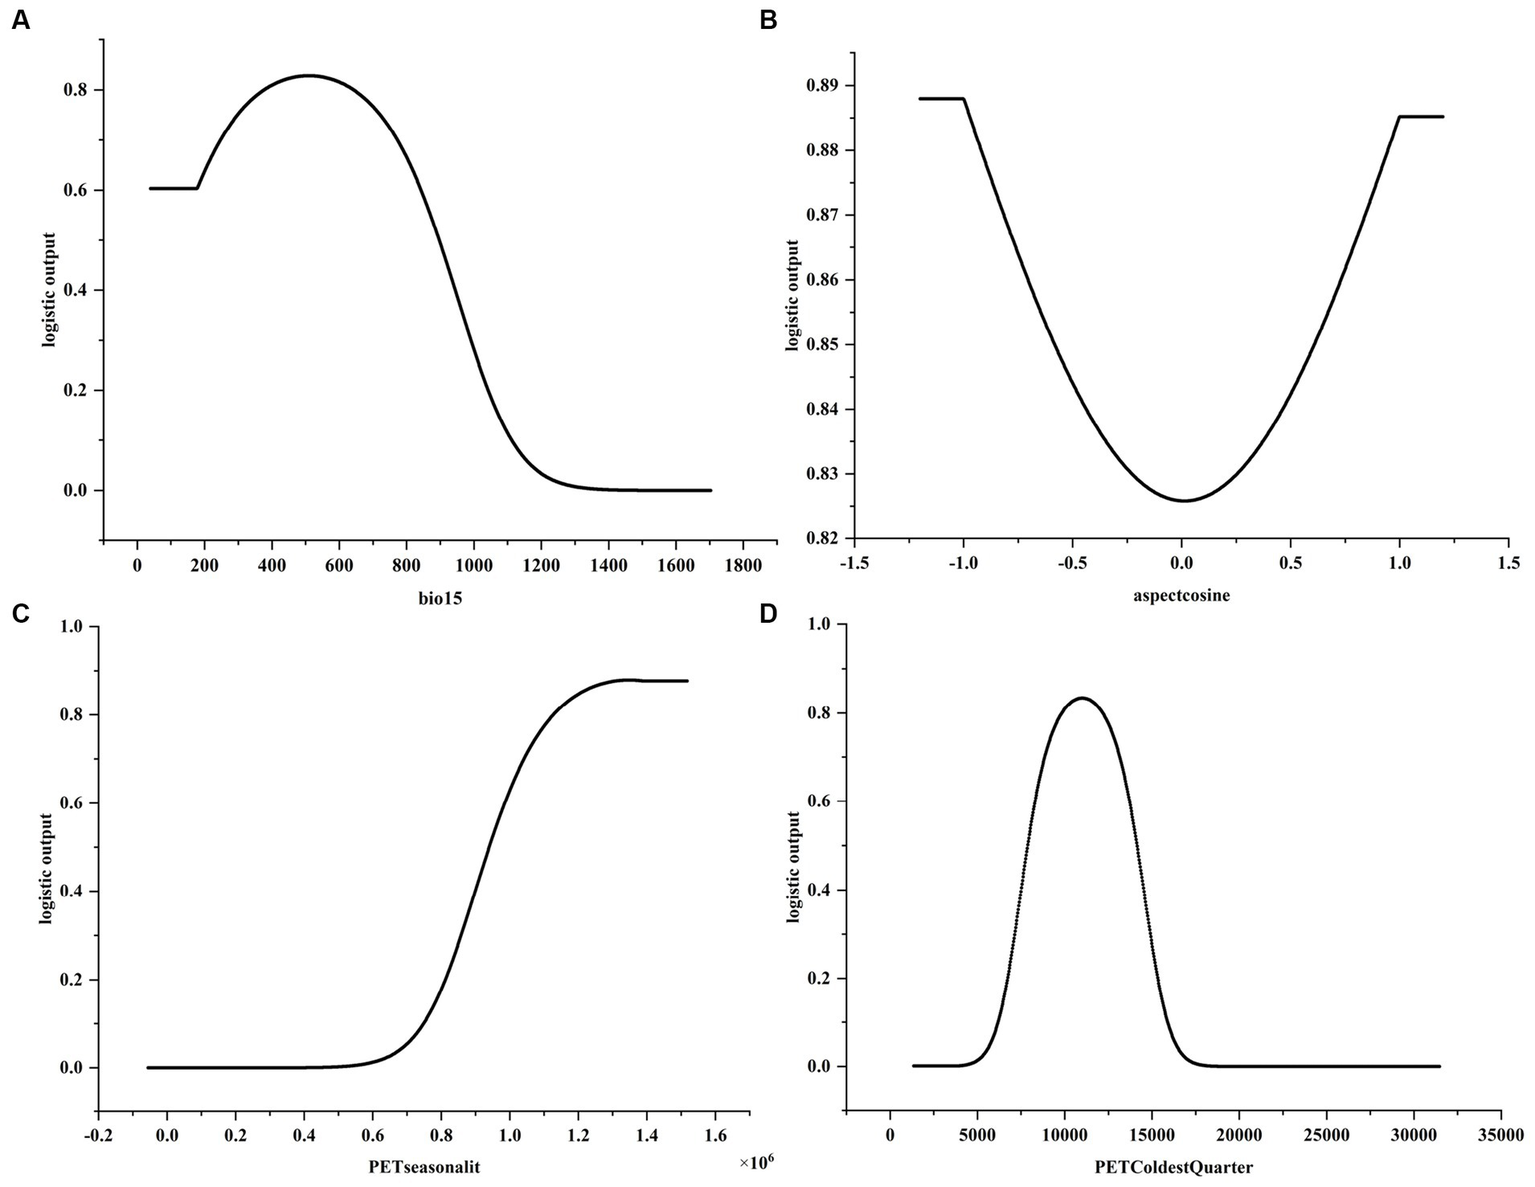
Response curve of the main environmental variables affecting the distribution of C.chrysosperma. (A) Response curves of bio15; (B) Response curves of aspectcosine; (C) Response curves of PETseasonality; (D) Response curves of PETColdestQuarter.
3.2 Response curve analysis of environmental variables
The response curves of the environmental variables were obtained by the single-factor modeling based on the four dominant environmental factors mentioned above. It is generally believed that when the probability of presence is greater than 0.5, the range of environmental factor values is beneficial to the distribution of species (Li et al., 2022). As can be seen from the single-factor response curve (Figure 5), the suitable value for bio15 is less than 895.95, for PETseasonality it is greater than 0.94 × 10⁶, and for PETColdestQuarter it is between 7882.52–14115.35. For bio15, the probability of C. chrysosperma’s presence first increases with the increase of bio15, then gradually decreases. When it is greater than 1,100, the probability of presence is close to 0. For aspectcosine, the probability of presence gradually decreases with the increase of aspectcosine, then increases, with the response bottom value at 0.0. The response curve for aspectcosine indicated that the range of aspect Cosine values specific to the study area could provide a uniquely suitable habitat for C. chrysosperma. The probability of presence and PETseasonality were positively correlated, and the probability of presence gradually increased with the increase of PETseasonality value. The response curve of PETColdestQuarter showed a general trend of increasing and then decreasing, and the probability of the presence of C. chrysosperma gradually increased as the value of PETColdestQuarter increased, with the response peaking at 10,000, then gradually decreasing, and ultimately approaching zero.
3.3 Potential distribution of Cytospora chrysosperma under current climate scenarios
According to the prediction results (Figure 6; Table 2), the suitable habitat of C. chrysosperma is concentrated in the northern part of Xinjiang and the oasis areas around the Tarim Basin in the southern Xinjiang, with a total suitable area of 82.36 × 10⁴ km2.
Figure 6
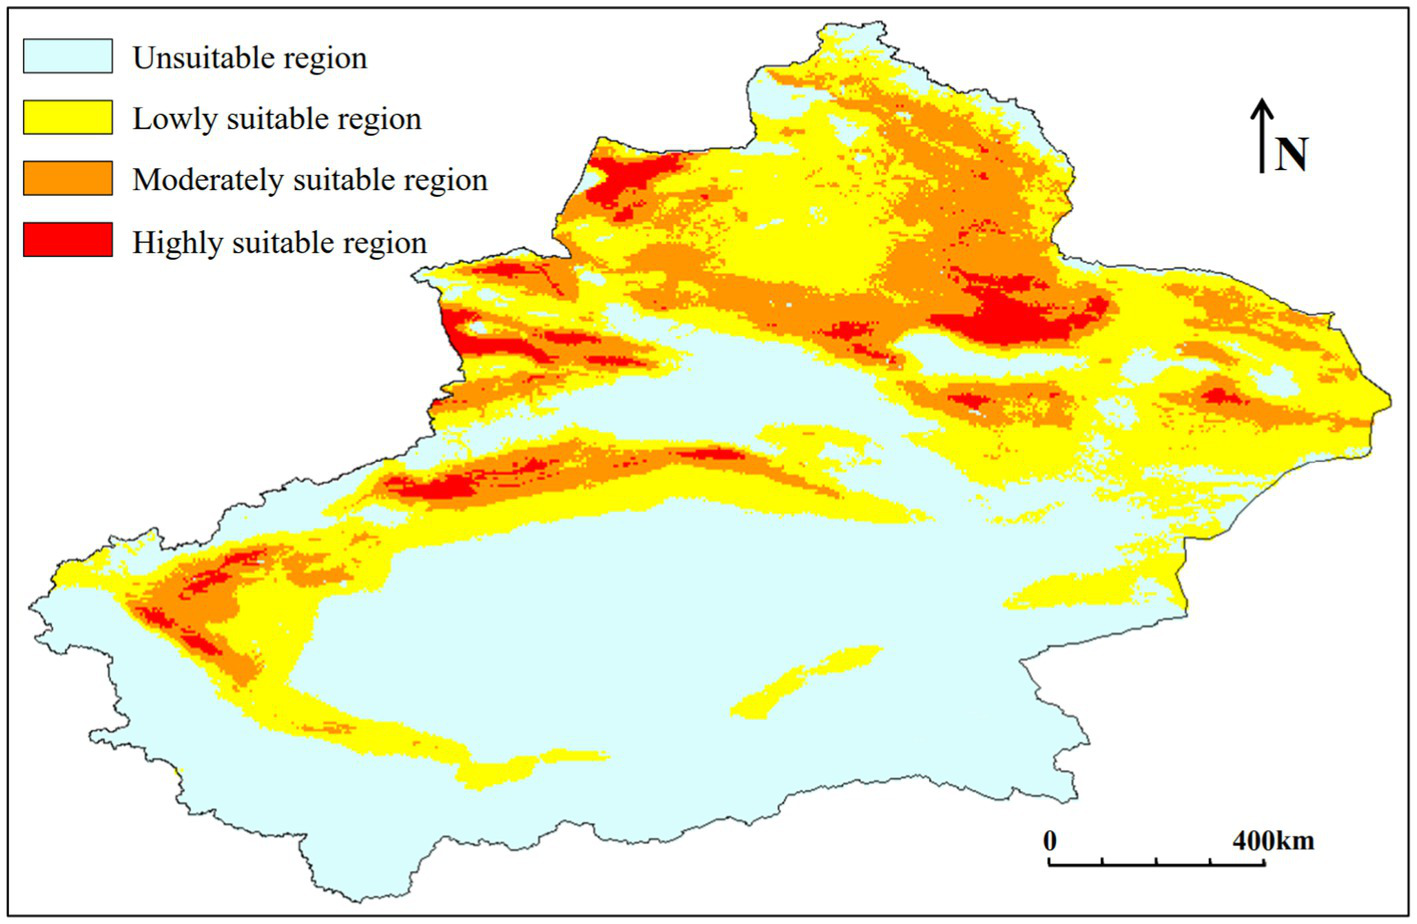
Potential suitable distribution of C. chrysosperma under the current climate scenarios.
The lowly suitable area is mainly distributed in the Tacheng, Turpan and Hami areas, as well as the oasis area around the Tarim Basin in southern Xinjiang. The area of lowly suitable area is 49.96 × 10⁴ km2, accounting for 60.66% of the total suitable area.
The moderately suitable area is mainly distributed in Altay, Tacheng and Changji areas in northern Xinjiang, and the oases around the Tarim Basin in Aksu and Kashgar. The area of moderately suitable area is 26.91 × 10⁴ km2, accounting for 32.67% of the total suitable area.
The highly suitable area is mainly distributed in the Ili, Tacheng, Changji regions of northern Xinjiang, as well as in parts of Aksu and Kashgar. The area of the highly suitable zone is 5.49 × 10⁴ km2, accounting for 6.67% of the total suitable area.
3.4 Potential distribution of Cytospora chrysosperma under future climate scenarios
Figure 7 and Table 3 show the future changes in the suitable habitat of C. chrysosperma. Between 2041 and 2070, under the three climate change scenarios of SSP1-RCP2.6, SSP3-RCP7, and SSP5-RCP8.5, the total suitable area increased to 88.93 × 10⁴ km2, 93.28 × 10⁴ km2, and 94.78 × 10⁴ km2, respectively. Between 2071 and 2,100, under the three climate change scenarios, the total suitable area increased to 87.78 × 10⁴ km2, 98.85 × 10⁴ km2, and 101.75 × 10⁴ km2, respectively. The area of low suitability only shows a growth trend under the SSP3-RCP7 scenario, increasing to 50.97 × 10⁴ km2 from 2041 through 2070, and to 52.19 × 10⁴ km2 in the period of 2071–2,100. The area of moderately suitable area and the area of highly suitable area showed a gradual increase under all three scenarios, and the area of highly suitable area had the highest rate of increase.
Figure 7
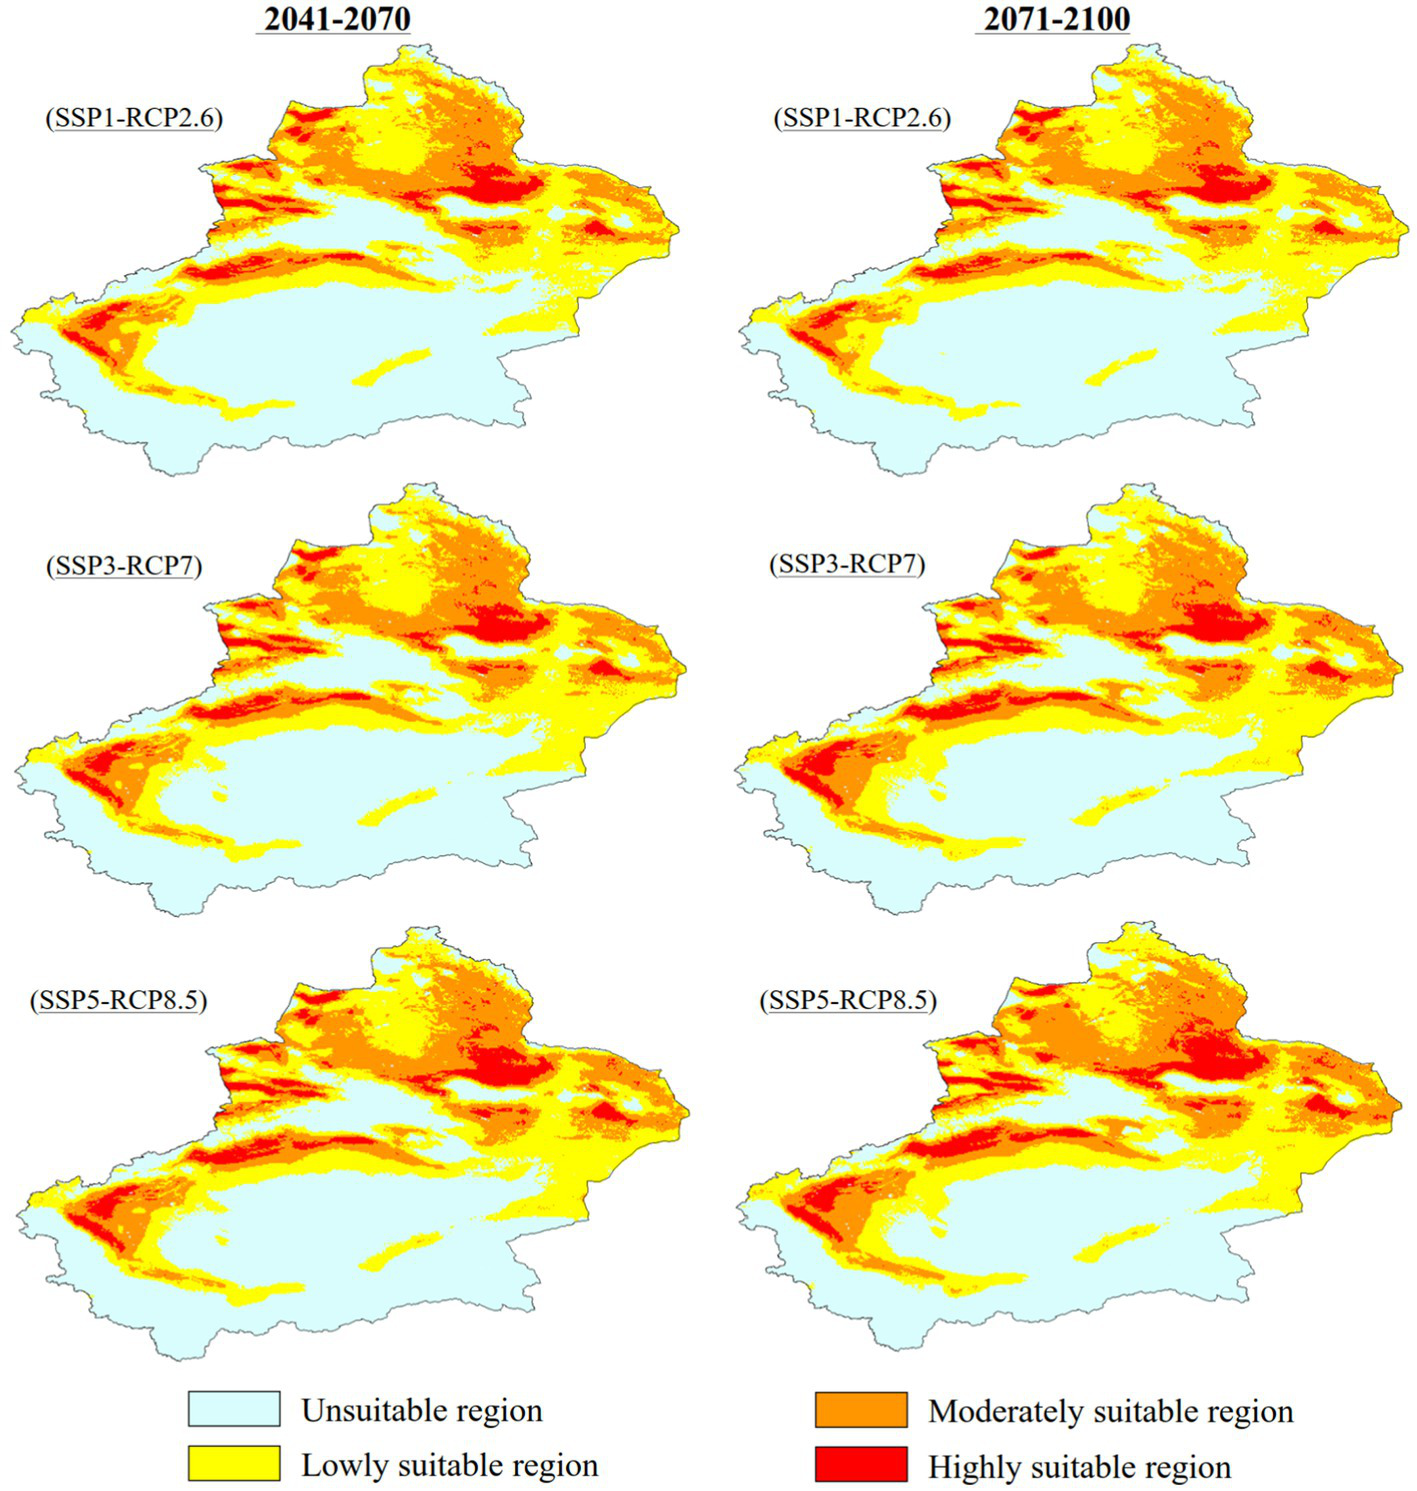
Potential suitable distribution of C. chrysosperma in different future periods.
Table 3
| Decades / Shared socio-economic pathways (SSPs) | Predicted area (×104 km2) and % of the corresponding current area | ||||||||
|---|---|---|---|---|---|---|---|---|---|
| Total suitable area | Lowly suitable area | Moderately suitable area | Highly suitable area | ||||||
| 1981–2010 | 82.36 | – | 49.96 | – | 26.91 | – | 5.49 | – | |
| SSP1-RCP2.6 | 2041–2070 | 88.93 | 107.98% | 48.88 | 97.83% | 32.21 | 119.71% | 7.84 | 142.80% |
| 2071–2100 | 87.78 | 106.58% | 49.26 | 98.60% | 31.07 | 115.46% | 7.45 | 135.64% | |
| SSP3-RCP7 | 2041–2070 | 93.28 | 113.26% | 50.97 | 102.02% | 33.77 | 125.51% | 8.54 | 155.49% |
| 2071–2100 | 98.85 | 120.02% | 52.19 | 104.47% | 36.05 | 133.97% | 10.60 | 193.16% | |
| SSP5-RCP8.5 | 2041–2070 | 94.78 | 115.08% | 48.99 | 98.06% | 35.54 | 132.07% | 10.25 | 186.67% |
| 2071–2100 | 101.75 | 123.54% | 49.67 | 99.41% | 39.29 | 146.02% | 12.79 | 233.02% | |
Predicted areas for the potential suitable regions of C. chrysosperma under different climate change scenarios (RCP2.6, RCP7, and RCP8.5) in the future.
Table 4 shows that there is an overall increasing trend in the area of suitable areas under the three climate change scenarios from the contemporary period to the 2041–2070 period and from the 2041–2070 period to the 2071–2,100 period. Gain area, with the largest increases of 14.49 × 10⁴ km2 and 8.74 × 10⁴ km2 under the SSP5-RCP8.5 scenario, respectively, and the smallest increases of 8.34 × 10⁴ km2 and 1.59 × 10⁴ km2 under the SSP5-RCP2.6 scenario, respectively. From the 2041–2070 period to the 2071–2,100 period, under the SSP5-RCP2.6 scenario, the area of loss is larger than the area of gain.
Table 4
| Period of change | SSPs | Gain area | Stable area | Loss area | |||
|---|---|---|---|---|---|---|---|
| (%) | (×104 km2) | (%) | (×104 km2) | (%) | (×104 km2) | ||
| (1981–2010)-(2041–2070) | SSP1-RCP2.6 | 10.13 | 8.34 | 97.98 | 80.70 | 0.13 | 0.11 |
| SSP3-RCP7 | 15.96 | 13.14 | 97.71 | 80.47 | 0.41 | 0.34 | |
| SSP5-RCP8.5 | 17.59 | 14.49 | 97.80 | 80.55 | 0.31 | 0.26 | |
| (2041–2070)-(2071–2,100) | SSP1-RCP2.6 | 1.79 | 1.59 | 98.81 | 87.87 | 1.89 | 1.68 |
| SSP3-RCP7 | 8.55 | 7.98 | 97.92 | 91.34 | 0.50 | 0.47 | |
| SSP5-RCP8.5 | 9.22 | 8.74 | 98.60 | 93.45 | 0.47 | 0.44 | |
Proportion of suitable regions gain, loss and stability of C. chrysosperma under different climate change scenarios in the future.
Proportion of area change = area of change in the suitable region / the area of the original suitable region * 100%.
Figure 8 shows changes in the geographic centroids of potentially suitable areas for C. chrysosperma under climate change. These centroids are located in Hejing County, Xinjiang, and close to Hutubi County in the north. Under the current climate scenario, the centroid of the potentially suitable area for C. chrysosperma in Xinjiang is located at 86.24°E/43.19°N. Under the SSP1, RCP2.6 scenario, it is projected to move southeastward by 13.89 km from the contemporary centroid by 2041–2070, and then eastward by 7.06 km by 2071–2,100. Under the SSP3, RCP7 scenario the centroid is located to the south of the contemporary centroid, moving southwards relative to the contemporary by 34.30 km by 2041–2070, and southwestwards by 23.91 km by 2071–2,100. Under the SSP5, RCP8.5 scenario, the centroid moves in much the same trend as under the SSP3, RCP7 scenario. It moves 36.58 km southwards relative to the contemporary period by 2041–2070 and 19.75 km south-westwards by 2071–2,100. Thus, the centroid of the extent of the potentially suitable area moves southwards under Representative Concentration Pathway in the future.
Figure 8
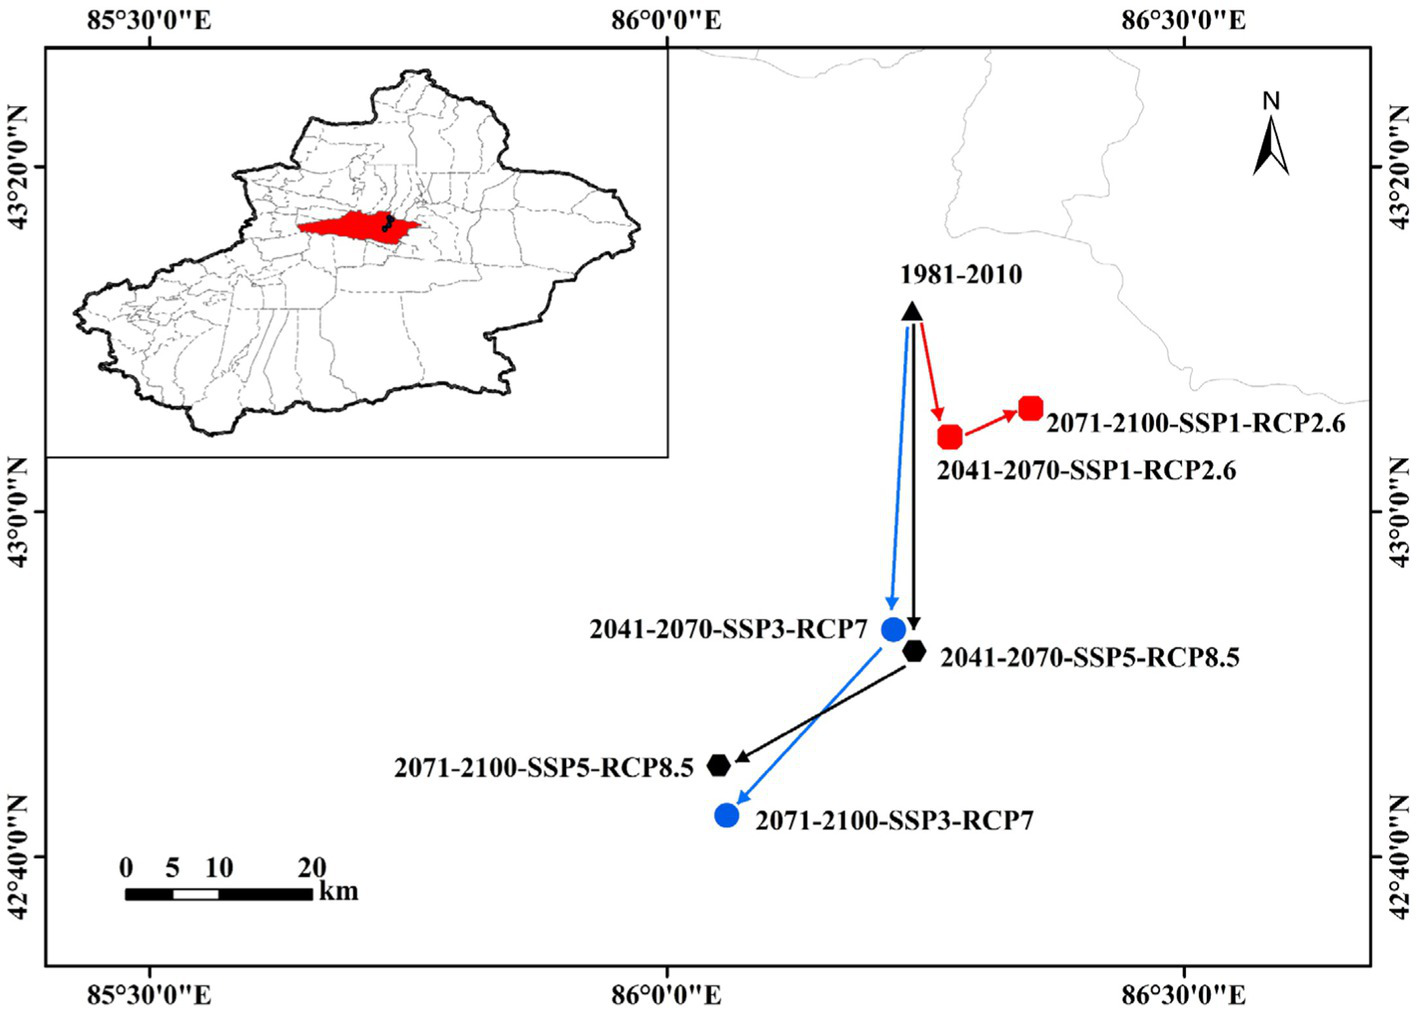
Transfer distance of the centroid of C. chrysosperma under three different climate scenarios (RCP2.6, RCP7, and RCP8.5) in the future.
4 Discussion
4.1 Selection of environmental variables and evaluation of modeling performance
Cytospora chrysosperma has a wide host range (Adams et al., 2006; Wang et al., 2015, 2020), and the cytospora canker caused by it has become one of the most important forest diseases in China, Japan, the United States, and Canada (Kobayashi, 1970; Dudley et al., 2015; Miller et al., 2021). The unique geographic and climatic characteristics of Xinjiang have led to the prevalence of cytospora canker, causing significant losses to the development of the forest and fruit industries. Therefore, studying the current distribution of C. chrysosperma and predicting its distribution under future climate change is crucial for forestry production management.
The MaxEnt model has become an important tool for conducting research in ecology, conservation biology, and evolutionary ecology (Guisan et al., 2013). In this study, the MaxEnt model was used to predict the potential distribution pattern of C. chrysosperma in Xinjiang under current and future climatic conditions. The most important environmental factors affecting C. chrysosperma in Xinjiang were precipitation seasonality, aspect cosine, PETseasonality, and PETColdestQuarter, as revealed by the Jackknife training gain, contribution, and single-factor response curves. Under the current climatic conditions, the AUC of the model was greater than 0.97, and the values of TSS and Kappa were both greater than 0.87, thus, our model is sufficient to simulate the potential suitable distribution of C. chrysosperma within the study area (Swets, 1988).
4.2 Response of the potential distribution to environmental variables
Environmental factors affect the geographical distribution, growth, development, and diversity of species (Austin, 2002), and future climate change will inevitably affect the distribution of host trees and C. chrysosperma, and these changes will bring new challenges to the control and prediction of forest diseases in Xinjiang. Poplars widely planted in northern China are susceptible to infection with cytospora canker caused by C. chrysosperma when they are damaged or weakened by frost, drought, sunburn, and pests (Yi and Chi, 2011), and Semerci et al. (2021) had similar findings in Turkiye. Lin et al. (2022) found that canker caused by Cytospora usually attacks weakened willows. Meteorological factors such as temperature, humidity, rainfall, sunshine, and air currents, as well as age, species, slope, soil, planting density, and stand maintenance and management techniques are all factors that cause tree weakness. Hanifeh et al. (2022) found that cytospora canker caused by eight species of Cytospora, including C. chrysosperma, is widespread in apple orchards throughout Iran, especially on old trees weakened by environmental stresses such as drought, frostbite, high temperatures, or nutrient deficiencies. Studies by Dudley et al. (2020) in the Midwestern United States and parts of the Rocky Mountains have shown that C. chrysosperma is more aggressive on poplar under drought stress, especially at cold temperatures, and have also found multiple Cytospora species co-occurring on the same host tree, with evidence of hybridization between species. Wang et al. (2016) reported that rainwater dissolves Cytospora species sporangia and disperses conidia within the canopy and that conidial populations can be released from the conidiophores throughout the year, which may occur even at low temperatures in winter. Lawrence et al. (2018) showed that under wet or humid conditions, Cytospora species conidia were dispersed to new plant tissues by rain spray and infected host plants. Bertrand and English (1976) showed that in California, after wind-driven rains, Cytospora conidia were dispersed over a large area of an orchard, with some spread distances can reach 76.8 m. The geographical distribution of species at the regional scale is largely governed by climate, with hydrothermal conditions playing a dominant role. Climate change alters processes such as nutrient cycling and energy and water fluxes, causing a range of ecosystem effects. Climate-related stressors reduce the ability of plants to resist diseases while increasing the risk of pathogen outbreaks (Kaczynski and Cooper, 2013).
Among the factors affecting the distribution of C. chrysosperma, precipitation-related factors had the highest contribution (precipitation seasonality), indicating that C. chrysosperma was more sensitive to changes in precipitation, followed by factors related to solar radiation aspect Cosine (Austin, 2002; Piedallu and Gégout, 2008), and factors related to water cycling and energy balance potential evapotranspiration (Metzger et al., 2013; Tadese et al., 2020). Solar radiation plays an important role in the distribution, composition of ecosystems through the photosynthetic activity and contributes to parameters such as evapotranspiration, wind, etc. in the water balance (Piedallu and Gégout, 2008). Our model simulated the geographical distribution of C. chrysosperma under current and future climatic conditions, and the results showed that in the next two periods: the area of moderately suitable area, highly suitable area, and total suitable area of C. chrysosperma tended to increase. The centroid analysis results show that compared to the present, the future centroid moves in the direction of lower latitudes. Xinjiang is one of the most sensitive regions in response to global warming, and the climate in Xinjiang has experienced a significant transition from warm-humid to warm-dry since 1997, with a jump in temperature, an increase in potential evapotranspiration, and an intensification of extreme climatic events, resulting in a negative ecological effect (Yao et al., 2021). Simultaneously, the potential geographic distribution of species is not solely limited to climatic and topographic factors. Climate complexity involves not only temperature and precipitation but also influences solar radiation intensity and the soil carbon cycle. Moreover, biological factors such as competition and reproduction, human activities, and other non-biological factors also influence the occurrence of species (Blois et al., 2013).
4.3 Limitations in predicting the potential distribution
Climate change can have a direct impact on pathogens and host plants by altering pathogen evolution, host-pathogen interactions (Velásquez et al., 2018; Cheng et al., 2019; Desaint et al., 2021), leading to changes in pathogen and host ranges, and increasing the spread of plant diseases to new areas (Burdon and Zhan, 2020; Delgado-Baquerizo et al., 2020; Chaloner et al., 2021). Therefore, accurate predictions can be made in future studies by integrating the physiological and biochemical effects of the trees themselves, the interactions between host trees and pathogens, the interactions between pathogens, ecosystem changes, and anthropogenic factors to improve the accuracy of the models.
In this study, 47 environmental variables were used to assess the potential distribution of C. chrysosperma under current and future climate scenarios in Xinjiang region using MaxEnt. In addition to the environmental factors mentioned above, soil moisture content (Bloomberg, 1962), nutrient content of nitrogen, iron and other nutrients in host trees (Dudley et al., 2020), as well as tree age, tree species, and nursery management (Lin et al., 2022) may also influence the potential distribution of C. chrysosperma. Therefore, more consideration needs to be given to factors regarding soil texture, tree growth characteristics, etc. in future studies.
In addition, after being released in the field, fungal spores are spread over long distances by wind (Grinn-Gofroń et al., 2016; Golan and Pringle, 2017; Lagomarsino Oneto et al., 2020). Transportation of fungal spores can occur over distances of various orders of magnitude (Galbán et al., 2021), and long-distance transport of spores can be manifested as a gradual expansion of pathogen populations (Aylor, 2003; Grinn-Gofroń et al., 2016). It has become a trend to study the spatial and temporal distribution characteristics of pathogen spores moving across regions based on meteorological data, and models such as HYSPLIT, FLEXPART, etc. are available for predicting the long-distance propagation and dispersal of fungal spores with the atmospheric circulation (Fernández-Rodríguez et al., 2015; Wang et al., 2021; Grewling et al., 2022; Li et al., 2023). We propose to combine studies on the distribution of suitable areas for C. chrysosperma with studies on the spread of pathogen spores, which could provide more comprehensive data for prediction and control of cytospora canker.
5 Conclusion
In this study, we predicted the potential habitat and distribution pattern of C. chrysosperma under three different climate scenarios in the present and two future periods based on the optimized MaxEnt model with the Kuenm package. (1) Under current climatic conditions, the potentially suitable area for C. chrysosperma is 82.36 × 10⁴ km2, which accounts for 49.61% of the total area of Xinjiang, primarily distributed in the northern regions of Xinjiang and the peripheral oasis areas surrounding the Tarim Basin, (2) precipitation seasonality, aspect Cosine, monthly variability in potential evapotranspiration, and mean monthly potential evapotranspiration of coldest quarter, were the dominant factors affecting the potential distribution of C. chrysosperma, and (3) The total suitable area for C. chrysosperma increased to varying degrees under different representative emission concentration pathways in the next two periods, with the greatest amplification, especially under the SSP5-RCP8.5 emission scenario. In terms of centroid transfer, with future climate change, the centroid of C. chrysosperma spreads from high latitudes to lower latitudes in the south. This study can provide a useful reference for the research on the prediction of the potential outbreak risk of cytospora canker in Xinjiang.
Statements
Data availability statement
The original contributions presented in the study are included in the article/Supplementary material, further inquiries can be directed to the corresponding authors.
Author contributions
QL: Writing – original draft, Conceptualization, Data curation, Methodology, Visualization. SC: Data curation, Methodology, Software, Writing – review & editing. WS: Conceptualization, Project administration, Resources, Writing – review & editing, Supervision. ZZ: Data curation, Formal analysis, Investigation, Validation, Writing – review & editing.
Funding
The author(s) declare financial support was received for the research, authorship, and/or publication of this article. This study was financially supported by the National Natural Science Foundation of China (No. 32060321), Special Project for the Creation of an Environment (Talents and Bases)—Construction of Science and Technology Innovation Bases (Construction of Resource Sharing Platform) of Xinjiang Province, China (No. PT2012).
Conflict of interest
The authors declare that the research was conducted in the absence of any commercial or financial relationships that could be construed as a potential conflict of interest.
Publisher’s note
All claims expressed in this article are solely those of the authors and do not necessarily represent those of their affiliated organizations, or those of the publisher, the editors and the reviewers. Any product that may be evaluated in this article, or claim that may be made by its manufacturer, is not guaranteed or endorsed by the publisher.
Supplementary material
The Supplementary material for this article can be found online at: https://www.frontiersin.org/articles/10.3389/ffgc.2024.1370365/full#supplementary-material
Footnotes
References
1
Adams G. C. Roux J. Wingfield M. J. (2006). Cytospora species (Ascomycota, Diaporthales, Valsaceae): introduced and native pathogens of trees in South Africa. Austral. Plant Pathol.35:521. doi: 10.1071/AP06058
2
Adams G. C. Surve-Iyer R. S. Iezzoni A. F. (2002). Ribosomal DNA sequence divergence and group I introns within the Leucostoma species L. cinctum, L. persoonii, and L. parapersoonii sp. nov., ascomycetes that cause Cytospora canker of fruit trees. Mycologia94, 947–967. doi: 10.1080/15572536.2003.11833153
3
Akpoti K. Kabo-bah A. T. Dossou-Yovo E. R. Groen T. A. Zwart S. J. (2020). Mapping suitability for rice production in inland valley landscapes in Benin and Togo using environmental niche modeling. Sci. Total Environ.709:136165. doi: 10.1016/j.scitotenv.2019.136165
4
Allen C. D. Macalady A. K. Chenchouni H. Bachelet D. McDowell N. Vennetier M. et al . (2010). A global overview of drought and heat-induced tree mortality reveals emerging climate change risks for forests. For. Ecol. Manage.259, 660–684. doi: 10.1016/j.foreco.2009.09.001
5
Allouche O. Tsoar A. Kadmon R. (2006). Assessing the accuracy of species distribution models: prevalence, kappa and the true skill statistic (TSS). J. Appl. Ecol.43, 1223–1232. doi: 10.1111/j.1365-2664.2006.01214.x
6
Amatulli G. Domisch S. Tuanmu M.-N. Parmentier B. Ranipeta A. Malczyk J. et al . (2018). A suite of global, cross-scale topographic variables for environmental and biodiversity modeling. Sci. Data5:180040. doi: 10.1038/sdata.2018.40
7
Anderson P. K. Cunningham A. A. Patel N. G. Morales F. J. Epstein P. R. Daszak P. (2004). Emerging infectious diseases of plants: pathogen pollution, climate change and agrotechnology drivers. Trends Ecol. Evol.19, 535–544. doi: 10.1016/j.tree.2004.07.021
8
Arenas-Castro S. Gonçalves J. F. Moreno M. Villar R. (2020). Projected climate changes are expected to decrease the suitability and production of olive varieties in southern Spain. Sci. Total Environ.709:136161. doi: 10.1016/j.scitotenv.2019.136161
9
Austin M. P. (2002). Spatial prediction of species distribution: an interface between ecological theory and statistical modelling. Ecol. Model.157, 101–118. doi: 10.1016/S0304-3800(02)00205-3
10
Aylor D. E. (2003). Spread of plant disease on a continental scale: role of aerial dispersal of pathogens. Ecology84, 1989–1997. doi: 10.1890/01-0619
11
Bertrand P. English H. (1976). Release and dispersal of conidia and ascospores of valsa leucostoma. Phytopathology66:987.
12
Blois J. L. Zarnetske P. L. Fitzpatrick M. C. Finnegan S. (2013). Climate change and the past, present, and future of biotic interactions. Science341, 499–504. doi: 10.1126/science.1237184
13
Bloomberg W. J. (1962). CYTOSPORA canker of poplars: factors influencing the development of the disease. Can. J. Bot.40, 1271–1280. doi: 10.1139/b62-120
14
Bosso L. Luchi N. Maresi G. Cristinzio G. Smeraldo S. Russo D. (2017). Predicting current and future disease outbreaks of Diplodia sapinea shoot blight in Italy: species distribution models as a tool for forest management planning. For. Ecol. Manag.400, 655–664. doi: 10.1016/j.foreco.2017.06.044
15
Breshears D. D. Carroll C. J. W. Redmond M. D. Wion A. P. Allen C. D. Cobb N. S. et al . (2018). A dirty dozen ways to die: metrics and modifiers of mortality driven by drought and warming for a tree species. Front. For. Glob. Change1:4. doi: 10.3389/ffgc.2018.00004
16
Burdon J. J. Zhan J. (2020). Climate change and disease in plant communities. PLoS Biol.18:e3000949. doi: 10.1371/journal.pbio.3000949
17
Cavers S. Cottrell J. E. (2015). The basis of resilience in forest tree species and its use in adaptive forest management in Britain. Forestry88, 13–26. doi: 10.1093/forestry/cpu027
18
Chaloner T. M. Gurr S. J. Bebber D. P. (2021). Plant pathogen infection risk tracks global crop yields under climate change. Nat. Clim. Chang.11, 710–715. doi: 10.1038/s41558-021-01104-8
19
Cheng Y. T. Zhang L. He S. Y. (2019). Plant-microbe interactions facing environmental challenge. Cell Host Microbe26, 183–192. doi: 10.1016/j.chom.2019.07.009
20
Cobb R. C. Ruthrof K. X. Breshears D. D. Lloret F. Aakala T. Adams H. D. et al . (2017). Ecosystem dynamics and management after forest die-off: a global synthesis with conceptual state-and-transition models. Ecosphere8:e02034. doi: 10.1002/ecs2.2034
21
Cobos M. E. Peterson A. T. Barve N. Osorio-Olvera L. (2019). Kuenm: an R package for detailed development of ecological niche models using Maxent. PeerJ7:e6281. doi: 10.7717/peerj.6281
22
Delgado-Baquerizo M. Guerra C. A. Cano-Díaz C. Egidi E. Wang J.-T. Eisenhauer N. et al . (2020). The proportion of soil-borne pathogens increases with warming at the global scale. Nat. Clim. Chang.10, 550–554. doi: 10.1038/s41558-020-0759-3
23
Desaint H. Aoun N. Deslandes L. Vailleau F. Roux F. Berthomé R. (2021). Fight hard or die trying: when plants face pathogens under heat stress. New Phytol.229, 712–734. doi: 10.1111/nph.16965
24
Dudley M. M. Burns K. S. Jacobi W. R. (2015). Aspen mortality in the Colorado and southern Wyoming Rocky Mountains: extent, severity, and causal factors. For. Ecol. Manag.353, 240–259. doi: 10.1016/j.foreco.2015.06.002
25
Dudley M. M. Tisserat N. A. Jacobi W. R. Negrón J. Stewart J. E. (2020). Pathogenicity and distribution of two species of Cytospora on Populus tremuloides in portions of the Rocky Mountains and Midwest in the United States. For. Ecol. Manag.468:118168. doi: 10.1016/j.foreco.2020.118168
26
Duque-Lazo J. Navarro-Cerrillo R. M. van Gils H. Groen T. A. (2018). Forecasting oak decline caused by Phytophthora cinnamomi in Andalusia: identification of priority areas for intervention. For. Ecol. Manag.417, 122–136. doi: 10.1016/j.foreco.2018.02.045
27
Elith J. Graham C. Anderson R. Dudík M. Ferrier S. Guisan A. et al . (2006). Novel methods improve prediction of species’ distributions from occurrence data. Ecography29, 129–151. doi: 10.1111/j.2006.0906-7590.04596.x
28
Fan Z. Zhou B. Ma C. Gao C. Han D. Chai Y. (2022). Impacts of climate change on species distribution patterns of Polyspora sweet in China. Ecol. Evol.12:e9516. doi: 10.1002/ece3.9516
29
Fernández-Rodríguez S. Sadyś M. Smith M. Tormo-Molina R. Skjøth C. A. Maya-Manzano J. M. et al . (2015). Potential sources of airborne Alternaria spp. spores in south-West Spain. Sci. Total Environ.533, 165–176. doi: 10.1016/j.scitotenv.2015.06.031
30
Fielding A. H. Bell J. F. (1997). A review of methods for the assessment of prediction errors in conservation presence/absence models. Environ. Conserv.24, 38–49. doi: 10.1017/S0376892997000088
31
Freeman E. A. Moisen G. G. (2008). A comparison of the performance of threshold criteria for binary classification in terms of predicted prevalence and kappa. Ecol. Model.217, 48–58. doi: 10.1016/j.ecolmodel.2008.05.015
32
Galbán S. Justel A. González S. Quesada A. (2021). Local meteorological conditions, shape and desiccation influence dispersal capabilities for airborne microorganisms. Sci. Total Environ.780:146653. doi: 10.1016/j.scitotenv.2021.146653
33
Godefroid M. Meurisse N. Groenen F. Kerdelhué C. Rossi J.-P. (2020). Current and future distribution of the invasive oak processionary moth. Biol. Invasions22, 523–534. doi: 10.1007/s10530-019-02108-4
34
Golan J. J. Pringle A. (2017). Long-distance dispersal of fungi. Microbiol. Spectr.5:4. doi: 10.1128/microbiolspec.funk-0047-2016
35
Grewling Ł. Magyar D. Chłopek K. Grinn-Gofroń A. Gwiazdowska J. Siddiquee A. et al . (2022). Bioaerosols on the atmospheric super highway: An example of long distance transport of Alternaria spores from the Pannonian plain to Poland. Sci. Total Environ.819:153148. doi: 10.1016/j.scitotenv.2022.153148
36
Grinn-Gofroń A. Sadyś M. Kaczmarek J. Bednarz A. Pawłowska S. Jedryczka M. (2016). Back-trajectory modelling and DNA-based species-specific detection methods allow tracking of fungal spore transport in air masses. Sci. Total Environ.571, 658–669. doi: 10.1016/j.scitotenv.2016.07.034
37
Guan X. Ma Y. Lu H. Jiang Y. Pang L. Zheng X. et al . (2022). Topographic and climatic controls on decadal-scale catchment-basin erosion rates in the northern Chinese Tian Shan. Catena210:105862. doi: 10.1016/j.catena.2021.105862
38
Guisan A. Tingley R. Baumgartner J. B. Naujokaitis-Lewis I. Sutcliffe P. R. Tulloch A. I. T. et al . (2013). Predicting species distributions for conservation decisions. Ecol. Lett.16, 1424–1435. doi: 10.1111/ele.12189
39
Guo Q. Kelly M. Graham C. H. (2005). Support vector machines for predicting distribution of sudden oak death in California. Ecol. Model.182, 75–90. doi: 10.1016/j.ecolmodel.2004.07.012
40
Guo K. Zhao S. Wu C. Ainiguli Y. (2018). Pathogen identification of dominant tree canker from farmland shelterbelts in South Xinjiang. For. Pest Dis.37, 22–25.
41
Hanifeh S. Zafari D. Soleimani M.-J. Arzanlou M. (2022). Multigene phylogeny, morphology, and pathogenicity trials reveal novel Cytospora species involved in perennial canker disease of apple trees in Iran. Fungal Biol.126, 707–726. doi: 10.1016/j.funbio.2022.08.009
42
He T. Cai G. Jia H. Zhai Y. Ma R. (2022). Distribution characteristics of Cytospora spp. in Xinjiang. Xinjiang Agri. Sci.59, 2696–2706. doi: 10.6048/j.issn.1001-4330.2022.11.013
43
Hernandez P. A. Graham C. H. Master L. L. Albert D. L. (2006). The effect of sample size and species characteristics on performance of different species distribution modeling methods. Ecography29, 773–785. doi: 10.1111/j.0906-7590.2006.04700.x
44
Jactel H. Petit J. Desprez-Loustau M.-L. Delzon S. Piou D. Battisti A. et al . (2012). Drought effects on damage by forest insects and pathogens: a meta-analysis. Glob. Chang. Biol.18, 267–276. doi: 10.1111/j.1365-2486.2011.02512.x
45
Jiang H. Cao C. Chen W. Dang Y. Wang X. Wang W. (2017). Spatio-temporal analysis of potential SOD outbreak risks area in the US west coast based on Maxent model. World For. Res.30, 68–72. doi: 10.13348/j.cnki.sjlyyj.2017.0040.y
46
Kaczynski K. M. Cooper D. J. (2013). Susceptibility of Salix monticola to Cytospora canker under increased temperatures and decreased water levels. For. Ecol. Manag.305, 223–228. doi: 10.1016/j.foreco.2013.06.002
47
Karger D. N. Conrad O. Böhner J. Kawohl T. Kreft H. Soria-Auza R. W. et al . (2017). Climatologies at high resolution for the earth’s land surface areas. Sci. Data4:170122. doi: 10.1038/sdata.2017.122
48
Karger D. N. Conrad O. Böhner J. Kawohl T. Kreft H. Soria-Auza R. W. et al . (2021). CHELSA V2.1 (current). doi: 10.16904/ENVIDAT.228.V2.1.
49
Kobayashi T. (1970). Taxonomic studies of Japanese Diaporthaceae with special reference to their life-histories. Bull. Govern. For. Exp. Stat.1970, 226–242.
50
Lagomarsino Oneto D. Golan J. Mazzino A. Pringle A. Seminara A. (2020). Timing of fungal spore release dictates survival during atmospheric transport. Proc. Natl. Acad. Sci. USA117, 5134–5143. doi: 10.1073/pnas.1913752117
51
Lawrence D. P. Holland L. A. Nouri M. T. Travadon R. Abramians A. Michailides T. J. et al . (2018). Molecular phylogeny of Cytospora species associated with canker diseases of fruit and nut crops in California, with the descriptions of ten new species and one new combination. IMA Fungus9, 333–369. doi: 10.5598/imafungus.2018.09.02.07
52
Li Y. Dai J. Zhang T. Wang B. Zhang S. Wang C. et al . (2023). Genomic analysis, trajectory tracking, and field surveys reveal sources and long-distance dispersal routes of wheat stripe rust pathogen in China. Plant Commun.4:100563. doi: 10.1016/j.xplc.2023.100563
53
Li Q. Wang X. Yan K. Liang Z. Xia P. (2022). Based on multiple environmental factors to explore the habitat distribution of licorice (Glycyrrhiza uralensis) in different time and space. Biochem. Syst. Ecol.105:104490. doi: 10.1016/j.bse.2022.104490
54
Lin L. Pan M. Tian C. Fan X. (2022). Fungal richness of Cytospora species associated with willow canker disease in China. J. Fungi.8:377. doi: 10.3390/jof8040377
55
Liu J. Dong Y. Li Y. Jiang N. Zhu T. Li Z. et al . (2020). Identification of causal agent of apple, walnut and poplar Valsa canker disease in partial areas of Xinjiang. Acta Pharmacol. Sin.50, 265–275. doi: 10.13926/j.cnki.apps.000461
56
Metzger M. J. Bunce R. G. H. Jongman R. H. G. Sayre R. Trabucco A. Zomer R. (2013). A high-resolution bioclimate map of the world: a unifying framework for global biodiversity research and monitoring. Glob. Ecol. Biogeogr.22, 630–638. doi: 10.1111/geb.12022
57
Miller S. T. Sterle D. Minas I. S. Stewart J. E. (2021). Exploring fungicides and sealants for management of Cytospora plurivora infections in western Colorado peach production systems. Crop Prot.146:105654. doi: 10.1016/j.cropro.2021.105654
58
Monserud R. A. Leemans R. (1992). Comparing global vegetation maps with the kappa statistic. Ecol. Model.62, 275–293. doi: 10.1016/0304-3800(92)90003-W
59
Morales N. S. Fernández I. C. Baca-González V. (2017). MaxEnt’s parameter configuration and small samples: are we paying attention to recommendations? A systematic review. PeerJ5:e3093. doi: 10.7717/peerj.3093
60
Moritz C. Agudo R. (2013). The future of species under climate change: resilience or decline?Science341, 504–508. doi: 10.1126/science.1237190
61
Pan M. Zhu H. Tian C. Huang M. Fan X. (2021). Assessment of Cytospora isolates from conifer cankers in China, with the descriptions of four new Cytospora species. Front. Plant Sci.12:636460. doi: 10.3389/fpls.2021.636460
62
Pautasso M. Döring T. F. Garbelotto M. Pellis L. Jeger M. J. (2012). Impacts of climate change on plant diseases—opinions and trends. Eur. J. Plant Pathol.133, 295–313. doi: 10.1007/s10658-012-9936-1
63
Pelletier J. D. Broxton P. D. Hazenberg P. Zeng X. Troch P. A. Niu G. et al . (2016). Global 1-km gridded thickness of soil, Regolith, and sedimentary deposit layersDAACTullamarine
64
Phillips S. J. Anderson R. P. Dudík M. Schapire R. E. Blair M. E. (2017). Opening the black box: an open-source release of Maxent. Ecography40, 887–893. doi: 10.1111/ecog.03049
65
Phillips S. J. Anderson R. P. Schapire R. E. (2006). Maximum entropy modeling of species geographic distributions. Ecol. Model.190, 231–259. doi: 10.1016/j.ecolmodel.2005.03.026
66
Piedallu C. Gégout J. (2008). Efficient assessment of topographic solar radiation to improve plant distribution models. Agric. For. Meteorol.148, 1696–1706. doi: 10.1016/j.agrformet.2008.06.001
67
Semerci A. Guevara C. A. Gonzalez-Benecke C. A. (2021). Water availability effects on growth and phenology of 11 poplar cultivars growing in semiarid areas in Turkey. New For. (Dordr)52, 411–430. doi: 10.1007/s11056-020-09802-5
68
Sobek-Swant S. Kluza D. A. Cuddington K. Lyons D. B. (2012). Potential distribution of emerald ash borer: what can we learn from ecological niche models using Maxent and GARP?For. Ecol. Manag.281, 23–31. doi: 10.1016/j.foreco.2012.06.017
69
Sturrock R. N. Frankel S. J. Brown A. V. Hennon P. E. Kliejunas J. T. Lewis K. J. et al . (2011). Climate change and forest diseases. Plant Pathol.60, 133–149. doi: 10.1111/j.1365-3059.2010.02406.x
70
Swets J. A. (1988). Measuring the accuracy of diagnostic systems. Science240, 1285–1293. doi: 10.1126/science.3287615
71
Tadese M. Kumar L. Koech R. (2020). Long-term variability in potential evapotranspiration, water availability and drought under climate change scenarios in the Awash River basin, Ethiopia. Atmosphere11:883. doi: 10.3390/atmos11090883
72
Tang J. Zhang W. Li Y. Guo Z. Wang Y. Wang Y. et al . (2015). Korla pear tree biological characteristics of the Valsa canker growth pathogen and its pathogenicity. Xinjiang Agri. Sci.52, 252–257.
73
Title P. O. Bemmels J. B. (2018). ENVIREM: an expanded set of bioclimatic and topographic variables increases flexibility and improves performance of ecological niche modeling. Ecography41, 291–307. doi: 10.1111/ecog.02880
74
Velásquez A. C. Castroverde C. D. M. He S. Y. (2018). Plant–pathogen warfare under changing climate conditions. Curr. Biol.28, R619–R634. doi: 10.1016/j.cub.2018.03.054
75
Wang S. Hu T. Wang Y. Luo Y. Michailides T. J. Cao K. (2016). New understanding on infection processes of Valsa canker of apple in China. Eur. J. Plant Pathol.146, 531–540. doi: 10.1007/s10658-016-0937-3
76
Wang M. Kriticos D. J. Ota N. Brooks A. Paini D. (2021). A general trait-based modelling framework for revealing patterns of airborne fungal dispersal threats to agriculture and native flora. New Phytol.232, 1506–1518. doi: 10.1111/nph.17659
77
Wang Y.-L. Lu Q. Decock C. Li Y.-X. Zhang X.-Y. (2015). Cytospora species from populus and Salix in China with C. Davidiana sp. nov.Fungal. Biol.119, 420–432. doi: 10.1016/j.funbio.2015.01.005
78
Wang X. Shi C.-M. Gleason M. L. Huang L. (2020). Fungal species associated with apple Valsa canker in East Asia. Phytopathol. Res.2:35. doi: 10.1186/s42483-020-00076-5
79
Wei Y. Zhang L. Wang J. Wang W. Niyati N. Guo Y. et al . (2021). Chinese caterpillar fungus (Ophiocordyceps sinensis) in China: current distribution, trading, and futures under climate change and overexploitation. Sci. Total Environ.755:142548. doi: 10.1016/j.scitotenv.2020.142548
80
Wen J. Ma R. Wang D. Zhang P. (2022). Evaluation of resistance of Xinjiang wild walnuts to walnut canker. J. Fruit Sci.39, 1469–1478. doi: 10.13925/j.cnki.gsxb.20210569
81
Wisz M. S. Hijmans R. J. Li J. Peterson A. T. Graham C. H. Guisan A. et al . (2008). Effects of sample size on the performance of species distribution models. Divers. Distrib.14, 763–773. doi: 10.1111/j.1472-4642.2008.00482.x
82
Yao J. Mao W. Chen J. Dilinuer T. (2021). Signal and impact of wet-to-dry shift over Xinjiang, China. Acta Geogr. Sin.76, 57–72. doi: 10.11821/dlxb202101005
83
Yi H. W. Chi Y. J. (2011). Biocontrol of Cytospora canker of poplar in north-east China with Trichoderma longibrachiatum. For Pathol.41, 299–307. doi: 10.1111/j.1439-0329.2010.00704.x
84
Yu W. Wen J. Zhang Z. Chen X. Zhang Y. (2020). Spatio-temporal variations in the potential habitat of a pelagic commercial squid. J. Mar. Syst.206:103339. doi: 10.1016/j.jmarsys.2020.103339
85
Zhang Y. Liu L. Liu Y. Zhang M. An C. (2021). Response of altitudinal vegetation belts of the Tianshan Mountains in northwestern China to climate change during 1989–2015. Sci. Rep.11:4870. doi: 10.1038/s41598-021-84399-z
86
Zhang X. Zhao S. Piao C. Lv Q. Jia X. (1999). Molecular genetic diversity of pathogenic fungal group causing tree canker I.--evidence of taxa for Dothiorella, Dothichiza, Cytospora and Coniothyrium in molecular level. Sci. Silvae Sin.3, 36–42.
87
Zhao Y. Ma R. Yin Y. Zhang Z. Tian C. (2019). Diversity of Cytospora chrysosperma from different hosts in Xinjiang. Biodivers. Sci.27, 1122–1131. doi: 10.17520/biods.2019180
88
Zhu Z. Zhang W. Li Y. Yan H. Yi Z. (2019). Study on the cross infection of rot pathogens in different hosts of orchard in Xinjiang. Xinjiang Agri. Sci.56, 1112–1121. doi: 10.6048/j.issn.1001-4330.2019.06.014
Summary
Keywords
Cytospora chrysosperma , potential distribution, MaxEnt, environmental variables, ecological niche model
Citation
Li Q, Cao S, Sun W and Zhang Z (2024) Prediction of the potential geographical distribution of Cytospora chrysosperma in Xinjiang, China under climate change scenarios. Front. For. Glob. Change 7:1370365. doi: 10.3389/ffgc.2024.1370365
Received
26 January 2024
Accepted
01 April 2024
Published
17 April 2024
Volume
7 - 2024
Edited by
Aziz Ebrahimi, Purdue University, United States
Reviewed by
Mohsen Ahmadi, Isfahan University of Technology, Iran
Jane E. Stewart, Colorado State University, United States
Updates
Copyright
© 2024 Li, Cao, Sun and Zhang.
This is an open-access article distributed under the terms of the Creative Commons Attribution License (CC BY). The use, distribution or reproduction in other forums is permitted, provided the original author(s) and the copyright owner(s) are credited and that the original publication in this journal is cited, in accordance with accepted academic practice. No use, distribution or reproduction is permitted which does not comply with these terms.
*Correspondence: Wei Sun, sunwei02@caas.cn
Disclaimer
All claims expressed in this article are solely those of the authors and do not necessarily represent those of their affiliated organizations, or those of the publisher, the editors and the reviewers. Any product that may be evaluated in this article or claim that may be made by its manufacturer is not guaranteed or endorsed by the publisher.