Abstract
The stability of future carbon sinks is crucial for accurately predicting the global carbon cycle. However, the future dynamics and stability of carbon sinks remain largely unknown, especially in China, a significant global carbon sink region. Here, we examined the dynamics and stability of carbon sinks in China’s terrestrial ecosystems from 2015 to 2,100 under two CMIP6 scenarios (SSP245 and SSP585), using XGBoost and SHAP models to quantify the impact of climatic drivers on carbon sink stability. China’s future terrestrial ecosystems will act as a “carbon sink” (0.27–0.33 PgC/yr), with an initial increase that levels off over time. Although the carbon sink capacity increases, its stability does not consistently improve. Specifically, the stability of carbon sinks in future China’s terrestrial ecosystems transitions from strengthening to weakening, primarily occurring in areas with higher carbon sink capacity. Further analysis revealed that atmospheric vapor pressure deficit (VPD) and temperature (Tas) are the two primary factors influencing carbon sink stability, with significant differences in their impacts across different scenarios. Under the SSP245 scenario, variations in VPD (VPD.CV) regulate water availability through stomatal conductance, making it the key driver of changes in carbon sink stability. In contrast, under the SSP585 scenario, although VPD.CV still plays an important role, temperature variability (Tas.CV) becomes the dominant factor, with more frequent extreme climate events exacerbating carbon cycle instability. The study highlights the differences in driving factors of carbon sink stability under different scenarios and stresses the importance of considering these differences, along with the scale and stability of carbon sinks, when developing long-term carbon management policies to effectively support carbon neutrality goals.
1 Introduction
Since the Industrial Revolution, terrestrial ecosystems have significantly mitigated global warming by absorbing increased levels of atmospheric carbon dioxide (Friedlingstein et al., 2023; Lee et al., 2023). The “carbon neutrality” plans proposed by many countries, including China, highlight the importance of enhancing the carbon sink functions and stability of ecosystems (Buma et al., 2024; Yang et al., 2022). However, rising global temperatures (Rantanen and Laaksonen, 2024; WMO, 2024), increased spatiotemporal variability of precipitation (Wu et al., 2019; Zhang et al., 2021) and frequent extreme climate events (Li et al., 2024; WMO, 2024; Zhang et al., 2021) are affecting the carbon sequestration potential, thereby its stability of terrestrial ecosystems. Therefore, understanding the changes in the stability of carbon sinks in terrestrial ecosystems is crucial for effectively addressing climate change and achieving carbon neutrality goals.
Stability refers to a system’s capacity to maintain or restore its original state following a disturbance (Holling and Holling, 1973; Lamothe et al., 2019; Pimm, 1984). Theoretically, a system’s response to external perturbations can be gaged through internal natural fluctuations (Kubo, 1966; Marconi et al., 2008). When perturbations push a system toward a tipping point, it experiences “critical slowing down (CSD),” leading to slower recovery rates and reduced resilience (Dakos et al., 2008; Scheffer et al., 2009). At this point, the system begins to lose stability, which can be detected from the increased temporal autocorrelation and variability (Scheffer et al., 2009; Scheffer et al., 2012). Lag-one autocorrelation (AR1) and variance (VAR) have become key indicators for ecosystem stability (Berdugo et al., 2022; Dakos et al., 2023; Dakos et al., 2015; Hirota et al., 2021; Parry et al., 2022; Scheffer et al., 2015; Stevens et al., 2022). AR1, less influenced by environmental fluctuation frequency compared with VAR (Dakos et al., 2012; Veraart et al., 2012), is therefore more widely used as a measure of ecosystem stability (Forzieri et al., 2022; Yao et al., 2024).
Recent studies have reported a decline in the stability of global terrestrial ecosystems (Forzieri et al., 2022; Smith and Boers, 2023b; Smith et al., 2022; Sun et al., 2022; Verbesselt et al., 2016; Yao et al., 2024), as measured by AR1, with a critical shift in the early 2000s from enhancement to marked weakening (Smith et al., 2022; Yao et al., 2024). Ecosystem stability tends to be greater with higher water availability (Boulton et al., 2022; Smith and Boers, 2023a; Verbesselt et al., 2016) and lower with rising temperatures and increased precipitation variability (Fernandez-Martinez et al., 2023; Yao et al., 2024). Current research primarily focuses on historical periods (Boulton et al., 2022; Chen et al., 2023; Fernandez-Martinez et al., 2023; Forzieri et al., 2022; Hu et al., 2023; Jiang et al., 2022; Smith et al., 2022; Wang et al., 2023), lacking insights into future stability. Yao et al. (2024) indirectly described future global stability declines by comparing the AR1 ratios between future and historical periods. However, few studies have directly considered the dynamic changes and climatic factors that influence future stability, thereby limiting the ability to predict instability risks.
China’s terrestrial ecosystems play a significant role as carbon sinks, accounting for approximately 8–11% of the global carbon sink (Friedlingstein et al., 2023; Piao et al., 2022; Yang et al., 2022). Unlike the global trend of declining stability in terrestrial ecosystems since the early 21st century (Smith et al., 2022), China has exhibited a turning point around 2014 (Hu et al., 2023). With the intensification of climate change throughout the 21st century (Sreeparvathy and Srinivas, 2022; Yin et al., 2023; Zhou et al., 2023; Zhou et al., 2019), the structure and function of ecosystems may undergo greater changes (Conradi et al., 2024; Pappas et al., 2017). A deeper understanding of the dynamics and stability of future carbon sinks in China’s terrestrial ecosystems, as well as the influence of climatic factors on carbon sink stability, is imperative for implementing effective ecosystem management to enhance the stability of ecosystem carbon sinks.
This study analyzed the dynamics and stability changes of future carbon sinks in China’s terrestrial ecosystems and identified the influence of climatic factors on carbon sink stability changes. First, the spatiotemporal changes in carbon sinks from 2015 to 2,100 were analyzed using the simulated net ecosystem productivity (NEP) of the Coupled Model Intercomparison Project Phase 6 (CMIP6). Second, we calculated the trends of AR1 based on NEP as an early warning indicator of changes in carbon sink stability. Finally, we used a combination of XGBoost and SHAP models to examine the influences of climatic background and variability on NEP.AR1. This study aims to improve our understanding of future carbon sink stability and its climate drivers in China’s terrestrial ecosystems, providing valuable insights for policymakers and scientists to enhance the sustainability and stability of carbon sinks in the face of ongoing environmental changes (Kang et al., 2022; Qiao et al., 2024).
2 Materials and methods
2.1 Data
We utilized the monthly outputs of NEP, precipitation (Pre), temperature (Tas), soil surface moisture (SSM), and vapor pressure deficit (VPD) from Earth System Models (ESMs) participating in CMIP6 across the Shared Socioeconomic Pathways (SSP) 245 and SSP585 scenarios, encompassing the period from 2015 to 2,100. SSP245 represents a moderate greenhouse gas emissions pathway with an additional radiative forcing of 4.5 W/m2 by 2,100, while SSP585 represents a high emissions pathway with an additional radiative forcing of 8.5 W/m2 by 2,100 (Su et al., 2021; Yao et al., 2024). NEP, Pre, Tas, and SSM data were obtained from repository,1 and VPD data (Bjarke et al., 2023) were sourced,2 with all data aggregated using multi-model means (Table 1). The models were selected for their ability to provide complete and continuous data for all required variables (NEP, Pre, Tas, SSM, and VPD) over the study period, ensuring temporal and spatial consistency while avoiding issues caused by data gaps. Subsequently, the data were resampled to a resolution of 0.5° × 0.5° and spatially clipped using the boundary map of China.
Table 1
| ESM | Institution ID | Resolution (°) | |
|---|---|---|---|
| 1 | ACCESS–ESM1–5 | CSIRO | 1.25 × 1.875 |
| 2 | BCC–CSM2–MR | BCC | 1.125 × 1.125 |
| 3 | CESM2–WACCM | NCAR | 1.25 × 0.9375 |
| 4 | CMCC–CM2–SR5 | CMCC | 0.9424 × 1.25 |
| 5 | CMCC–ESM2 | CMCC | 0.9375 × 1.5 |
| 6 | EC–Earth3–Veg | EC–Earth–Consortium | 0.7031 × 0.7031 |
| 7 | IPSL–CM6A–LR | IPSL | 1.2587 × 2.5 |
| 8 | MPI–ESM1–2–LR | MPI–M | 1.875 × 1.875 |
| 9 | NorESM2–LM | NCC | 2.5 × 1.875 |
List of CMIP6 ESMs used in this study.
2.2 Method
2.2.1 Evaluation of dynamics and stability changes of NEP
Before estimating the NEP stability, it is necessary to understand the magnitude and spatiotemporal patterns of NEP. We calculated the average annual NEP per pixel from 2015 to 2,100 and weighted it by the area to determine the size of the carbon sink for each year. A piecewise linear model identified breakpoints (Hu et al., 2021), and Kendall’s τ rank correlation coefficient (Feng et al., 2021) was used to analyze trends in the NEP time series. The piecewise linear model is suitable for data with nonlinear relationships but distinct linear segments, while Kendall’s τ makes trends comparable across different regions (Hu et al., 2023; Wang et al., 2023). We employed the piecewise.linear() function from the R package “SiZer” and the cor.test() function from the “stats” package with the Kendall method (p < 0.05) to achieve these.
To estimate NEP stability using AR1 (NEP.AR1), the time series must be approximately stationary, that is, without long-term (nonlinear) trends and seasonality (Smith and Boers, 2023a). We employed Seasonal Trend decomposition using Loess (STL; Cleveland and Cleveland, 1990) to decompose the monthly NEP dataset into seasonal, trend and residual components for each grid cell, implemented through the stl() function in the “stats” package. For our stability estimation, the residual component representing the deseasoned and detrended NEP time series was used to calculate NEP.AR1. In the stl() function, we kept the s.window parameter as “periodic” and the t.window parameter as 25 months. The NEP.AR1 coefficient was then measured using a sliding window of 132 months (about 11 years), generating a time series of NEP.AR1 for each location. It is worth noting that different spans for the t.window, as well as the sliding AR1 window, have demonstrated robustness in long-time series (Boulton et al., 2022; Smith and Boers, 2023a; Wang et al., 2023). To facilitate the comparison between NEP stability and dynamics, the mean NEP time series within the same sliding windows (NEP.Mean) as NEP.AR1 was computed, ensuring temporal alignment. The trend of NEP.AR1 and NEP.Mean (ΔNEP.AR1 and ΔNEP.Mean) was calculated using the same method as ΔNEP. For a detailed visualization of the process, refer to Supplementary Figure S1.
2.2.2 Exploration of the effects of climatic factors on NEP stability
To understand the climatic factors driving variations in carbon sink stability, we used a combination of XGBoost and SHAP models to examine the relationship between NEP.AR1 and climatic background and variability. The climatic background included the average temperature (Tas.Mean), average precipitation (Pre.Mean), average soil surface moisture (SSM.Mean), and average vapor pressure deficit (VPD.Mean) within each sliding window (Supplementary Figure S2). The climatic variability included the variability in temperature, precipitation, SSM and VPD (Tas.CV, Pre.CV, SSM.CV, VPD.CV) within each sliding window, quantified as the standard deviation divided by the mean (Supplementary Figure S2). XGBoost and SHAP models are widely used in Earth science research (Batunacun et al., 2021; Wang et al., 2022; Yan et al., 2024). XGBoost represents an advanced form of the gradient boosting decision tree algorithm, recognized for its rapid computation and effectiveness in handling sparse datasets (Chen and Guestrin, 2016). It incorporates a stepwise shrinkage technique to mitigate overfitting. SHAP is based on the concept of Shapley values from game theory, providing a unified approach to interpret the outputs of any machine learning model and visualize the complex causal relationships between the dependent variable and its drivers (Lundberg et al., 2020). In this study, we used SHAP to describe the nonlinear relationships hidden within the XGBoost black box model and translate these relationships into interpretable rules, allowing us to explore the extent and direction (positive or negative) of various factors’ impacts.
3 Results
3.1 Spatiotemporal patterns of future carbon sink in China’s terrestrial ecosystems
The spatial distribution of China’s terrestrial carbon sinks from 2015 to 2,100 shows a pattern of “high in the south and east, low in the north and west, gradually increasing from the northwest to the southeast” (Figures 1A,C). Under SSP245, the national annual average NEP is 0.27 ± 0.07 PgC/yr, which is lower than the value of 0.33 ± 0.09 PgC/yr under SSP585. Areas with high carbon sink capacity (> 80 gC/m2) are more extensive under SSP585 compared to SSP245. Temporally, NEP shows an initial increase followed by a leveling off (Figures 1B,D). In SSP245, this leveling off occurs around 2044, while in SSP585, it occurs around 2057, indicating longer NEP growth under the high-emission scenario. The NEP trend (τ) under SSP585 is larger than that under SSP245, suggesting a stronger NEP growth rate under SSP585.
Figure 1

Spatiotemporal patterns of NEP across 2015–2,100. (A,C) Show the average spatial distribution of NEP under the SSP245 and SSP585 scenarios, respectively; (B,D) show the temporal trends of NEP under the SSP245 and SSP585 scenarios, respectively. The gray continuous line represents the national mean NEP, and the dots represent the breakpoints in the NEP time series. The black, blue, and red fitted lines represent the NEP trends for 2015–2,100, before the breakpoints, and after the breakpoints, respectively, with τ being Kendall’s τ rank correlation coefficient.
3.2 Spatiotemporal patterns of future carbon sink stability in China’s terrestrial ecosystems
The mean NEP.AR1 time series shows a transition from a negative to a positive trend around 2060 under both scenarios (2053 under SSP245 and 2065 under SSP585), indicating a shift from enhanced to weakened carbon sink stability (Figures 2A,E). Spatially, regions with increased stability before 2060 and decreased stability after 2060 are primarily located in the south and east (Figures 2B–D,F–H). Significant changes are observed in the Northeast China Plain, North China Plain, Yunnan-Guizhou Plateau, Inner Mongolia and southeast coastal areas. Before 2060, 64.8% of areas under SSP245 (Figure 2C) and 79.3% under SSP585 (Figure 2G) experienced stability enhancement. After 2060, there was a stability weakening in 68.3% of areas under SSP245 (Figure 2D) and 80.8% under SSP585 (Figure 2H). SSP585 showed more pronounced changes in carbon sink stability compared to SSP245.
Figure 2

Spatiotemporal patterns of NEP.AR1 for 2015–2,100, 2015–2060, and 2060–2,100. (A,E) Temporal trajectories of carbon sink stability under SSP245 and SSP585, respectively. Gray continuous line is the national mean sliding NEP.AR1, and dots are the breakpoints in the NEP.AR1 time series. Black, blue, and red fitted lines represent the NEP.AR1 trends for 2015–2,100, 2015–2060, and 2060–2,100, respectively, with τ being Kendall’s τ rank correlation coefficient. (B–D) Spatial pattern of ∆NEP.AR1 under the SSP245 scenario for 2015–2,100, before 2060, and after 2060; (F–H) Spatial pattern of ∆NEP.AR1 under the SSP245. Positive ∆NEP. AR1 values suggest a decline in stability. Grid cells with significant values are included in the figures (p < 0.05).
We further consider the relationship between NEP.AR1 and NEP.Mean (Figures 3A–F). Before 2060, quadrant diagram of NEP.AR1 and NEP.Mean trends under different scenarios showed that more than half areas (SSP245: 52.86%, SSP585: 74.81%) experienced both carbon sink stability and capacity enhancements (Figures 3B,E). After 2060, the regions where both NEP.AR1 and NEP.Mean increase simultaneously decreases (Figures 3C,F), indicating a decoupling between carbon sink stability and size. Despite an increase in carbon sink capacity, stability does not consistently improve.
Figure 3

Cumulative density distributions (p < 0.05) of the relationship between NEP.Mean Kendall’s τ and NEP.AR1 Kendall’s τ for 2015–2,100, 2015–2060, and 2060–2,100. (A–C) Under the SSP245; (D–F) Under the SSP585. Grid cells with non-significant Kendall’s τ values (p > 0.05) are not included in the figures for visual purposes. The spatiotemporal distribution of the sliding mean NEP (NEP.Mean) can be found in Supplementary Figure S3.
3.3 Potential climatic drivers of China’s future land carbon sinks stability
Figures 4A,D illustrate the SHAP values and relative importance of various factors under different scenarios. Vapor pressure deficit (VPD) and temperature (Tas) are the two primary factors influencing carbon sink stability (NEP.AR1), and their impacts differ across scenarios. In the SSP245 scenario, VPD has the largest contribution, accounting for 68.87% of the total SHAP value, with VPD variability (VPD.CV) playing a dominant role in carbon sink stability. As VPD.CV increases, the SHAP value rises significantly, indicating that greater VPD variability leads to an increase in NEP.AR1, meaning a decline in carbon sink stability (Figure 4B). Additionally, the average temperature (Tas.Mean) also shows a strong influence. In the SSP585 scenario, temperature becomes the most influential factor, contributing 53.15%, indicating that temperature has a much stronger effect on carbon sink stability in a high-emission scenario. Specifically, Tas.CV (temperature variability) plays a leading role in determining carbon sink stability, and VPD.CV also has a notable impact. As Tas.CV increases, SHAP values rise sharply (Figure 4E), suggesting that greater temperature variability leads to a significant increase in carbon sink instability. This highlights the substantial risk posed by future extreme temperature events to carbon sinks.
Figure 4

The climate drivers of NEP.AR1 changes under SSP245 and SSP585. (A,D) The importance of climatic drivers for NEP.AR1 changes, assessed using the mean |SHAP| value. Larger mean |SHAP| values indicate higher importance of the variable in explaining NEP.AR1 changes. (B,E) SHAP partial dependence plots of the most important variables identified in (A,D), respectively. The SHAP values on the y-axis indicate the contribution of the variable to the NEP.AR1 prediction, with the x-axis representing the value of the variable. The red line shows the fitted trend, highlighting the relationship between the variable and its contribution. (C,F) Box plots illustrating the changes in the most important variables (VPD.CV for SSP245 and Tas.CV for SSP585) before and after 2060, under SSP245 and SSP585 scenarios, respectively.
Overall, under the SSP245 scenario, VPD variability (VPD.CV) is the primary driver of carbon sink stability, while in the SSP585 scenario, temperature variability (Tas.CV) has a more significant effect. Figures 4C,F show the trends of VPD.CV and Tas.CV before and after 2060, further revealing that the increasing variability of VPD and temperature are the key factors driving the shift in carbon sink stability from strengthening to weakening.
4 Discussion
Over the past few decades, China’s terrestrial ecosystems have been reported as significant carbon sinks, with process models estimating an average annual absorption of 0.12–0.26 PgC/yr (Cao et al., 2003; Friedlingstein et al., 2023; He et al., 2019; Ji et al., 2008; Jiang et al., 2016; Piao et al., 2022; Piao et al., 2009; Tian et al., 2011; Yang et al., 2022). Our study finds that, from 2015 to 2,100, China’s terrestrial ecosystems will continue to act as carbon sinks in the future, absorbing an average of 0.27–0.33 PgC/yr. This estimate aligns with existing projections for future carbon sinks in China (0.22–0.31 PgC/yr; Ji et al., 2008; Qin et al., 2024; Xu et al., 2024; Yu et al., 2020). From the 1960s to the 1990s, the carbon sink of China’s terrestrial ecosystems did not change significantly or slightly (Cao et al., 2003; He et al., 2019; Mu et al., 2008; Tao et al., 2007; Tian et al., 2015), but has increased since 2000 (Fang et al., 2018; He et al., 2019; Jiang et al., 2016; Jiang et al., 2013). Our results suggest that this growth trend will persist from 2015 to 2,100, with varying rates of increase under different scenarios. Under the SSP245 scenario, the increase is not significant, with the growth rate leveling off around 2044, whereas under the SSP585 scenario, the increase is substantial, with the growth rate leveling off around 2057. The later turning point in SSP585 compared to SSP245 may be attributed to different climate change under the CMIP6 scenarios (O'Neill et al., 2016).
According to historical data prior to 2020, the stability of global terrestrial ecosystems experienced a critical shift from enhancement to weakening in the early 2000s (Boulton et al., 2022; Forzieri et al., 2022; Smith et al., 2022; Yao et al., 2024). Unlike the global trend of declining stability since the beginning of this century, the overall stability of China’s terrestrial ecosystems showed significant changes around 2014 (Chen et al., 2023; Hu et al., 2023; Wang et al., 2023). Studies have indicated that more than half of China’s ecosystems underwent a transition from enhanced to weakened stability between 2001 and 2020 (Hu et al., 2023). We observed that from 2015 to 2,100, the stability of carbon sinks in China’s terrestrial ecosystems also follows a similar trend, with a turning point around 2060. By extending the timeframe using CMIP6 historical data and future projections under the SSP585 scenario (Supplementary Figure S4), we observed that the turning point shifts earlier, yet the overall trend remains from enhancement to weakening. Although temporal autocorrelation trends across different study periods are not directly comparable, the relative changes within specific timeframe are of significance for exploring the dynamic of carbon sink stability (Yao et al., 2024). After 2060, a larger proportion of China’s terrestrial ecosystems experienced stability decline, with a more pronounced decrease in both area and intensity under high-emission scenarios (Figure 2). This is consistent with global studies on future ecosystem stability decline based on remote sensing vegetation index tests (Yao et al., 2024). While NEP.AR1 provides valuable insights into carbon sink stability, considering other metrics such as variance (VAR) is also important for a comprehensive understanding of ecosystem stability (Boulton et al., 2022; Carpenter and Brock, 2006; Dakos et al., 2012; Fernandez-Martinez et al., 2023; Scheffer et al., 2009; Smith et al., 2022). Our further analysis of carbon sink stability based on variance (NEP.VAR) revealed that over 60% of the areas exhibited consistent trends in NEP.AR1 and NEP.VAR (Supplementary Figure S5), indicating the robustness of our results.
Our results highlight that atmospheric vapor pressure deficit (VPD) and temperature variability are key regulators of carbon sink stability. Under the SSP245 scenario, fluctuations in VPD play a dominant role in determining carbon sink stability, primarily due to the regulation of plant physiological processes by water availability (He et al., 2022; Novick et al., 2016; Yuan et al., 2019). As VPD increases, plants close their stomata to reduce water loss, which limits photosynthesis and decreases carbon uptake (Fletcher et al., 2007). Grossiord et al. (2020) also noted that when VPD exceeds a certain threshold, plant photosynthesis and growth are restricted, significantly increasing the risks of hydraulic failure and carbon starvation. Similar findings have been reported in other regions, where increased VPD has been shown to limit photosynthetic activity and reduce ecosystem carbon uptake (Novick et al., 2016; Yuan et al., 2019). In the SSP585 scenario, although fluctuations in VPD continue to have a significant impact on carbon sink stability, the effect of temperature variability (Tas.CV) becomes more pronounced as global warming intensifies. Increased temperature variability leads to more frequent extreme cold or heat events, which negatively affect plant physiological activities (Reichstein et al., 2013; Wu et al., 2017). These results align with global studies, which have also begun to emphasize the increasing importance of temperature variability in driving ecosystem instability under scenarios of intensifying global warming (Reichstein et al., 2013). Once these changes exceed a critical threshold, the damage to vegetation may be irreversible, compromising the stability of ecosystem structure and function (Adams et al., 2009). We further assessed the relative influence of climate factors on carbon sink stability through partial correlation analysis, excluding the interference of other variables (Figure 5). The results show that VPD.CV remains the most relevant factor for carbon sink stability under the intermediate emissions scenario (SSP245). In contrast, under the high emissions scenario (SSP585), temperature variability (Tas.CV) emerges as the dominant factor, with VPD.CV as a secondary influence.
Figure 5
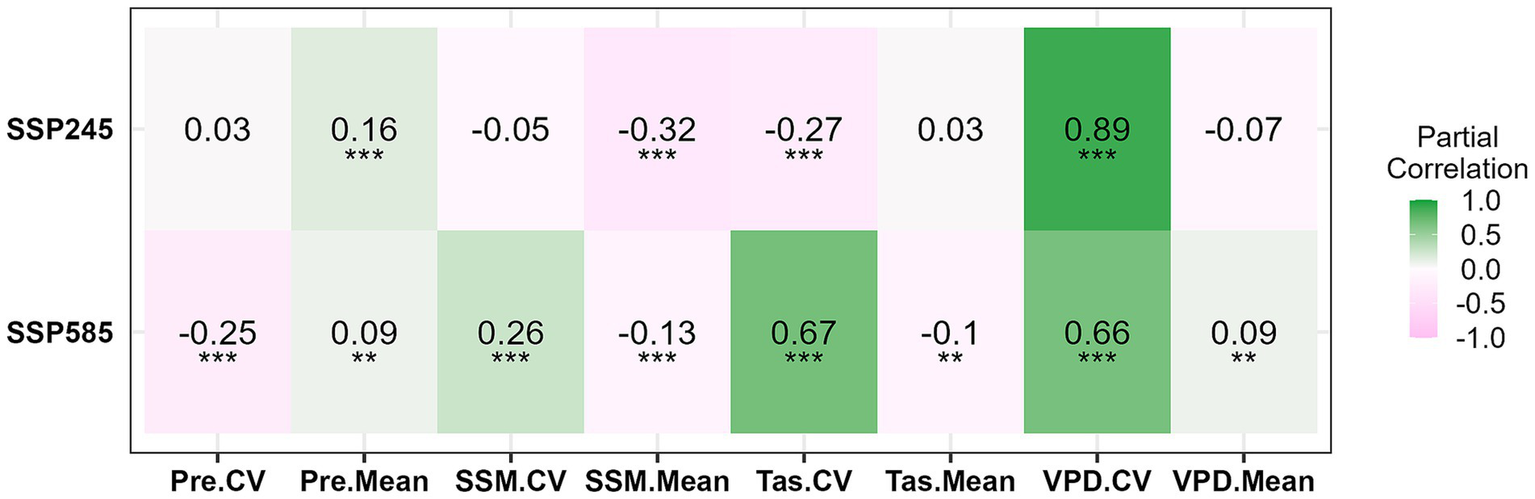
Partial correlation coefficients between NEP.AR1 and key climate factors under the SSP245 and SSP585 scenarios. Green indicates positive correlations, pink indicates negative correlations, and asterisks denote statistical significance (**p < 0.01; ***p < 0.001).
The factors influencing carbon sink stability have been extensively researched (Boulton et al., 2022; Chen et al., 2023; Fernandez-Martinez et al., 2023; Forzieri et al., 2022; Hu et al., 2022; Smith and Boers, 2023a), and the results indicate that climate is a key determinant of ecosystem carbon sink stability (Fernandez-Martinez et al., 2023). In addition to climate, other environmental factors may also influence carbon sink stability, such as nitrogen deposition (Gu et al., 2015) and biodiversity (de Mazancourt et al., 2013). Although increased nitrogen deposition and species richness stimulate the plant growth and carbon sink (Gu et al., 2015; Xu et al., 2020), their contributions to carbon sink stability are weaker than those of climate (Fernandez-Martinez et al., 2023). Therefore, this study mainly focuses on the impact of climatic factors on carbon sink stability. Additionally, disturbances such as land use change and wildfires may influence the quantification of carbon sink stability and should be further investigated in future research. Our research indicates that a deep understanding of the impact of climate change on the stability of China’s terrestrial ecosystem carbon sinks is crucial. In the future, priority should be given to enhancing the water retention capacity of ecosystems, improving their resilience to extreme climate events, and reducing greenhouse gas emissions to ensure long-term ecosystem stability. This provides policymakers with scientific evidence to develop more effective ecological protection and carbon neutrality strategies.
5 Conclusion
In this study, we estimated NEP and its temporal autocorrelation from a time series of the CMIP6 dataset to investigate the carbon sink dynamics and stability as well as its climate drivers in China’s terrestrial ecosystems by the end of this century.
The major conclusions drawn are as follows:
-
From 2015 to 2,100, China’s terrestrial ecosystems will act as carbon sinks, with a general trend of initial increase followed by a gradual leveling off.
-
The stability of carbon sinks undergoes a transition from strengthening to weakening over the study period. Notably, the enhancement of carbon sinks is not always accompanied by increased stability.
-
The factors influencing carbon sink stability vary under different scenarios. In the SSP245 scenario, the variability of atmospheric vapor pressure deficit is the primary driver of carbon sink stability, while in the SSP585 scenario, temperature variability has a more significant impact on carbon sink stability.
These findings underscore the importance of considering both carbon sink capacity and stability in climate change mitigation strategies. Although increasing carbon sequestration is critical, ensuring the long-term stability of these sinks is equally important for achieving sustained climate benefits. To mitigate the risks to carbon sink stability, particularly under high-emission scenarios, adaptive management practices should be prioritized. Specifically, this includes enhancing water resource management to address the impacts of vapor pressure deficit (VPD) and developing adaptive strategies to reduce the threats posed by temperature variability and extreme climate events to carbon sink stability. Future research should aim to uncover the mechanisms driving these changes and optimize carbon sink management strategies to enhance both capacity and stability in the face of ongoing environmental challenges, ensuring their effectiveness in achieving carbon neutrality goals.
Statements
Data availability statement
The original contributions presented in this study are included in the article/Supplementary material, further inquiries can be directed to the corresponding authors.
Author contributions
ZZ: Conceptualization, Data curation, Formal analysis, Investigation, Methodology, Software, Visualization, Writing – original draft, Writing – review & editing. XR: Conceptualization, Methodology, Writing – review & editing. LS: Conceptualization, Methodology, Writing – review & editing. HH: Formal analysis, Funding acquisition, Supervision, Validation, Writing – review & editing. LZ: Resources, Writing – review & editing. XW: Validation, Writing – review & editing. MZ: Data curation, Resources, Writing – review & editing. YZ: Resources, Writing – review & editing. YF: Formal analysis, Writing – review & editing.
Funding
The author(s) declare that financial support was received for the research, authorship, and/or publication of this article. This research was funded by National Natural Science Foundation of China, grant number 42030509 and Special Project on National Science and Technology Basic Resources Investigation of China, grant number 2021FY100705.
Conflict of interest
The authors declare that the research was conducted in the absence of any commercial or financial relationships that could be construed as a potential conflict of interest.
Generative AI statement
The authors declare that no Generative AI was used in the creation of this manuscript.
Publisher’s note
All claims expressed in this article are solely those of the authors and do not necessarily represent those of their affiliated organizations, or those of the publisher, the editors and the reviewers. Any product that may be evaluated in this article, or claim that may be made by its manufacturer, is not guaranteed or endorsed by the publisher.
Supplementary material
The Supplementary material for this article can be found online at: https://www.frontiersin.org/articles/10.3389/ffgc.2024.1518578/full#supplementary-material
References
1
Adams H. D. Guardiola-Claramonte M. Barron-Gafford G. A. Villegas J. C. Breshears D. D. Zou C. B. et al . (2009). Temperature sensitivity of drought-induced tree mortality portends increased regional die-off under global-change-type drought. Proc. Natl. Acad. Sci. USA106, 7063–7066. doi: 10.1073/pnas.0901438106
2
Batunacun W. R. Lakes T. Nendel C. (2021). Using Shapley additive explanations to interpret extreme gradient boosting predictions of grassland degradation in Xilingol, China. Geosci. Model Dev.14, 1493–1510. doi: 10.5194/gmd-14-1493-2021
3
Berdugo M. Gaitán J. J. Delgado-Baquerizo M. Crowther T. W. Dakos V. (2022). Prevalence and drivers of abrupt vegetation shifts in global drylands. Proc. Natl. Acad. Sci. USA119:e2123393119. doi: 10.1073/pnas.2123393119
4
Bjarke N. Barsugli J. Livneh B. (2023). Ensemble of CMIP6 derived reference and potential evapotranspiration with radiative and advective components. Scientific Data10:417. doi: 10.1038/s41597-023-02290-0
5
Boulton C. A. Lenton T. M. Boers N. (2022). Pronounced loss of Amazon rainforest resilience since the early 2000s. Nat. Clim. Chang.12, 271–278. doi: 10.1038/s41558-022-01287-8
6
Buma B. Gordon D. R. Kleisner K. M. Bartuska A. Bidlack A. DeFries R. et al . (2024). Expert review of the science underlying nature-based climate solutions. Nature. Climate Change14, 402–406. doi: 10.1038/s41558-024-01960-0
7
Cao M. K. Prince S. D. Li K. R. Tao B. Small J. Shao X. M. (2003). Response of terrestrial carbon uptake to climate interannual variability in China. Glob. Chang. Biol.9, 536–546. doi: 10.1046/j.1365-2486.2003.00617.x
8
Carpenter S. R. Brock W. A. (2006). Rising variance: a leading indicator of ecological transition. Ecol. Lett.9, 308–315. doi: 10.1111/j.1461-0248.2005.00877.x
9
Chen T. Q. Guestrin C. (2016). “XGBoost: a scalable tree boosting system.” Kdd'16: proceedings of the 22nd Acm Sigkdd international conference on knowledge discovery and data mining. 785–794.
10
Chen J. Wang S. Shi H. Chen B. Wang J. Zheng C. et al . (2023). Radiation and temperature dominate the spatiotemporal variability in resilience of subtropical evergreen forests in China. Change6:6. doi: 10.3389/ffgc.2023.1166481
11
Cleveland R. B. Cleveland W. S. (1990). STL: a seasonal-trend decomposition procedure based on loess. J. Off. Stat.:6, 3–73.
12
Conradi T. Eggli U. Kreft H. Schweiger A. H. Weigelt P. Higgins S. I. (2024). Reassessment of the risks of climate change for terrestrial ecosystems. Nature Ecol. Evolution8, 888–900. doi: 10.1038/s41559-024-02333-8
13
Dakos V Boulton C. A. Buxton J. E. Abrams J. F. Arellano-Nava B. Armstrong McKay D. et al . (2023). Tipping point detection and early-warnings in climate, ecological, and human systems. Earth Syst. Dyn.15, 1117–1135.
14
Dakos V. Carpenter S. R. van Nes E. H. Scheffer M. (2015). Resilience indicators: Prospects and limitations for early warnings of regime shifts. Philosop. Transact. Royal Society B: Biolog. Sci.370:20130263. doi: 10.1098/rstb.2013.0263
15
Dakos V. Scheffer M. van Nes E. H. Brovkin V. Petoukhov V. Held H. (2008). Slowing down as an early warning signal for abrupt climate change. Proc. Natl. Acad. Sci. USA105, 14308–14312. doi: 10.1073/pnas.0802430105
16
Dakos V. van Nes E. H. D'Odorico P. Scheffer M. (2012). Robustness of variance and autocorrelation as indicators of critical slowing down. Ecology93, 264–271. doi: 10.1890/11-0889.1
17
de Mazancourt C. Isbell F. Larocque A. Berendse F. De Luca E. Grace J. B. et al . (2013). Predicting ecosystem stability from community composition and biodiversity. Ecol. Lett.16, 617–625. doi: 10.1111/ele.12088
18
Fang J. Y. Yu G. R. Liu L. L. Hu S. J. Chapin F. S. (2018). Climate change, human impacts, and carbon sequestration in China INTRODUCTION. Proc. Natl. Acad. Sci. USA115, 4015–4020. doi: 10.1073/pnas.1700304115
19
Feng Y. H. Su H. J. Tang Z. Y. Wang S. P. Zhao X. Zhang H. et al . (2021). Reduced resilience of terrestrial ecosystems locally is not reflected on a global scale. Commun. Earth Environ.2:2. doi: 10.1038/s43247-021-00163-1
20
Fernandez-Martinez M. Penuelas J. Chevallier F. Ciais P. Obersteiner M. Rodenbeck C. et al . (2023). Diagnosing destabilization risk in global land carbon sinks. Nature615, 848–853. doi: 10.1038/s41586-023-05725-1
21
Fletcher A. L. Sinclair T. R. Allen L. H. (2007). Transpiration responses to vapor pressure deficit in well watered 'slow-wilting' and commercial soybean. Environ. Exp. Bot.61, 145–151. doi: 10.1016/j.envexpbot.2007.05.004
22
Forzieri G. Dakos V. McDowell N. G. Ramdane A. Cescatti A. (2022). Emerging signals of declining forest resilience under climate change. Nature608, 534–539. doi: 10.1038/s41586-022-04959-9
23
Friedlingstein P. O'Sullivan M. Jones M. W. Andrew R. M. Bakker D. C. E. Hauck J. et al . (2023). Global carbon budget 2023. Earth Syst. Sci. Data15, 5301–5369. doi: 10.5194/essd-15-5301-2023
24
Grossiord C. Buckley T. N. Cernusak L. A. Novick K. A. Poulter B. Siegwolf R. T. W. et al . (2020). Plant responses to rising vapor pressure deficit. New Phytol.226, 1550–1566. doi: 10.1111/nph.16485
25
Gu F. X. Zhang Y. D. Huang M. Tao B. Yan H. M. Guo R. et al . (2015). Nitrogen deposition and its effect on carbon storage in Chinese forests during 1981-2010. Atmos. Environ.123, 171–179. doi: 10.1016/j.atmosenv.2015.10.081
26
He B. Chen C. Lin S. R. Yuan W. P. Chen H. W. Chen D. L. et al . (2022). Worldwide impacts of atmospheric vapor pressure deficit on the interannual variability of terrestrial carbon sinks. Natl. Sci. Rev.9:9. doi: 10.1093/nsr/nwab150
27
He H. L. Wang S. Q. Zhang L. Wang J. B. Ren X. L. Zhou L. et al . (2019). Altered trends in carbon uptake in China's terrestrial ecosystems under the enhanced summer monsoon and warming hiatus. Natl. Sci. Rev.6, 505–514. doi: 10.1093/nsr/nwz021
28
Hirota M. Flores B. M. Betts R. Borma L. S. Esquivel-Muelbert A. Jakovac C. et al . (2021). Chapter 24: resilience of the Amazon forest to global changes: assessing the risk of tipping points. Amazon Assessment Report2021. doi: 10.55161/QPYS9758
29
Holling C. S. Holling C. S. (1973). Resilience and stability of ecological systems. Annu. Rev. Ecol. Syst.4, 1–23. doi: 10.1146/annurev.es.04.110173.000245
30
Hu Z. M. Dakos V. Rieterk M. (2022). Using functional indicators to detect state changes in terrestrial ecosystems. Trends Ecol. Evol.37, 1036–1045. doi: 10.1016/j.tree.2022.07.011
31
Hu W. G. Ran J. Z. Dong L. W. Du Q. J. Ji M. F. Yao S. R. et al . (2021). Aridity-driven shift in biodiversity-soil multifunctionality relationships. Nature. Communications12:12. doi: 10.1038/s41467-021-25641-0
32
Hu Y. Wei F. L. Fu B. J. Wang S. Zhang W. M. Zhang Y. L. (2023). Changes and influencing factors of ecosystem resilience in China. Environ. Res. Lett.18:094012. doi: 10.1088/1748-9326/acec89
33
Ji J. J. Huang M. Li K. R. (2008). Prediction of carbon exchanges between China terrestrial ecosystem and atmosphere in 21st century. Sci. China Ser. D Earth Sci.51, 885–898. doi: 10.1007/s11430-008-0039-y
34
Jiang F. Chen J. M. Zhou L. X. Ju W. M. Zhang H. F. Machida T. et al . (2016). A comprehensive estimate of recent carbon sinks in China using both top-down and bottom-up approaches. Sci. Rep.6:6. doi: 10.1038/srep22130
35
Jiang H. Song L. S. Li Y. Ma M. G. Fan L. (2022). Monitoring the reduced resilience of forests in Southwest China using long-term remote sensing data. Remote Sens.14:14. doi: 10.3390/rs14010032
36
Jiang F. Wang H. W. Chen J. M. Zhou L. X. Ju W. M. Ding A. J. et al . (2013). Nested atmospheric inversion for the terrestrial carbon sources and sinks in China. Biogeosciences10, 5311–5324. doi: 10.5194/bg-10-5311-2013
37
Kang W. Liu S. Chen X. Feng K. Guo Z. Wang T. (2022). Evaluation of ecosystem stability against climate changes via satellite data in the eastern sandy area of northern China. J. Environ. Manag.308:114596. doi: 10.1016/j.jenvman.2022.114596
38
Kubo R. (1966). The fluctuation-dissipation theorem. Rep. Prog. Phys.29, 255–284. doi: 10.1088/0034-4885/29/1/306
39
Lamothe K. A. Somers K. M. Jackson D. A. (2019). Linking the ball-and-cup analogy and ordination trajectories to describe ecosystem stability, resistance, and resilience. Ecosphere10:10. doi: 10.1002/ecs2.2629
40
Lee H. Calvin K. Dasgupta D. Krinner G. Mukherji A. Thorne P. W. et al . (2023). IPCC, 2023: sections. In: climate change 2023: synthesis report. Contribution of Working Groups I, II and III to the Sixth Assessment Report of the Intergovernmental Panel on Climate Change.
41
Li S. Chen Y. Wei W. Fang G. Duan W. (2024). The increase in extreme precipitation and its proportion over global land. J. Hydrol.628:130456. doi: 10.1016/j.jhydrol.2023.130456
42
Lundberg S. M. Erion G. Chen H. DeGrave A. Prutkin J. M. Nair B. et al . (2020). From local explanations to global understanding with explainable AI for trees. Nature Machine Intelligence2, 56–67. doi: 10.1038/s42256-019-0138-9
43
Marconi U. Puglisi A. Rondoni L. Vulpiani A. (2008). Fluctuation–dissipation: response theory in statistical physics. Phys. Rep.461, 111–195. doi: 10.1016/j.physrep.2008.02.002
44
Mu Q. Zhao M. Running S. W. Liu M. Tian H. (2008). Contribution of increasing CO2and climate change to the carbon cycle in China's ecosystems. J. Geophys. Res.113. doi: 10.1029/2006JG000316
45
Novick K. A. Ficklin D. L. Stoy P. C. Williams C. A. Bohrer G. Oishi A. C. et al . (2016). The increasing importance of atmospheric demand for ecosystem water and carbon fluxes. Nat. Clim. Chang.6, 1023–1027. doi: 10.1038/nclimate3114
46
O'Neill B. C. Tebaldi C. van Vuuren D. P. Eyring V. Friedlingstein P. Hurtt G. et al . (2016). The scenario model Intercomparison project (ScenarioMIP) for CMIP6. Geosci. Model Dev.9, 3461–3482. doi: 10.5194/gmd-9-3461-2016
47
Pappas C. Mahecha M. D. Frank D. C. Babst F. Koutsoyiannis D. (2017). Ecosystem functioning is enveloped by hydrometeorological variability. Nature Ecol. Evolution1, 1263–1270. doi: 10.1038/s41559-017-0277-5
48
Parry I. M. Ritchie P. D. L. Cox P. M. (2022). Evidence of localised Amazon rainforest dieback in CMIP6 models. Earth Syst. Dynam.13, 1667–1675. doi: 10.5194/esd-13-1667-2022
49
Piao S. L. Fang J. Y. Ciais P. Peylin P. Huang Y. Sitch S. et al . (2009). The carbon balance of terrestrial ecosystems in China. Nature458, 1009–1013. doi: 10.1038/nature07944
50
Piao S. He Y. Wang X. Chen F. (2022). Estimation of China’s terrestrial ecosystem carbon sink: methods, progress and prospects. Sci. China Earth Sci.65, 641–651. doi: 10.1007/s11430-021-9892-6
51
Pimm S. L. (1984). The complexity and stability of ecosystems. Nature307, 321–326. doi: 10.1038/307321a0
52
Qiao D. Yuan W. Li H. (2024). Regulation and resilience: Panarchy analysis in forest socio-ecosystem of northeast National Forest Region, China. J. Environ. Manag.353:120295. doi: 10.1016/j.jenvman.2024.120295
53
Qin J. Liu P. Martin A. R. Wang W. Lei Y. Li H. (2024). Forest carbon storage and sink estimates under different management scenarios in China from 2020 to 2100. Sci. Total Environ.927:172076. doi: 10.1016/j.scitotenv.2024.172076
54
Rantanen M. Laaksonen A. (2024). The jump in global temperatures in September 2023 is extremely unlikely due to internal climate variability alone. Climate and Atmospheric Sci.7:7. doi: 10.1038/s41612-024-00582-9
55
Reichstein M. Bahn M. Ciais P. Frank D. Mahecha M. D. Seneviratne S. I. et al . (2013). Climate extremes and the carbon cycle. Nature500, 287–295. doi: 10.1038/nature12350
56
Scheffer M. Bascompte J. Brock W. A. Brovkin V. Carpenter S. R. Dakos V. et al . (2009). Early-warning signals for critical transitions. Nature461, 53–59. doi: 10.1038/nature08227
57
Scheffer M. Carpenter S. R. Dakos V. van Nes E. H. (2015). Generic indicators of ecological resilience: inferring the chance of a critical transition. Annu. Rev. Ecol. Evol. Syst.46, 145–167. doi: 10.1146/annurev-ecolsys-112414-054242
58
Scheffer M. Carpenter S. R. Lenton T. M. Bascompte J. Brock W. Dakos V. et al . (2012). Anticipating critical transitions. Science338, 344–348. doi: 10.1126/science.1225244
59
Smith T. Boers N. (2023a). Global vegetation resilience linked to water availability and variability. Nat. Commun.14:498. doi: 10.1038/s41467-023-36207-7
60
Smith T. Boers N. (2023b). Reliability of vegetation resilience estimates depends on biomass density. Nat Ecol Evol7, 1799–1808. doi: 10.1038/s41559-023-02194-7
61
Smith T. Traxl D. Boers N. (2022). Empirical evidence for recent global shifts in vegetation resilience. Nat. Clim. Chang.12, 477–484. doi: 10.1038/s41558-022-01352-2
62
Sreeparvathy V. Srinivas V. V. (2022). Meteorological flash droughts risk projections based on CMIP6 climate change scenarios. Npj Climate and Atmospheric Sci.5:5. doi: 10.1038/s41612-022-00302-1
63
Stevens N. Bond W. Feurdean A. Lehmann C. E. R. (2022). Grassy ecosystems in the Anthropocene. Annu. Rev. Environ. Resour.47, 261–289. doi: 10.1146/annurev-environ-112420-015211
64
Su B. D. Huang J. L. Mondal S. K. Zhai J. Q. Wang Y. J. Wen S. S. et al . (2021). Insight from CMIP6 SSP-RCP scenarios for future drought characteristics in China. Atmos. Res.250:105375. doi: 10.1016/j.atmosres.2020.105375
65
Sun N. Liu N. J. Zhao X. Zhao J. C. Wang H. Y. Wu D. H. (2022). Evaluation of spatiotemporal resilience and resistance of global vegetation responses to climate change. Remote Sens.14:14. doi: 10.3390/rs14174332
66
Tao B. Cao M. K. Li K. R. Gu F. X. Ji J. J. Huang M. et al . (2007). Spatial patterns of terrestrial net ecosystem productivity in China during 1981-2000. Sci. China Ser. D Earth Sci.50, 745–753. doi: 10.1007/s11430-007-0022-z
67
Tian H. Q. Melillo J. Lu C. Q. Kicklighter D. Liu M. L. Ren W. et al . (2011). China's terrestrial carbon balance: contributions from multiple global change factors. Glob. Biogeochem. Cycles25. doi: 10.1029/2010GB003838
68
Tian H. Xu X. Lu C. Liu M. Ren W. Chen G. et al . (2015). Net exchanges of CO2, CH4, and N2O between China's terrestrial ecosystems and the atmosphere and their contributions to global climate warming. J. Geophys. Res.116. doi: 10.1029/2010JG001393
69
Veraart A. J. Faassen E. J. Dakos V. van Nes E. H. Lürling M. Scheffer M. (2012). Recovery rates reflect distance to a tipping point in a living system. Nature481, 357–359. doi: 10.1038/nature10723
70
Verbesselt J. Umlauf N. Hirota M. Holmgren M. Van Nes E. H. Herold M. et al . (2016). Remotely sensed resilience of tropical forests. Nat. Clim. Chang.6, 1028–1031. doi: 10.1038/nclimate3108
71
Wang Z. Fu B. Wu X. Li Y. Feng Y. Wang S. et al . (2023). Vegetation resilience does not increase consistently with greening in China’s loess plateau. Commun. Earth Environ.4:4. doi: 10.1038/s43247-023-01000-3
72
Wang H. Yan S. J. Ciais P. Wigneron J. P. Liu L. B. Li Y. et al . (2022). Exploring complex water stress-gross primary production relationships: impact of climatic drivers, main effects, and interactive effects. Glob. Chang. Biol.28, 4110–4123. doi: 10.1111/gcb.16201
73
WMO (2024). State of the global climate, 2023. Geneva: World Meteorological Organization.
74
Wu X. C. Liu H. Y. Li X. Y. Piao S. L. Ciais P. Guo W. C. et al . (2017). Higher temperature variability reduces temperature sensitivity of vegetation growth in northern hemisphere. Geophys. Res. Lett.44, 6173–6181. doi: 10.1002/2017GL073285
75
Wu S. Y. Wu Y. Wen J. (2019). Future changes in precipitation characteristics in China. Int. J. Climatol.39, 3558–3573. doi: 10.1002/joc.6038
76
Xu S. Eisenhauer N. Ferlian O. Zhang J. L. Zhou G. Y. Lu X. K. et al . (2020). Species richness promotes ecosystem carbon storage: evidence from biodiversity-ecosystem functioning experiments. Proceed. Royal Society B-Biolog. Sci.287:20202063. doi: 10.1098/rspb.2020.2063
77
Xu L. He N. P. Li M. X. Cai W. X. Yu G. R. (2024). Spatiotemporal dynamics of carbon sinks in China's terrestrial ecosystems from 2010 to 2060. Resour. Conserv. Recycl.203:107457. doi: 10.1016/j.resconrec.2024.107457
78
Yan Y. Piao S. Hammond W. M. Chen A. Hong S. Xu H. et al . (2024). Climate-induced tree-mortality pulses are obscured by broad-scale and long-term greening. Nature Ecol. Evolution8, 912–923. doi: 10.1038/s41559-024-02372-1
79
Yang Y. H. Shi Y. Sun W. J. Chang J. F. Zhu J. X. Chen L. Y. et al . (2022). Terrestrial carbon sinks in China and around the world and their contribution to carbon neutrality. Sci. China-Life Sci.65, 861–895. doi: 10.1007/s11427-021-2045-5
80
Yao Y. Liu Y. Fu F. Song J. Wang Y. Han Y. et al . (2024). Declined terrestrial ecosystem resilience. Glob. Chang. Biol.30:e17291. doi: 10.1111/gcb.17291
81
Yin J. B. Gentine P. Slater L. Gu L. Pokhrel Y. Hanasaki N. et al . (2023). Future socio-ecosystem productivity threatened by compound drought-heatwave events. Nature Sustain.6:259. doi: 10.1038/s41893-022-01024-1
82
Yu L. Gu F. Huang M. Tao B. Hao M. Wang Z. (2020). Impacts of 1.5 °C and 2 °C global warming on net primary productivity and carbon balance in China’s terrestrial ecosystems. Sustain. For.12:849. doi: 10.3390/su12072849
83
Yuan W. P. Zheng Y. Piao S. L. Ciais P. Lombardozzi D. Wang Y. P. et al . (2019). Increased atmospheric vapor pressure deficit reduces global vegetation growth. Science. Advances5:5. doi: 10.1126/sciadv.aax1396
84
Zhang W. Kalli F. Wu P. Zhou T. Robin C. Charline M. et al . (2021). Increasing precipitation variability on daily-to-multiyear time scales in a warmer world. Sci. Adv.7:eabf8021. doi: 10.1126/sciadv.abf8021
85
Zhou J. Y. Lu H. Yang K. Jiang R. J. Yang Y. Wang W. et al . (2023). Projection of China's future runoff based on the CMIP6 mid-high warming scenarios. Sci. China-Earth Sci.66, 528–546. doi: 10.1007/s11430-022-1055-5
86
Zhou S. Zhang Y. Williams A. P. Gentine P. (2019). Projected increases in intensity, frequency, and terrestrial carbon costs of compound drought and aridity events. Advances5:5. doi: 10.1126/sciadv.aau5740
Summary
Keywords
carbon sink dynamics, carbon sink stability, climate change, terrestrial ecosystem, China, CMIP6
Citation
Zhou Z, Ren X, Shi L, He H, Zhang L, Wang X, Zhang M, Zhang Y and Fan Y (2024) Vapor pressure deficit and temperature variability drive future changes to carbon sink stability in China’s terrestrial ecosystems. Front. For. Glob. Change 7:1518578. doi: 10.3389/ffgc.2024.1518578
Received
28 October 2024
Accepted
25 November 2024
Published
18 December 2024
Volume
7 - 2024
Edited by
Xi Zhang, Louisiana State University Agricultural Center, United States
Reviewed by
Jie Gao, Xinjiang Normal University, China
Min Liu, East China Normal University, China
Updates
Copyright
© 2024 Zhou, Ren, Shi, He, Zhang, Wang, Zhang, Zhang and Fan.
This is an open-access article distributed under the terms of the Creative Commons Attribution License (CC BY). The use, distribution or reproduction in other forums is permitted, provided the original author(s) and the copyright owner(s) are credited and that the original publication in this journal is cited, in accordance with accepted academic practice. No use, distribution or reproduction is permitted which does not comply with these terms.
*Correspondence: Xiaoli Ren, renxl@igsnrr.ac.cn
Disclaimer
All claims expressed in this article are solely those of the authors and do not necessarily represent those of their affiliated organizations, or those of the publisher, the editors and the reviewers. Any product that may be evaluated in this article or claim that may be made by its manufacturer is not guaranteed or endorsed by the publisher.