 Fadime Sağlam
- Kastamonu University, Faculty of Forestry, Department of Forest Engineering, Kastamonu, Türkiye
Stem taper models are essential tools in forestry, allowing for the estimation of stem diameter at any height, as well as the calculation of merchantable and total stem volumes and wood assortments along the tree bole. Therefore, accurate taper prediction is crucial for sustainable forest resource assessment. This study developed stem taper models for estimating tree diameter using both traditional regression and machine learning (ML) approaches, using Pinus brutia Ten. as a model species. The research focused on two machine learning techniques, Random Forest (RF) and Extreme Gradient Boosting (XGBoost) to predict stem taper in comparison to traditional taper models. A total of 121 destructively sampled trees were measured for stem diameter at multiple heights, and various taper models were evaluated for their accuracy. The results show that the XGBoost model outperforms all other approaches, demonstrating superior predictive accuracy with minimal error, as indicated by lower root mean square error (RMSE), mean absolute error (MAE), and bias values. While RF also performed well, XGBoost was selected for this study due to its better predictive performance and the more consistent error distributions between the training and test datasets. This research highlights the potential of ML techniques in forest modeling, offering enhanced accuracy and efficiency for forest inventory and management applications.
1 Introduction
Volume estimations are one of the key components of growth and yield models. The accurate estimation of a tree’s total or commercial volume is crucial for both forest inventory studies and forest management planning. Volume estimates are an important stand parameter used for accurately calculating the volume of trees and stands, as well as the distribution of this volume across commercial classes, preparing forest management plans, making projections for the future of the forest products industry, and estimating biomass and carbon accumulation using appropriate biomass expansion factors (Fang et al., 2000; Jiang et al., 2005; Diéguez-Aranda et al., 2006; Corral-Rivas et al., 2007; Crecente-Campo et al., 2009; Castedo-Dorado et al., 2012; de-Miguel et al., 2012; Gómez-García et al., 2015).
Stem taper models are considered one of the most reliable methods for estimating tree volume and commercial volume of trees (Fang et al., 2000; Rojo et al., 2005; Diéguez-Aranda et al., 2006; Li and Weiskittel, 2011; Ercanlı et al., 2014; Özçelik and Crecente-Campo, 2016). With the help of stem taper models, it is possible to easily estimate: (i) the diameter of the stem at any given height, (ii) the height of the stem corresponding to any given stem diameter, (iii) the volume of the commercial (marketable) stem, (iv) the total stem volume, (v) the volumes of all wood types that can be obtained from the stem, and (vi) the volume of the stem section between any two given heights (Kozak, 2004). As noted by de-Miguel et al. (2012), another important aspect of stem taper models for forestry applications is their ability to be integrated into growth and yield models, enabling the prediction of wood-product classes and quantities to be obtained for different site conditions and planning alternatives.
Stem taper equations have been developed over time to estimate stem volume. Earlier formulations often relied on basic linear or exponential relationships, which may fall short in accurately reflecting the geometric variability along different stem segments—namely the basal, central, and upper parts. To overcome these shortcomings, more refined models have emerged. One notable example is the segmented taper model proposed by Max and Burkhart (1976), which represents the stem as a composite of geometric forms—neiloid, paraboloid, and cone—each corresponding to a specific portion of the stem (Kozak, 1988; Ko et al., 2025). In addition to segmented models, variable-exponent taper equation, widely used in forest property modeling and analysis, characterizes tree stem form with a varying exponent or variable from the base to the top, representing a range of forms including paraboloid, conic, neiloid, and other intermediate shapes (Kozak, 1988). By adjusting the independent variable-exponent within a continuous function, more accurate estimates of tree stem forms can be achieved. It has been demonstrated by a considerable number of studies that the variable-exponent taper equation is characterized by reduced bias and the provision of more accurate estimates of diameters at various stem heights (Kozak, 1988; Muhairwe, 1999; Sakici et al., 2008; Xu et al., 2022; Seki, 2023).
The nonlinear least squares method is a widely utilized approach in the development of stem taper models. Nonetheless, the use of nonlinear regression models for biological data can present challenges such as violations of assumptions like homoscedasticity and normality (Sakici and Ozdemir, 2018; Ercanli 2020; Sahin, 2024). This may compromise the reliability of parameter estimates and lead to biased or inefficient predictions. In light of the constraints of traditional regression models, recent studies in forestry have increasingly turned to machine learning (ML) approaches. Approaches like Extreme Gradient Boosting (XGBoost) and Random Forests (RF) have been developed to address intricate, nonlinear relationships and to accommodate the irregularities commonly encountered in biologic datasets. These approaches are especially effective in modeling forest biometric variables, where the interrelationships between variables are frequently intricate and nonlinear. Furthermore, in contrast to traditional regression models, machine learning techniques can frequently produce more dependable predictions by learning directly from the data. Consequently, ML approaches can offer an option for traditional methods, with the potential to enhance reliability of forest management practices (Breiman, 2001; Chen and Guestrin, 2016; Sakici and Ozdemir, 2018; Özcelik et al., 2019; Senyurt and Ercanli, 2019; Bayat et al., 2020; Diamantopoulou and Georgakis, 2024).
The aim of this study is to improve the accuracy and efficiency of stem taper predictions by developing models that integrate novel machine learning techniques. While the empirical data were collected from Pinus brutia trees in the Eastern Mediterranean of Türkiye, the methodological focus of this research is broader. Given the increasing global interest in machine learning applications in forest modeling and the need for more flexible and accurate taper models across species and regions, this study explores the applicability of advanced algorithms such as XGBoost and RF to stem taper modeling. These models were developed and evaluated to demonstrate the potential of machine learning approaches as effective alternatives to traditional parametric models, with implications extending beyond the local context.
2 Materials and methods
2.1 Data
The necessary sample tree data for developing the stem taper models were collected from pure Pinus brutia stands at the Karaisalı Forest Enterprise, Adana Regional Directorate of Forestry (Figure 1). A total of 121 sample trees were chosen to accurately reflect the distribution of trees within the population based on their diameter and height classes in the study area. In order to obtain the data, sample trees were selected based on the criteria of being alive, healthy, with a stable top and a single stem, and were felled at stump height (0.3 m). The diameter at the stump (cm), the diameter at breast height (D, cm) and total height (H, m) were measured on the felled sample trees. Subsequently, at intervals of 1 meter starting from a height of 2.30 m (2.30 m, 3.30 m, 4.30 m, and so on), the stem diameters (cm) were measured. The measurements of both the D and stem diameters were taken twice at a 90-degree angle, and the averages were recorded. A total of 1933 stem diameter measurements were taken from the 121 sample trees. Approximately 75% of the sample trees (90 trees, 1,472 diameter measurements) were randomly selected to serve as the model data set, while the remaining 25% (31 trees, 461 diameter measurements) were reserved for model validation. To ensure independence between training and testing datasets and to minimize potential within-tree autocorrelation effects, the data were split at the tree level. Consequently, no individual tree contributed measurements to both the model development and validation sets. This group-based partitioning strategy helps provide a more reliable evaluation of model performance on unseen trees. Summary statistics for both data sets are presented in Table 1. A plot of relative height against relative diameter is presented in Figure 2.
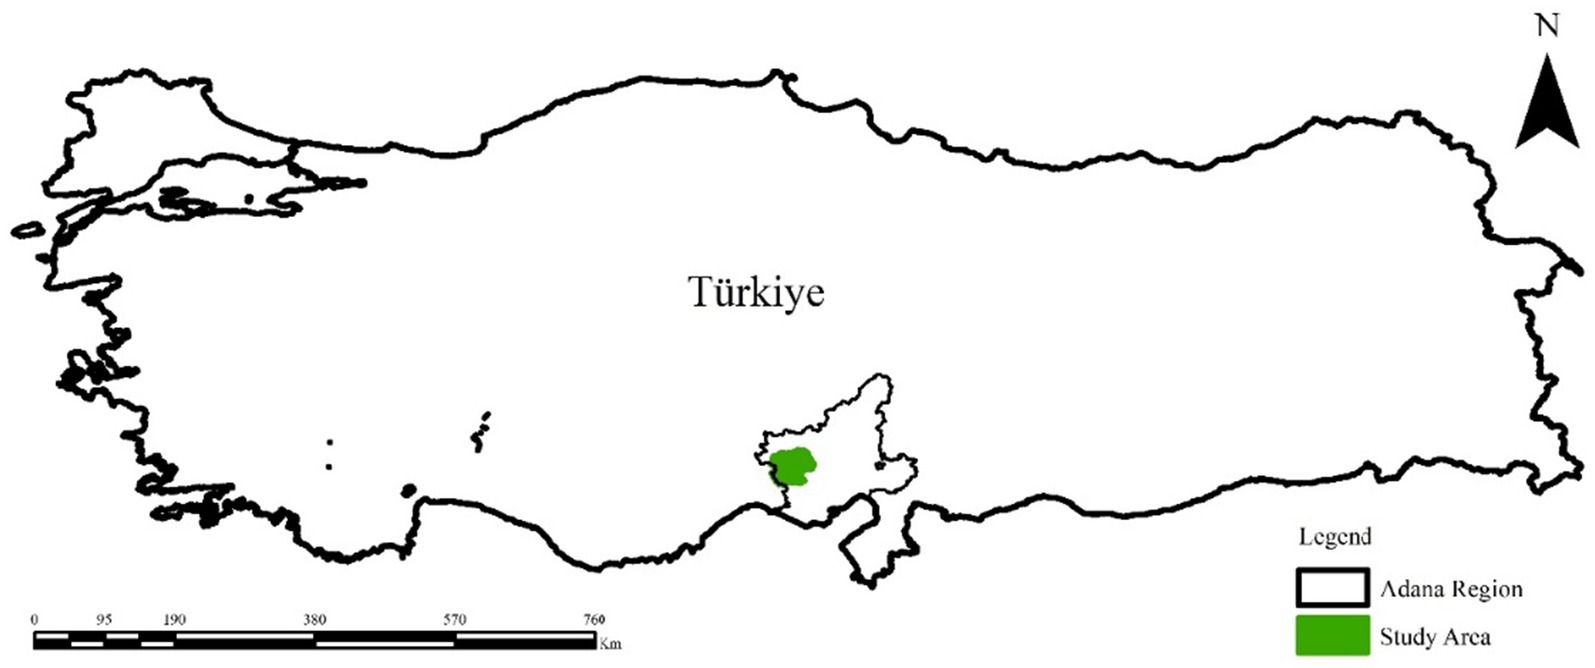
Figure 1. Study area.
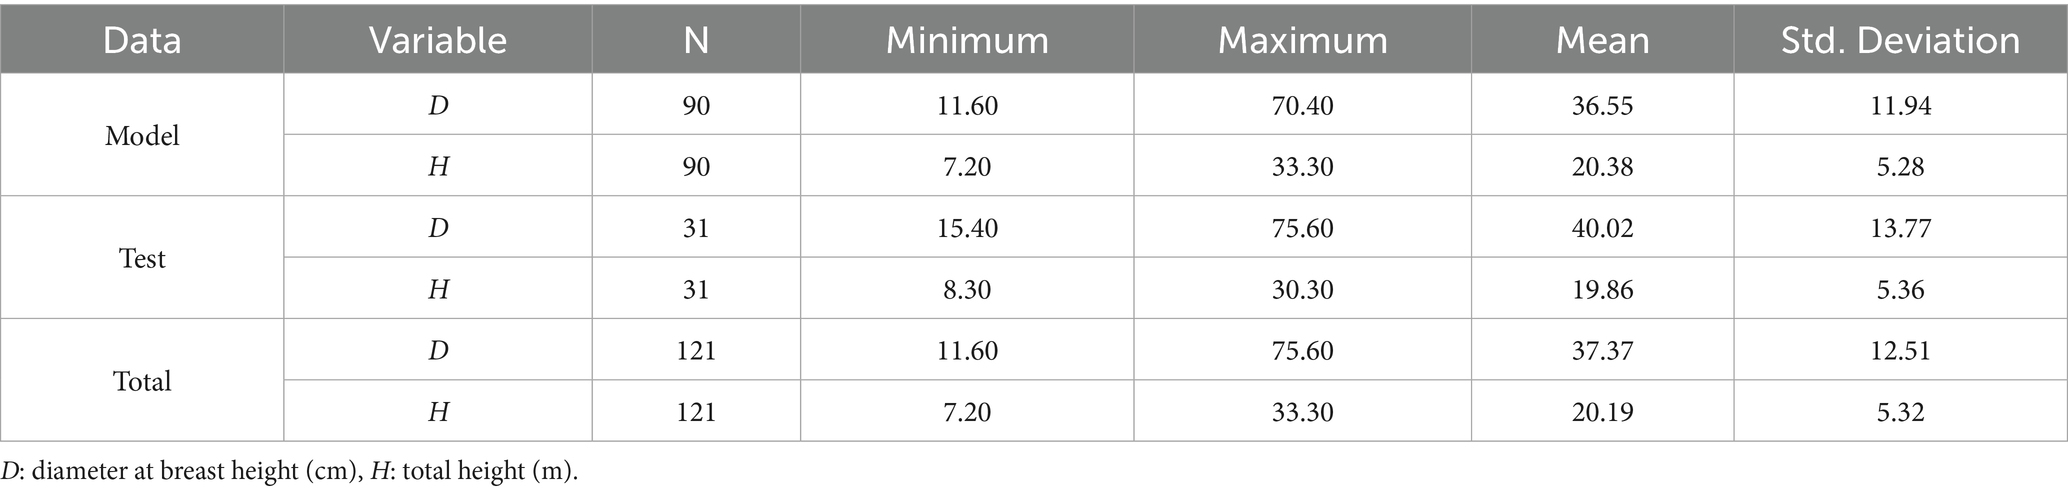
Table 1. Descriptive statistics for the sample trees.
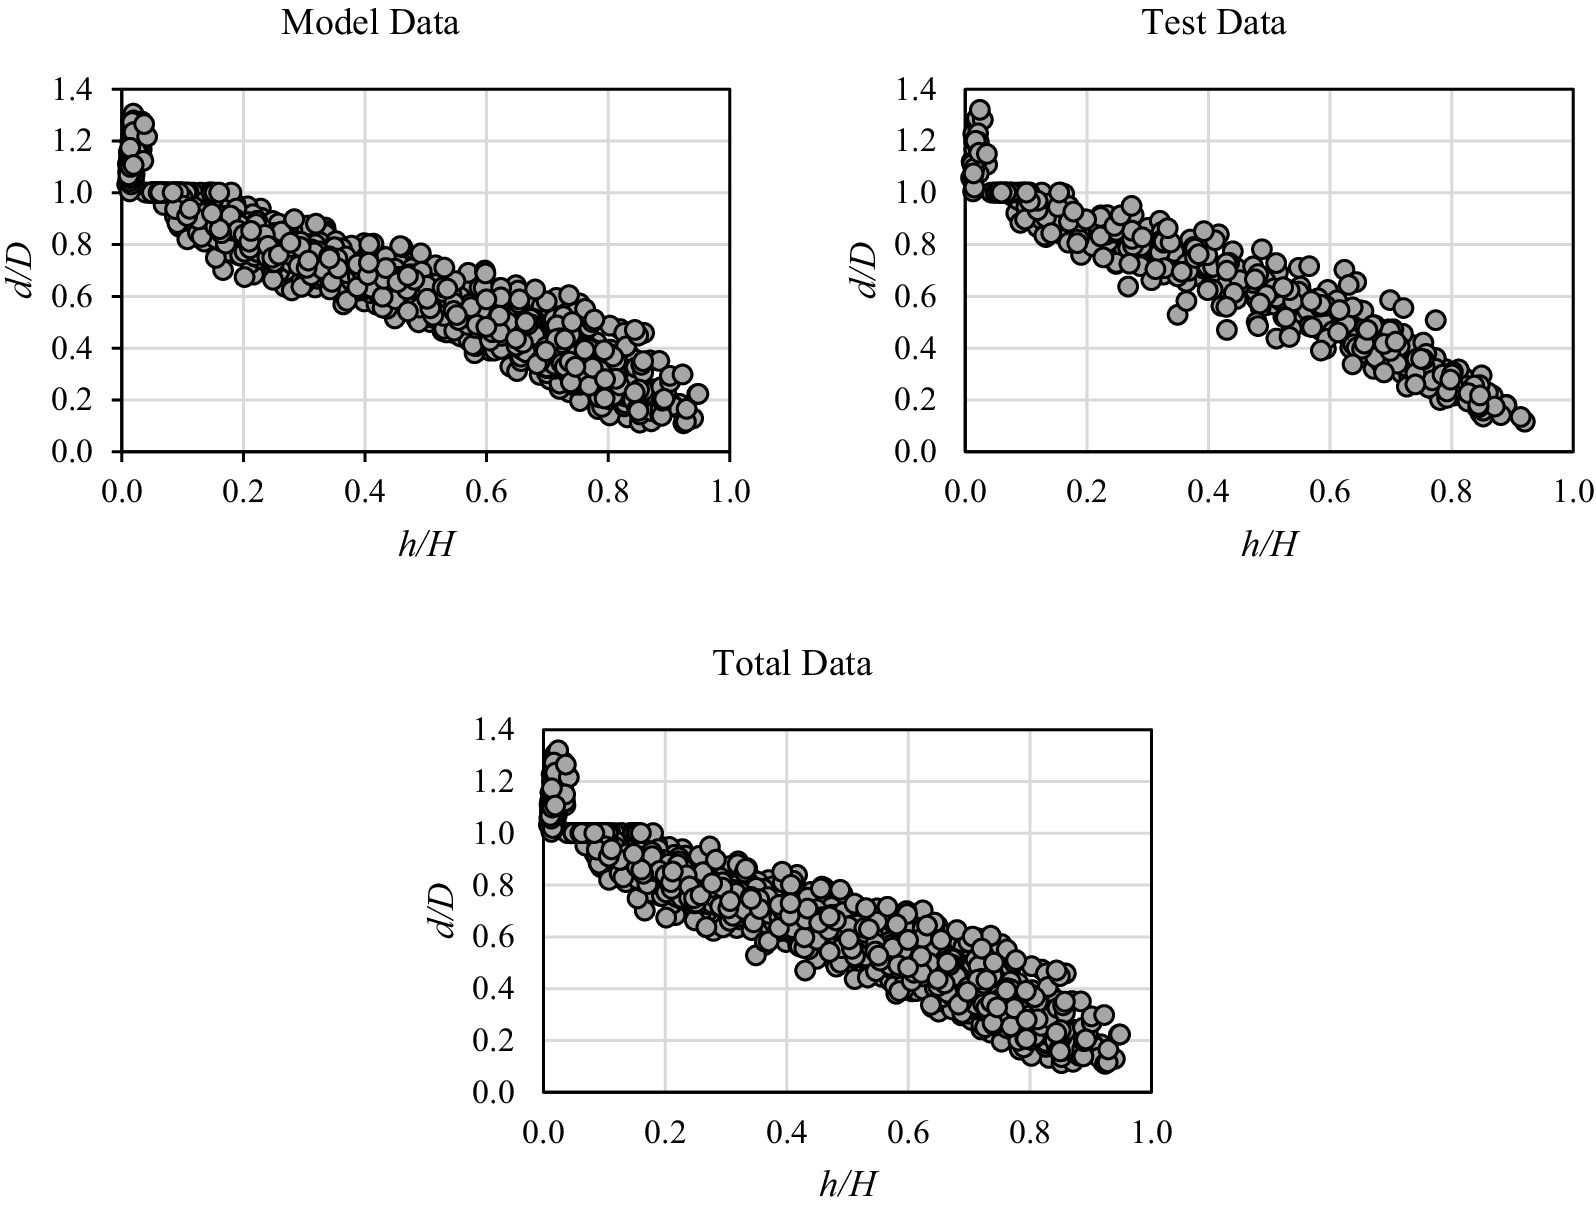
Figure 2. Plots of relative heights against relative diameters.
2.2 Data analysis
2.2.1 Regression approach for the stem taper model
Segmented taper equations conceptualize the tree stem as a composite of three geometric shapes—neiloid, paraboloid, and cone—each representing the lower, middle, and upper sections of the stem, respectively. These models are particularly effective in capturing abrupt geometric transitions along the stem profile (Max and Burkhart, 1976; Sakici et al., 2008). The variable-exponent taper equations offer certain advantages, including a straightforward structure and ease of convergence in parameter estimation methods (Perez et al., 1990; Newnham, 1992; Bi, 2000). Furthermore, several studies have highlighted its superior fit and appropriateness for analyzing tree stem shape (Özçelik and Crecente-Campo, 2016; Tang et al., 2017; Xu et al., 2022). In addition to these groups, dynamic model (Garcia, 2015) has been employed in developing taper equations. Consequently, this study utilizes one segmented taper model, four commonly used variable-exponent taper equations, and one dynamic taper model to estimate the stem diameter of Brutian pine (Table 2). The common nonlinear least squares method was employed for regression fitting on the candidate equations using R software, and the best taper equation was chosen according to the goodness-of-fit statistics.
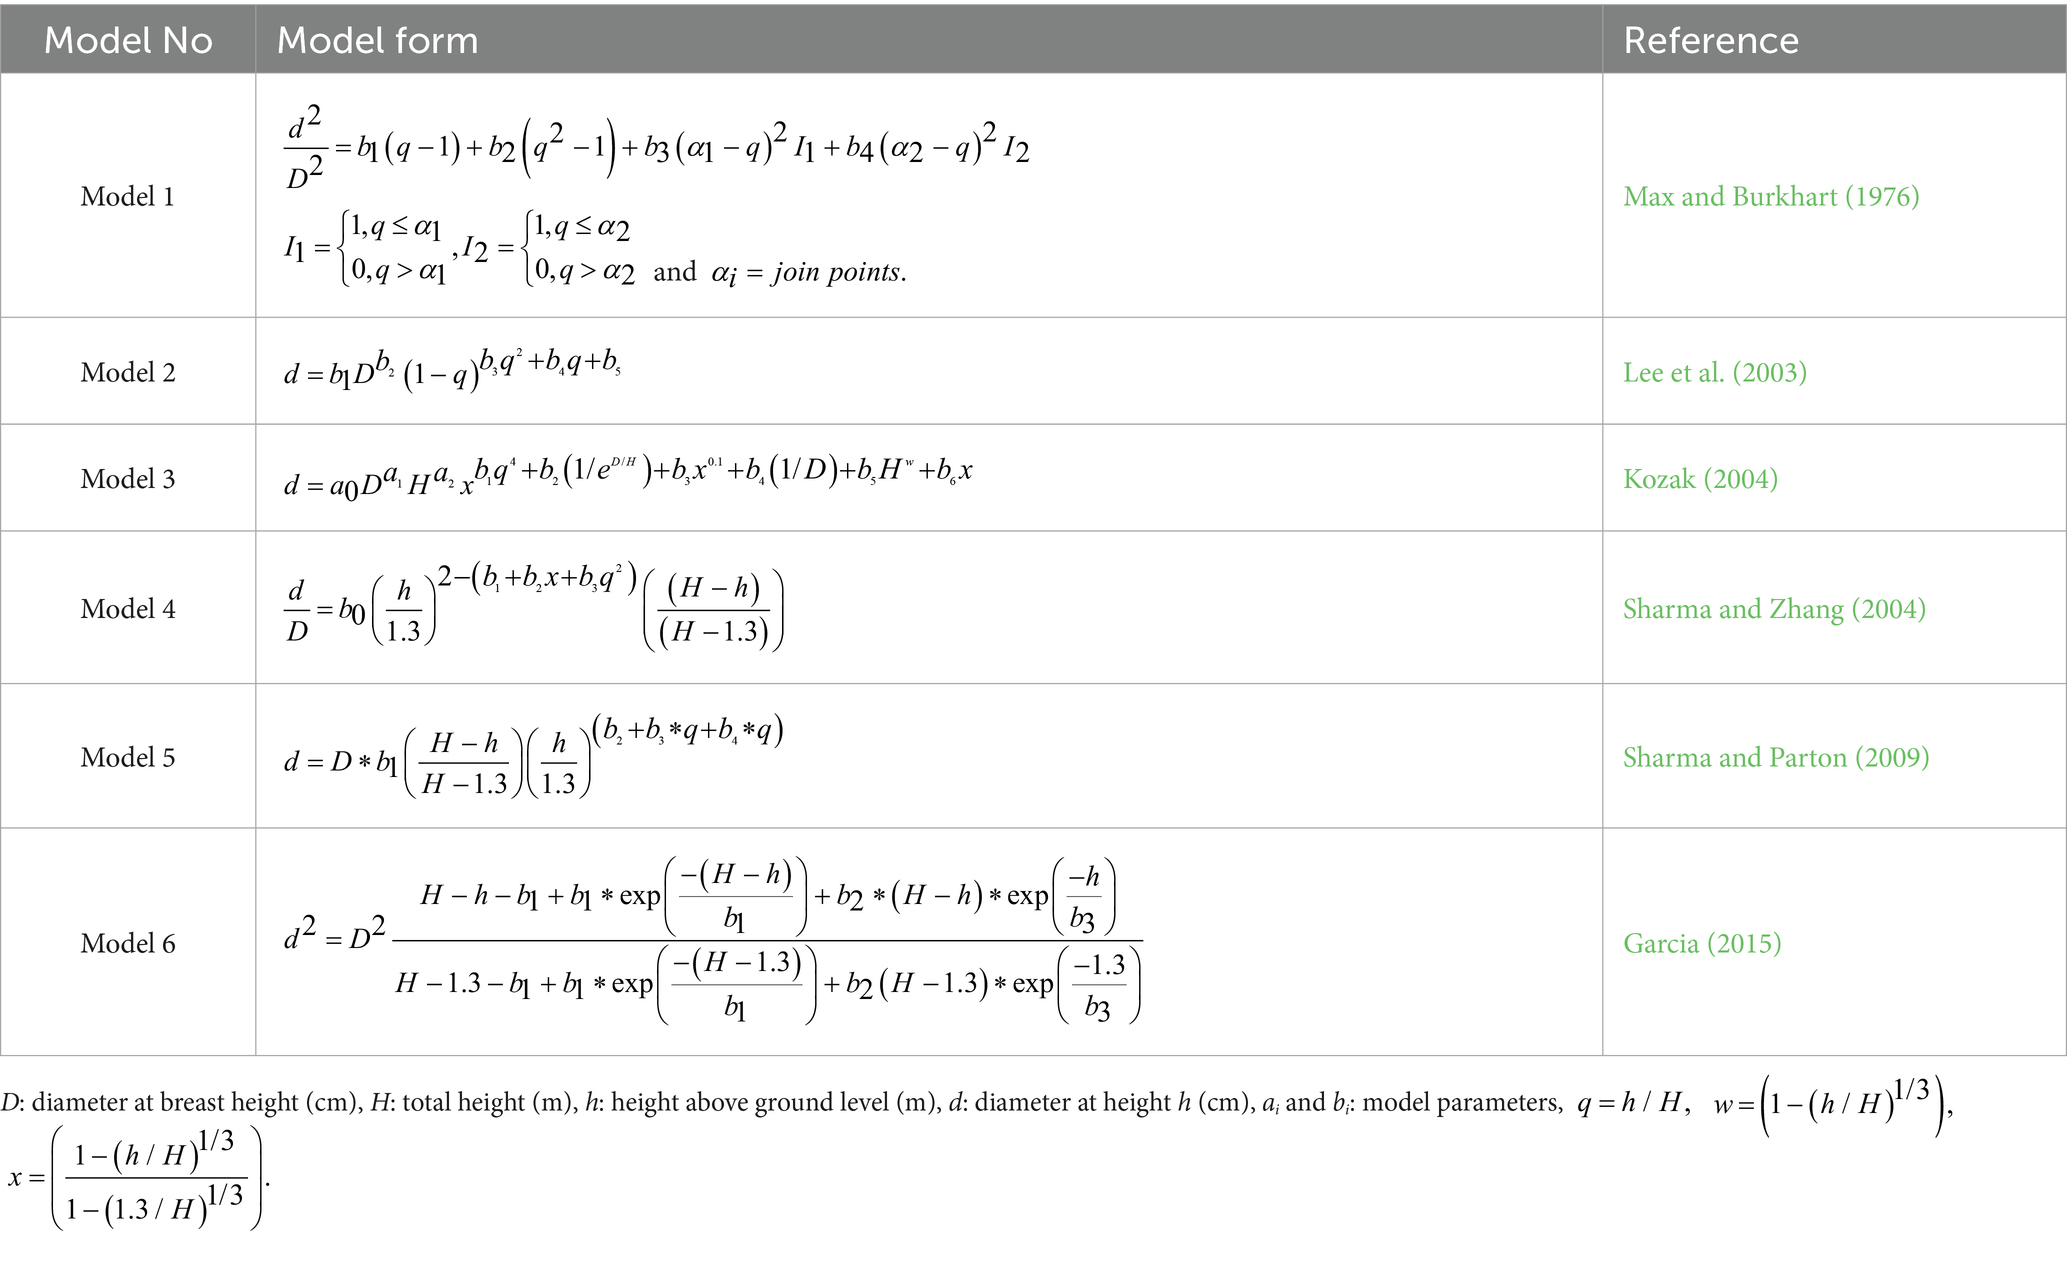
Table 2. Candidate stem taper models.
2.2.2 Machine learning approach for the stem taper model
2.2.2.1 Random Forest (RF) and extreme gradient boosting modeling (XGBoost)
RF is an ensemble learning approach that enhances the performance of a set of estimators, specifically decision trees. The overall prediction is derived by taking the mean of the results from all individual decision trees in the model. The procedure of inputting the training data into the system adheres to the bagging technique, commonly referred to as “bootstrap aggregation.” In this methodology, several training subsets are created from the original dataset, enabling each subset to train a distinct estimator. As a result, the training data is partitioned into bootstrap samples with replacement, alongside the out-of-bag data used as a form of validation. This process improves the model’s robustness. Subsequently, each estimator expands by iteratively adding branches and nodes until it meets the predefined depth stopping criterion (Breiman, 2001; Breskvar et al., 2018; Diamantopoulou and Georgakis, 2024). To efficiently train the RF model, the primary hyperparameters that require tuning include the number of decision trees in the forest (ntree), the number of features randomly selected at each split (mtry), the maximum depth (maxnodes) of the decision trees, and the minimum number of samples required to split an internal node (nodesize).
XGBoost is an ensemble learning technique rooted in boosting, where a series of weak learners, usually decision trees, are trained in a sequential manner. Each following tree seeks to address the mistakes of its predecessor by placing more emphasis on the instances that were inaccurately predicted by earlier trees. Besides reducing the training error, the model incorporates a regularization term to control its complexity and mitigate the risk of overfitting (Chen and Guestrin, 2016; Diamantopoulou and Georgakis, 2024). To guarantee the performance and robustness of the XGBoost model, it is essential to finely tune several critical hyperparameters. These are: (1) the number of decision trees (nrounds), (2) the number of branches that determine the depth of each tree (max_depth), (3) the learning rate (eta), (4) the minimum loss reduction parameter required for splitting a node (gamma), (5) proportion of column subsamples to build each tree (colsample_bytree), (6) a parameter regulating the splitting to child node (min_child_weight), (7) the fraction of randomly selected training set instances (subsample). The set of necessary hyperparameters was optimized through the application of the grid-search method combined with 5-fold cross-validation to ensure robust parameter selection and prevent overfitting. The machine learning techniques outlined previously were executed using the randomForest and xgboost libraries in R software.
2.3 Model evaluation
The performance of the chosen models was assessed by examining the discrepancies between the predicted and observed values. The evaluation of the models was conducted by employing the coefficient of determination (R2), root mean square error (RMSE), mean square error (MSE), bias, and also mean absolute error (MAE). The corresponding criteria equations (Equations 1–5) are provided below.
The coefficient of determination (R2):
Root Mean Square Error (RMSE):
Mean Square Error (MSE):
Bias:
Mean absolute error (MAE):
where; , represent the estimated, measured and average values of the dependent variable, n the number of observations, respectively.
Based on the statistical criteria outlined in the aforementioned equations, the models exhibiting the highest coefficient of determination (R2) and the lowest error metrics (RMSE, MSE, MAE, Bias) were identified. The relative ranking approach proposed by Poudel and Cao (2013) was applied to select the most optimal model. Additionally, the assumption of homoscedasticity and the normality of the residuals was investigated by plotting the predicted diameter values versus the residuals. A paired sample t-test was conducted to determine if there were statistically significant differences between observed and predicted values. For the machine learning models (RF and XGBoost), the consistency of error distributions between training and testing datasets was also examined to assess potential overfitting, with similar performance indicating good generalization capability and significant performance differences suggesting overfitting.
3 Results
The nonlinear least squares method was employed to fit six taper equations (Table 3). The performance of these models for predicting stem diameter was evaluated using 1,472 measurements across 90 trees, based on R2, MSE, bias, and RMSE metrics. The rankings for each model, based on these evaluation criteria, are presented (Table 4). The Kozak (2004) model outperformed all others, achieving the highest R2 (0.968), the lowest error values (MSE = 4.346, RMSE = 2.085), making it the most reliable for diameter estimation. The Lee et al. (2003) and Sharma and Parton (2009) models also performed well, ranking second and third, with minimal differences in their accuracy and error metrics. In contrast, the Max and Burkhart (1976), Sharma and Zhang (2004), and Garcia (2015) models ranked lower, exhibiting higher error rates, indicating lower effectiveness for the given dataset.
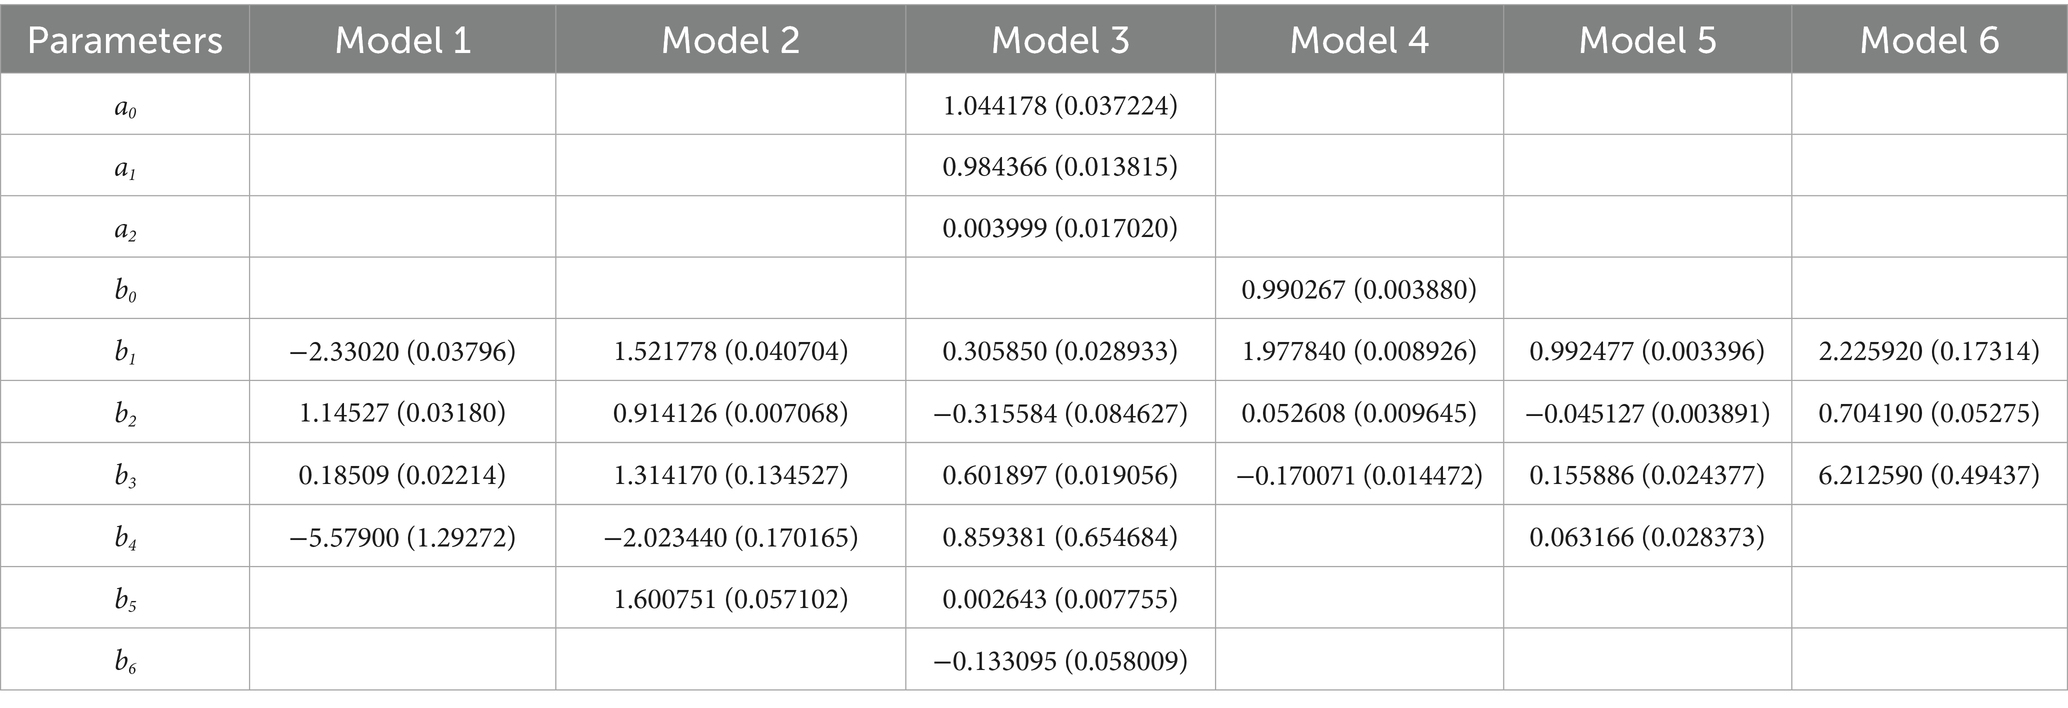
Table 3. The parameter estimates and standard errors of models.
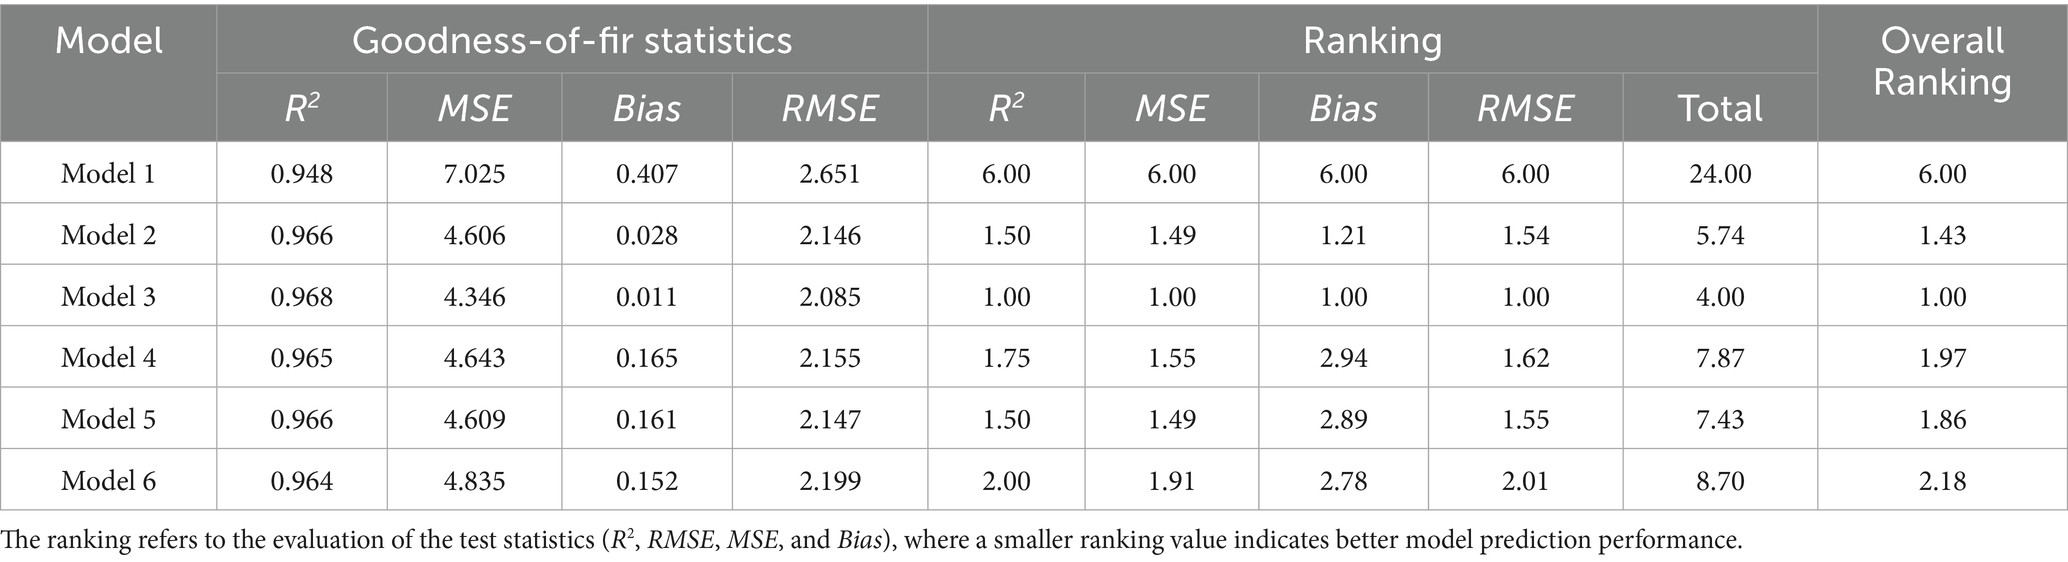
Table 4. The statistical criteria and ranks of models.
The error distributions for the nonlinear models are shown in Figure 3. The results show that the errors exhibit a random distribution. This random pattern indicates that the model does not exhibit any systematic bias, confirming good model fit to the observed data. This random distribution of residuals supports the assumption of homoscedasticity, indicating that the variance of the errors remains constant across all levels of the independent variables.
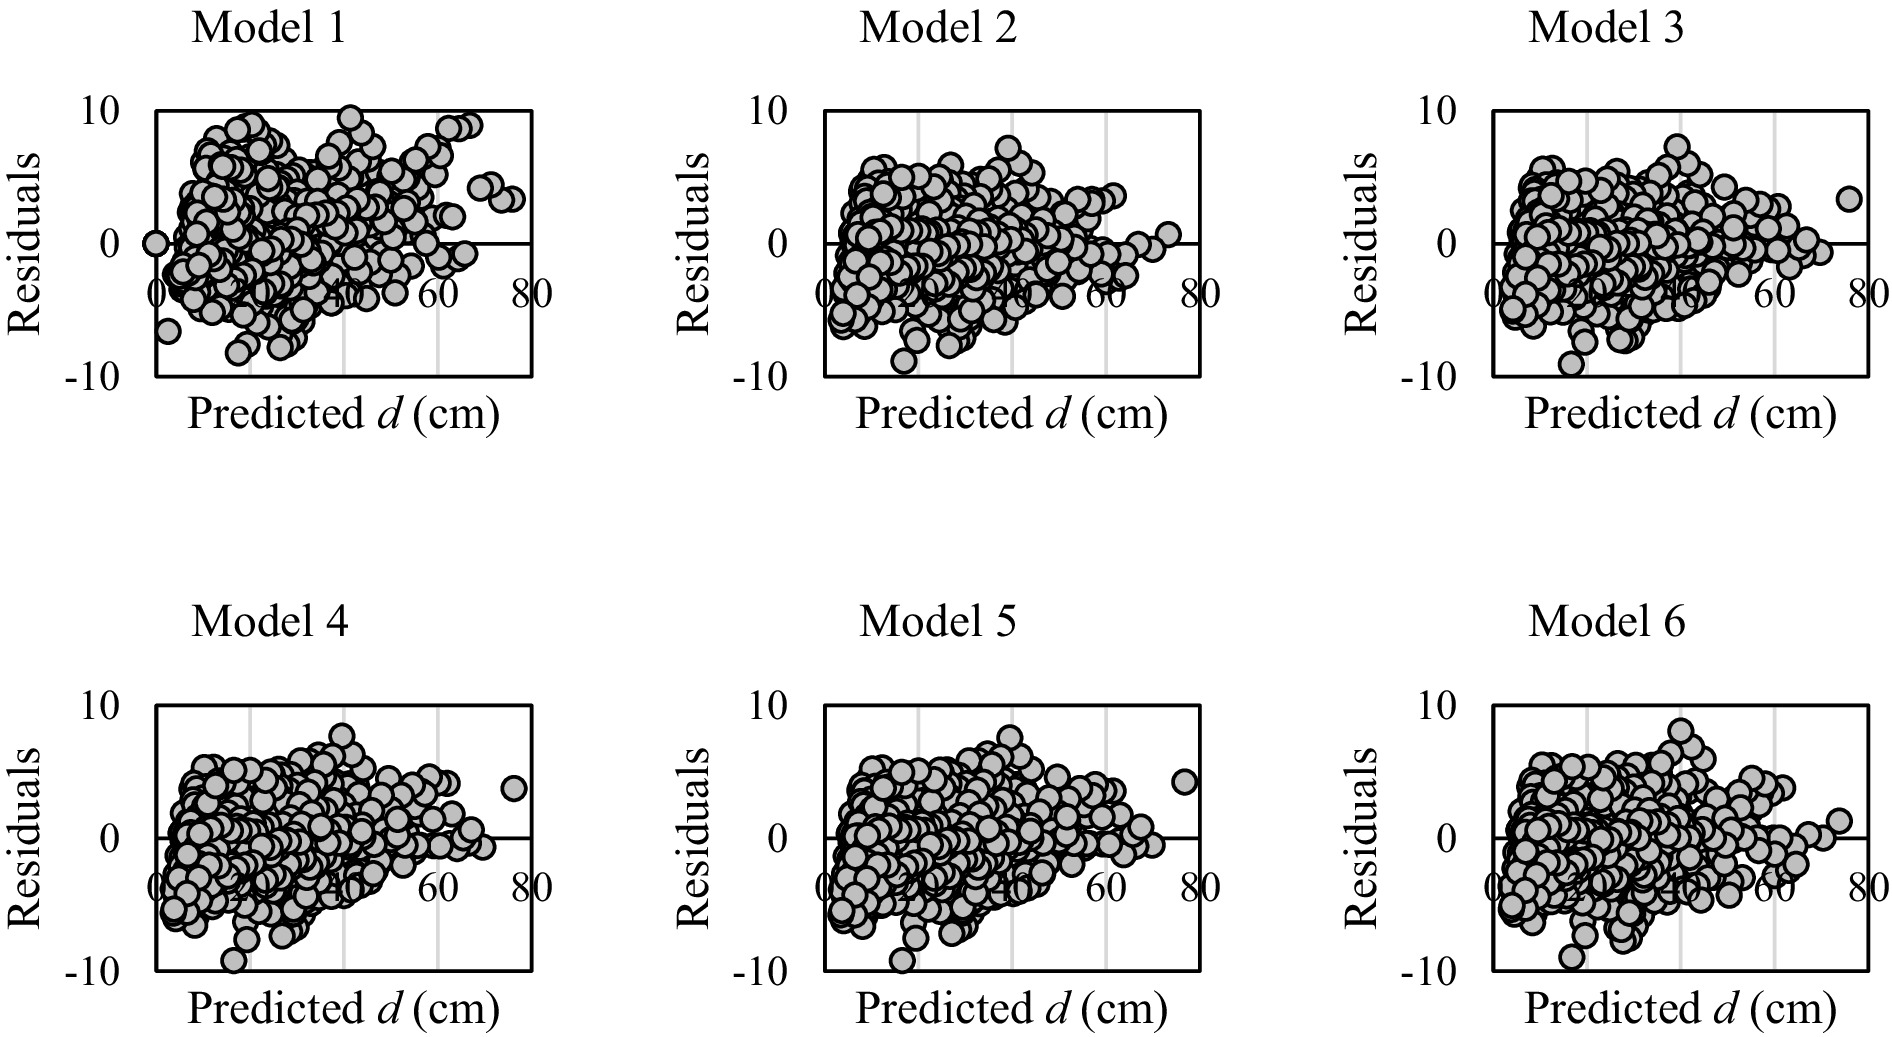
Figure 3. Residuals for stem taper models.
To obtain high-quality results, the ML models were subjected to optimal hyperparameter tuning. For each modeling approach, each hyperparameter was evaluated within a defined value range with specific increments. A grid search approach combined with 5-fold cross-validation was employed to identify the optimal hyperparameter combination, as shown in Table 5. The objective of this tuning process was to determine the specific set of hyperparameters that best fit the observed data values (based on R2, RMSE, MAE minimization).
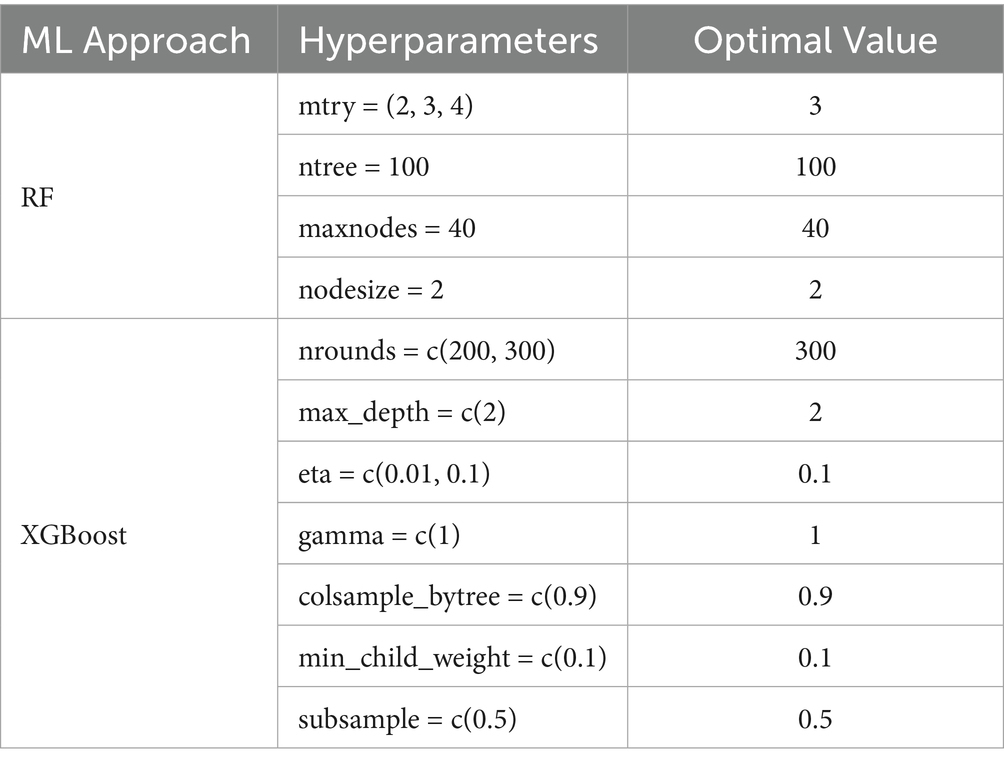
Table 5. The optimal hyperparameter combination for ML approach.
Based on the comparison of the models presented in Table 6, the XGBoost model shows an overall superior performance. The R2, RMSE and MAE values indicate that XGBoost produces considerably more accurate and reliable predictions than the other models. Specifically, the lower MAE and RMSE values indicate that XGBoost produces predictions with minimal error, and the low error value indicates that the model does not exhibit systematic errors and therefore produces unbiased results. The RF model also performs well, with an R2 value similar to that of the Kozak (2004) model. However, compared to XGBoost, RF has slightly higher RMSE and MAE values. Nonetheless, the RF model remains a strong alternative, demonstrating high accuracy and low bias. Therefore, while XGBoost may be preferred when higher prediction accuracy is required, RF remains a valuable model for a variety of scenarios. The Kozak (2004) model, although having a lower R2 value than the other two models, still shows considerable predictive accuracy. However, its RMSE and MAE values are higher than those of XGBoost and RF, indicating that it provides less accurate predictions. Nevertheless, the Kozak (2004) model remains a viable alternative in certain applications.
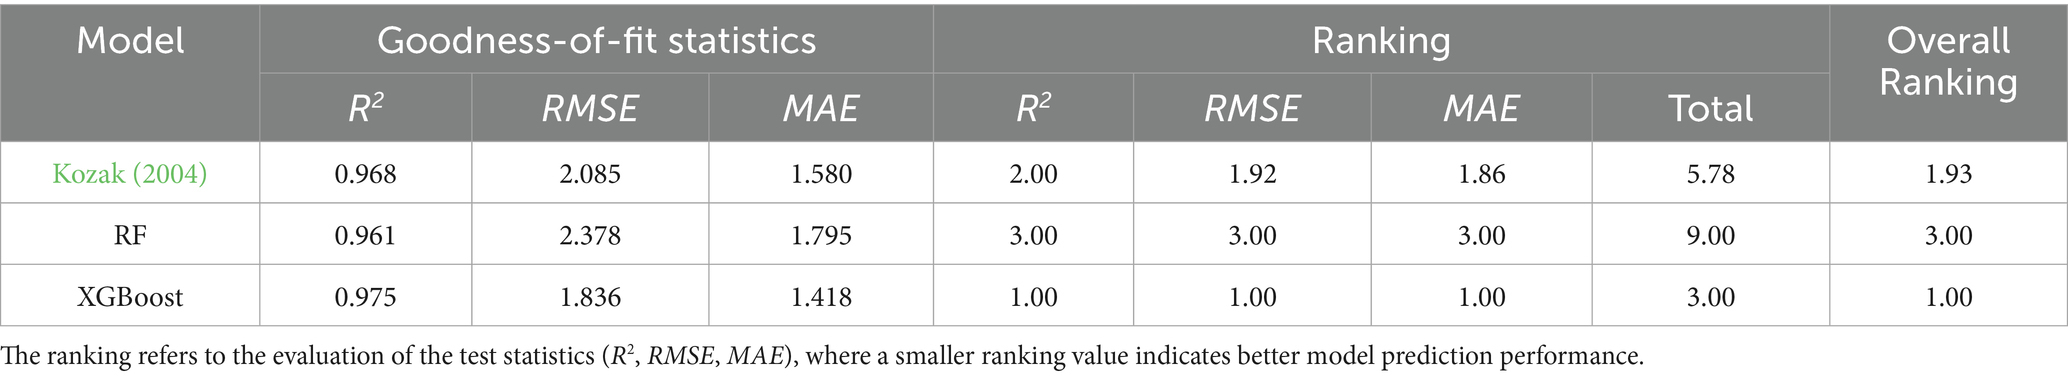
Table 6. The fitting statistics for stem taper models based on various modeling approaches.
The paired sample t-test results revealed significant differences in model performance regarding prediction bias. For the Kozak taper model and XGBoost, no statistically significant differences were found between observed and predicted diameter values (p > 0.05), indicating that these models provided unbiased predictions. However, the RF model showed statistically significant differences between observed and predicted values (p < 0.05), suggesting the presence of systematic bias in RF predictions.
The error distributions of the machine learning models (RF and XGBoost) for the training and test data are shown in Figure 4. The results show that the error distributions do not exhibit any trends and remain relatively low across both datasets. Importantly, both models demonstrated consistent performance between training and test datasets, indicating good generalization capability with no evidence of overfitting. In particular, the XGBoost model demonstrated superior performance with more consistent and lower error distributions compared to RF.
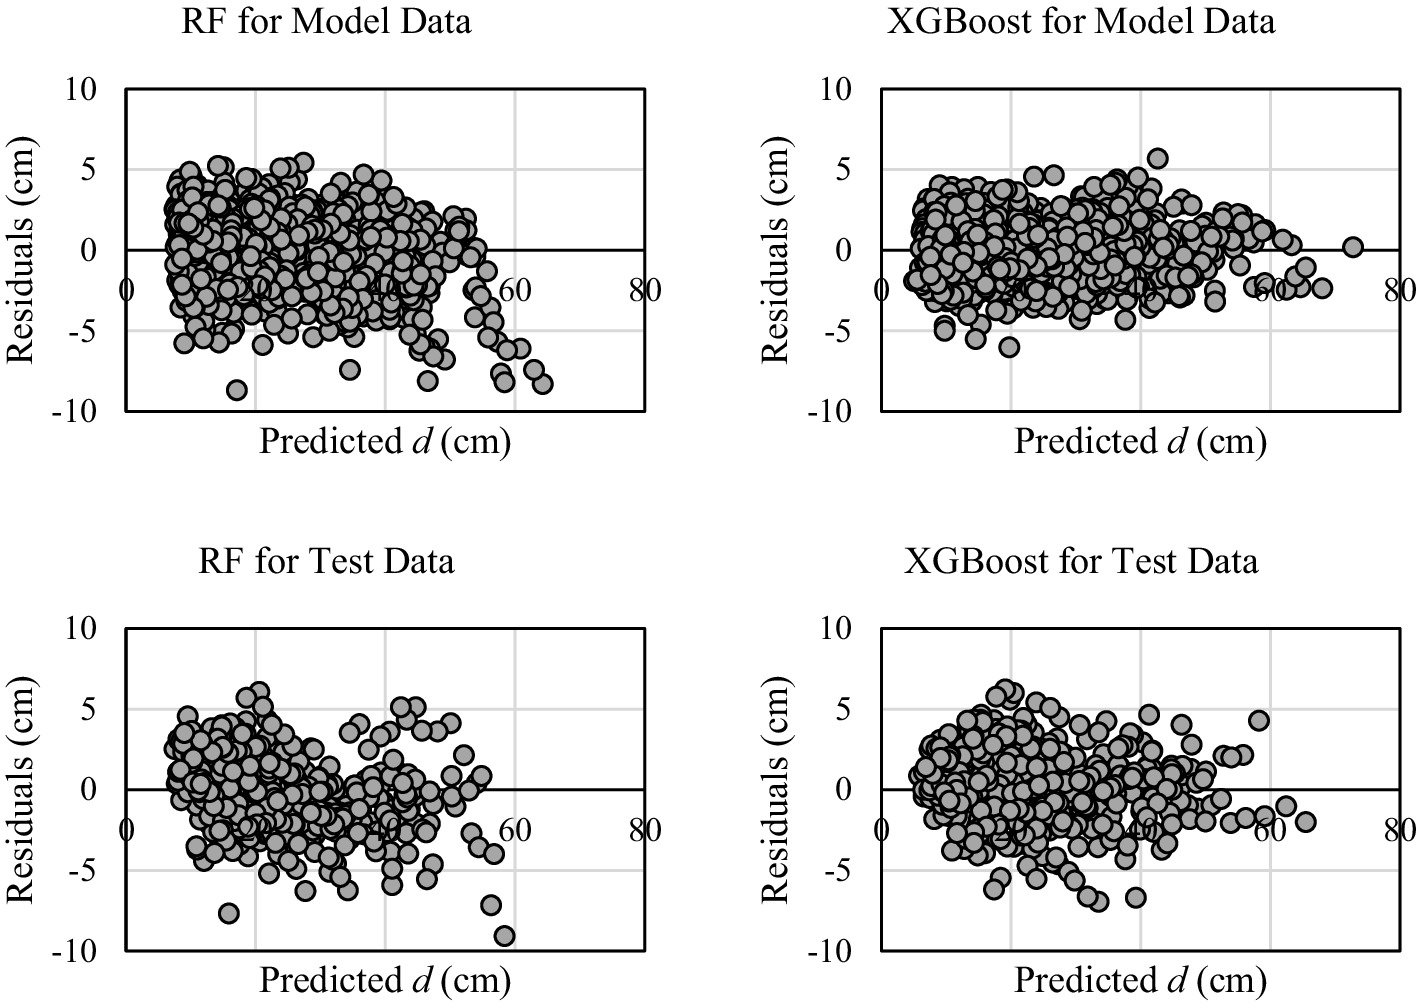
Figure 4. Residuals for ML models.
The coefficient of determination and error metrics for the most successful nonlinear model, Kozak (2004), and the machine learning models are presented in the graphs in Figure 5. As shown in Figure 5, the coefficient of determination and error metrics for the Kozak (2004) model and machine learning models clearly demonstrate that XGBoost achieves superior performance in both coefficient of determination and error metrics.
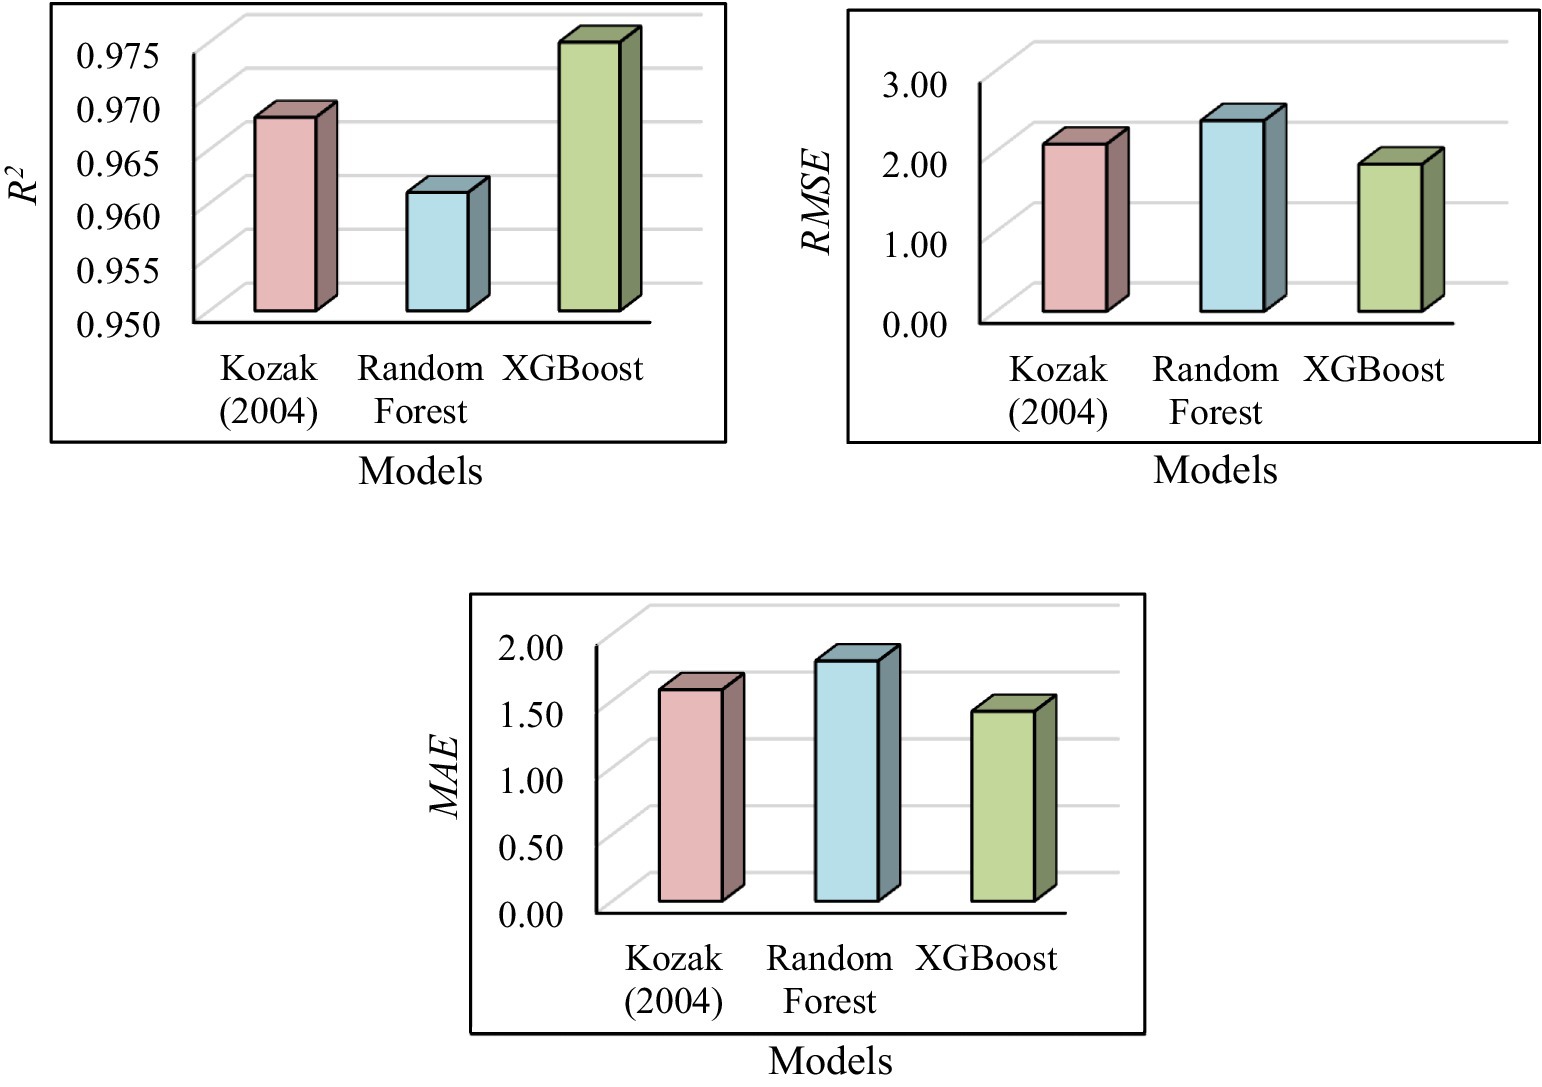
Figure 5. Statistical criteria for models.
4 Discussion
In this study, the dataset of 1,472 measurements from 90 trees provided sufficient data for robust model development, enabling effective capture of underlying relationships between variables. Kozak (1988) and in particular ML models demonstrated significant potential in accurately predicting stem diameter. The Kozak (2004) model achieved strong performance with an R2 value of 0.968, only marginally lower than XGBoost approach. While its error metrics (MSE, RMSE, and MAE) were higher than XGBoost but lower than RF, the differences were relatively modest. The Kozak model’s relatively simpler parametric form, with fewer parameters to tune, could explain its slightly lower performance in this context. Given its competitive performance and simpler structure, the Kozak model remains an attractive option for applications where model interpretability and theoretical foundation are prioritized over marginal accuracy improvements. Notably, Ko et al. (2025) reported even superior performance of the Kozak model compared to machine learning approaches in their study of Pinus densiflora, suggesting that the relative performance of different modeling approaches may vary across species and datasets.”
The results of this study highlight the superior performance of the XGBoost model in predicting tree stem diameter compared to traditional and machine learning-based models. The comparative analysis reveals that XGBoost achieves the highest coefficient of determination (R2), the lowest error values (MSE, RMSE, and MAE), indicating superior predictive accuracy. The analysis of error distributions (Figure 4) further supports the model’s effectiveness. The absence of obvious trends in the residuals and the relatively low error values indicate that XGBoost fits the data well, with no systematic biases or patterns that would suggest prediction errors. The robustness of XGBoost is consistent with its reported success in various domains, including forestry and ecological modeling, where complex, high-dimensional relationships are common Chen and Guestrin (2016). The model’s ability to handle non-linearity and interactions between predictors without requiring explicit specification of such relationships is one of the key reasons behind its superior performance. Additionally, XGBoost’s effectiveness may also be attributed to its optimization capabilities, such as regularization and gradient boosting, which help prevent overfitting and improve generalization on unseen data (Chen and Guestrin, 2016). The superior performance of XGBoost over RF in this study is consistent with findings from Diamantopoulou and Georgakis (2024), who also reported better performance of XGBoost compared to RF in European Black Pine stem volume prediction.
In comparison, the RF model, while still demonstrating reasonable predictive capability, ranked third in overall performance. Although it showed competitive results, its R2 value was slightly lower than both XGBoost and the Kozak (2004) model, with correspondingly higher RMSE and MAE values. The consistent performance of RF in various datasets has been well-documented in tree growth and forestry modeling and ecological applications (Breiman, 2001). Additionally, RF often provides faster training times and requires less hyperparameter optimization, making it an appealing choice when rapid model development is needed (Cutler et al., 2007).
Hyperparameter tuning is critical for optimal model performance. Both XGBoost and RF algorithms require careful tuning of their hyperparameters to achieve optimal performance (Hastie et al., 2009; Chen and Guestrin, 2016). For XGBoost, the process of hyperparameter optimization is particularly complex, as it involves the adjustment of numerous parameters, including max_depth, nrounds, and eta, among others. As noted in previous studies (Diamantopoulou and Georgakis, 2024), hyperparameter tuning for XGBoost is both time-consuming and resource-intensive, requiring exhaustive techniques such as grid search. Grid search systematically tests all possible combinations of parameters within specified ranges, but it can be computationally expensive, especially for large datasets. RF, by comparison, offers a relatively simpler approach to hyperparameter optimization, requiring fewer parameters to be tuned, such as ntree and mtry. However, while both models handle nonlinear relationships effectively, XGBoost’s gradient boosting approach may provide superior performance in capturing complex patterns and interactions, as demonstrated in the results of this study.
An important aspect of this study was the evaluation of error distributions, which revealed that all models, including XGBoost, RF, and the Kozak (2004) model, exhibited random residual patterns, supporting the assumption of homoscedasticity (Figures 3, 4; Montgomery et al., 2021). This was further confirmed using an independent test dataset, where the residuals again showed no systematic trends (Figure 4). The consistent and patternless residual distributions across both training and validation datasets indicate that the ML models in particular capture underlying data structures effectively. These results suggest that overfitting is unlikely and support the generalization capability of the models when applied to new data.
Each method has distinct strengths and limitations. XGBoost, recognized for its superior performance with complex datasets, effectively combats overfitting by incorporating regularization terms, thereby minimizing model variance. However, developing a high-performance XGBoost model requires challenging and time-consuming hyperparameter optimization, which can be particularly demanding when working with large or highly specific datasets. In contrast, RF provides a more user-friendly machine learning approach that is relatively simpler to optimize and efficient in controlling overfitting. However, RF may struggle to identify complex nonlinear relationships often present in real-world datasets. As noted by Diamantopoulou and Georgakis (2024), while XGBoost’s hyperparameter tuning process is critical for optimal performance but resource-intensive, RF’s limitation in capturing data complexity could hinder its ability to fully represent intricate patterns. Therefore, while both models offer valuable contributions to predictive modeling, careful consideration of dataset characteristics and computational resources is crucial when selecting the most appropriate approach.
Model selection should consider specific application requirements and constraints. While XGBoost demonstrates superior overall performance, Random Forest offers advantages in computational efficiency and can handle high-dimensional data without extensive preprocessing. However, the decision to adopt machine learning approaches should not be made solely based on predictive performance. The interpretability advantage of traditional models like Kozak (2004) remains valuable in contexts where simpler, more interpretable models are required, especially in practical applications with limited computational resources. Furthermore, the computational complexity and hyperparameter optimization requirements of ML models may present barriers for smaller forestry operations.
These findings highlight the importance of context-dependent model selection in forest biometrics. The choice of modeling approach should consider trade-offs between accuracy, implementation complexity, and interpretability, with implications extending beyond Pinus brutia to other species with comparable stem forms and growth patterns. Future research could enhance model performance by incorporating additional environmental variables or tree- and stand-specific characteristics to provide broader comparative insights across different data structures and forest conditions.
5 Conclusion
In conclusion, this study highlights the efficacy of machine learning models, particularly XGBoost, for predicting stem diameter in Pinus brutia stands. The XGBoost model outperformed both traditional nonlinear taper model and RF in terms of prediction accuracy and error metrics achieving the highest R2 value. While RF also showed competitive performance, it exhibited systematic bias in predictions, limiting its reliability. The Kozak (2004) model, although showing lower accuracy compared to XGBoost, demonstrated unbiased predictions and continues to be valuable where simplicity and interpretability are prioritized. The comparative evaluation of traditional taper models and machine learning techniques offers insights that extend beyond the local context. In particular, the findings highlight the potential applicability of machine learning-based taper modeling to a wide range of forest ecosystems and species with similar structural characteristics.
These findings demonstrate the potential of machine learning techniques for improving forest inventory accuracy and supporting more precise forest management decisions. As machine learning techniques and datasets continue to evolve, hybrid models and the integration of additional variables such as crown characteristics, site index, and stand density may provide further improvements in stem taper prediction.
Data availability statement
The original contributions presented in the study are included in the article/supplementary material, further inquiries can be directed to the corresponding author/s.
Author contributions
FS: Software, Formal analysis, Visualization, Writing – original draft, Writing – review & editing.
Funding
The author(s) declare that no financial support was received for the research and/or publication of this article.
Acknowledgments
I would like to express my sincere gratitude to the personnel of the Karaisalı Forest Enterprise for their valuable assistance in obtaining the data used in this study.
Conflict of interest
The author declares that the research was conducted in the absence of any commercial or financial relationships that could be construed as a potential conflict of interest.
Generative AI statement
The author(s) declare that no Gen AI was used in the creation of this manuscript.
Publisher’s note
All claims expressed in this article are solely those of the authors and do not necessarily represent those of their affiliated organizations, or those of the publisher, the editors and the reviewers. Any product that may be evaluated in this article, or claim that may be made by its manufacturer, is not guaranteed or endorsed by the publisher.
References
Bayat, M., Bettinger, P., Heidari, S., Henareh Khalyani, A., Jourgholami, M., and Hamidi, S. K. (2020). Estimation of tree heights in an uneven-aged, mixed Forest in northern Iran using artificial intelligence and empirical models. Forests 11:324. doi: 10.3390/f11030324
Bi, H. (2000). Trigonometric variable-form taper equations for Australian eucalypts. For. Sci. 46, 397–409. doi: 10.1093/forestscience/46.3.397
Breskvar, M., Kocev, D., and Džeroski, S. (2018). Ensembles for multi-target regression with random output selections. Mach. Learn. 107, 1673–1709. doi: 10.1007/s10994-018-5744-y
Castedo-Dorado, F., Gómez-García, E., Diéguez-Aranda, U., Barrio-Anta, M., and Crecente-Campo, F. (2012). Aboveground stand-level biomass estimation: a comparison of two methods for major forest species in Northwest Spain. Ann. For. Sci. 69, 735–746. doi: 10.1007/s13595-012-0191-6
Chen, T, and Guestrin, C (2016). “XGBoost: a scalable tree boosting system.” In Proceedings of the KDD ‘16: 22nd ACM SIGKDD international conference on knowledge discovery and data mining, San Francisco, CA, USA; pp. 785–794.
Corral-Rivas, J. J., Barrio-Anta, M., Aguirre-Calderón, O. A., and Diéguez-Aranda, U. (2007). Use of stump diameter to estimate diameter at breast height and tree volume for major pine species in El Salto Durango (Mexico). Forestry 80, 29–40. doi: 10.1093/forestry/cpl048
Crecente-Campo, F., Rojo Alboreca, A., and Diéguez-Aranda, U. (2009). A merchantable volume system for Pinus sylvestris L. in the major mountain ranges of Spain. Ann. For. Sci., 66–808. doi: 10.1051/forest/2009078
Cutler, D. R., Edwards, T. C. Jr., Beard, K. H., Cutler, A., Hess, K. T., Gibson, J., et al. (2007). Random forests for classification in ecology. Ecology 88, 2783–2792. doi: 10.1890/07-0539.1
de-Miguel, S., Mehtätalo, L., Shater, Z., Kraid, B., and Pukkala, T. (2012). Evaluating marginal and conditional predictions of taper models in the absence of calibration data. Can. J. For. Res. 42, 1383–1394. doi: 10.1139/x2012-090
Diamantopoulou, M. J., and Georgakis, A. (2024). Improving European black pine stem volume prediction using machine learning models with easily accessible field measurements. Forests 15:2251. doi: 10.3390/f15122251
Diéguez-Aranda, U., Castedo-Dorado, F., Álvarez-González, J. G., and Rojo, A. (2006). Compatible taper function for scots pine plantations in Nortwestern Spain. Can. J. For. Res. 36, 1190–1205. doi: 10.1139/x06-008
Ercanli, I. (2020). Innovative deep learning artificial intelligence applications for predicting relationships between individual tree height and diameter at breast height. Forest Ecosystems 7, 1–18. doi: 10.1186/s40663-020-00226-3
Ercanlı, İ, Kurt, AK, and Bolat, F (2014.) Comparing variance structure for developing stem taper and volume equations using nonlinear mixed effect modeling for Turkish Pine stands in Feke-Adana Forest Directorate. II. Ulusal Akdeniz Orman ve Çevre Sempozyumu, 22–24 Ekim 2014, Isparta. In Turkish.
Fang, Z., Borders, B. E., and Bailey, R. L. (2000). Compatible volume taper models for loblolly and slash pine based on system with segmented-stem form factors. For. Sci. 46, 1–12.
Gómez-García, E., Crecente-Campo, F., Barrio-Anta, M., and Diéguez-Aranda, U. (2015). A disaggregated dynamic model for predicting volume, biomass and carbon stocks in even-aged pedunculate oak stands in Galicia (NW Spain). Eur. J. Forest Res. 134, 569–583. doi: 10.1007/s10342-015-0873-3
Hastie, T., Tibshirani, R., and Friedman, J. (2009). The elements of statistical learning: Data mining, inference, and prediction. 2nd Edn. New York, NY, USA: Springer.
Jiang, L., Brooks, J. R., and Wang, J. (2005). Compatible taper and volume equations for yellow-poplar in West Virginia. For. Ecol. Manag. 213, 399–409. doi: 10.1016/j.foreco.2005.04.006
Ko, C., Kang, J., Won, H., Seo, Y., and Lee, M. (2025). Stem profile estimation of Pinus densiflora in Korea using machine learning models: towards precision forestry. Forests 16:840. doi: 10.3390/f16050840
Kozak, A. (1988). A variable exponent taper equation. Can. J. For. Res. 18, 1363–1368. doi: 10.1139/x88-213
Kozak, A. (2004). My last words on taper equations. For. Chron. 80, 507–515. doi: 10.5558/tfc80507-4
Lee, W. K., Seo, J. H., Son, Y. M., Lee, K. H., and Gadow, K. V. (2003). Modeling stem profiles for Pinus densiflora in Korea. For. Ecol. Manag. 172, 69–77. doi: 10.1016/S0378-1127(02)00139-1
Li, R., and Weiskittel, A. R. (2011). Estimating and predicting bark thickness for seven conifer species in the Acadian region of North America using a mixed-effects modeling approach: comparison of model forms and subsampling strategies. Eur. J. Forest Res. 130, 219–233. doi: 10.1007/s10342-010-0423-y
Max, T. A., and Burkhart, H. E. (1976). Segmented polynomial regression applied to taper equations. For. Sci. 22, 283–289.
Montgomery, D. C., Peck, E. A., and Vining, G. G. (2021). Introduction to linear regression analysis. 6th Edn. Hoboken, NJ, USA: Wiley.
Muhairwe, C. (1999). Taper equations for Eucalyptus pilularis and Eucalyptus grandis for the north coast in New South Wales, Australia. For. Ecol. Manag. 113, 251–269. doi: 10.1016/S0378-1127(98)00431-9
Newnham, R. (1992). Variable-form taper functions for four Alberta tree species. Can. J. For. Res. 22, 210–223. doi: 10.1139/x92-028
Özçelik, R., and Crecente-Campo, F. (2016). Stem taper equations for estimating merchantable volume of Lebanon cedar trees in the Taurus Mountains, southern Turkey. For. Sci. 62, 78–91. doi: 10.5849/forsci.14-212
Özcelik, R., Diamantopoulou, M. J., and Trincado, G. (2019). Evaluation of potential modeling approaches for scots pine stem diameter prediction in North-Eastern Turkey. Comput. Electron. Agric. 162, 773–782. doi: 10.1016/j.compag.2019.05.033
Perez, D. N., Burkhart, H. E., and Stiff, C. T. (1990). A variable-form taper function for Pinus oocarpa Schiede in Central Honduras. For. Sci. 36, 186–191. doi: 10.1093/forestscience/36.1.186
Poudel, K. P., and Cao, Q. V. (2013). Evaluation of methods to predict Weibull parameters for characterizing diameter distributions. For. Sci. 59, 243–252. doi: 10.5849/forsci.12-001
Rojo, A., Perales, X., Sánchez-Rodríguez, F., Álvarez-González, J. G., and Gadow, K. V. (2005). Stem taper functions for maritime pine (Pinus pinaster Ait.) in Galicia (northwestern Spain). Eur. J. Forest Res. 124, 177–186. doi: 10.1007/s10342-005-0066-6
Sahin, A. (2024). Analyzing regression models and multi-layer artificial neural network models for estimating taper and tree volume in Crimean pine forests. iForest 17, 36–44. doi: 10.3832/ifor4449-017
Sakici, O. E., Misir, N., Yavuz, H., and Misir, M. (2008). Stem taper functions for Abies nordmanniana subsp. bornmulleriana in Turkey. Scand. J. For. Res. 23, 522–533. doi: 10.1080/02827580802552453
Sakici, O. E., and Ozdemir, G. (2018). Stem taper estimations with artificial neural networks for mixed oriental beech and Kazdaği fir stands in Karabük region, Turkey. Cerne 24, 439–451. doi: 10.1590/01047760201824042572
Seki, M. (2023). Predicting stem taper using artificial neural network and regression models for scots pine (Pinus sylvestris L.) in northwestern Türkiye. Scand. J. For. Res. 38, 97–104. doi: 10.1080/02827581.2023.2189297
Senyurt, M., and Ercanli, I. (2019). A comparison of artificial neural network models and regression models to predict tree volumes for Crimean black pine trees in Cankiri Forests. Šumarski List Hrvatskoga Sumarskoga Drustva 10, 413–423. doi: 10.31298/sl.143.9-10.3
Sharma, M., and Parton, J. (2009). Modeling stand density effects on taper for jack pine and black spruce plantations using dimensional analysis. For. Sci. 55, 268–282. doi: 10.1093/forestscience/55.3.268
Sharma, M., and Zhang, S. (2004). Variable-exponent taper equations for jack pine, black spruce, and balsam fir in eastern Canada. For. Ecol. Manag. 198, 39–53. doi: 10.1016/j.foreco.2004.03.035
Tang, C., Wang, C. S., Pang, S. J., Zhao, Z. G., Guo, J. J., Lei, Y. C., et al. (2017). Stem taper equations for Betula alnoides in South China. J. Trop. For. Sci. 29, 80–92.
Keywords: ensemble learning, XGBoost, Random Forest, tree stem form, stem profile
Citation: Sağlam F (2025) Machine learning-based stem taper model: a case study with Brutian pine. Front. For. Glob. Change. 8:1609549. doi: 10.3389/ffgc.2025.1609549
Edited by:
Erwin Dreyer, Institut National de recherche pour l’agriculture, l’alimentation et l’environnement (INRAE), FranceReviewed by:
Milos Ivkovic, Commonwealth Scientific and Industrial Research Organisation (CSIRO), AustraliaMarius Petrila, National Institute for research and Development in Forestry Marin Dracea (INCDS), Romania
Copyright © 2025 Sağlam. This is an open-access article distributed under the terms of the Creative Commons Attribution License (CC BY). The use, distribution or reproduction in other forums is permitted, provided the original author(s) and the copyright owner(s) are credited and that the original publication in this journal is cited, in accordance with accepted academic practice. No use, distribution or reproduction is permitted which does not comply with these terms.
*Correspondence: Fadime Sağlam, ZnNhZ2xhbUBrYXN0YW1vbnUuZWR1LnRy