 Hasham Ahmad1
 Zhiyuan Wu1Hui Huang2
 Sultan Muhammad3
 Mansoor Hayat1
 Khurram Abbas1
 Xiguang Yang1
 Zhan Shu1*
- 1School of Forestry, Northeast Forestry University, Harbin, China
- 2School of Water Conservancy and Civil Engineering, Heilongjiang Agricultural Engineering Vocational College, Harbin, China
- 3Institute of Forest Sciences, University of Swat, Saidu Sharif, Pakistan
Introduction: Mapping forest fire risk is essential for effective prevention and efficient resource allocation, as it accurately assesses fire hazards across regions. This study conducts a comparative evaluation of the Analytical Hierarchy Process (AHP), the Fuzzy Analytical Hierarchy Process (F-AHP), and the Dong model for forest fire risk mapping in Liangshui National Nature Reserve by analyzing the weights of the factors contributing to fire risk.
Methodology: The forest fire risk maps were developed based on several contributing factors: aspect, elevation, slope, topographic wetness index, proximity to roads, distance to settlements, population density, Land Use Land Cover, temperature, precipitation, wind speed, normalized difference vegetation index (NDVI), and normalized difference moisture index (NDMI).
Results: Receiver Operating Characteristic (ROC) curve analysis was employed to validate and assess the predictive performance of the models. The evaluation of the Area Under the Curve (AUC) values revealed that the Analytical Hierarchy Process (AHP) model achieved high prediction accuracy with an AUC of 0.92, while the Dong model slightly lowered with an AUC of 0.91. In contrast, the Fuzzy Analytical Hierarchy Process (F-AHP) yielded an AUC of 0.90. These results indicate that the fire risk map generated by the AHP provides the most accurate and reliable prediction.
Conclusion: Overall, the findings underscore the effectiveness of the proposed modeling approaches and demonstrate their potential to enhance decision-making processes in forest fire risk management and the strategic allocation of prevention resources.
1 Introduction
Forest fires pose a significant threat to both human safety and the ecosystem globally (Mehmood et al., 2024). This enduring problem presents substantial environmental, economic, and social hazards on a global scale (Xiong et al., 2020). Understanding burn severity is crucial for assessing the impact of fire on vegetation and ecosystems, which helps forest managers and decision-makers to develop effective restoration strategies (Muhammad et al., 2024). The occurrence of forest fires is influenced by several factors: Climate, flammable materials in forests, and geographical features (Shao et al., 2022; Zhu et al., 2022). Fire activities for a given region are driven mainly by fire-weather variability (Gao et al., 2023).
Integrating geospatial technologies, particularly Geographic Information Systems (GIS), is crucial in providing both spatial and temporal data, allowing for effective fire risk assessments (Lamat et al., 2021; Modugno et al., 2016). Various methods, from fundamental to complex models, have been suggested for evaluating forest fires (Sivrikaya and Küçük, 2022). The models used for creating a fire risk model are neural networks (Jafari Goldarag et al., 2016), Random Forest (Breiman, 2001), and fuzzy analysis (Abedi Gheshlaghi et al., 2020; Li et al., 2018). Some models often require previous fire data to validate their efficiency. However, the methodologies mentioned above rely on partial historical fire data, which may lead to inaccurate fire risk maps in certain locations where complete fire records are unavailable (Zhao et al., 2021; Matin et al., 2017).
The Geographic Information System (GIS)-based Analytical Hierarchy Process (AHP) (Jia et al., 2019; Hong et al., 2019; Chuvieco and Congalton, 1989). Fuzzy AHP and the Dong model (Nikolić et al., 2023; Eskandari and Miesel, 2017; Kumi-Boateng et al., 2021) have proven to be effective tools for generating forest fire risk (FFR) maps. When used in combination, these methodologies offer valuable support for fire authorities in both preventing wildfires and promoting sustainable post-fire land management (Nuthammachot and Stratoulias, 2021b). One of the most popular techniques in Multi-Criteria Decision Analysis (MCDA), the AHP, combined with GIS approaches, has been widely effective in identifying fire danger zones globally (Rahmati et al., 2015; Pourghasemi et al., 2016). AHP is a structured decision-making tool that is particularly effective in environments where expert opinion plays a crucial role. At the same time, F-AHP addresses the uncertainty inherent in fire risk modeling using fuzzy logic. Though less explored, the Dong Model offers a parameter-based approach with spatial adaptability (Kayet et al., 2018; Eskandari and Miesel, 2017). For example (Fekir et al., 2022) employed and compared two models i.e., (AHP) and Dong considering three effective factors including topography, vegetation cover and anthropogenic integrated by these two methods in Algeria. Forest fire risk zonation prepared by AHP and Dong Model was compared with burn severity map. The result after statistical calculation demonstrated that a significant portion of the burned area is classified within the moderate, high, and very high-risk zones, with rates of 64.27% for the Dong model and 69.41% for the AHP model. Sinha et al. (2023) also employed geospatial tools, specifically the AHP and fuzzy AHP models, for analysis. The purpose of this different zone selection was to assess the effectiveness of the models by taking the forest fire responsible factors. The selected sites for this research and application of modeling were severely hit by almost 100 forest fire events in history.
Topographical, human, and meteorological factors collectively influence fire intensity, spread, and ignition, making it essential to understand and integrate them into forest fire risk modeling and decision-making processes (Gupta et al., 2023). A key advantage of comparing these models lies in their capacity to incorporate multiple factors influencing forest fire risk, including topography, forest structure, climate, and human-related criteria (Zacharakis and Tsihrintzis, 2023). Each model differs in its methodological framework, accuracy, and ability to integrate multiple factors influencing fire susceptibility (Pourtaghi et al., 2016). AHP and F-AHP are widely used multi-criteria decision-making (MCDA) methods that incorporate expert knowledge and spatial data, whereas the Dong Model follows a distinct parameter-based approach (Nikolić et al., 2023). While AHP is effective in structured decision-making, it struggles with handling uncertainty, which F-AHP addresses using fuzzy logic (Tesfamariam and Sadiq, 2006). Key criteria for comparison include spatial correlation, model correctness, and adaptability to varied geographical situations. Studies demonstrate that AHP works well in fire risk assessment (Sivrikaya and Küçük, 2022; Ersoy et al., 2025), yet F-AHP, due to its ability to manage uncertainty, often provides more refined risk maps (Kayet et al., 2018; Cardone et al., 2024). The Dong Model’s effectiveness, however, remains relatively unexplored in comparison, but a study by Eskandari and Miesel (2017) demonstrated that the F-AHP and spatial correlation methods outperformed the Dong model in predicting high-risk areas. GIS integration enhances the applicability of these models by enabling spatial analysis of forest fire risk factors such as topography, climate, and human influences (Parvar et al., 2024).
According to the China Forestry Administration, forest fires in China have exceeded 10,000 annually over the past decade, with general fires (less than 1 hectare) and larger fires (1–100 hectares) causing notable social and environmental consequences (Yang et al., 2015). Northern regions, especially the Northeast, experience particularly severe wildfires due to the vast natural forest cover and distinctive climatic conditions (Wang et al., 2023). Conventional fire vulnerability methods, such as logistic regression, fuzzy analysis, and neural networks, typically rely on historical fire data for validation. However, in regions like the Liangshui National Nature Reserve, where historical fire data is sparse or incomplete, these approaches may result in limited model generalizability and reduced predictive performance due to insufficient validation inputs. To address this, we will develop a Fire Risk Index (FRI)-based model that enables the creation of reliable fire risk maps without depending on historical fire records. Fire points were extracted for validation using the MODIS temperature anomaly and fire. This method has shown over 90% accuracy in identifying fire locations (Zhao et al., 2008). In our study, fire points were identified between 2013 and 2023 and used to evaluate the model’s performance.
This study introduces a novel comparative assessment of three spatially integrated forest fire risk models i.e., AHP, F-AHP, and the Dong model in the context of the Liangshui National Nature Reserve, where historical fire data are limited. Unlike previous studies that largely depend on past fire occurrences for model validation, this research develops a Fire Risk Index (FRI)-based approach validated through MODIS-derived fire points, offering a more accurate and adaptable methodology for fire risk mapping in data-scarce regions.
2 Materials and methods
2.1 Study area
The study was conducted in the Liangshui National Nature Reserve, located in the southern part of the Xiaoxing’anling Mountains, spanning an area of 12,133 hectares in the eastern mountainous region of Northeast China. The reserve is positioned between 47°6′49″–47°16′10″ N latitude and 128°47′8″–128°57′19″ longitude, boasting a remarkable forest coverage of 97% (Zhao et al., 2023; Wu et al., 2024). The area exhibits a unique fire regime due to its ecological, climatic, and historical characteristics. The temperate mixed conifer-broadleaf forest ecosystem in this region is particularly susceptible to fires due to the combustible nature of its vegetation type (Zhen et al., 2013; Gul et al., 2022). The study area is situated on the eastern edge of the Eurasian continent and is significantly influenced by the oceanic climate. It exhibits the typical characteristics of a temperate continental monsoon climate. Winters are dominated by cold, dry continental air masses, resulting in low temperatures and occasional snowfall. Summers are influenced by warm, humid subtropical oceanic air masses, bringing high temperatures. Spring and autumn are transitional and highly variable, with spring characterized by strong winds, low humidity, and limited rainfall, creating conditions that are conducive to forest fire ignition and spread. These seasonal and climatic variations play a critical role in influencing forest fire risk patterns in the region. The reserve has a significant altitude range from 291 to 719 m above sea level at its lowest and highest points, respectively (Figure 1). This area holds considerable potential for understanding the dynamics of fire risk and developing effective management strategies due to its unique ecological characteristics and susceptibility to fire-prone conditions.
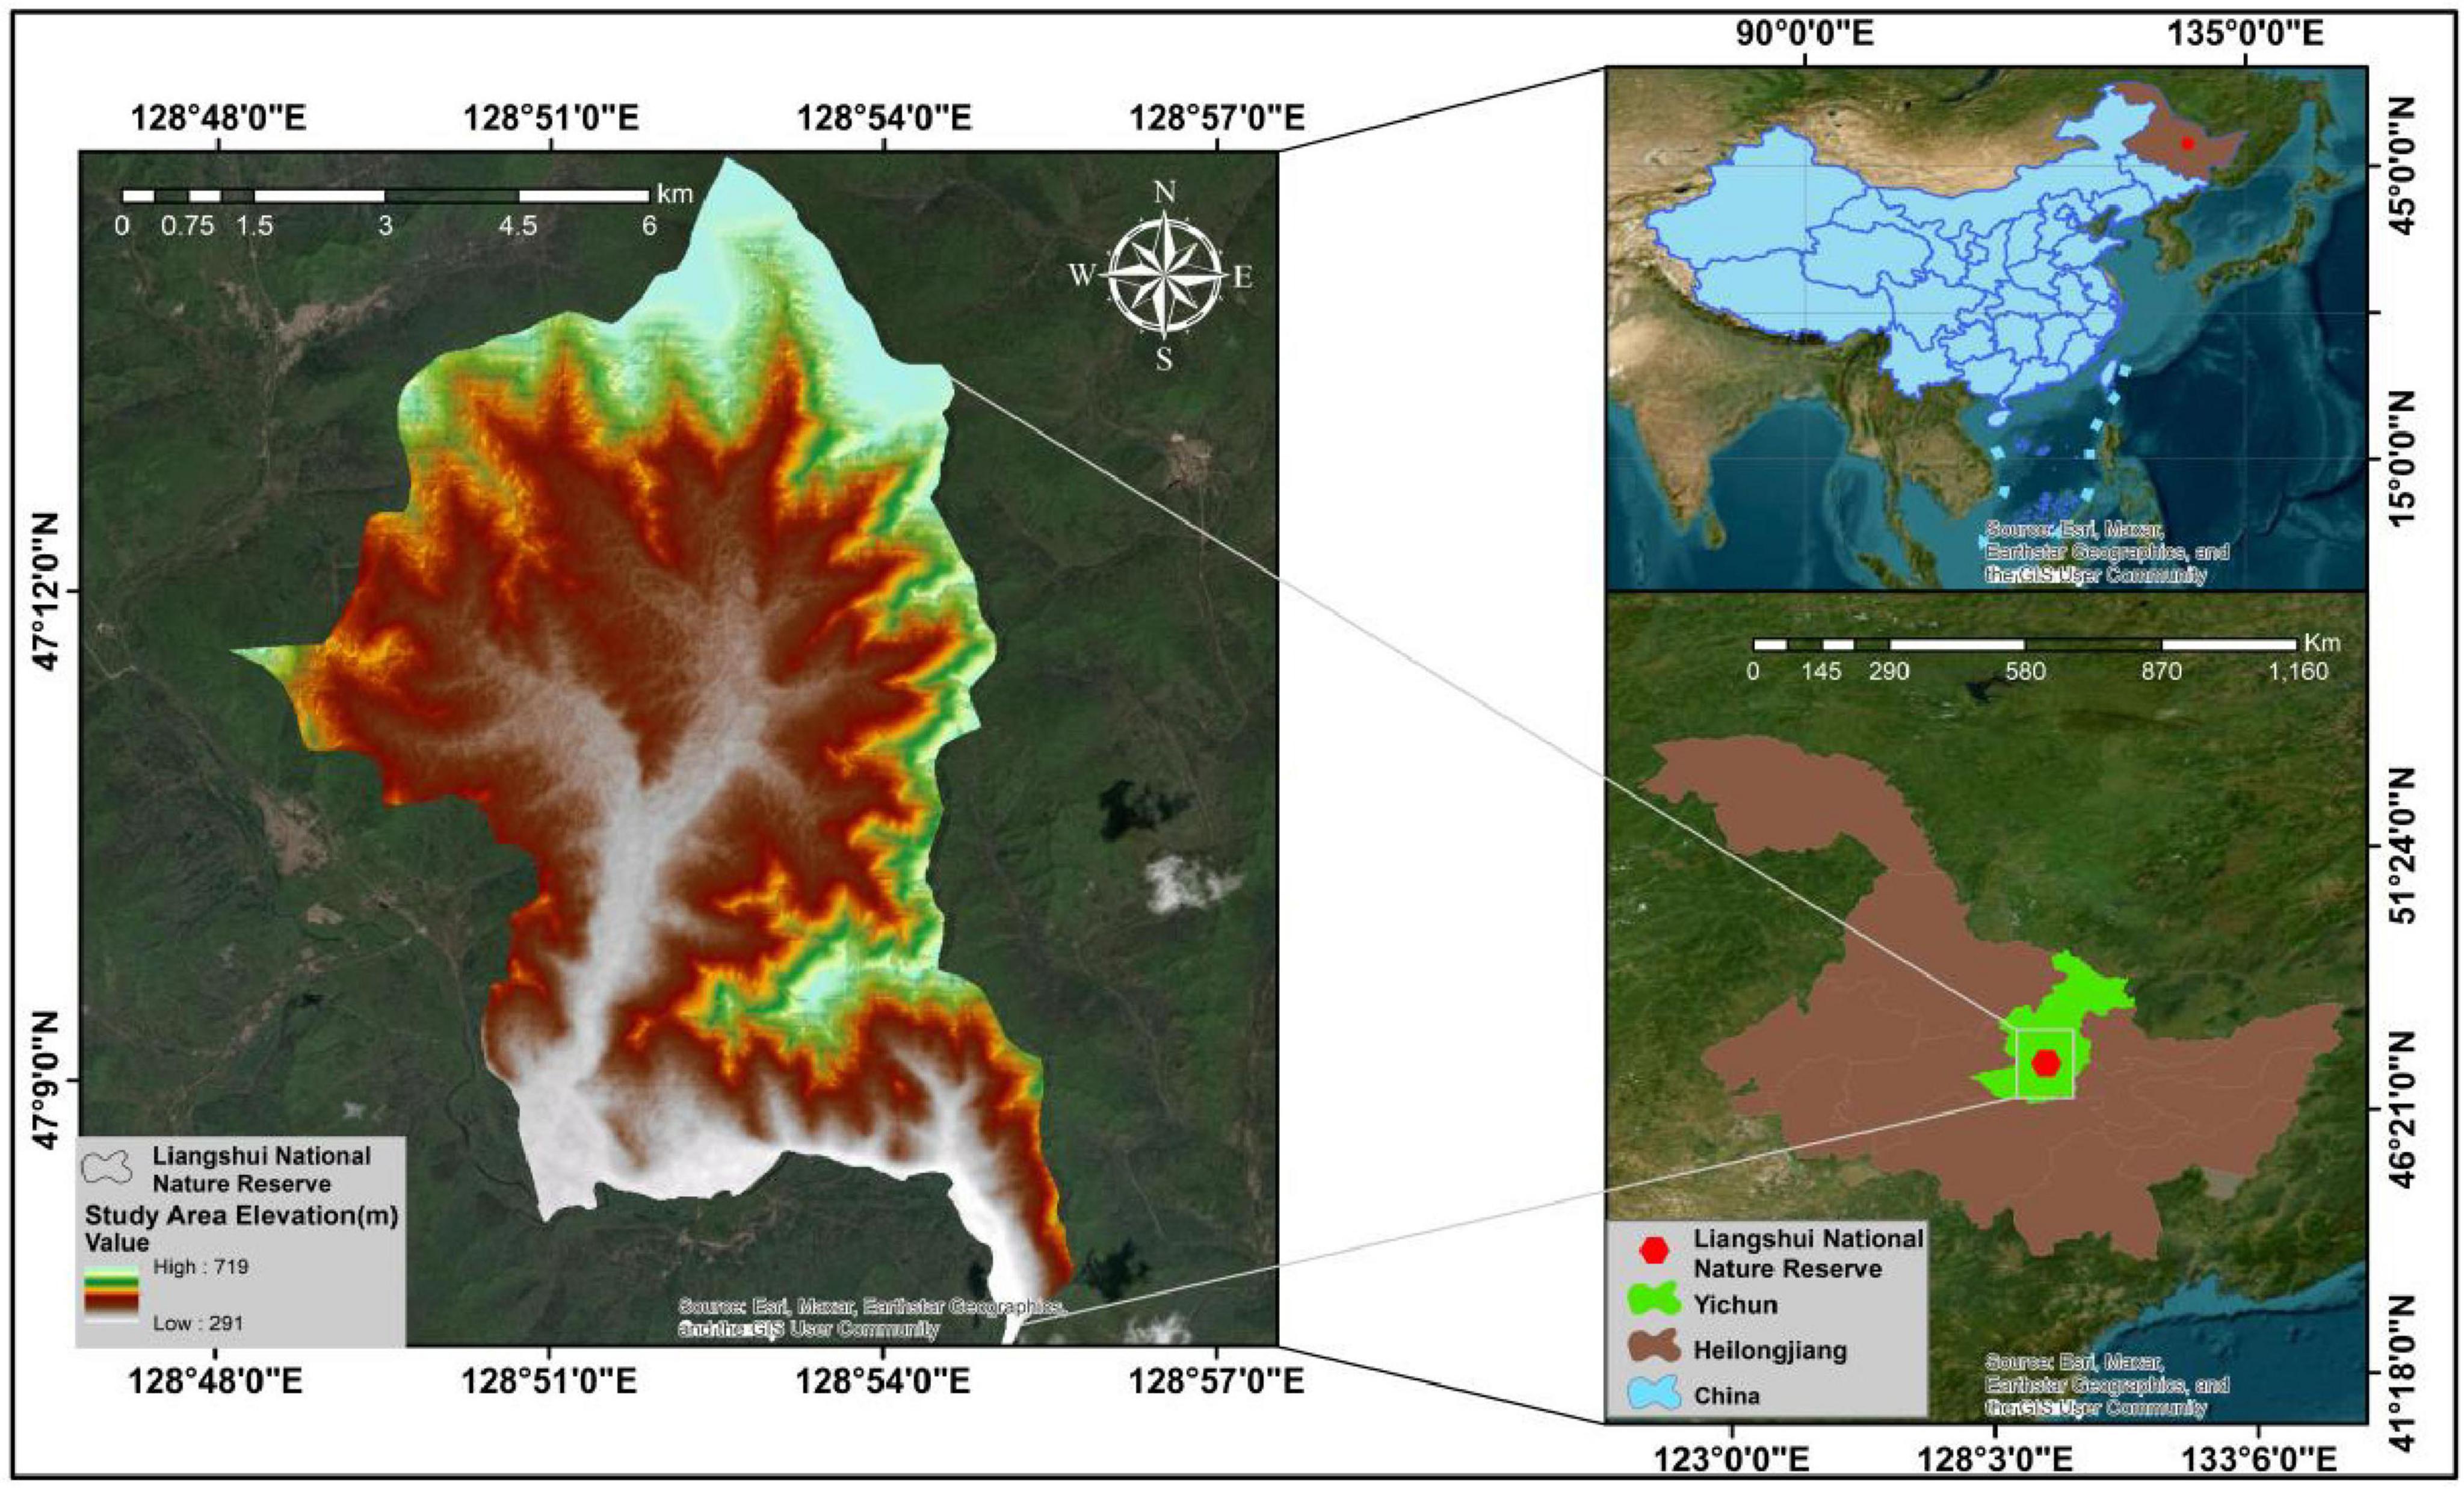
Figure 1. Geographical location and elevation classes of the study area.
The region climate and the prevalence of Pinus koraiensis forests increase susceptibility to fires, particularly during spring and fall. The dominant forest type is mixed, featuring extensive tracts of original Pinus koraiensis forest alongside secondary birch and broad-leaved forests. According to Nefu (n.d.) Liangshui National Nature Reserve is home to a diverse range of species, including 90 leafy lichens, 95 mosses, 445 angiosperms, 252 birds, 44 mammals, and thousands of fungi and insects.
2.2 Methodology of the study
Our approach integrated diverse expert opinions and extensive literature to determine the weights of the rules and conditioning criteria for all three models. We employ thirteen criteria to comprehensively assess the potential impacts of various forest fire activities and preconditions, incorporating aspect, elevation, slope, topographic wetness index, proximity to roads, distance to settlements, population density, LULC, temperature, precipitation, wind speed, NDVI, and NDMI (Table 1).
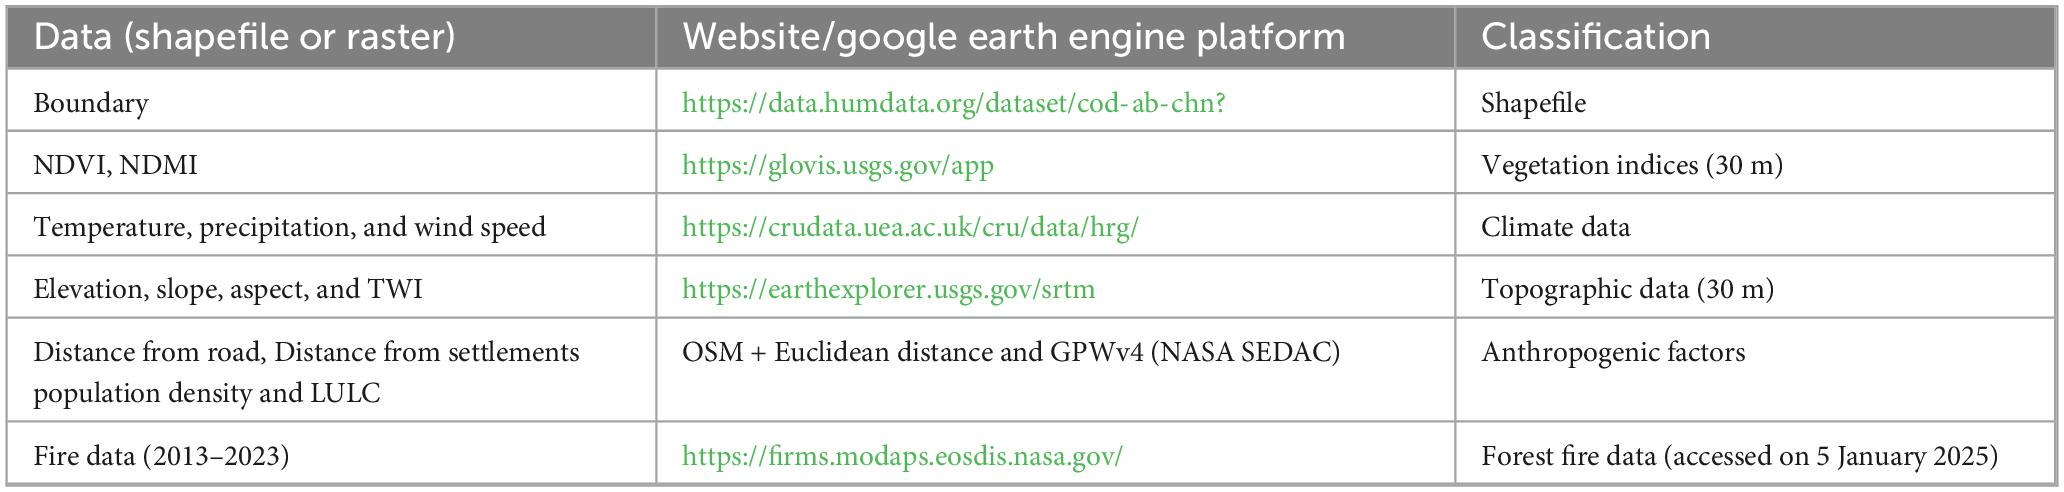
Table 1. Data sources.
The Shuttle Radar Topography Mission (SRTM) was used to download 30 m resolution Digital Elevation Model (DEM) data from Earth Explorer. Elevation, TWI, aspect, and slope were extracted from the DEM. Euclidean distance analysis assessed the proximity to highways, resulting in raster files with buffer zones of different ranges. Satellite imagery was used to classify vegetation indices, including NDVI and NDMI, which matched pre-existing classification methods. Terrain analysis techniques on GIS platforms identified topographic features, such as TWI.
2.3 Preparation of thematic layers
During data collection, preprocessing techniques were used to standardize all inputs and guarantee consistency across layers. The mapping of forest topography utilizing a variety of quantitative terrain descriptors is made possible by the SRTM, which provides 30 m DEM images. The elevation map was created using SRTM data, which provides high-resolution elevation information. First, masking was applied to the SRTM dataset to focus on the study area, removing regions outside the boundaries of interest. Next, multiple SRTM tiles were mosaicked to create a seamless elevation map. Slope maps were generated from the DEM using the Spatial Analyst and classified into five distinct slope zones. An aspect map illustrating terrain steepness and orientation was generated and classified into ten categories: Flat, North, Northeast, East, Southeast, South, Southwest, West, and Northwest. Equation 1 was used to calculate the Topographic Wetness Index (TWI), a key indicator of hydrological processes (Beven and Kirkby, 1979). The entire process was carried out in ArcGIS 10.8.
Where a is the upslope contributing area per unit width (measured in square meters per meter), β is the slope angle in radians.
Landsat-8 imagery was first stacked and masked using the study area’s shapefile, and then NDVI and NDMI were applied to assess vegetation cover and moisture content by analyzing specific spectral band combinations using Equation 2 (Tien Bui et al., 2016):
Normalized difference moisture index, reflecting vegetation health and biomass linked to fire fuel load, and NDVI, used to classify imagery and generate vegetation maps, were applied using red and near-infrared reflectance to estimate moisture content in soil and vegetation using Equation 3 (Ding et al., 2014):
The shortwave infrared band (SWIR) and the near-infrared band (NIR) represent the resultant frequencies.
Distance-to-road maps were generated using the Euclidean distance function, while rainfall, temperature, and wind speed data were collected from weather stations and LULC data from Landsat 8; all datasets were reprojected to WGS 1984 for spatial alignment, visually and statistically validated, clipped to the study area, and resampled for consistent resolution. Population density data was obtained from the Gridded Population of the World version 4 (GPWv4) provided by NASA SEDAC, which offers global population estimates in raster format. The dataset was clipped to the study area and resampled as needed, then normalized to a 0–1 scale using raster calculation techniques to ensure compatibility within the Analytical Hierarchy Process (AHP) framework for fire risk assessment. In parallel, settlement data were extracted from OpenStreetMap (OSM) in the form of building and urban area polygons. These vector features were converted into a continuous raster surface using the Euclidean Distance tool in ArcGIS, representing proximity to human habitation. The resulting distance layer was reclassified and standardized to align with other input criteria in the fire risk model, enabling spatial analysis of anthropogenic fire risk.
In the preprocessing of forest fire risk mapping all factors are standardized and normalized in all three models to ensure consistency and comparability of data. The Analytic Hierarchy Process (AHP), Fuzzy AHP (F-AHP), and the Dong model each utilize these processes differently.
In AHP, standardization and normalization are crucial for converting diverse factors into a consistent scale so that they can be compared and weighted accordingly. The AHP model typically involves using expert judgment to assign weights to various factors based on their relative importance in contributing to forest fire risks. While F-AHP introduces fuzziness to handle uncertainty and vagueness in expert assessments. The factors are standardized into fuzzy sets, which are then used to calculate fuzzy weights through extent analysis. This allows for a more nuanced handling of data variances and expert opinion variations. The Dong model on the other hand also standardizes and normalizes factors for better integration into the risk mapping process. Although specific details about the normalization techniques used within the Dong Model were not provided in the context, a general approach often involves scaling raw data to a 0–1 range or transforming them for comparability.
2.4 Analytical hierarchy process
The Analytical Hierarchy Process is a widely used multi-criteria decision-making method that integrates expert judgment with quantitative analysis, utilizing a pairwise comparison matrix to assess the relative importance of various factors. AHP uses a 1–9 scale (1 = Equal, 3 = Moderately, 5 = Strongly, 7 = Very, 9 = Extremely) to compare elements within a hierarchical structure, converting subjective assessments into numerical values (Table 2). The process involves determining the Eigenvector, weighting coefficients (Wi, where i = 1, 2, 3 ⋯, n), and a consistency ratio (CR) to ensure reliability. The consistency index (CI) is calculated and divided by a random index (RI), with a CR of less than 0.1 indicating acceptable consistency. This approach allows for systematic evaluation and prioritization of criteria while incorporating a mechanism to assess the reliability of the results (Lamat et al., 2021).
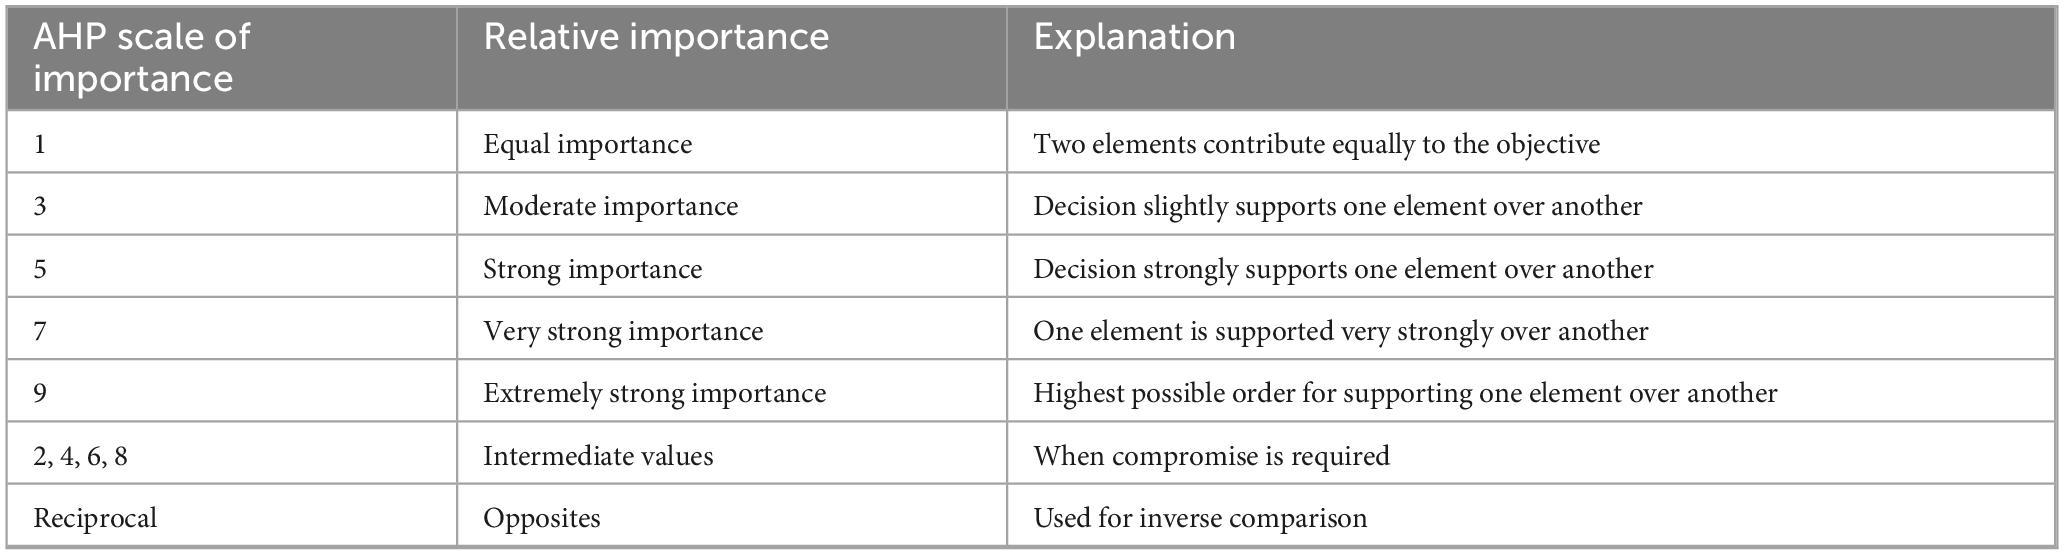
Table 2. The fundamental scale of Saaty (1990).
The principal eigenvalue (λmax) was calculated with the eigenvector using Equation 4.
Where Wt represents the corresponding eigenvector of λmax, Wti defines the weight for ranking, CV represents the consistency vector, and n symbolizes the total number of classes. CV is computed by multiplying the pair-wise comparison matrix with the weight matrix as presented in Equation 5. λ was computed by dividing the elements of CV by the corresponding weights. The average of these values is represented by λmax.
Where aij defines a pair-wise comparison matrix in which aii = 1 and aij = 1/aji. Wti defines the weight value for ranking. Values of i and j range from 1 to n (number of criteria).
The Consistency Index (CI) represents the degree of consistency and is calculated using Equation 6. The Consistency Ratio (CR) defines the final consistency of the weights assigned to the causative criteria (Equation 7).
where n is the number of classes. CR should be less than 0.10 for consistent weights. The Random Index (RI) value is referred to in Table 3.

Table 3. Random index (RI) for different numbers of criteria (n).
The FFR index is calculated by integrating all the causative criteria of forest fires using a weighted linear combination equation, as shown in Equation 8.
The rank value (Cf) represents the relative contribution of each factor class to fire risk and is assigned based on expert judgment. These values are then integrated with the normalized weights (NWt) in the weighted linear combination model to compute the Forest Fire Risk (FFR) index.
Where NWt symbolizes the normalized weight, Cf represents the rank value, m defines the number of criteria, and n defines the number of classes.
2.5 Fuzzy-analytical hierarchy process
The F-AHP is an advanced decision-making tool that extends the traditional AHP method by incorporating fuzzy logic theory to handle uncertainty, imprecision, and vagueness in expert judgments using Triangular Fuzzy Numbers (TFNs) (Shapiro and Koissi, 2017, Tesfamariam and Sadiq, 2006). F-AHP addresses issues such as null weights for factors and scores for alternatives using TFNs, thereby preserving consistency in the results. Fuzzy AHP simplifies computation and enhances decision-making by handling uncertainty in expert judgments, making it well-suited for complex tasks like fire risk assessment (Yuen, 2014). F-AHP enhances traditional AHP by employing fuzzy set theory to manage imprecise data, thereby providing a more robust framework for assessing risk factors and expert opinions in uncertain environments. The fundamental scale for F-AHP is explained in Table 4. The following were the crucial steps in the F-AHP modeling process:
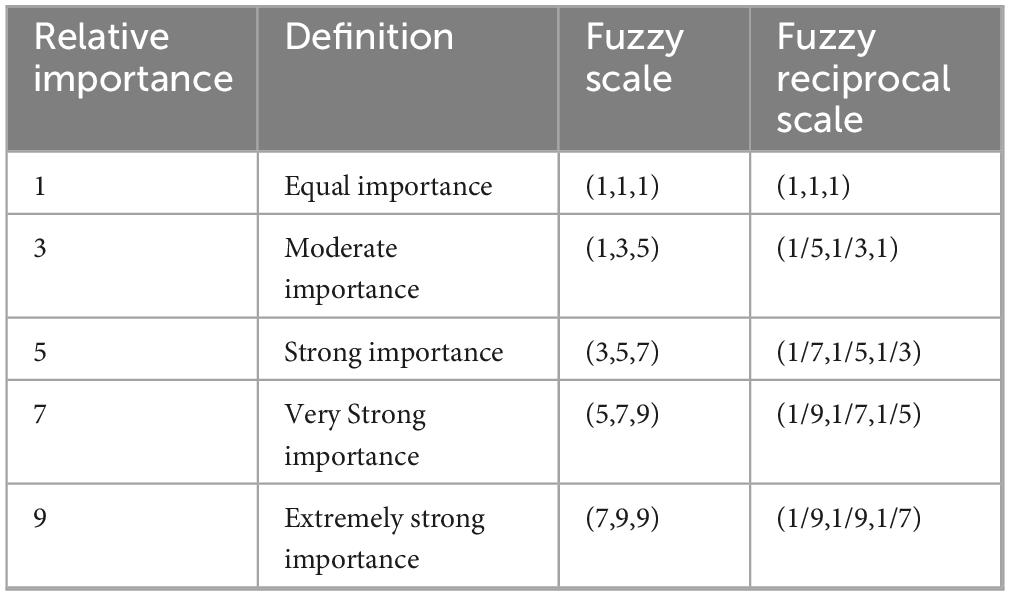
Table 4. The fundamental scale of Fuzzy Analytical Hierarchy Process (AHP).
The fuzzy triangle scale for the comparison matrix was (1/4, 1/3, 1/2). The mean fuzzy comparison matrix (matrix Ã) is produced as follows when the expert assessments are represented as triangular fuzzy numbers (Chang, 1996). Equation 9 depicts the matrix:
Where à defines the pair-wise comparison matrix and symbolizes the expert’s opinion on the ith attribute relative to the jth attribute. A TFN is denoted as aij = (lij, mij, uij) and and for I, j = 1,…, n and I ≠ j
The geometric mean of the fuzzy comparison values for each criterion is calculated and used to obtain the fuzzy weights (Equation 10).
while i = 1, 2, 3 … n
Wi = rl⊗ˇ(r1⊗ˇ r2… rn) –1 = (li, mi, ui)
where rl represents TFN, Wi represents the fuzzy weights, and ⊗ˇ denotes the extended multiplication of two fuzzy numbers.
Since (li, mi, ui) are still TFNs, they must be defuzzified (Chou and Chang, 2008) and then normalized using the following Equations 11, 12.
Where Mi is a crisp and non-fuzzy number, and NWi represents normalized weights.
The forest risk map was generated through the linear combination of the 13 previously stated criteria, as outlined in Equation 13. The estimation from the F-AHP is used to allocate weights to each criterion.
2.6 Dong model
The Dong model is a GIS-based approach that creates a fire risk map by combining several anthropogenic and environmental factors, as outlined in the Dong et al. (2005) model. Numerous published research (Dong et al., 2005; Eskandari and Miesel, 2017; Baqer Rasooli and Bonyad, 2019; Fekir et al., 2022) have shown its widespread application in various fields. The methodology involves preparing thematic layers that encompass topographic factors (slope, aspect, elevation, and TWI), vegetation indices (NDVI, NDMI), climatic variables (temperature, precipitation, and wind speed), and anthropogenic influence factors (proximity to roads, Settlements and population density and LULC). The goal of forest fire risk assessment is established, and the criteria are identified and organized in a hierarchical structure.
The fuzzy synthetic extent for each factor is computed, and the results are defuzzified using the centroid method to obtain crisp weights. For a triangular fuzzy number (l,m,u), the defuzzified weight is calculated using Equation 14.
The crisp weights are normalized to ensure they sum to 1, using the Equation 15.
The normalized weights are applied in the Dong model formula to calculate the Fire Risk Index (FRI) as a weighted sum of the normalized factor values, as shown in Equation 16.
Where x1, x2, x3…x10 represent the normalized values of the factors and ω1, ω2, ω3 … ω10 are their respective weights. The Dong model’s fire risk classification categorizes FRI values into five risk levels, ranging from extremely low to extremely high. The fire risk map is generated using the ArcGIS Raster Calculator, and risk zones are visually represented with distinct colors. The fire risk map is compared with Terra’s Thermal Anomalies and Fire data to validate the model. The Dong model is widely applied due to its effective integration of multiple risk factors into a simple yet reliable fire risk assessment framework.
2.7 Model validation
Model validation was conducted to assess the predictive performance and spatial accuracy of fire susceptibility models developed using the Analytic Hierarchy Process (AHP), Fuzzy AHP, and the Dong fuzzy method. The validation employed MODIS active fire data (MOD14A1.061) from the Terra and Aqua satellites, which provide daily global fire detection at 1 km spatial resolution based on mid-infrared and thermal-infrared analysis. These datasets offer timely and reliable information on the study area’s thermal anomalies and fire occurrences. To ensure data quality, spatial filtering techniques were applied to remove cloud-contaminated pixels, irrelevant records, and outliers beyond the study boundaries. The cleaned fire occurrence points were then overlaid on the continuous susceptibility maps generated by each model. An overlay analysis was employed to quantify model accuracy by determining the number of fire points in high- and very high-risk fire zones.
A Receiver Operating Characteristic (ROC) curve analysis was employed as a threshold-independent method to assess classification accuracy for statistical evaluation. Susceptibility maps were transformed into ascending value classes, and pixels were categorized as fire-prone (positive) or non-fire-prone (negative) at varying thresholds. Fire occurrence data were then used to calculate true positives (TP), false positives (FP), true negatives (TN), and false negatives (FN). ROC curves were plotted by comparing sensitivity (TP rate) against 1-specificity (FP rate) across all thresholds. The Area Under the Curve (AUC) values were computed using GIS software’s “ROC” module, supported by additional statistical analysis in Python and R. AUC values closer to 1.0 indicated excellent predictive performance, values between 0.7 and 0.9 reflected acceptable to good accuracy, while values near 0.5 suggested random prediction. This comprehensive validation approach objectively compared the three modeling techniques and demonstrated their effectiveness in generating spatially accurate fire susceptibility maps (Figure 2).
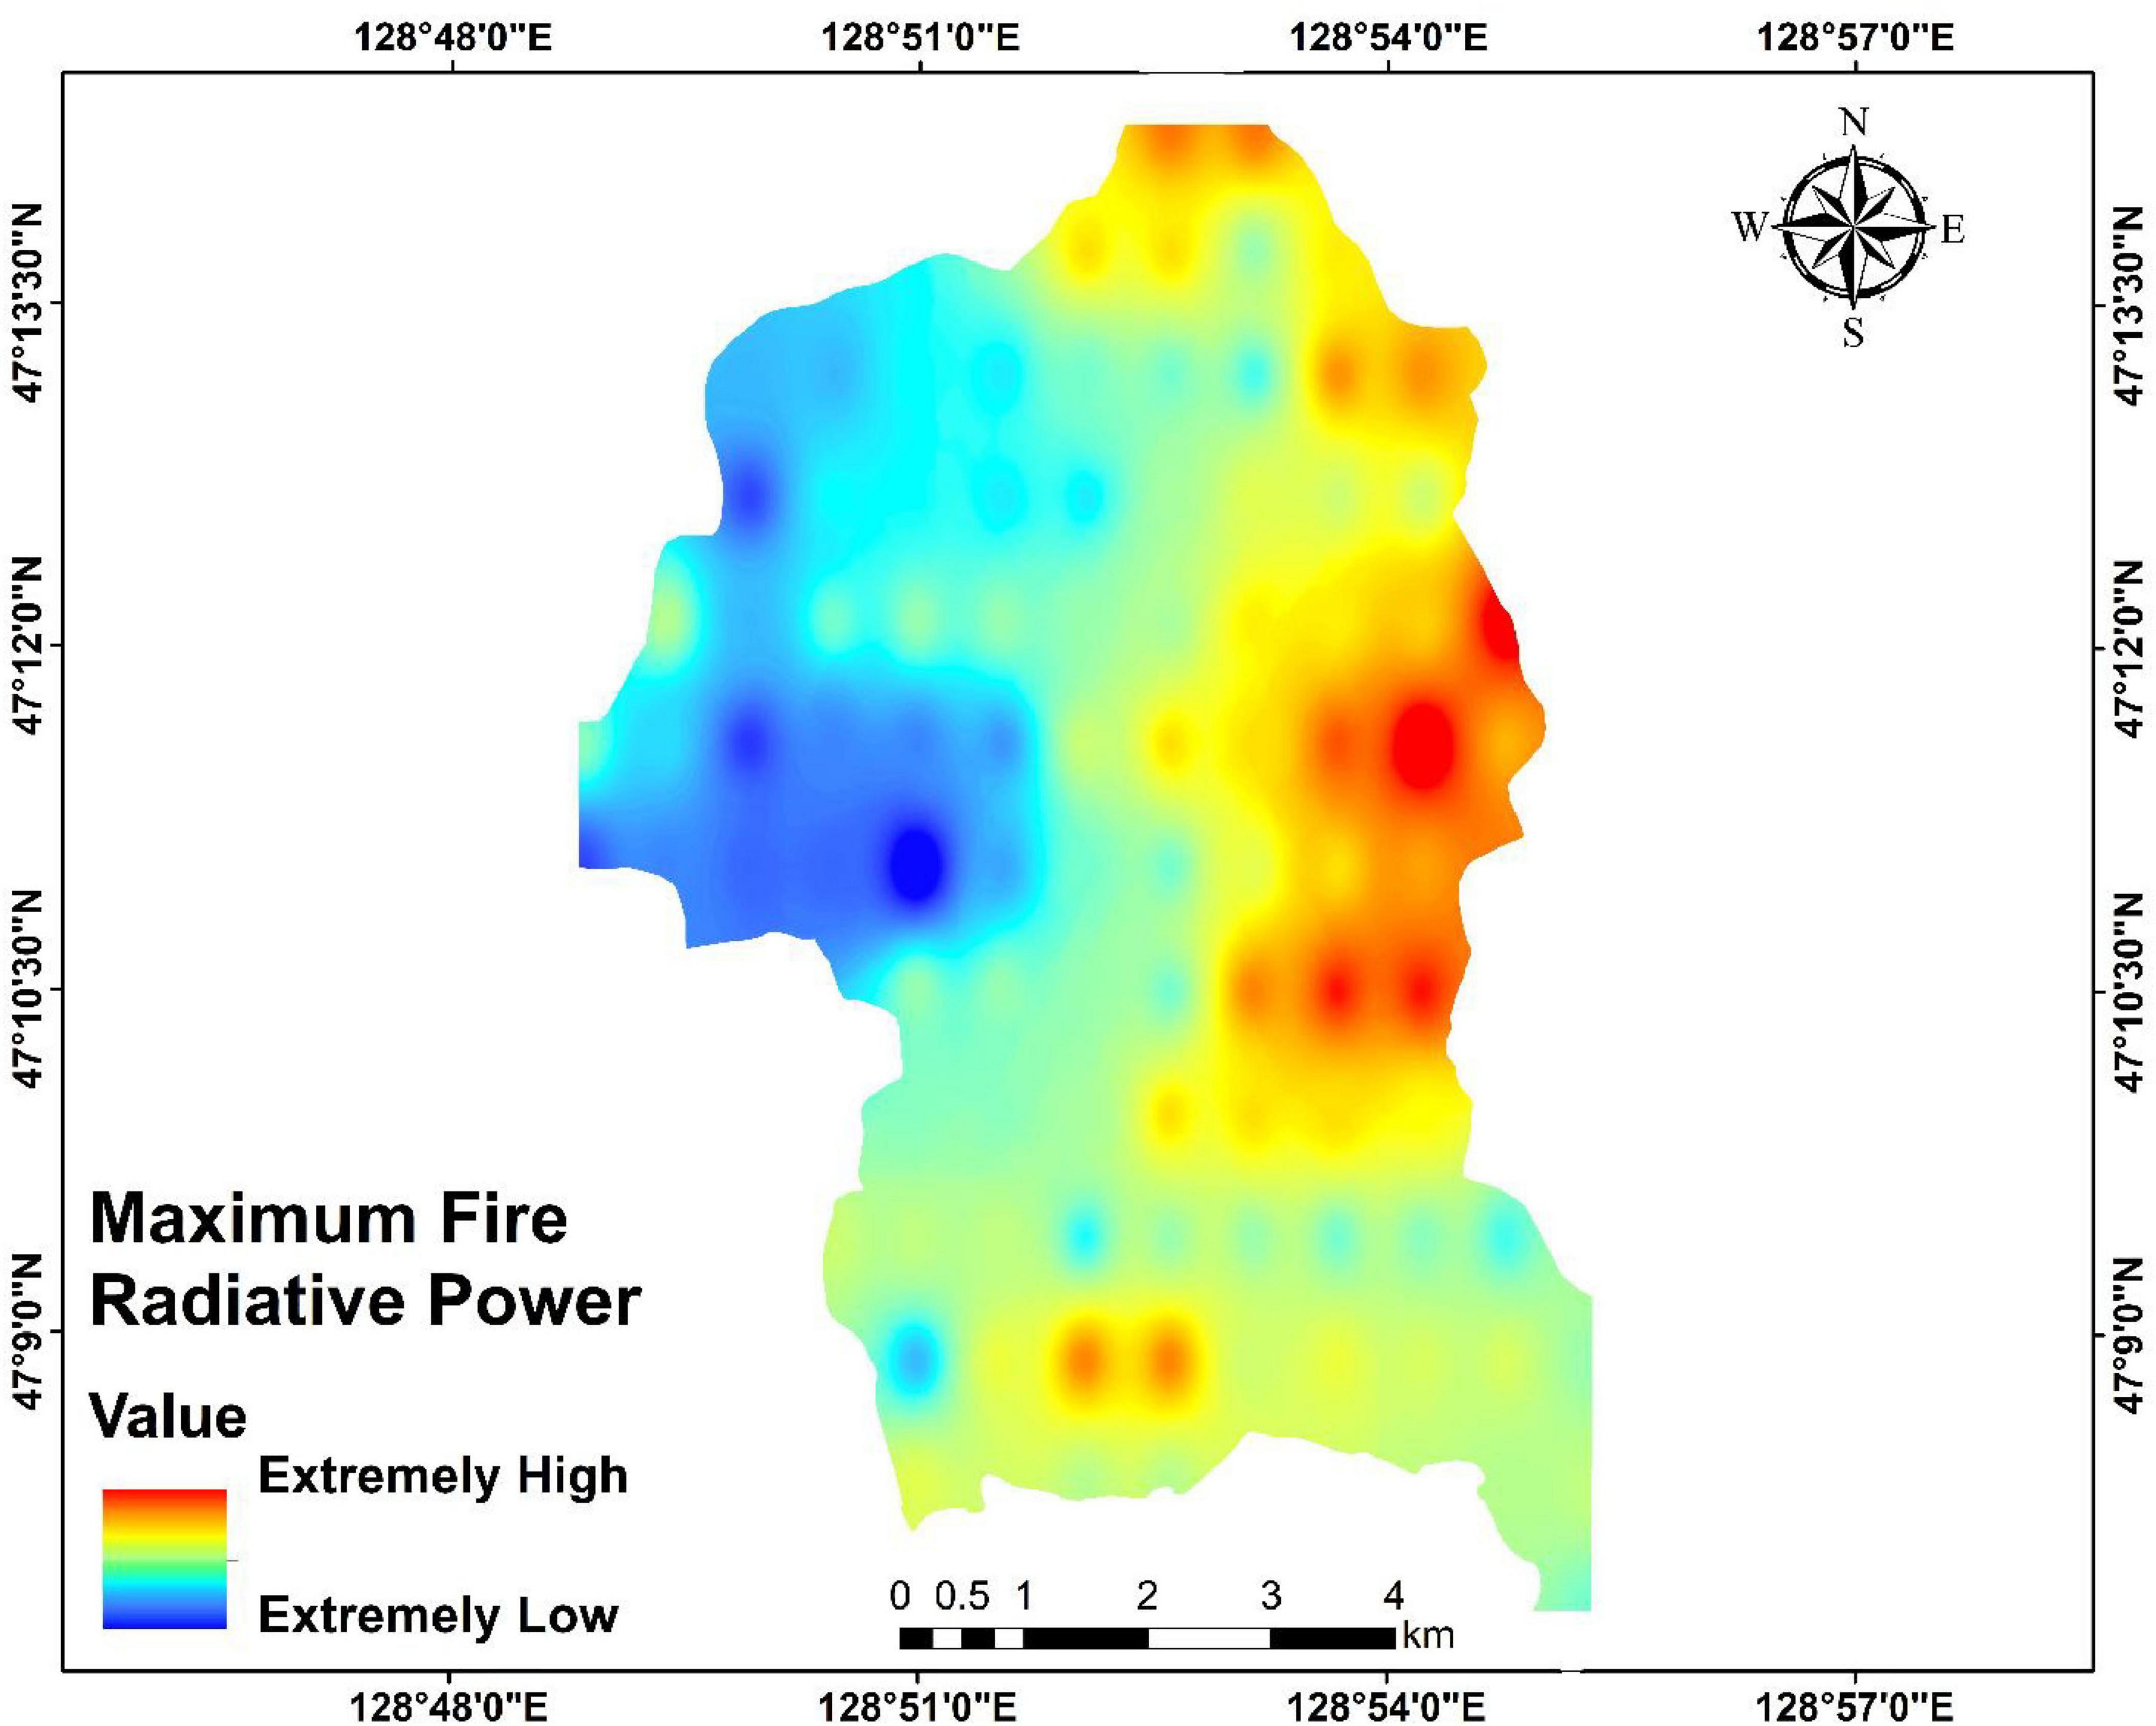
Figure 2. Modis fire map.
3 Results
3.1 Thematic layers for AHP, F-AHP and the dong model
Figure 3 shows the details of all factors (aspect, elevation, slope, topographic wetness index, proximity to roads, distance to settlements, population density, temperature, LULC, precipitation, wind speed, NDVI, and NDMI) are standardized and normalized in different models to ensure consistency and comparability of data for forest fire risk mapping in our study area. The maps are then classified using natural breaks, manual, and equal intervals. The details for each factor are presented below.
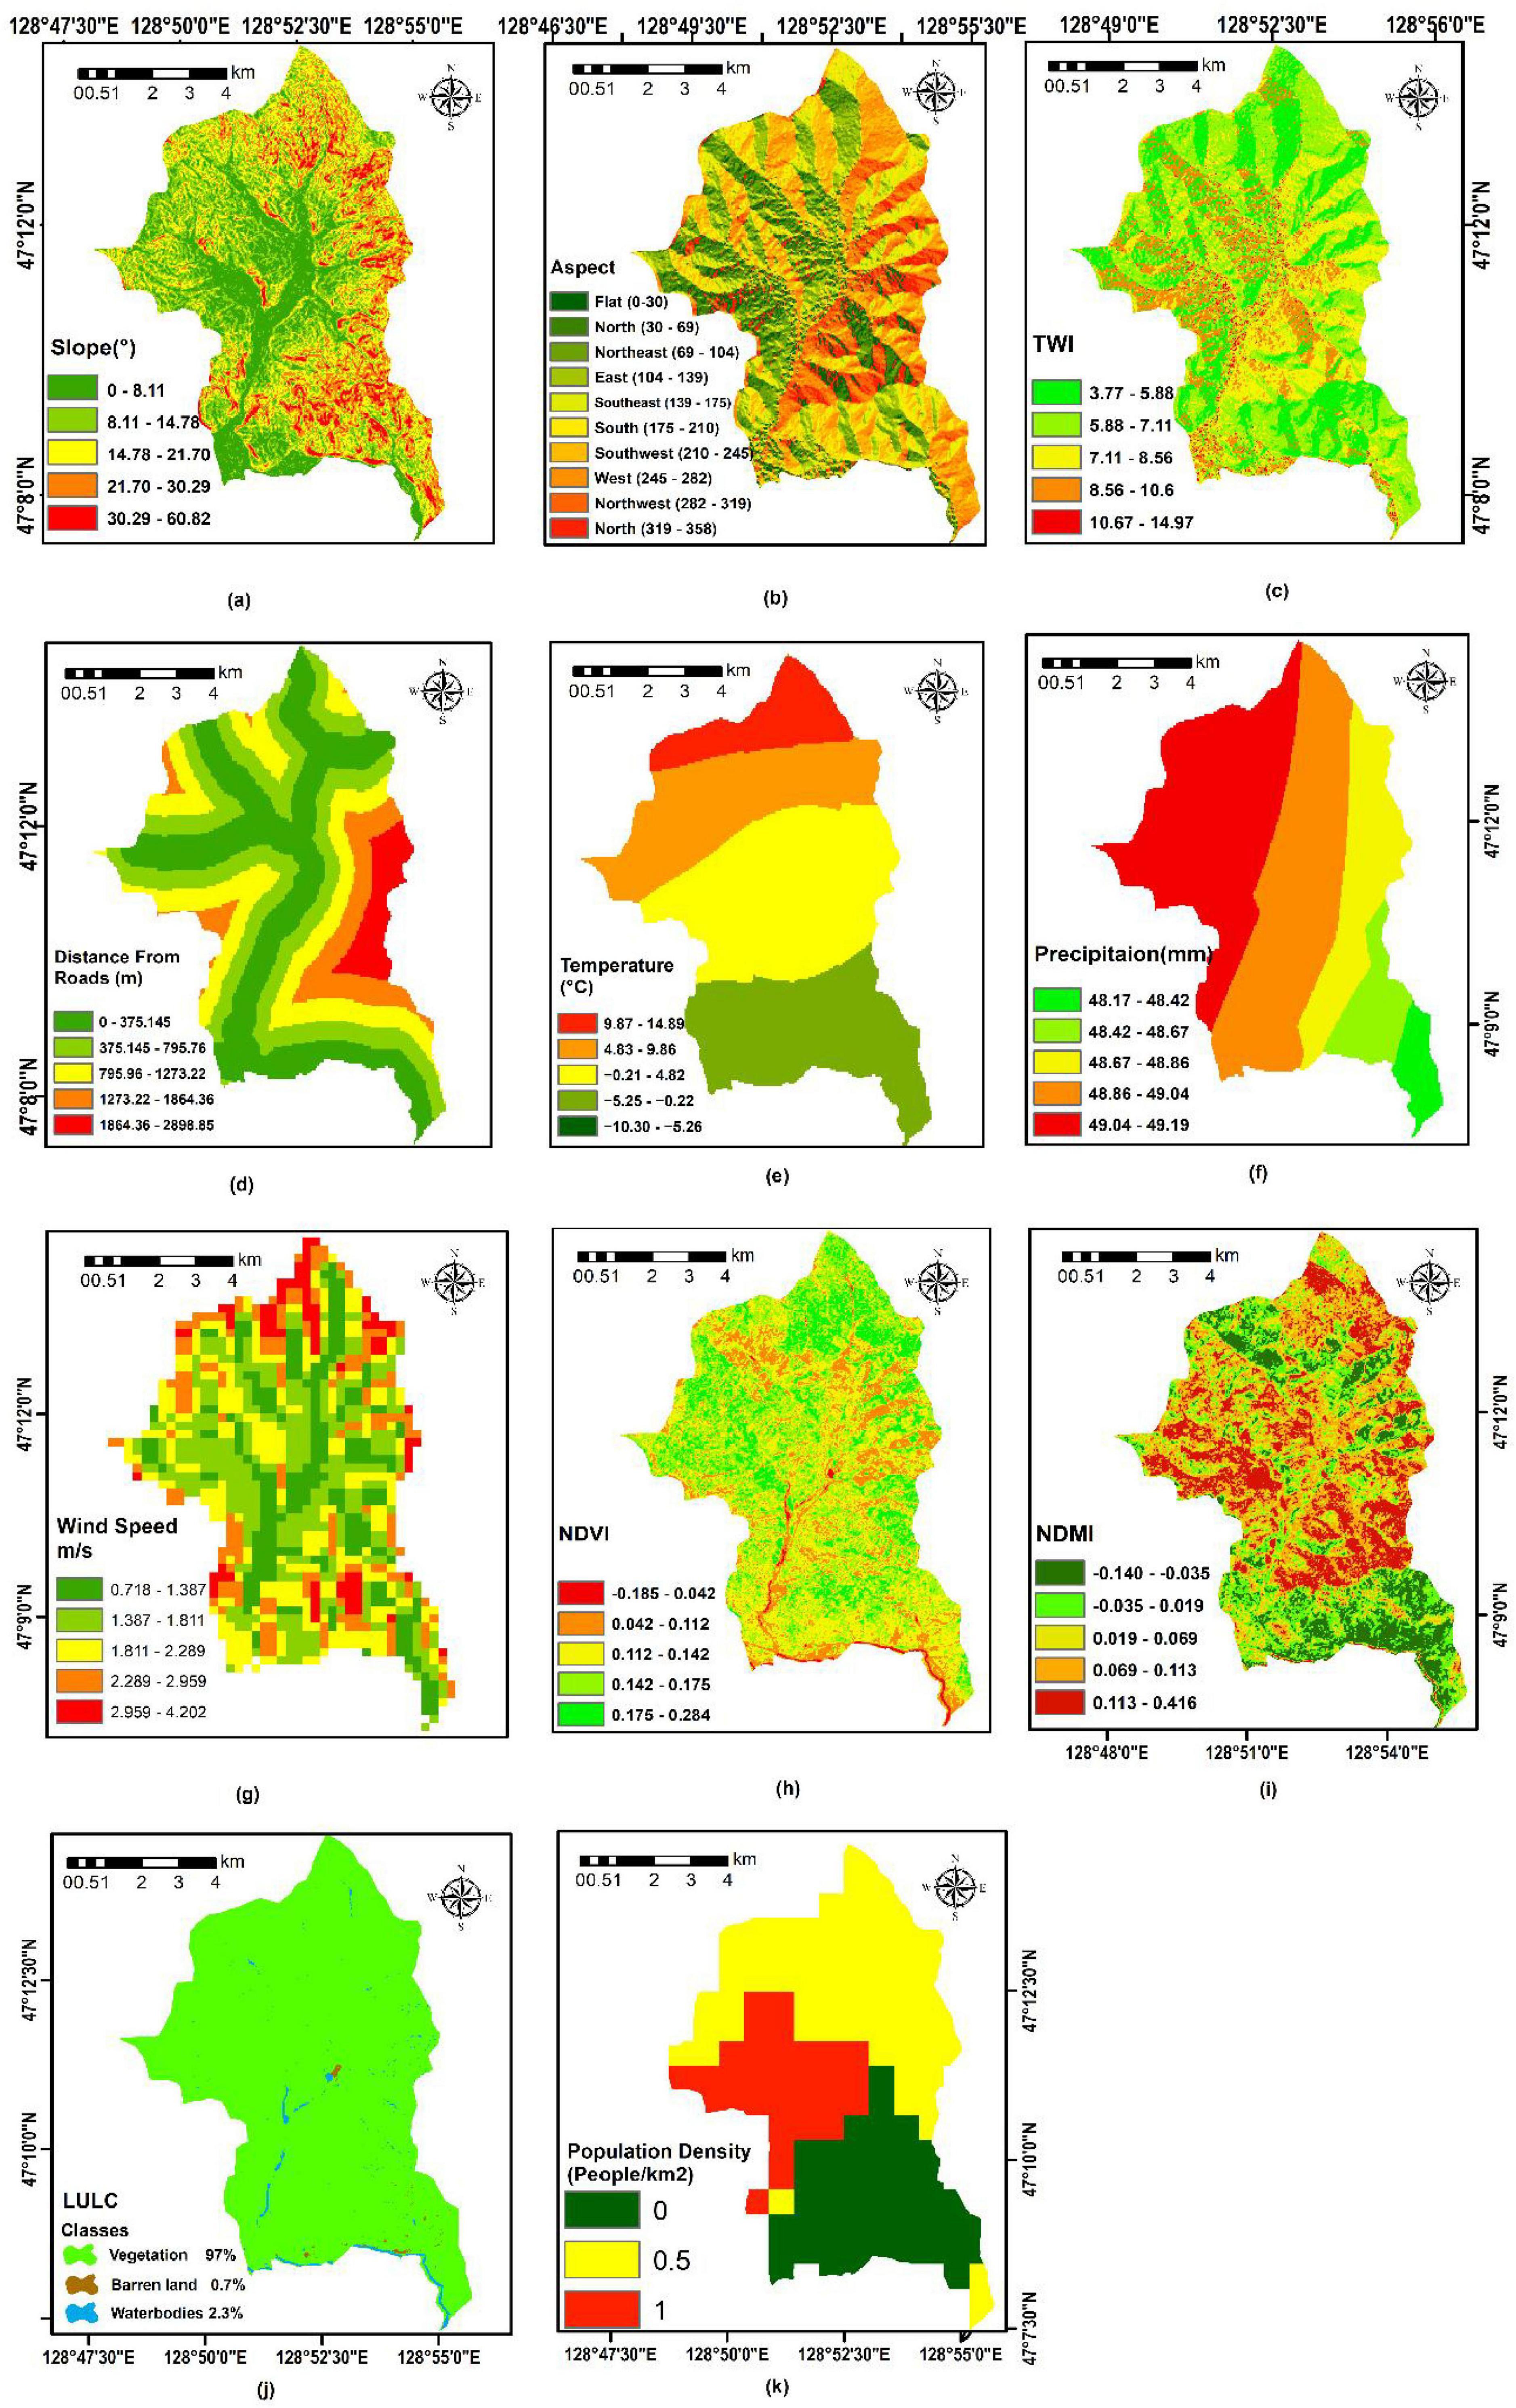
Figure 3. Spatial distribution of forest fire-governing factors Slope (a), Aspect (b), TWI (c), Distance from road (d), temperature (e), precipitation (f), wind speed (g), NDVI (h), NDMI (i), LULC (j), and Population Density (k).
Elevation is a crucial physiographic factor that influences the volume and duration of rainfall, exposure to the dominant wind, and fire behavior (Gaither et al., 2011). The diverse microclimates of Liangshui, shaped by variations in elevation, contribute to varying levels of fire susceptibility across the landscape. The reserve’s elevation ranges from 291 to 719 m, with an average of almost 400 m. The topography typically drops from north to south, and the region has a moderate continental monsoon climate, which makes it vulnerable to spring and fall droughts. The corresponding weight is allocated to the five classes. Figure 1 includes the map of the study area’s elevation classes.
The slope is the other most crucial factor contributing to the spread of fire. Fires typically spread uphill faster than downhill. Slope was used as a key criterion in fire susceptibility modeling through the AHP, Fuzzy AHP, and the Dong model methods. The slope values were classified into five risk categories: 0–15° as extremely low risk, 15–30° as low risk, 30–45° as moderate risk, 45–60° as high risk, and > 60.82° as extremely high risk (Figure 3a).
Aspect was included as a critical input. The aspect values were classified based on slope orientation and their potential influence on fire susceptibility. South and northeast-facing slopes were assigned as extremely high risk, followed by west-facing slopes high risk, flat and northwest-facing slopes moderate risk, southwest-facing slopes low risk, and east and north-facing slopes extremely low risk. The classification was grouped into ten categories: Flat, North, Northeast, East, Southeast, South, Southwest, West, and Northwest. This categorization integrates regional characteristics to support accurate fire susceptibility mapping (Figure 3b).
Topographic Wetness Index is an exploration of DEM data, revealing the intricate relationship of the hydrological landscape. TWI assists in locating areas in Liangshui where water accumulation is more likely to occur, resulting in increased soil moisture levels. TWI has a direct influence on how forest fire scenarios are developed and specifies the geographical distribution of soil moisture (Pallikarakis and Konstantopoulou, 2024; Figure 3c), such as (1) < 5.8, (2) 5.8–7.11, (3) 7.11–8.56, (4) 8.58–10.6, and (5) 10.67 >.
Distance from roads is a critical factor in assessing fire risk, as areas closer to roads are more accessible and hence more vulnerable to human-induced ignition. In this study, the region was divided into five risk classes based on proximity to roads: areas within 0–375.145 m were classified as extremely high risk; 375.145–795.76 m as high risk; 795.76–1273.22 m as moderate risk; 1273.22–1864.36 m as low risk; and distances beyond 1864.36–2898.85 m as extremely low risk. The Liangshui National Nature Reserve, situated on the eastern slope of the Dali Range in the southern Lesser Xing’an Range, contains an extensive network of forest roads that serve as vital infrastructure for forest management and fire emergency access. This spatial classification was integrated to reflect how road proximity influences fire susceptibility (Figure 3d).
The distance from settlements plays a significant role in assessing forest fire risk due to the anthropogenic influences that settlements often bring. Proximity to human settlements has been identified as a critical factor influencing the likelihood of forest fires, as human activities can increase fire hazards through both direct and indirect actions. This includes agricultural practices, disposal of flammable materials, and increased traffic from roads and pathways leading to potential ignition sources (Özcan et al., 2024).
Population density plays a significant role in forest fire risk assessment due to its impact on the vulnerability and exposure of areas to fire hazards. Higher population densities tend to increase the likelihood of fires, primarily because populated areas often contain infrastructural elements, human activity, and economic assets that can both cause and be affected by wildfires. In forest fire risk assessments, population density is considered a key factor in understanding and managing the potential impact on human life, property, and economic activities. Forest fire risk assessments often integrate population density with other factors such as land use, topography, and meteorology to create comprehensive risk models. For instance, the combination of population density with variables like distance from roads and settlements has shown strong relationships with wildfire occurrence (Jafarzadeh et al., 2017).
Temperature is directly proportional to forest fires. High temperatures increase the risk of forest fires because they make fuels more flammable (Flannigan et al., 2016). The base map for temperature is divided into five classes: low temperature, low risk; high temperature, high risk; and so on (Figure 3e).
Precipitation is an important meteorological factor that plays an important role in FFR assessment. The small difference in precipitation between the “Extremely High Risk” and “Extremely Low Risk” categories may seem minor. Still, in the context of fire risk assessment, even small variations in precipitation can have a significant impact. The classification system of MCDA aims to capture the nuances of how slight changes in environmental factors can affect fire risk. In regions like the Liangshui National Nature Reserve, small changes in precipitation can significantly affect fuel moisture and, in turn, fire risk. The precipitation map was also categorized into five classes: high precipitation leads to low risk, while less precipitation leads to high fire risk (Figure 3f).
One of the meteorological factors that significantly affects an area’s fire intensity and spread is wind speed. Wind speed increases the quantity of new oxygen in the fire, causing the flames to ignite more quickly and instantly (Bessie and Johnson, 1995; Eskandari, 2017). The base map for wind speed is also divided into five classes: slow wind speed for lower risk, more wind for high fire risk, and so on (Figure 3g).
The vegetation cover was almost 96% in Liangshui National Nature Reserve (Wanli, 1999). However, according to our land use land cover (LULC) analysis, which is now 97% (Figure 3j). The area is rich in flammable wood, significantly influencing the likelihood of fire ignition. Since different vegetation types have varying moisture contents, their chances of igniting also differ. The NDMI is especially important because it shows the trees’ moisture content, which directly affects their ignition susceptibility. Based on the classification criteria and weight. NDMI can be divided into five levels (Figure 3i).
Normalized difference vegetation index is a widely used vegetation indicator that correlates with vegetation density and health, two key factors in determining the potential severity and spread of wildfires. Therefore, it is crucial to incorporate it into fire risk assessment. NDVI is a crucial tool for evaluating the condition of plant cover. Positive values on the NDVI scale signify the presence of green vegetation, while lower values indicate other surface features. NDVI classes have also been made (Figure 3h).
Normalized difference moisture index indicates vegetation health and biomass, which are directly related to the fuel load available for fires. RED signifies red band reflectance, and NIR denotes near-infrared reflectance. The images were categorized using NDVI, creating NDVI maps for the study area. The NDMI was used to estimate the moisture content in both soil and vegetation.
3.2 Forest fire risk mapping using AHP
This study employs the AHP to evaluate wildfire risk factors in the Liangshui National Nature Reserve. Using a pairwise comparison approach, the AHP methodology allowed us to systematically assess factors, including aspect, elevation, slope, topographic wetness index, proximity to roads, distance to settlements, population density, temperature, precipitation, wind speed, NDVI, and NDMI (Table 5). After pairwise comparison, each factor was then normalized (Table 6).
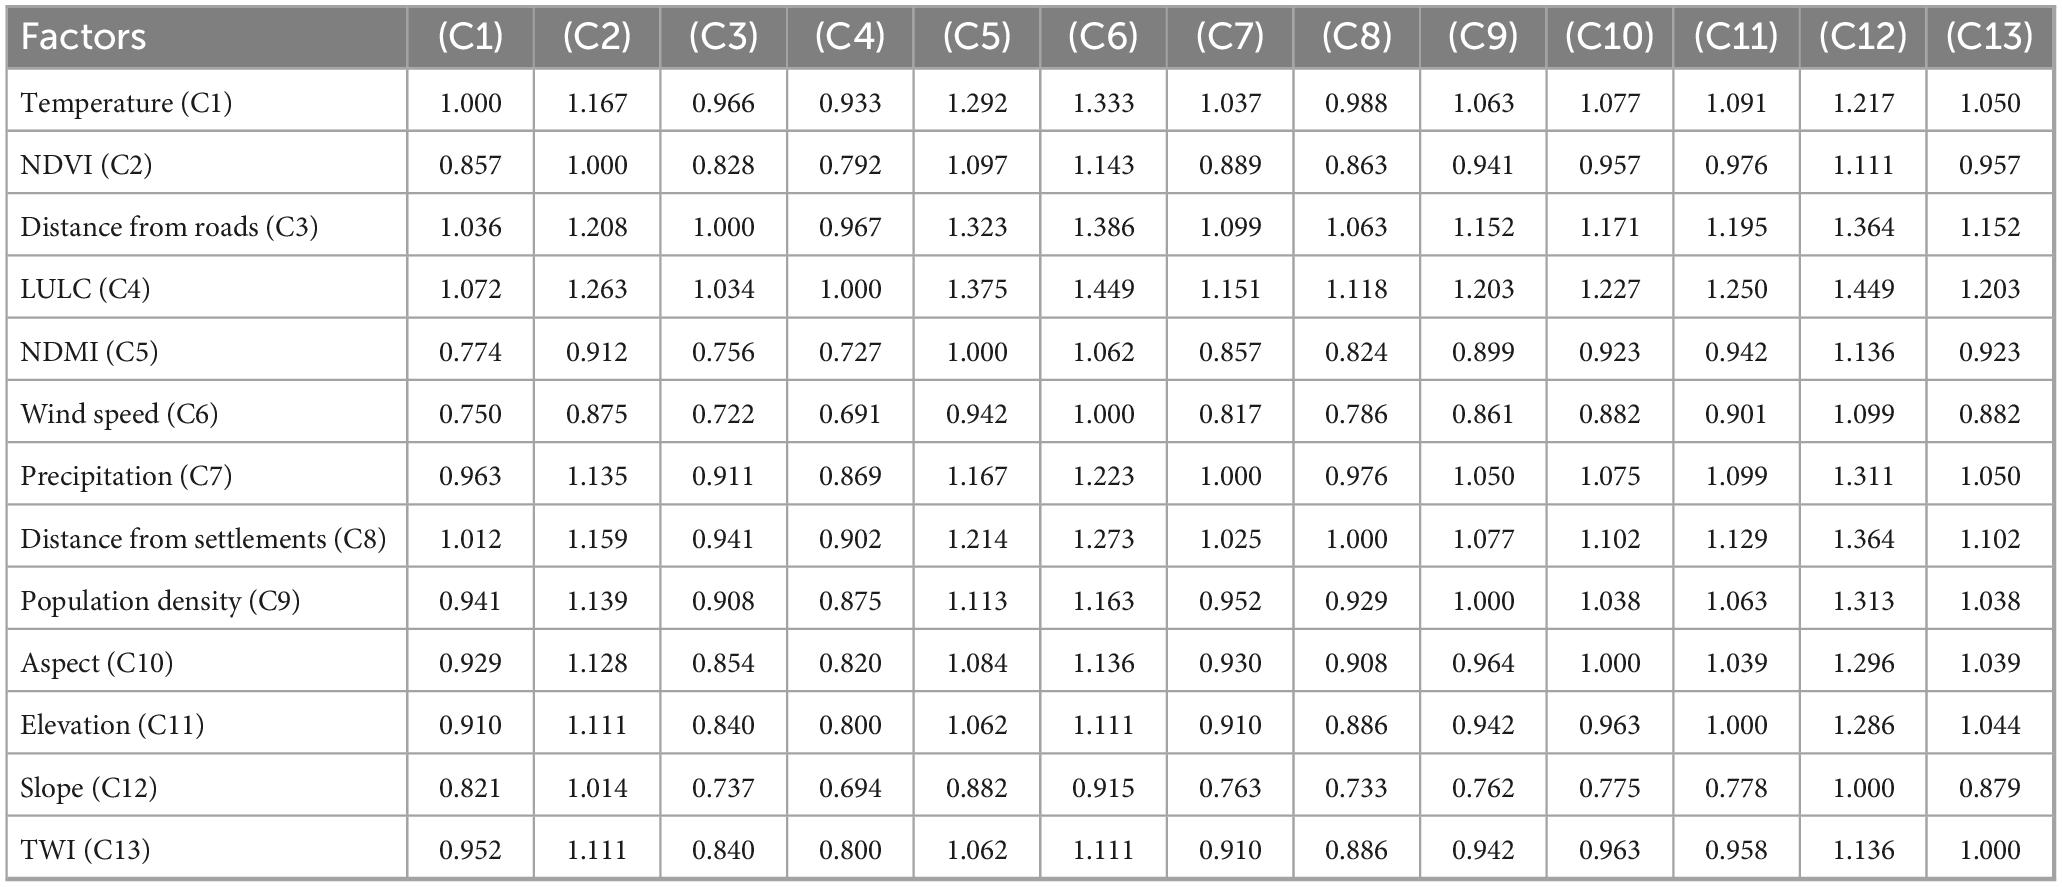
Table 5. Pairwise comparison matrix of Analytical Hierarchy Process (AHP) factors.
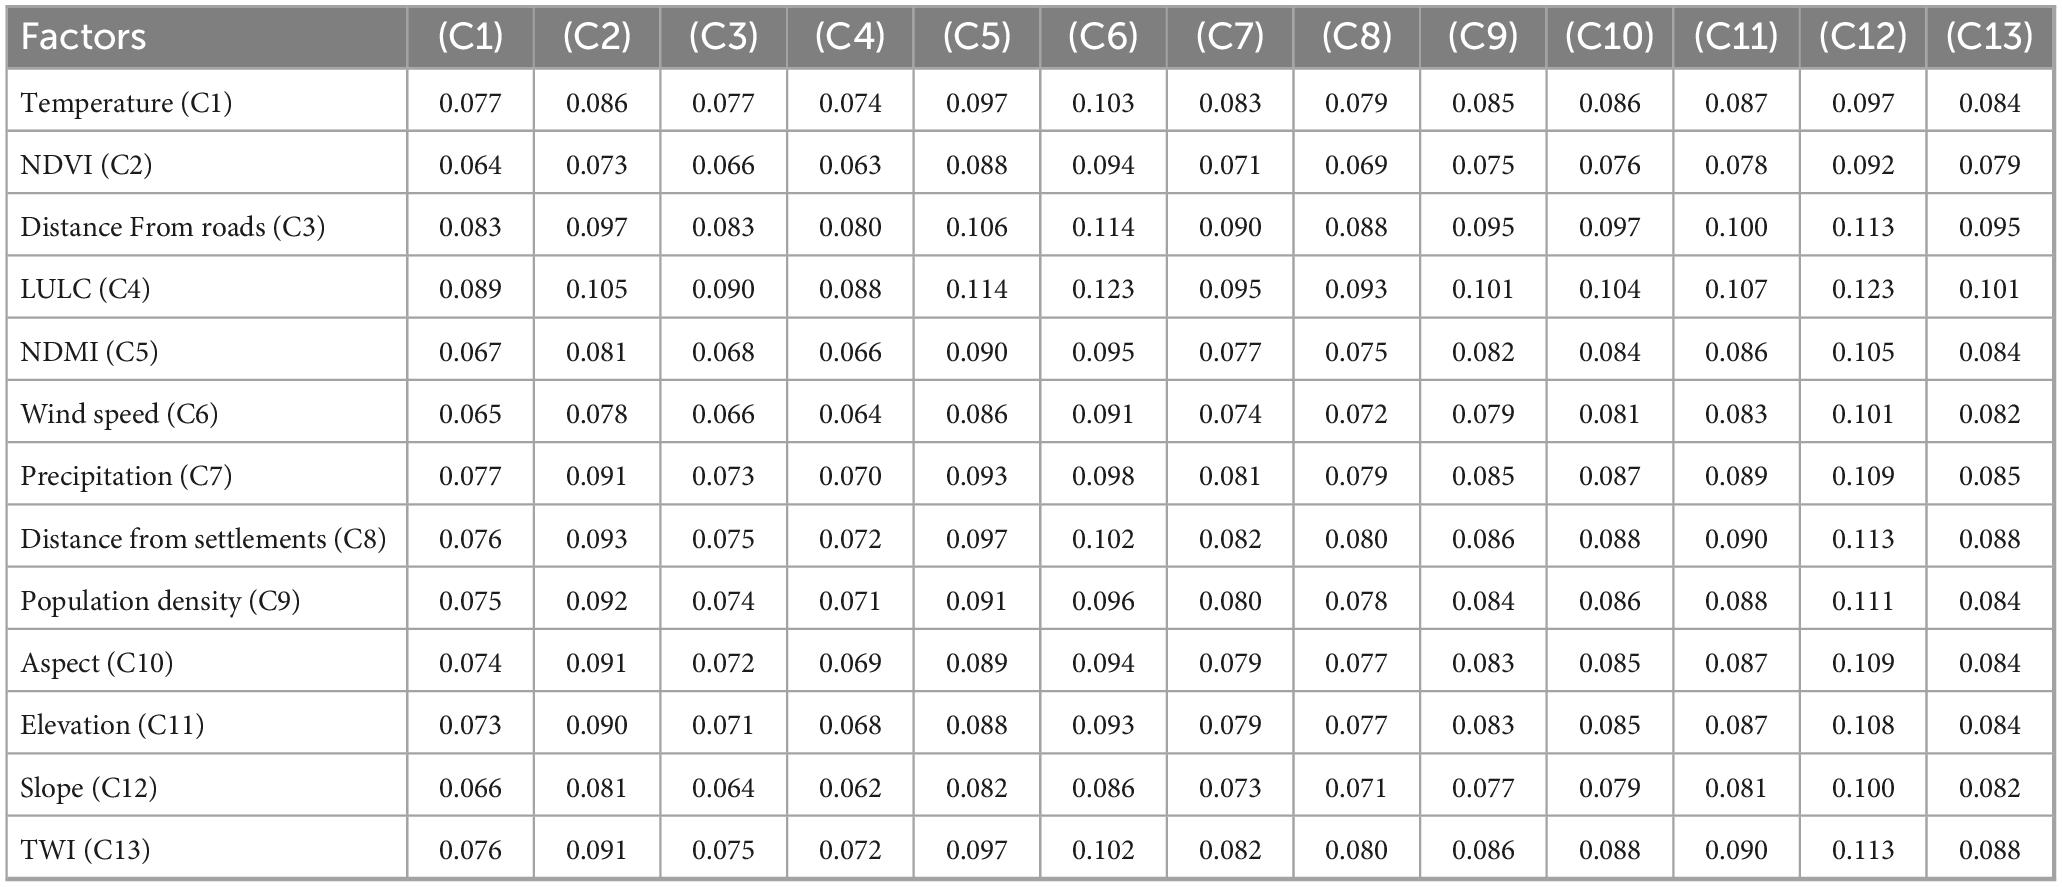
Table 6. Normalized matrix of each factor.
By classifying and processing the data utilized in this model, we produced a hierarchical analysis of the factors influencing the risk of forest fires. Each factor was categorized into five risk levels from extremely low to extremely high (Table 7). Finally, a forest fire risk map was created that reflected the risk levels in Liangshui National Nature Reserve locations. Each location is categorized based on the overall influence of the weighted elements (Figure 4). The importance of the weights was confirmed by calculating the consistency index (CI) and the consistency ratio (CR). The CR is 0.0107, which is less than 0.1 and falls within the acceptable range, suggesting that the pairwise comparisons are consistent and the model is reliable. The results indicate that areas classified as extremely low, low, moderate, high, and extremely high fire risk are represented accordingly, with their spatial distribution illustrated in Figure 4.
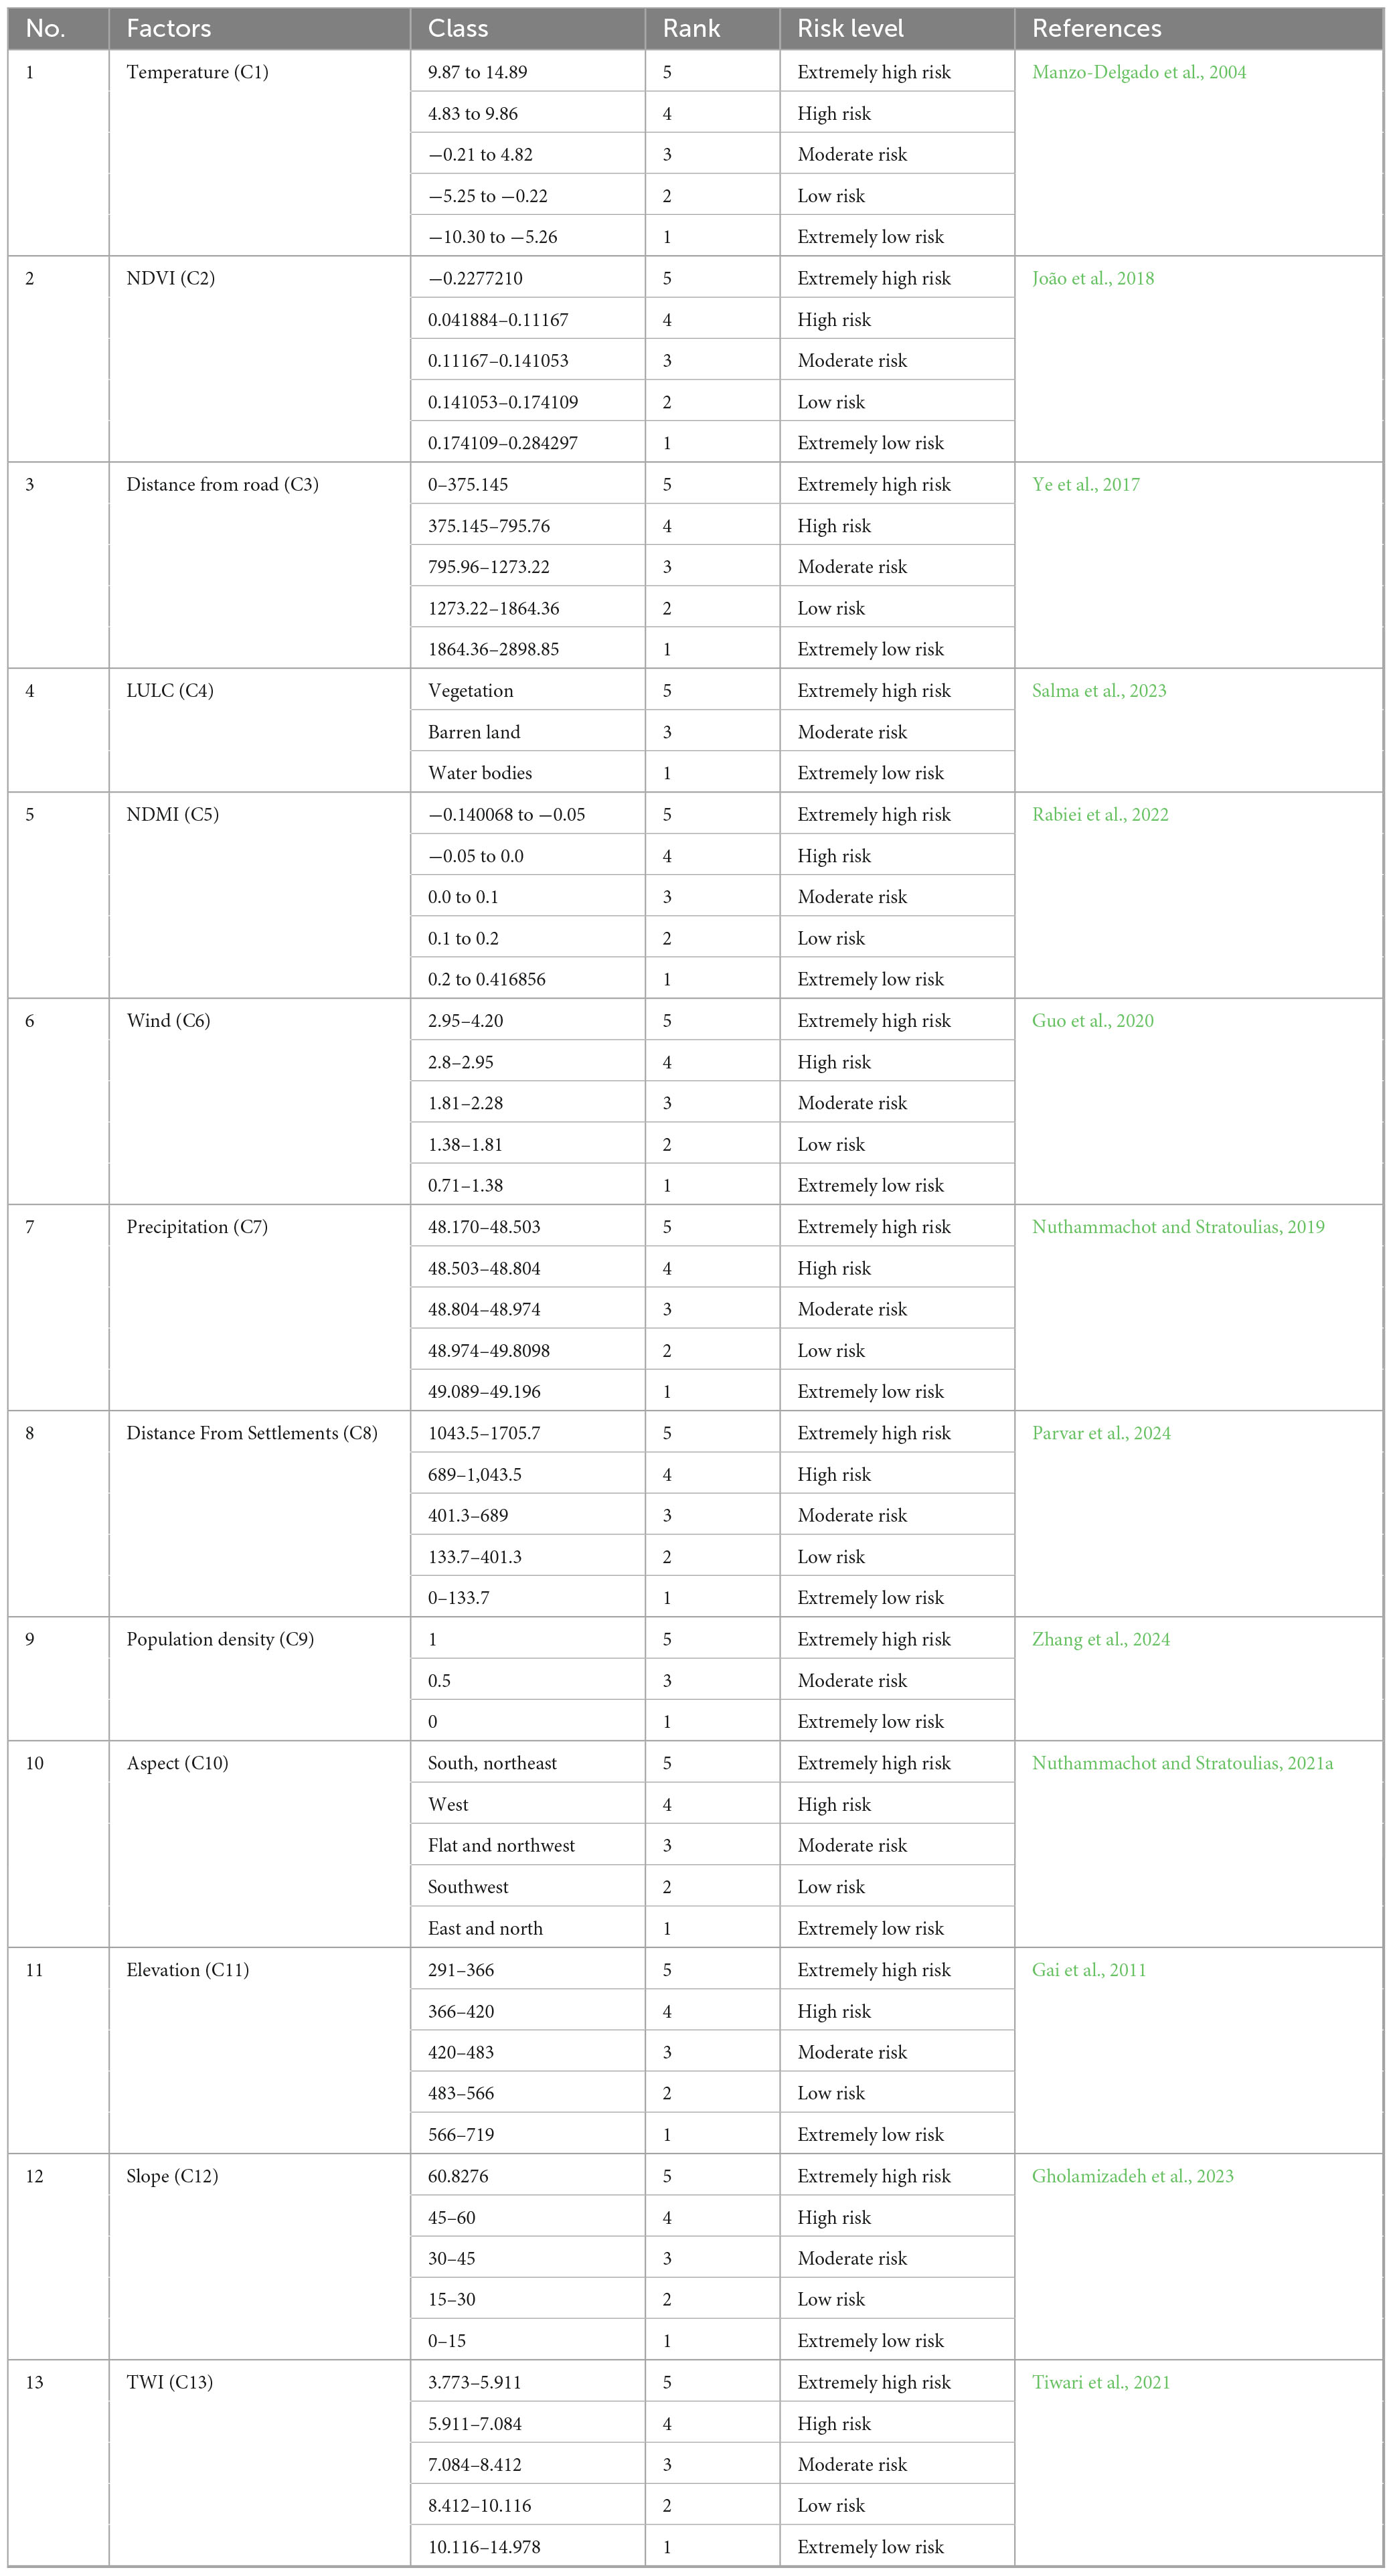
Table 7. Classification of thematic layers.
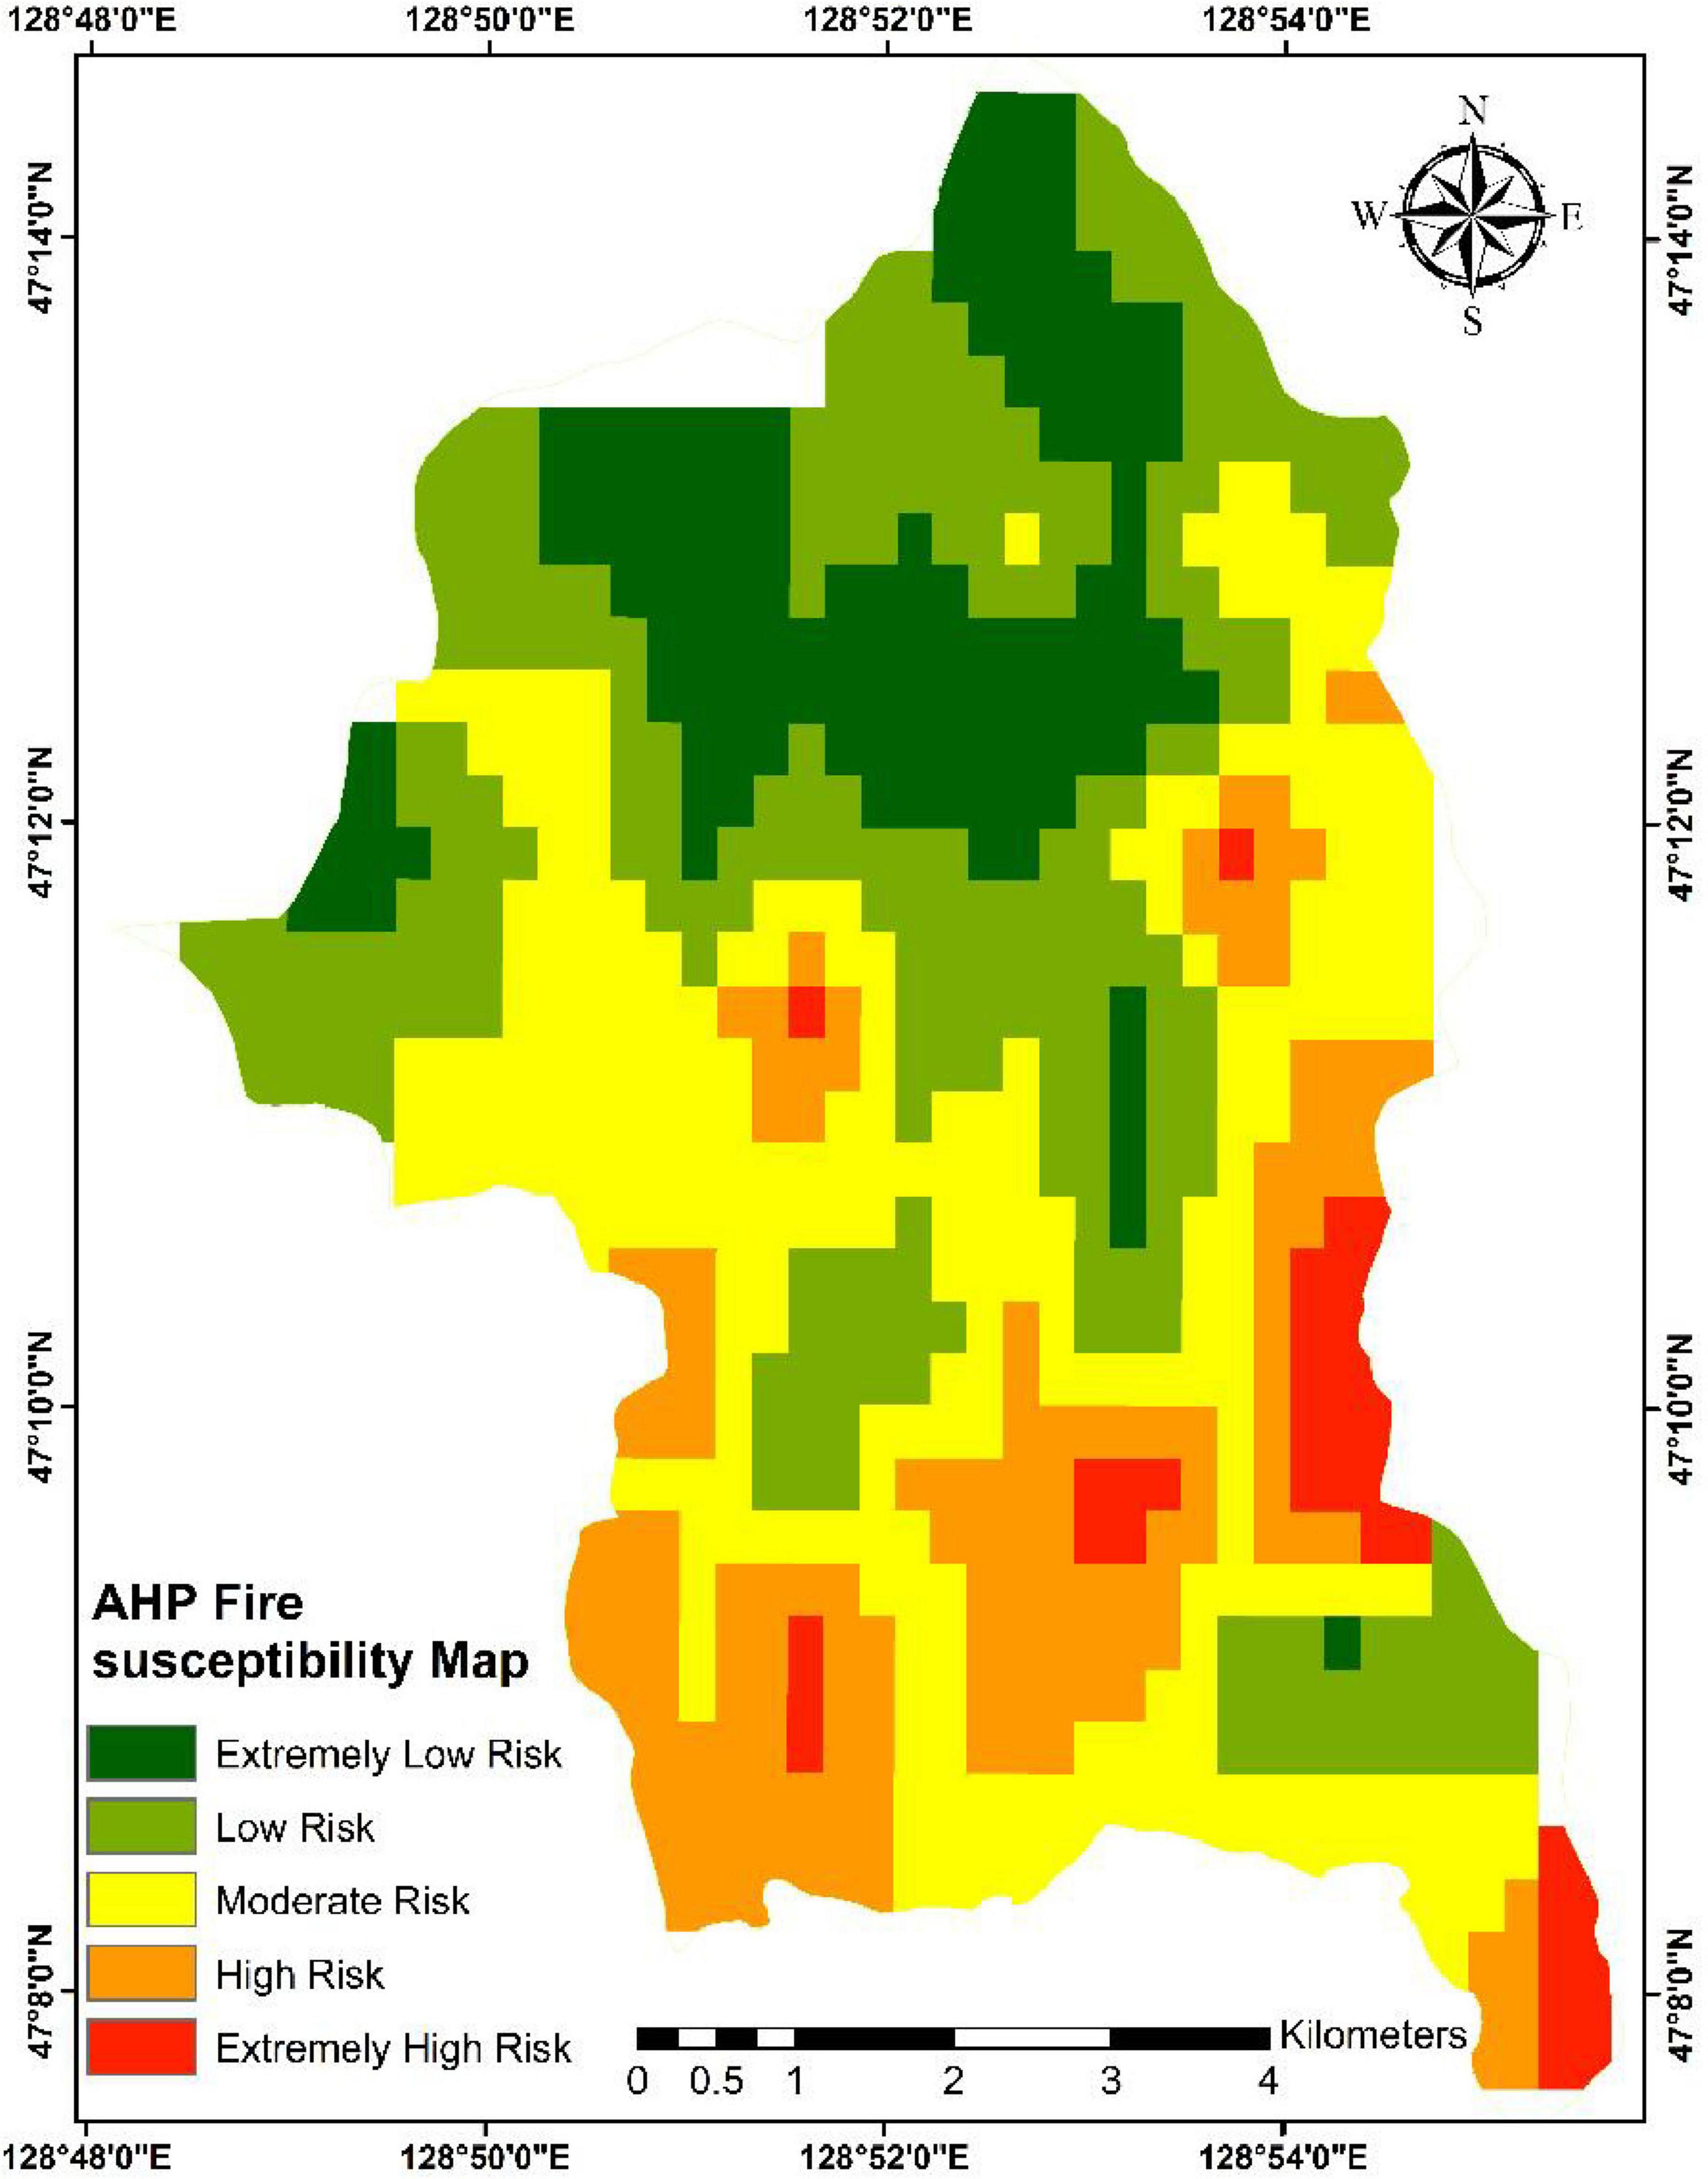
Figure 4. Forest fire risk map of Analytical Hierarchy Process (AHP).
Value of lambda max (λ) = 13.2, Consistency index (CI) = 0.016, Consistency ratio (CR) = 0.0107
3.2.1 Fuzzy-AHP based fire risk map
Thirteen key criteria were selected for FFR assessment: aspect, elevation, slope, topographic wetness index, proximity to roads, distance to settlements, population density, temperature, LULC, precipitation, wind speed, NDVI, and NDMI. Based on Saaty’s Scale, expert judgment was used to produce a pairwise comparison matrix that ranked the relevance of each criterion compared to the others (Table 8). Each column of the matrix was normalized, and the average value of each row was computed to derive the final weights of each criterion, as explained in Tables 9, 10. The principal eigenvalue (λmax) was computed, followed by the Consistency Index (CI) and the Consistency Ratio (CR). A CR value below 0.1 indicated an acceptable level of consistency. The weighted overlay method applied the computed weights to raster layers in ArcGIS. The resulting fire risk map represented the final output of the Fuzzy AHP. The final FFR map was generated from the normalized weights through a linear weighted combination, split into five classes using the natural break method (Figure 5).
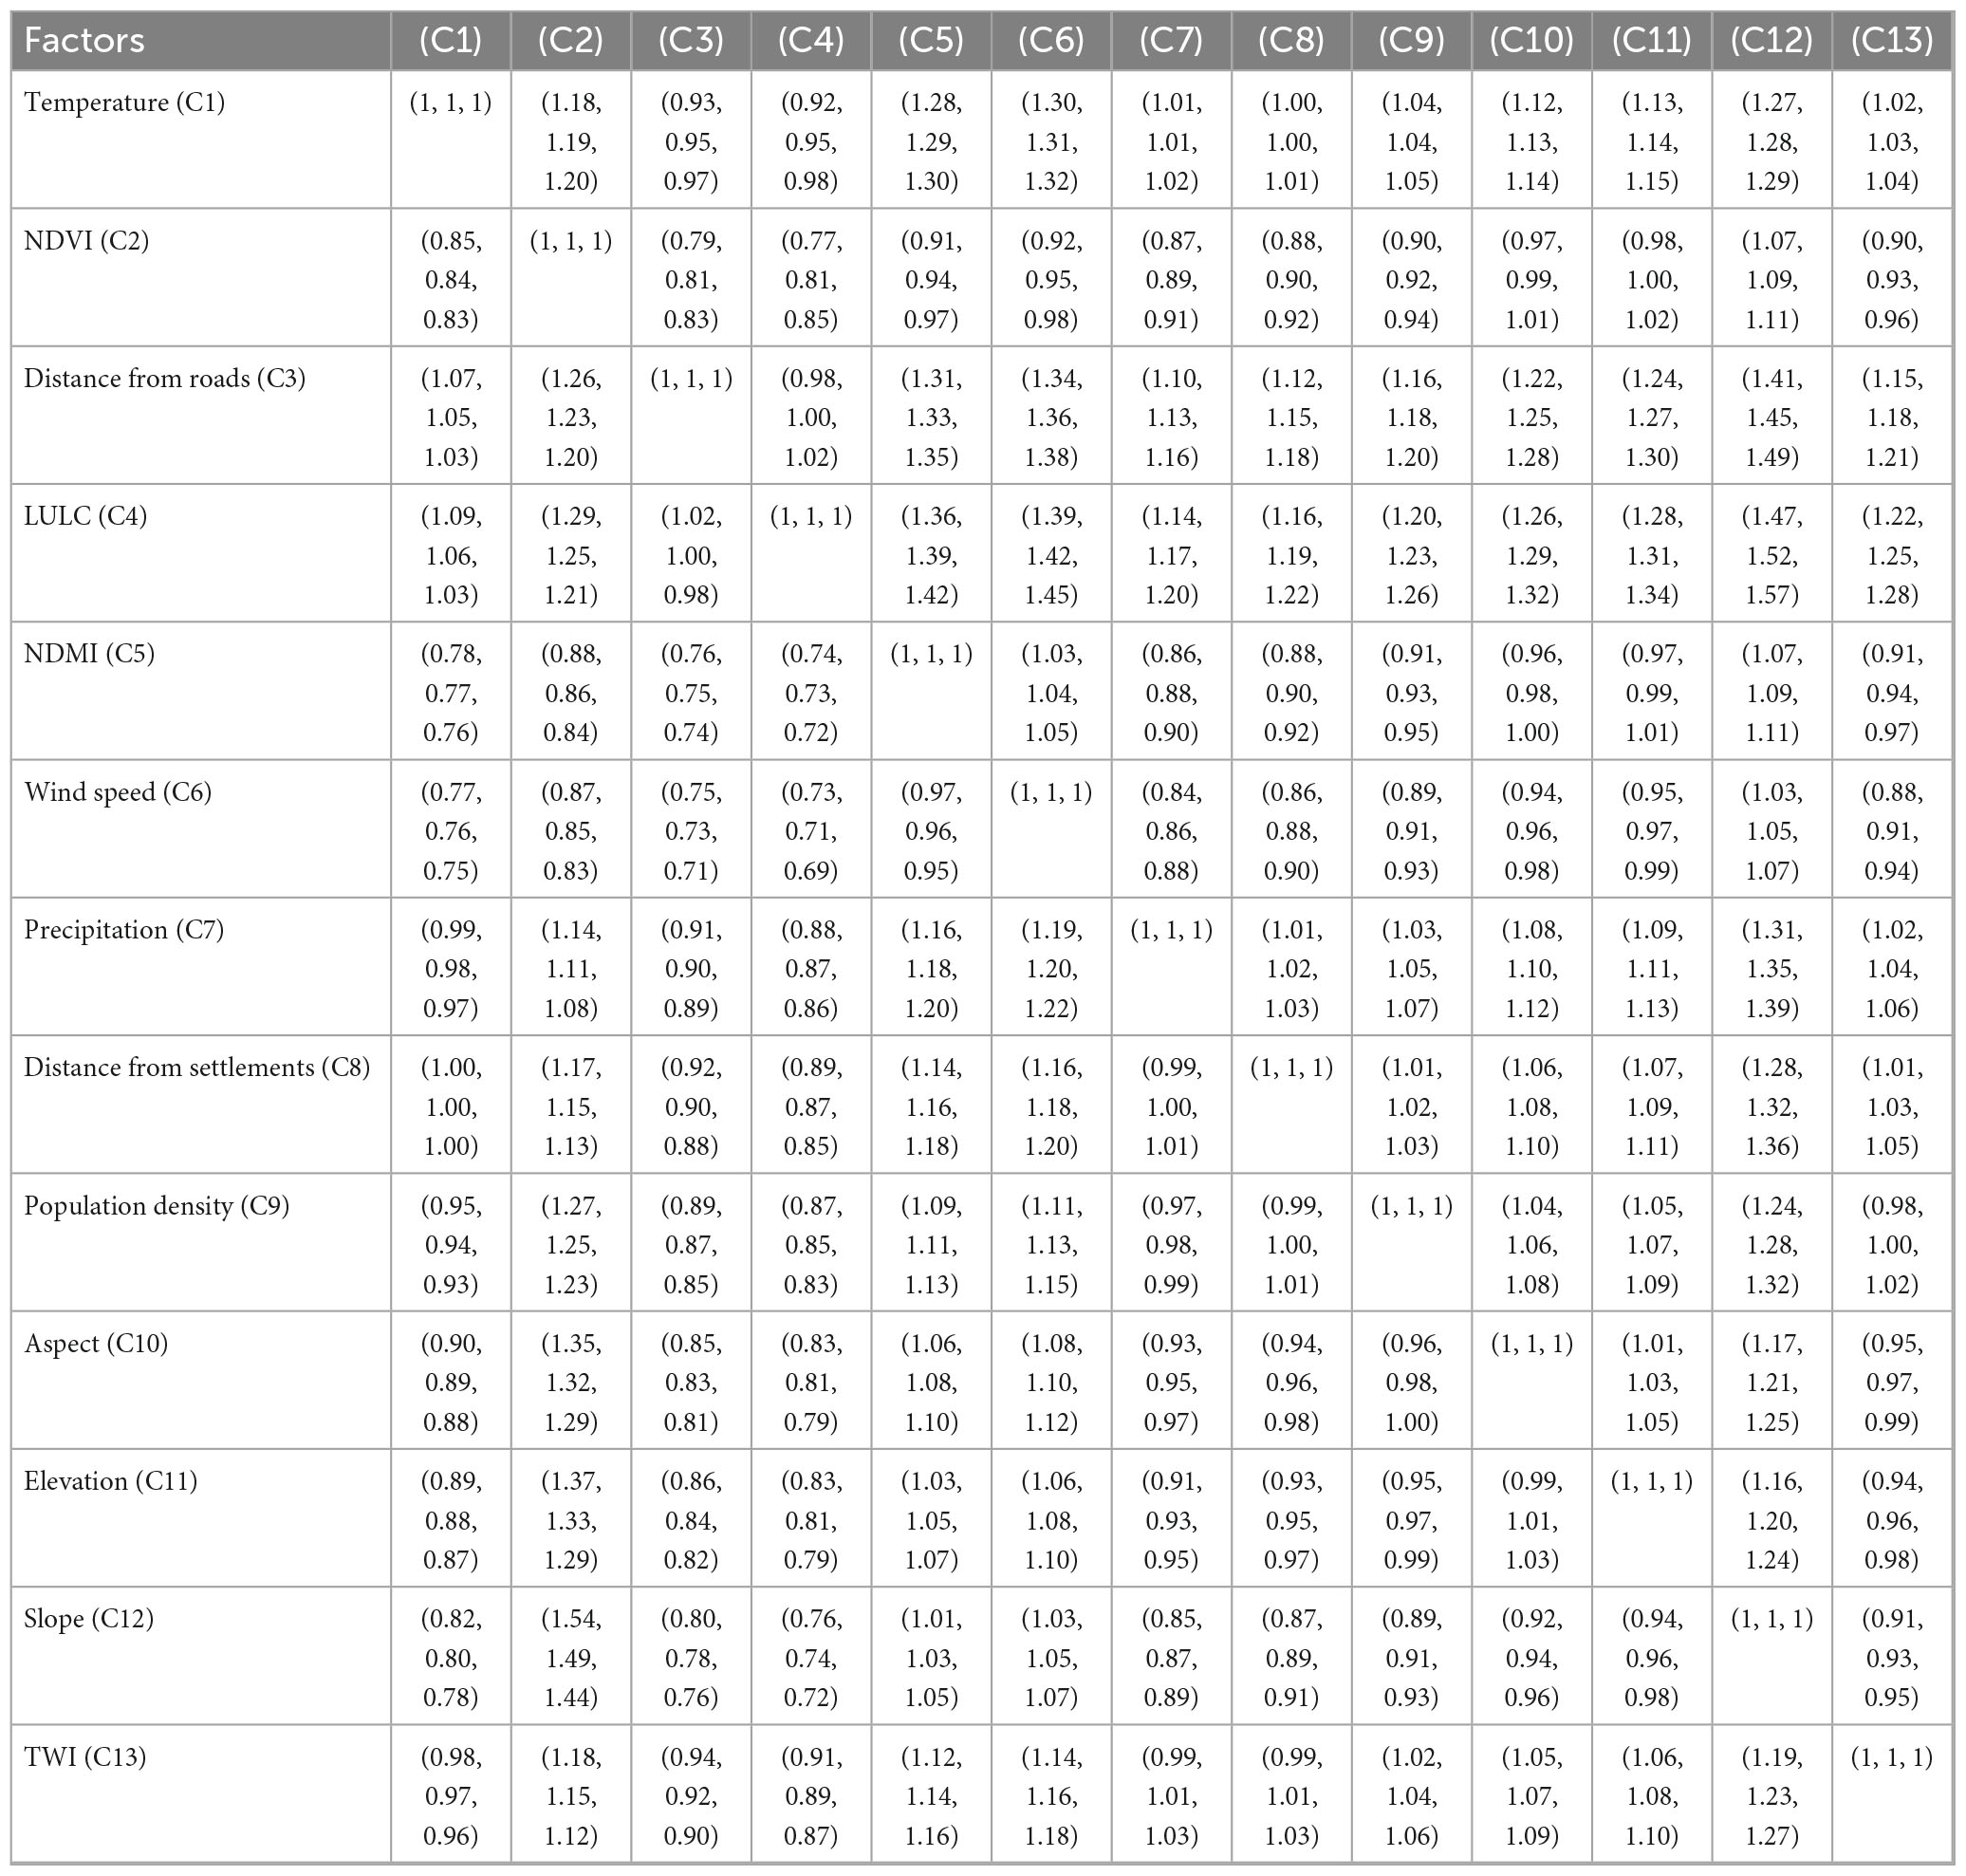
Table 8. Pairwise matrix of Fuzzy Analytic Hierarchy Process (F-AHP).
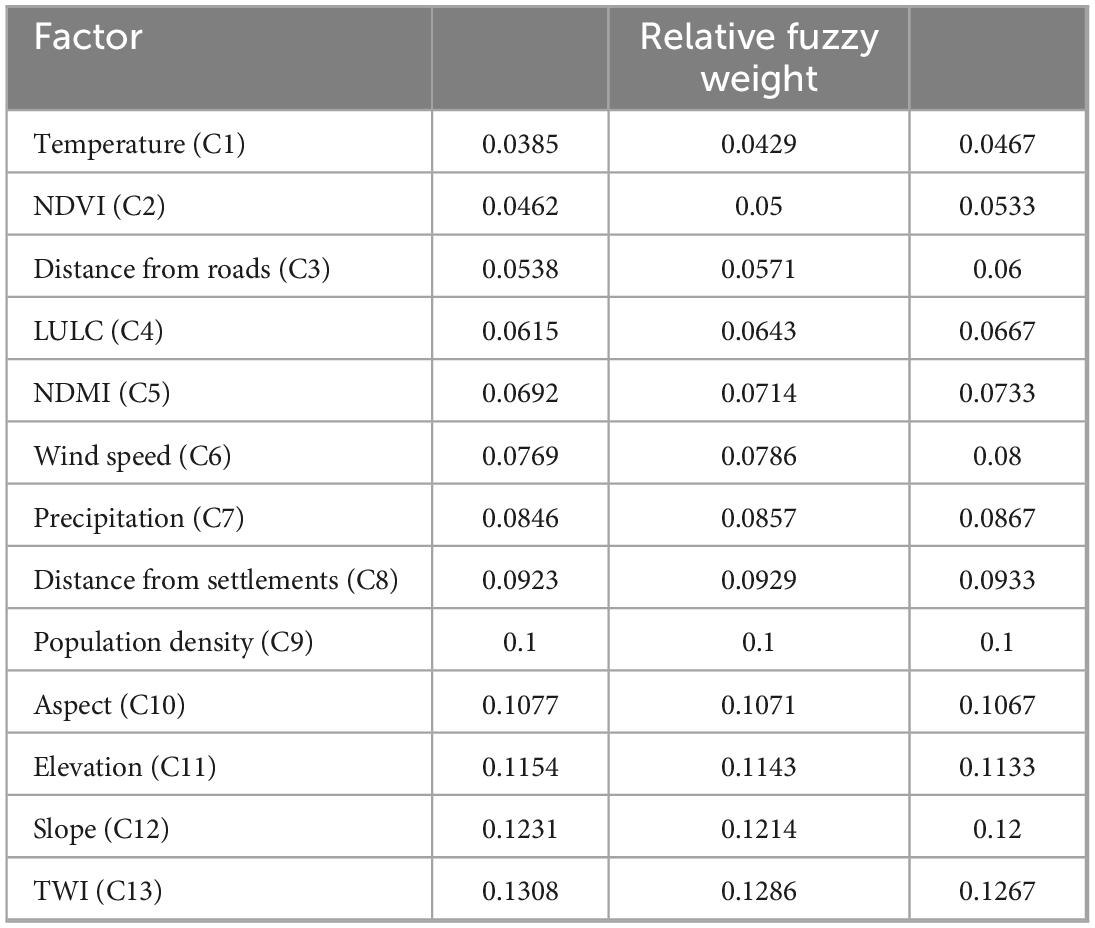
Table 9. Relative weights Fuzzy Analytic Hierarchy Process (F-AHP).
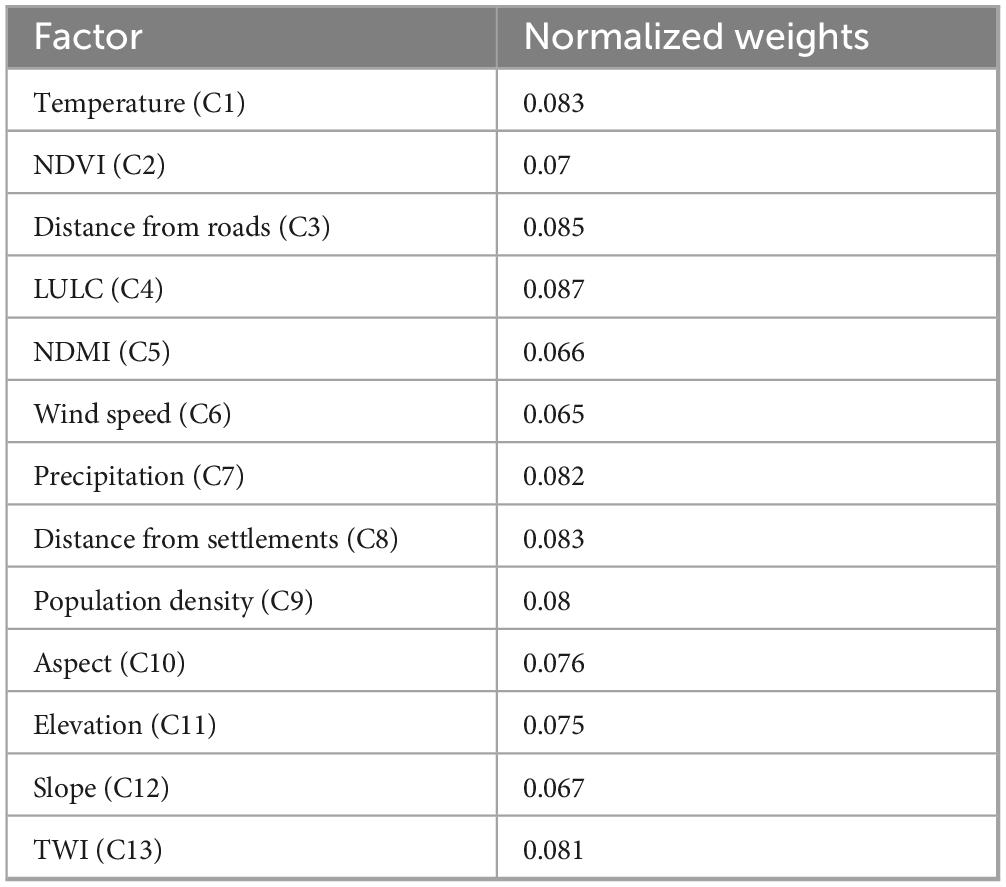
Table 10. Normalized weights.
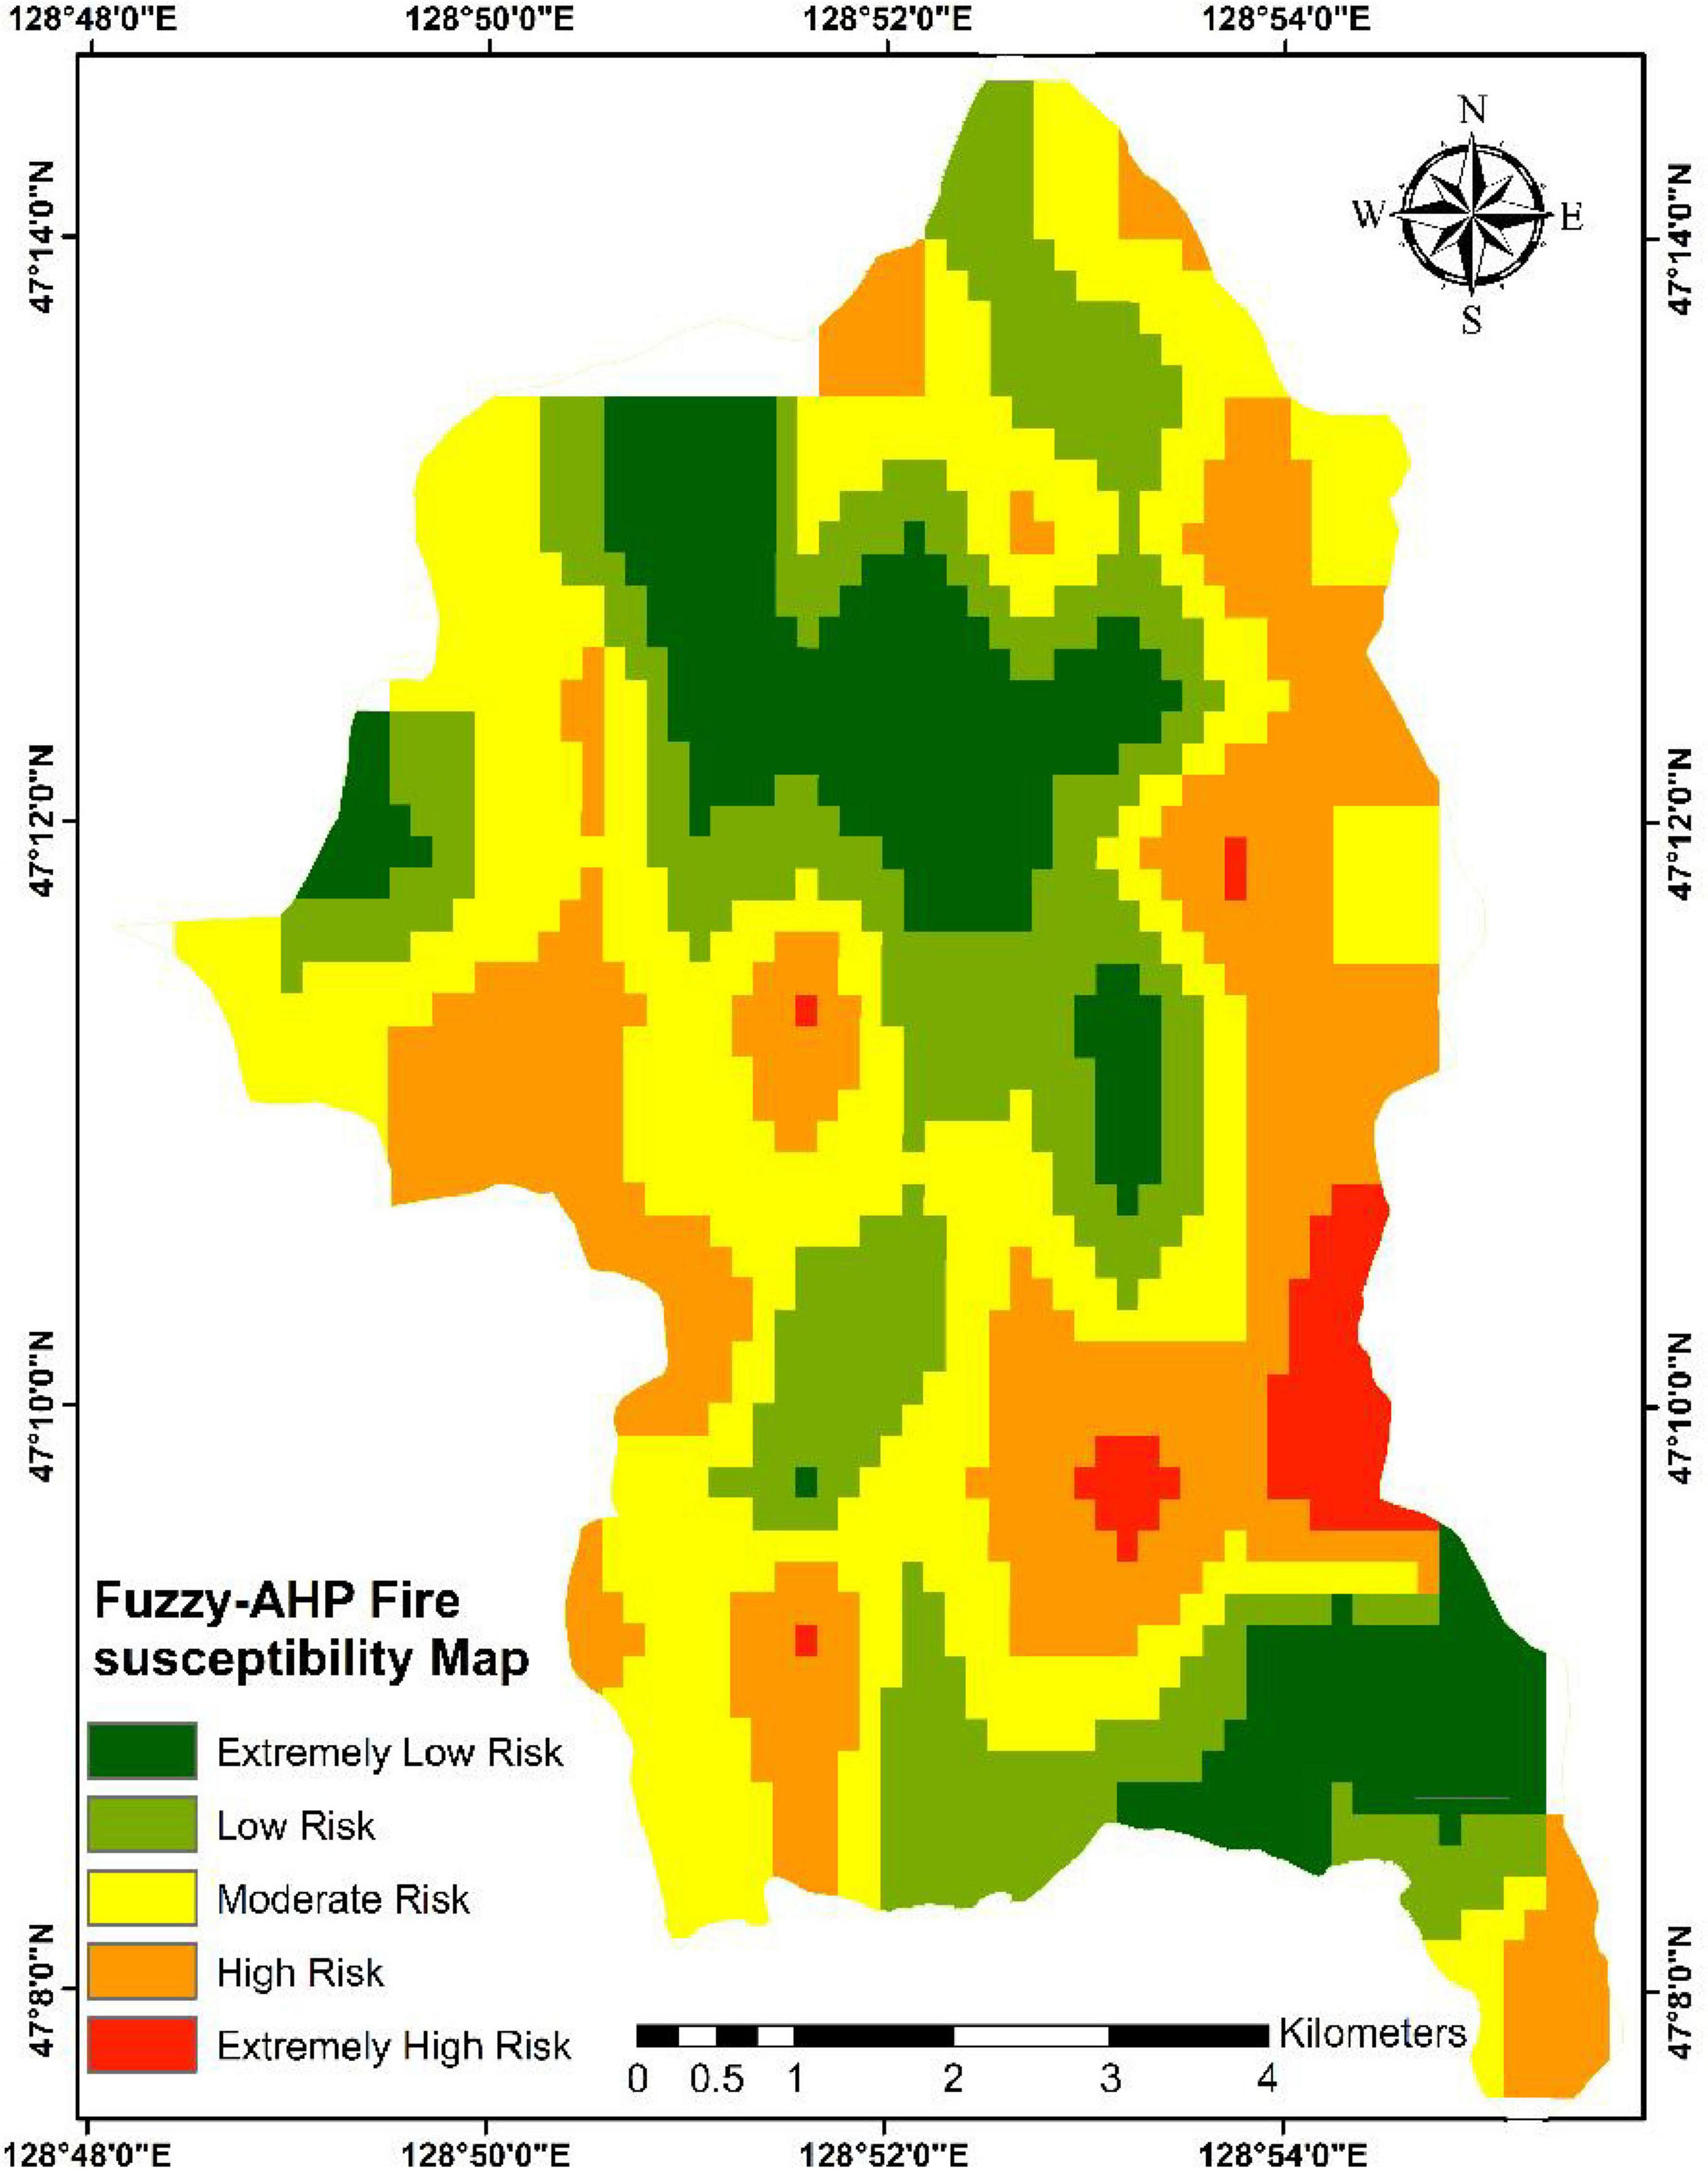
Figure 5. Fire risk map of Fuzzy-Analytical Hierarchy Process (AHP).
3.2.2 Fire risk map for Dong model
The Dong Model was used to spatially analyze and quantify fire risk by assigning appropriate weights to each factor based on their contribution to fire susceptibility. This analysis led to the creation of a synthetic fire risk map, which visualizes areas that are most vulnerable to fire outbreaks. This allows stakeholders to prioritize mitigation efforts and allocate resources effectively. This was done after all the necessary factor maps (such as vegetation type, slope, elevation, distance from roads, precipitation, and temperature) were prepared and overlaid in a GIS environment (Figure 6).
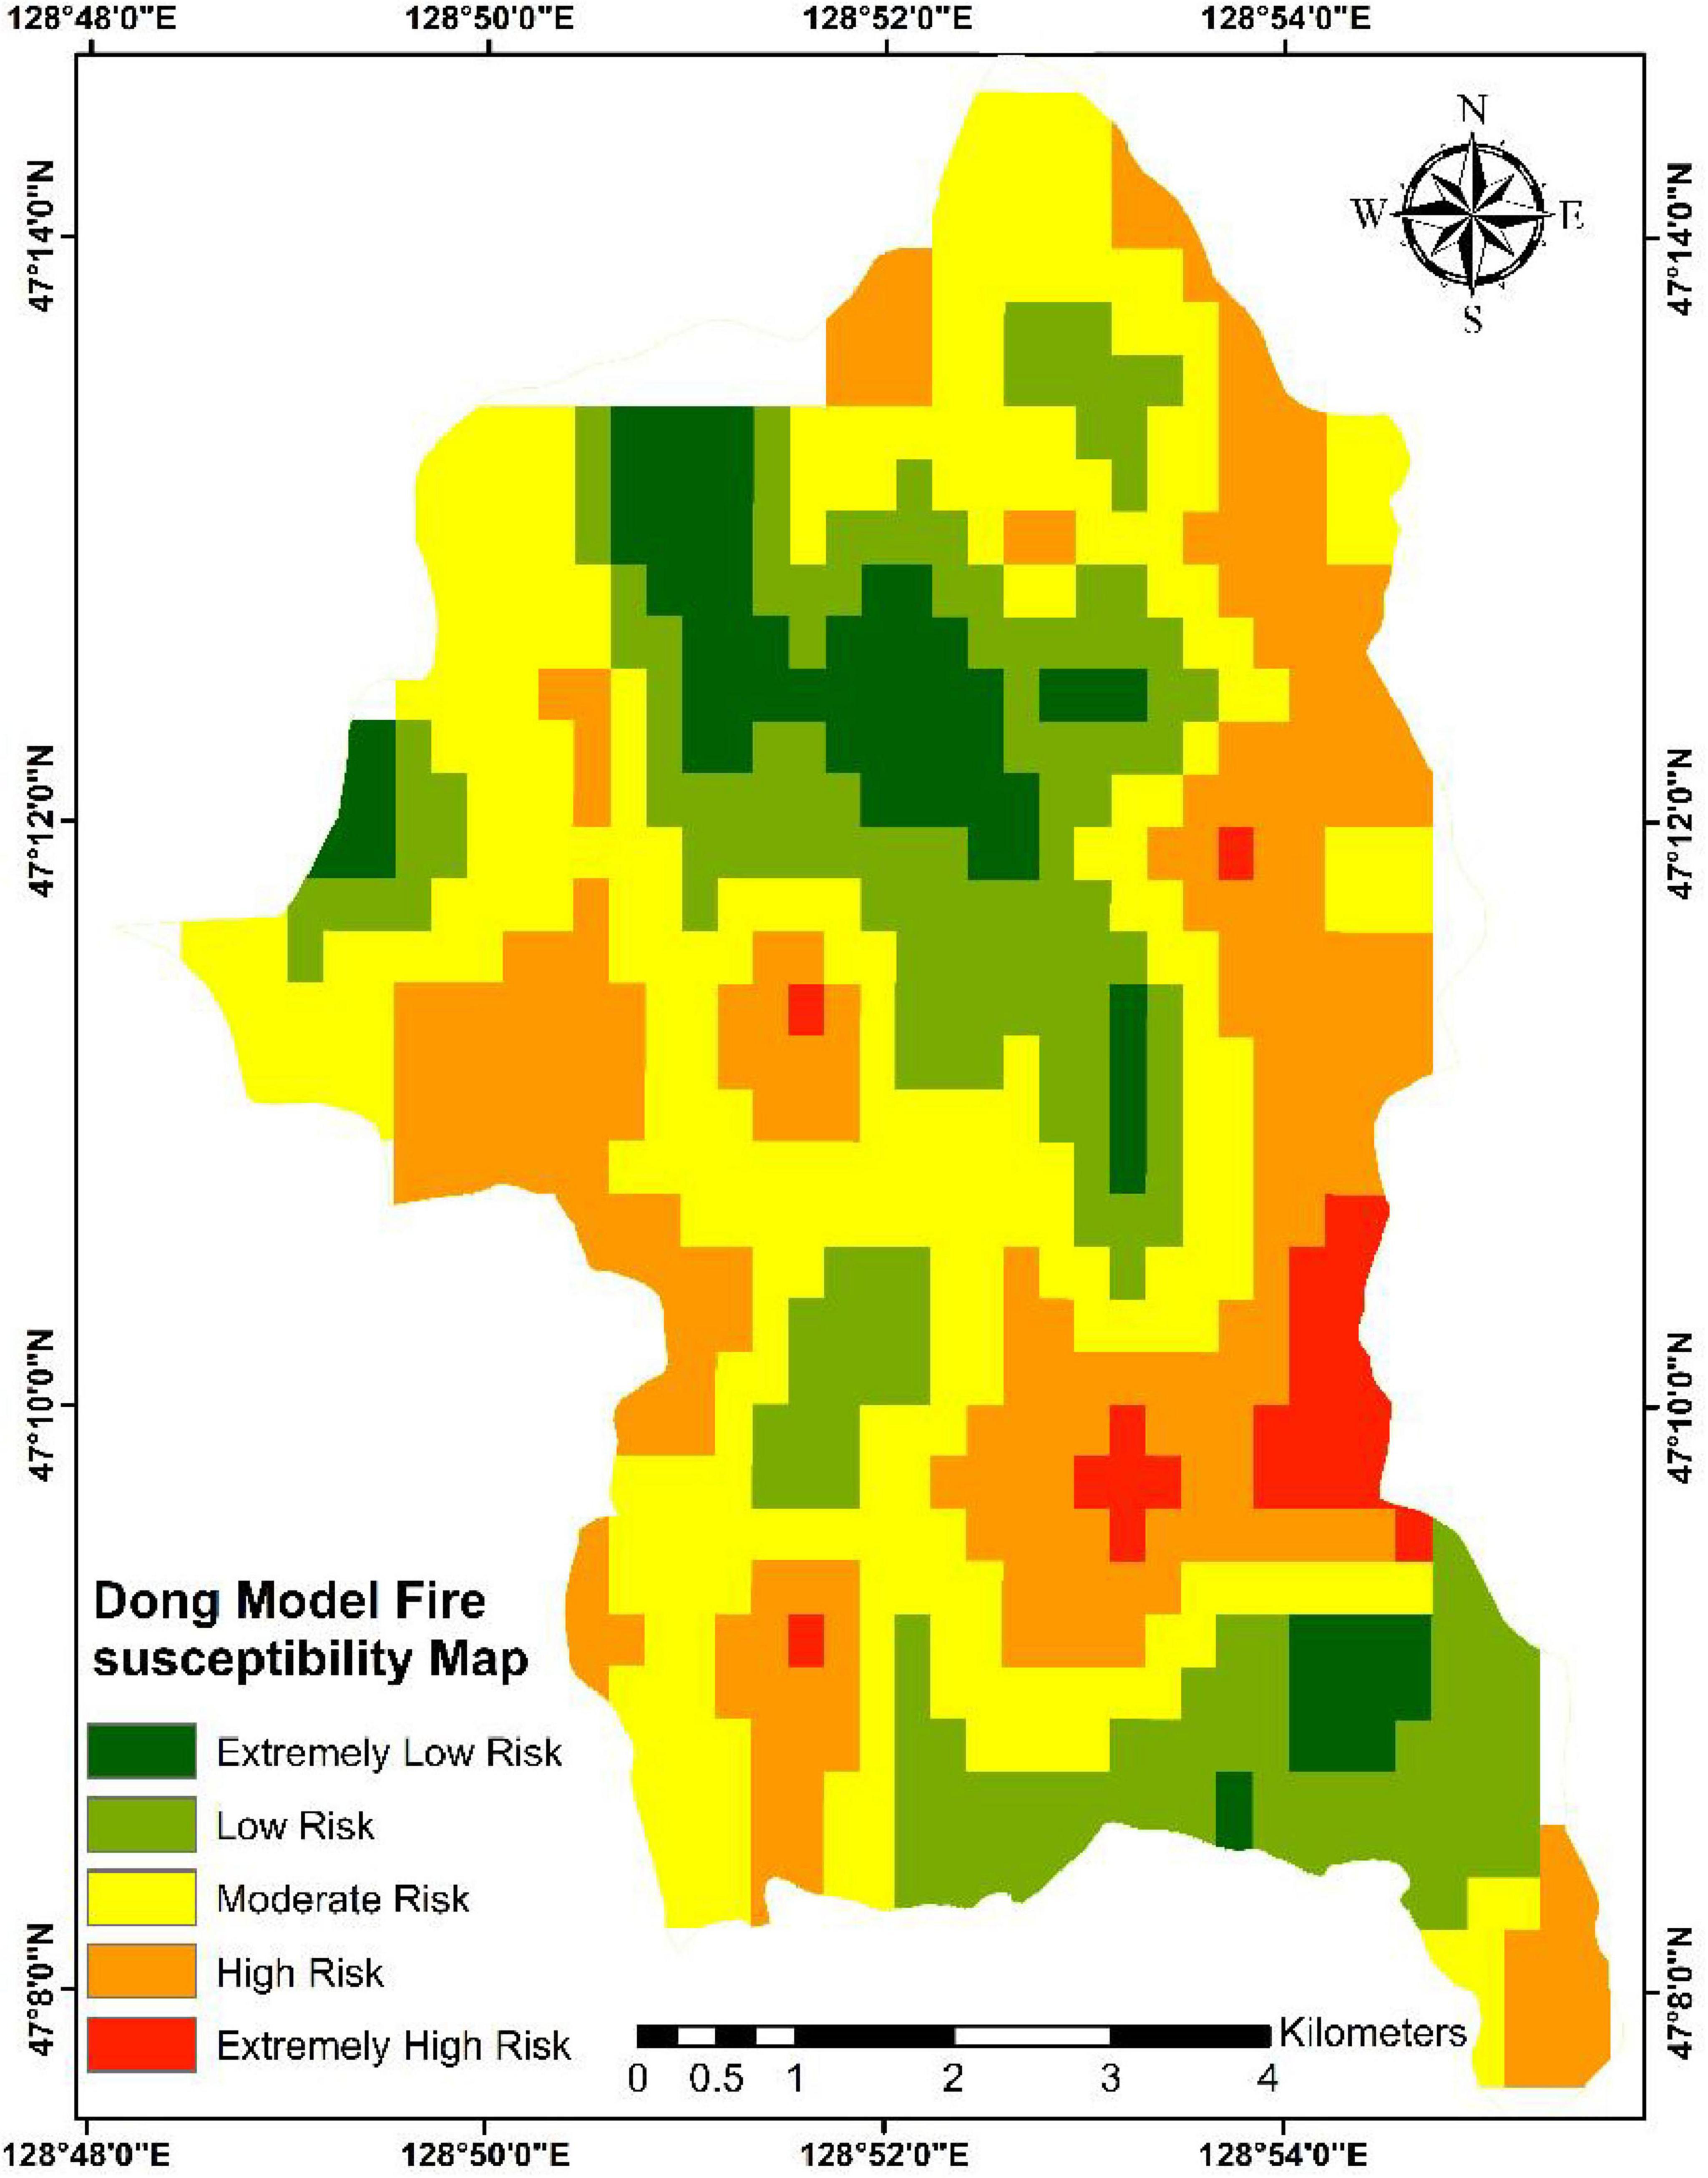
Figure 6. Fire risk map of the Dong model.
Our study effectively applies an understanding of the interaction between topography, climate, Vegetation, and human-induced factors to inform forest fire risk maps and forest fire hazards. However, inherent uncertainty in these criteria’s weighting and relative importance still exists, and improving accuracy and dependability requires combining advanced statistical, probabilistic, and machine learning methods. Although we have used AHP, Fuzzy AHP, and the Dong Model, a critical research gap exists in methodically comparing these approaches using correlation analysis (e.g., Pearson correlation) to evaluate their consistency, identify discrepancies, and harmonize their results, so offering more profound insights on the choice of conditioning criteria, modeling of forest fire events, and the dependability of these techniques under different scenarios.
3.3 Weights comparison and model performance
A heatmap comparison of weight values assigned to 13 decision-making criteria using three multi-criteria decision-making models: AHP, Fuzzy AHP, and the Dong Model. Each factor denotes the weight assigned to a criterion by a specific model, with both the numerical value and color intensity indicating the level of importance. For instance, LULC consistently receives the highest weight across all models (AHP: 0.09, Fuzzy AHP: 0.087, Dong Model: 0.083), as indicated the underscoring its dominant role in forest fire risk assessment. In contrast, NDMI and Wind Speed exhibit comparatively lower weights across all models. This suggests that while they may influence fire risk, they are considered less critical relative to other factors such as Distance from Roads, Distance to Settlements, and Precipitation, which display moderate to high weights (ranging from 0.077 to 0.085). Overall, the Figure 7 reveals a high degree of consistency among the three methods, particularly in the ranking of top contributing factors such as LULC, Distance from Roads, and Settlements. However, slight variations in weights (e.g., Temperature and NDVI) reflect each method’s underlying computational approach and sensitivity to pairwise judgments or data fuzziness.
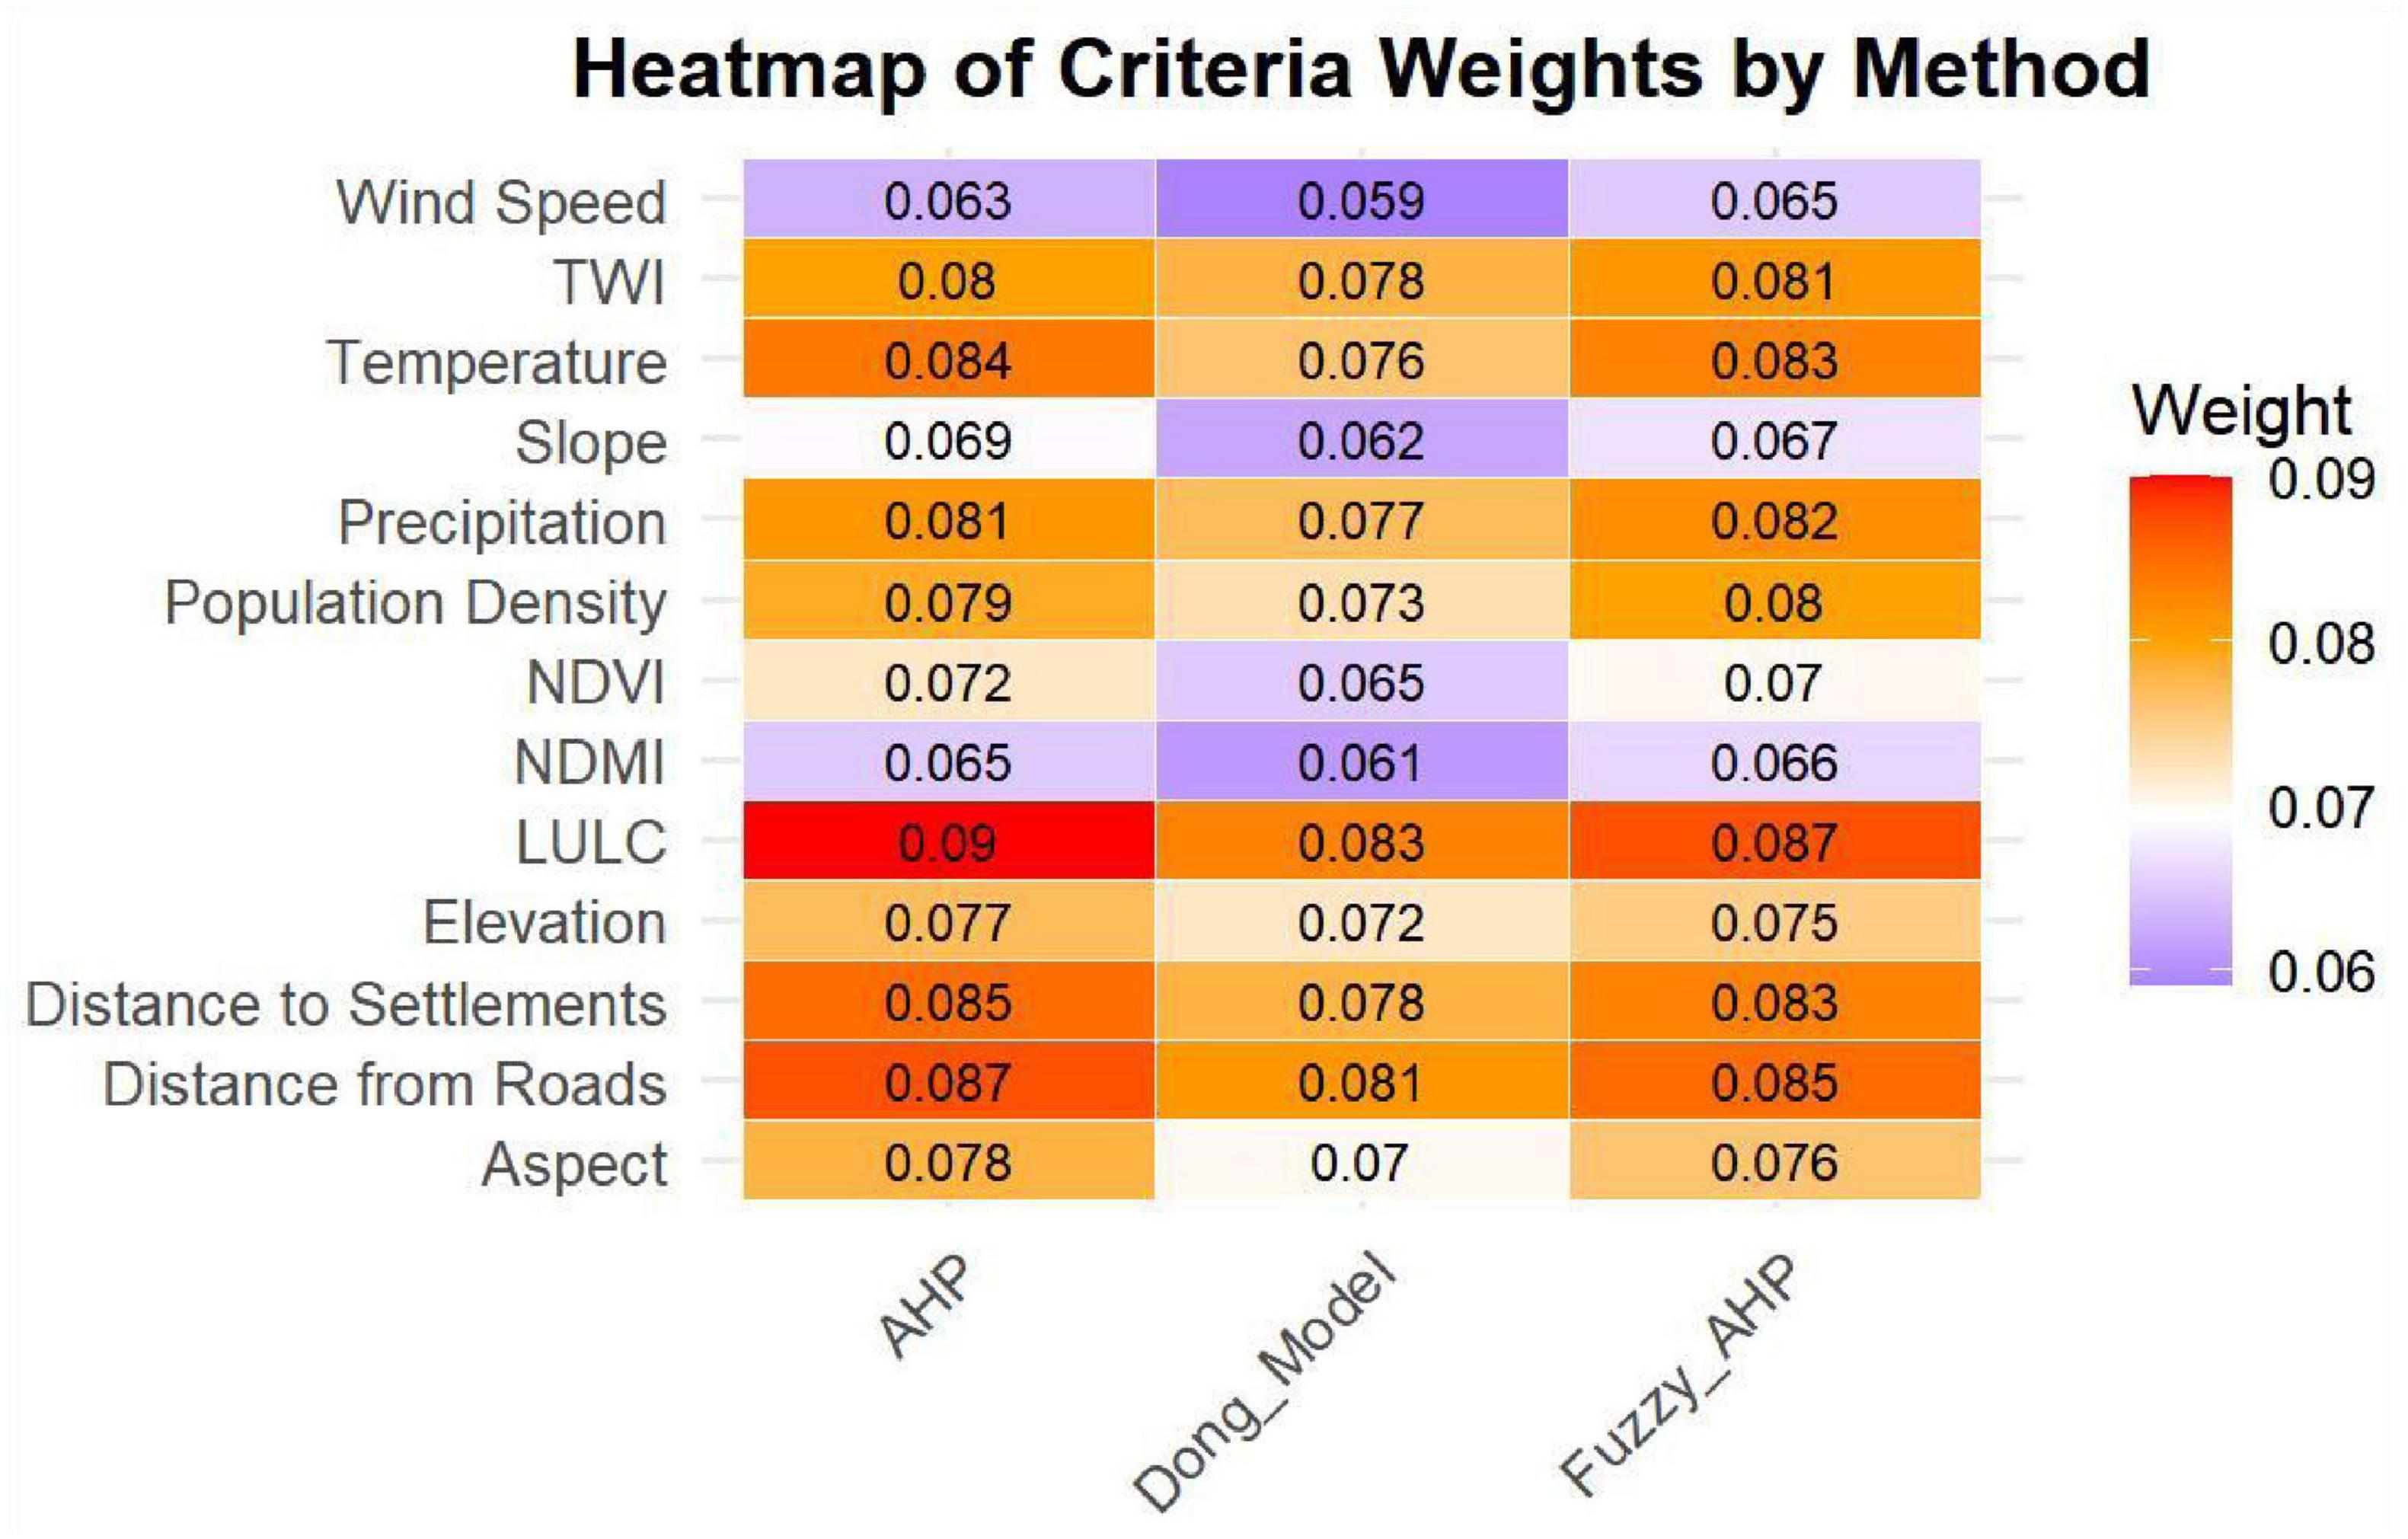
Figure 7. Weights comparison of Analytical Hierarchy Process (AHP), Fuzzy-Analytical Hierarchy Process (F-AHP) and the Dong model.
This Figure 8 illustrates a similarity matrix derived from AUC scores to evaluate the performance of three fire risk assessment models: AHP, Fuzzy AHP, and the Dong model. The matrix reveals a high degree of similarity among the models, with AUC-based similarity scores. Notably, AHP and Fuzzy AHP demonstrate the highest similarity, indicating a strong concordance in their fire risk prediction outcomes. Although Dong AHP exhibits slightly lower similarity with the other two models, the overall consistency across all methods suggests that the fire risk zones identified by each approach are largely congruent. This finding confirms the robustness and reliability of the AHP model when compared to established multi-criteria decision-making approaches in fire risk mapping.
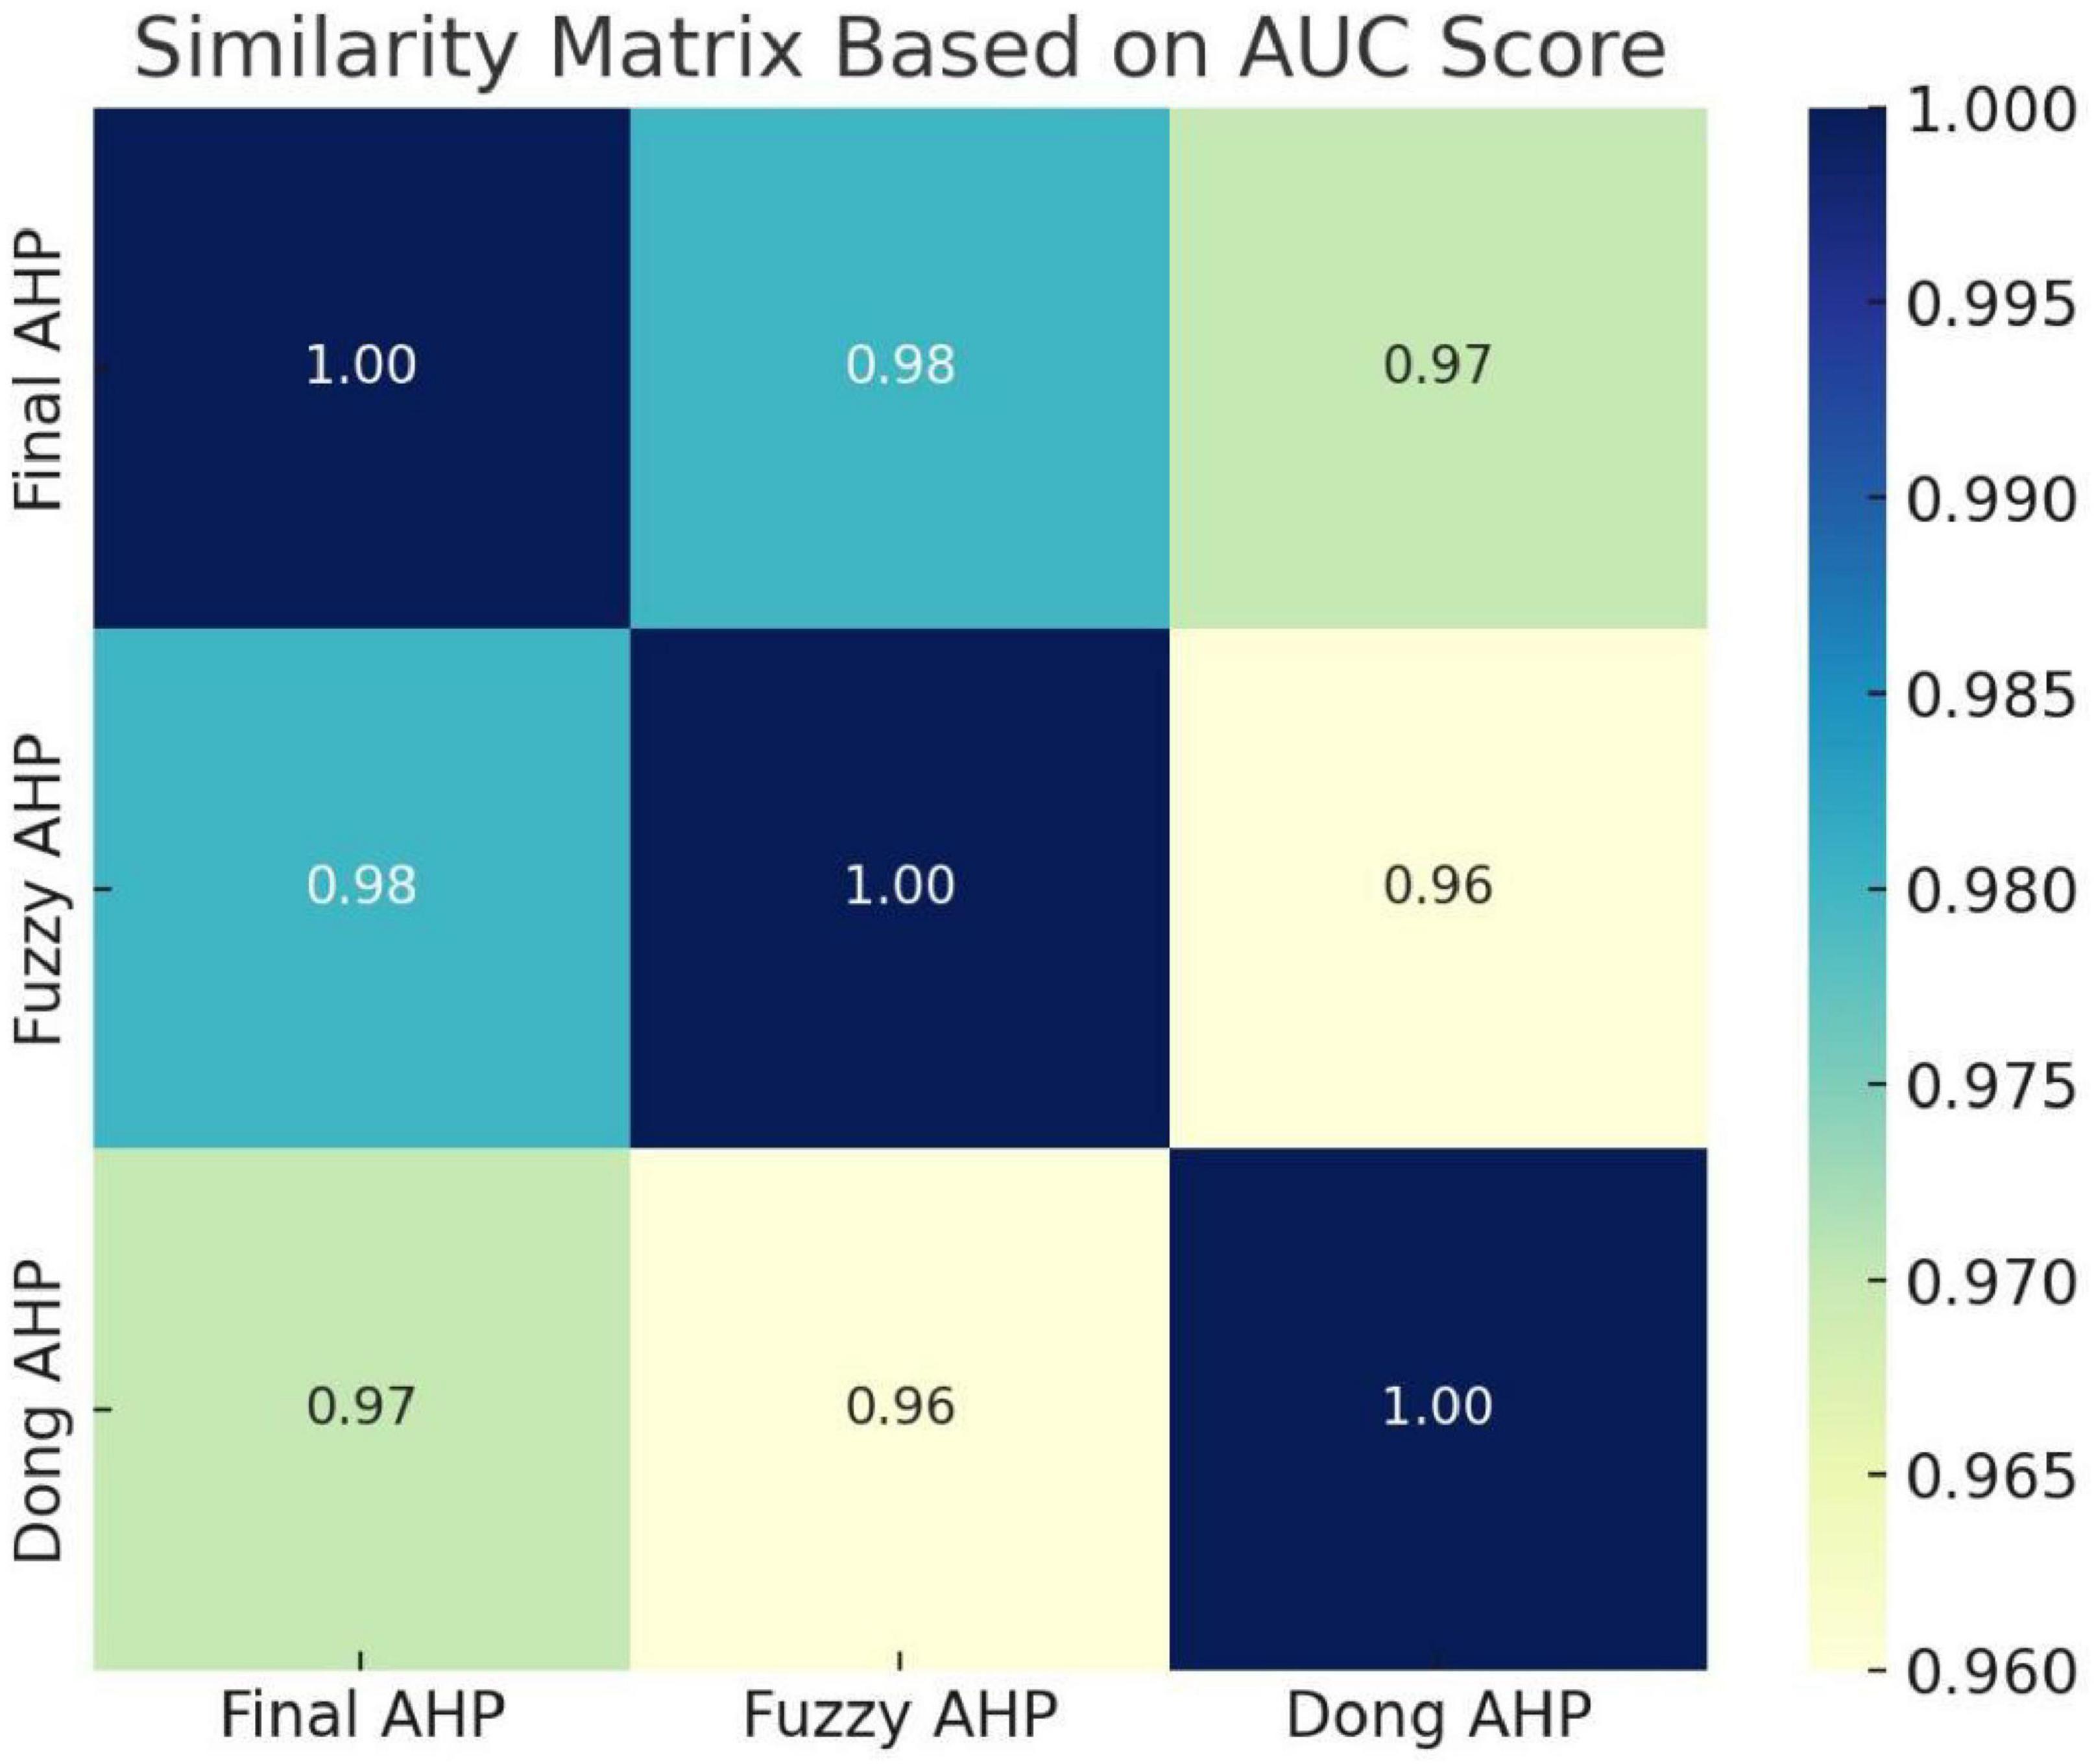
Figure 8. Similarity index of of Analytical Hierarchy Process (AHP), Fuzzy-Analytical Hierarchy Process (F-AHP) and the Dong model.
These figures show that the AHP, Fuzzy AHP, and the Dong models provide varied perspectives on fire risk, each offering a distinct view based on its methodology. This highlights the importance of model choice and suggests that integrating multiple models can lead to a more comprehensive fire risk assessment.
3.4 Data partitioning and validation procedures
Validation examined the accuracy of the predictions of the AHP, F-AHP, and Dong model approaches. Figure 9 displays the ROC curves for a forest fire risk map created using the AHP, F-AHP, and Dong models. According to the AUC plot evaluation, the Dong model has a maximum prediction accuracy, followed by AHP and then F-AHP. Consequently, it has been demonstrated that the developed FFR mapping is precise and efficient for preparing forest fire hazards in the chosen research area.
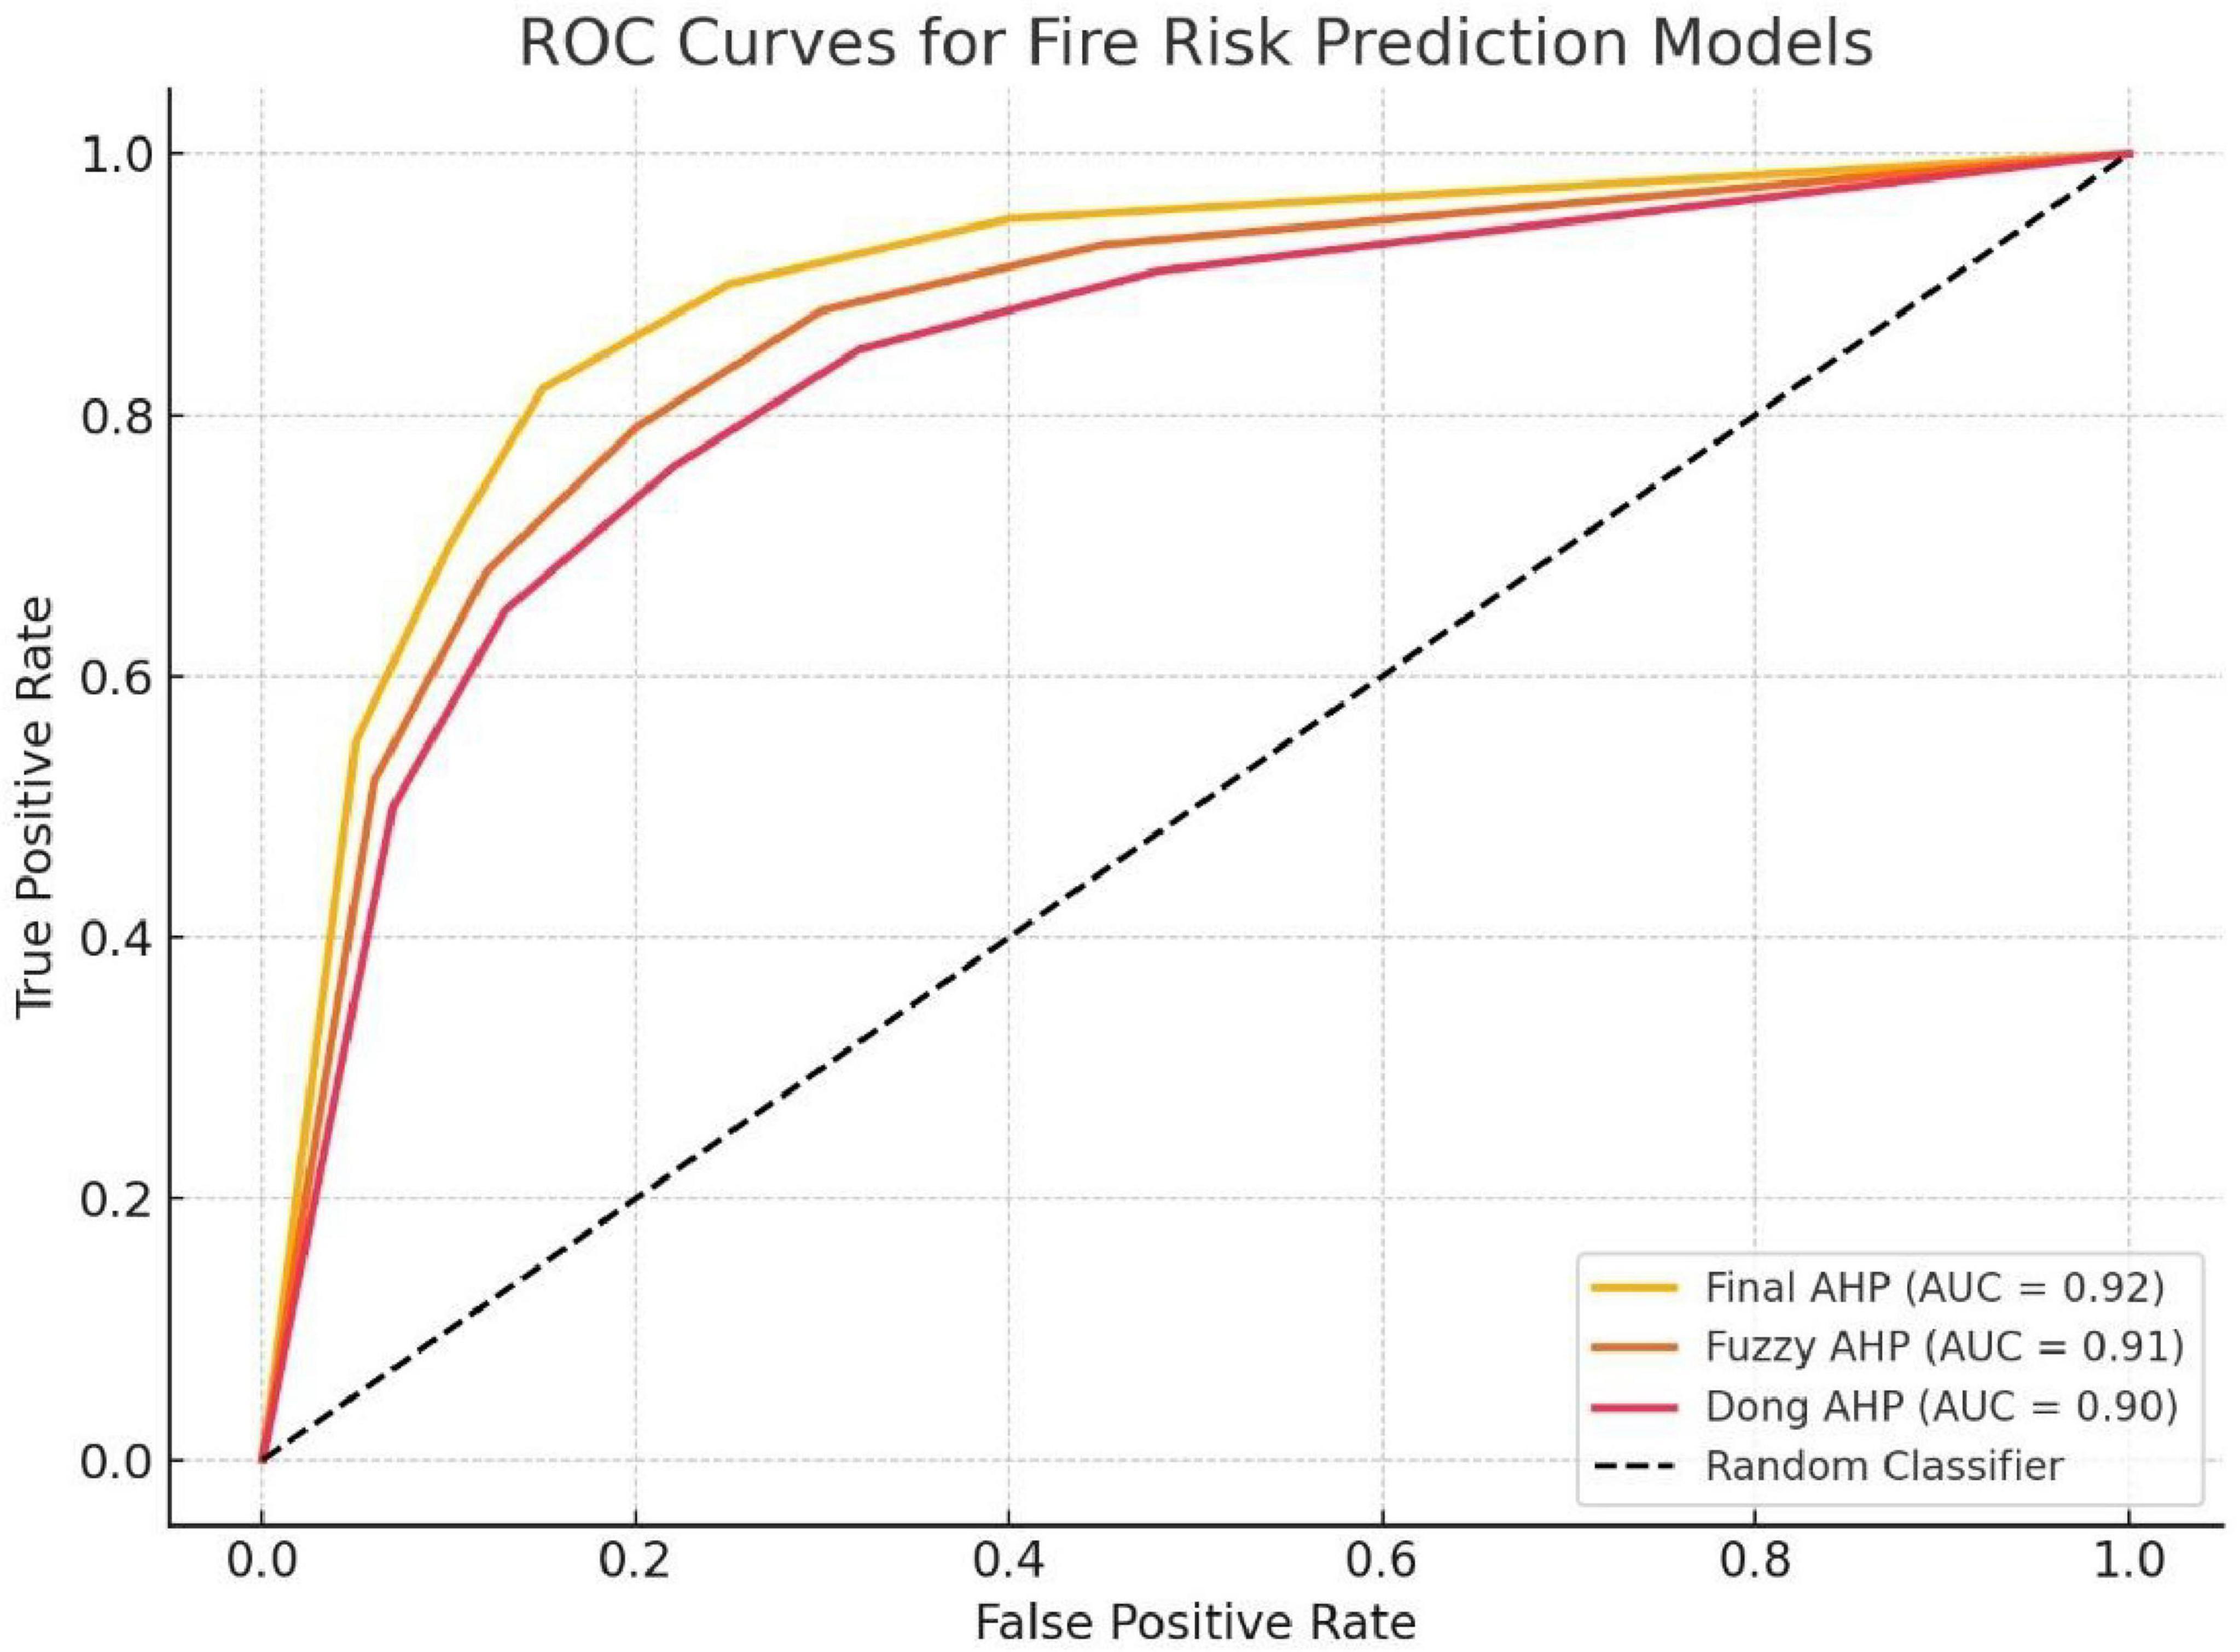
Figure 9. Receiver Operating Characteristic (ROC) curve for Analytical Hierarchy Process (AHP), Fuzzy-Analytical Hierarchy Process (F-AHP), and the Dong model.
The dataset was properly separated according to spatial and temporal boundaries to remove data leakage risks while maintaining scientific integrity. The training data originated from locations and periods that differed significantly from those used in validation testing. For validation, both MODIS fire data and data collection areas remained independent during non-overlapping time intervals. The strict separation method guarantees that training set fire events, together with their spatial characteristics, cannot affect validation set results (Ramo and Chuvieco, 2017).
The validation framework received additional strengthening by applying excessive cross-validation alongside sensitivity testing procedures. The training data segmentation through cross-validation created different folds for studying model accuracy across all subsets to validate its widespread applicability. The model predictions underwent sensitivity tests to confirm their robustness while accounting for any remaining error causes. These combinations of testing measures verify that ROC AUC scores correctly represent model predictive power, free from training data contamination, according to best practices in species distribution and wildfire risk modeling standards (Figure 9).
4 Discussion
The entire ecosystem and biodiversity of the forest, as well as the forest’s wealth, human life, and local climate, are all seriously threatened by uncontrolled forest fires. Identifying forest fire susceptible zones using GIS models is crucial for effective forest management and fire prevention strategies. This study integrates topography, climate, vegetation, and human activities to create comprehensive risk maps. The causes and effects of the area’s rapidly increasing number of forest fire occurrences can be better understood by analyzing the underlying criteria and the forest fire risk map created utilizing AHP, F-AHP, and the Dong model technique.
4.1 Fire-inducing factors
Our study utilizes three multicriteria decision models for fire risk across the three models AHP, Fuzzy AHP, and the Dong Model which highlights several key factors that are critical to understanding wildfire risk. The models utilize various parameters, including Land Use Land Cover (LULC), NDMI, Wind Speed, Distance from Roads, Distance to Settlements, Precipitation, Temperature, and NDVI, assigning weights to signify their importance. Among the criteria, LULC consistently receives the highest weight across all models, suggesting its crucial role in fire risk assessment. For instance, in the Fuzzy AHP, LULC is factored significantly in determining risk zones, aligning with past occurrences of fires (Kant Sharma et al., 2012). Similarly, LULC features prominently in both AHP-based models (Nuthammachot and Stratoulias, 2021) and GIS-based assessments (Güngöroğlu, 2017). NDMI and Wind Speed are generally weighted lower compared to other factors. While they are essential, their impact is less pronounced than criteria like proximity to roads and settlements or precipitation levels. The focus on infrastructural and environmental metrics underpins most fire assessment models, where temperature, NDVI, and precipitation are critical in predicting potential fire spread (Xie et al., 2022). The importance of proximity to roads and settlements is emphasized with moderate to high weights, suggesting these factors significantly influence fire risk. These criteria are vital given their correlation with human activities, which often ignite fires. The integration of such parameters in risk assessment allows for targeted fire prevention measures (Zhao et al., 2021).
Precipitation and vegetation indexes like NDVI are weighted to reflect climatic influences on fire occurrence. High precipitation levels can lower fire risk by maintaining moisture levels in vegetation, whereas high NDVI values may indicate dense vegetation, influencing fire fuel load. Although different models show consistency in the inclusion and weighting of fundamental criteria like LULC, there are slight variations in weights assigned to temperature and NDVI. These variations can be attributed to methodological differences and geographical contexts specific to each model’s application (Nuthammachot and Stratoulias, 2021). These criteria’s combined application in multi-criteria decision analysis frameworks forms a robust methodology for assessing fire risk. The accuracy and efficacy of these models are supported by alignment with fire data and validation against actual fire occurrences, making them invaluable in strategic fire management and risk mitigation efforts. The relative importance of these factors may vary depending on the specific geographical context and methodology used in each study (Abdo et al., 2022; Pourtaghi et al., 2014; Abbas et al., 2025).
4.2 Model accuracy and practical application
This article employs the AHP, F-AHP, and the Dong model technique to identify the location at high risk in the Liangshui National Nature Reserve. To assess the accuracy of these methods, the established model must be tested using fire data. The AHP has been employed in numerous studies to evaluate fire risk, its specific climate conditions. This showing that each area has a unique accuracy percentage affected by underscores the necessity of tailored approaches in fire risk assessment. A noteworthy investigation in Laoshan National Park, China, demonstrated a remarkable accuracy level of 77% (Zhao et al., 2021). In contrast, another research effort in Kedarnath Wildlife Sanctuary, India, achieved even higher accuracy at 83% (Sinha et al., 2023). Several variables can explain the variance in results between the three fire risk models AHP, Fuzzy AHP, and the Dong Model, despite their high classification accuracy. Each model employs a unique methodology: AHP relies on expert judgment, Fuzzy AHP uses fuzzy logic to manage uncertainty, and the Dong Model uses a distinct analytical approach and a set of criteria for fire risk assessment. Variations in data inputs, parameter sensitivity, classification thresholds, and model assumptions contribute to the discrepancy. Furthermore, variations in spatial scale, resolution, and the validation process employed by each model can lead to different conclusions. The models may also demonstrate varying levels of local versus global accuracy, and the interpretation of results can differ based on the model’s framework. Lastly, the complexity of each model and its sensitivity to the specific data used can influence the results. While each model is accurate within its context, the inherent differences in their construction and application make direct comparison challenging, highlighting the need for a nuanced understanding of their strengths and limitations (Chuvieco et al., 2012). The results show the important role of accuracy evaluations in validating and confirming model effectiveness. They are consistent with earlier studies and highlight the significance of multi-criteria decision analysis in forest fire prediction.
The classification in Table 11 shows that the Moderate and high fire susceptibility classes dominate across all three models, together covering over 50% of the study area. The Dong Model and Fuzzy AHP assign slightly more area to the Moderate class, while AHP indicates a higher proportion under the Extremely High class (10.7%) compared to the other two models 3.7%. This variation reflects AHP’s sensitivity to sharply weighted criteria, whereas Fuzzy AHP and the Dong Model offer smoother risk transitions. Overall, all models exhibit consistent spatial patterns with minor variations in extreme classes. The AHP provides a more comprehensive approach and has identified a larger portion of the area classified as low or extremely low susceptibility (Nikolić et al., 2023). It’s vital to note that the choice of model can substantially affect the resultant susceptibility map and subsequent decision-making processes. The AHP model has been found to perform better in some studies, showing improved accuracy compared to conventional F-AHP (Yang et al., 2023). However, the effectiveness of each model can be different depending on the specific context and available data. Each model offers insights into susceptibility classification. The AHP model appears to identify more high-risk areas, which could be crucial for proactive risk management. However, validation using historical data or field observations is essential to determine which model best represents the actual conditions in the study area (Shekar and Mathew, 2023).
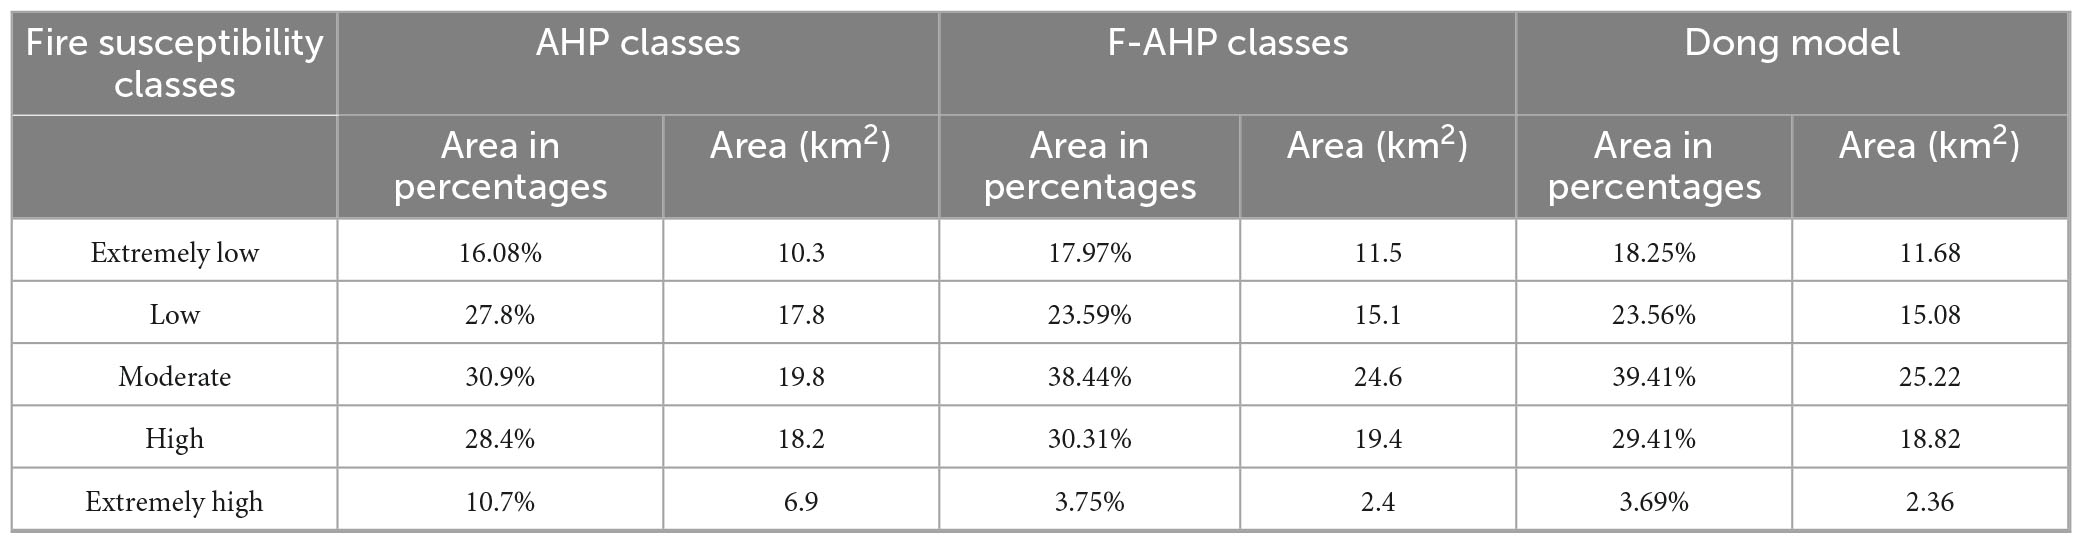
Table 11. Fire risk zones classification.
4.3 Validation of fire risk assessment
Procedures for validation used two essential data sets comprised of (1) results from AHP, Fuzzy AHP, and Dong models, which assigned the study area to five risk levels ranging from 1 = Extremely Low Risk to 5 = Extremely High Risk and (2) MODIS fire occurrence data from 2013 to 2023 showing binary fire presence measurements (1 = fire, 0 = no fire). After processing the established dataset for global fire detection functions, the Google Earth Engine extracted verified MODIS fire events from the study region. The risk maps received MODIS fire points to classify observed fire prevalence and their corresponding predicted fire danger ratings, thereby creating a two-variable validation dataset.
All three models, namely AHP, F-AHP, and the Dong model, have exhibited robust predictive capabilities, as evidenced by their AUC scores of 0.92, 0.91, and 0.90, respectively, which indicate a high level of accuracy in their predictions. These results were obtained through a rigorous MODIS fire data validation process that excluded data used in model development from the testing phase to ensure the models’ validity and generalization abilities. The use of external datasets for validation is crucial, as it provides reliable predictive results and supports the effectiveness of GIS-based multi-criteria models for wildfire risk mapping, especially in sensitive and complex environments such as the Liangshui Nature Reserve.
5 Conclusion
This study evaluated the effectiveness of AHP, F-AHP, and the Dong model techniques in mapping forest fire risk using geospatial data from the Liangshui National Natural Reserve. Risk maps were generated based on thirteen key criteria and classified into five vulnerability levels ranging from Extremely Low to Extremely High. Our findings indicate that among them, AHP has achieved the highest AUC (0.92), followed by F-AHP (0.91), which also indicates a strong predictive accuracy. While the Dong model has achieved an AUC of 0.90. All three models have shown high predictive accuracy, but AHP stands out for its sharper identification of high-risk zones, making it a strong candidate for operational fire risk mapping in the region. Its ability to effectively capture the spatial dynamics of fire susceptibility within this landscape sets it apart, offering valuable insights for better understanding and managing fire risks. Based on the fire susceptibility classification results, the AHP model identifies the largest area under Extremely High risk 10.7% and a substantial High-risk area 28.4%, making it the most conservative model in flagging critical zones. Although AUC was the sole validation metric due to data limitations, the results confirm the models’ practical utility in guiding fire prevention and resource allocation. Future research should incorporate additional human and environmental factors, employ ground-truth data for validation, and explore advanced or hybrid modeling approaches to further improve prediction accuracy.
Data availability statement
The original contributions presented in this study are included in this article/supplementary material, further inquiries can be directed to the corresponding author.
Author contributions
HA: Investigation, Writing – review & editing, Formal analysis, Writing – original draft, Data curation, Methodology, Conceptualization. ZW: Writing – review & editing, Data curation, Conceptualization, Formal analysis. HH: Formal analysis, Resources, Writing – review & editing, Validation. SM: Resources, Writing – review & editing, Software, Formal analysis. MH: Formal analysis, Resources, Methodology, Writing – review & editing. KA: Methodology, Writing – review & editing, Formal analysis, Software. XY: Investigation, Writing – review & editing, Data curation, Visualization, Formal analysis. ZS: Methodology, Formal analysis, Project administration, Writing – review & editing, Investigation, Conceptualization, Validation, Resources, Funding acquisition, Supervision.
Funding
The author(s) declare that financial support was received for the research and/or publication of this article. This research was funded by National Key R&D Program of China (grant nos. 2024YFF1306200 and 2024YFF1306203).
Acknowledgments
We would like to express our sincere gratitude to the School of Forestry, Northeast Forestry University, Harbin, China, for their financial support and the provision of necessary facilities. We also wish to acknowledge the valuable and constructive comments provided by the reviewers, which have greatly improved the quality of this manuscript.
Conflict of interest
The authors declare that the research was conducted in the absence of any commercial or financial relationships that could be construed as a potential conflict of interest.
Generative AI statement
The authors declare that no Generative AI was used in the creation of this manuscript.
Any alternative text (alt text) provided alongside figures in this article has been generated by Frontiers with the support of artificial intelligence and reasonable efforts have been made to ensure accuracy, including review by the authors wherever possible. If you identify any issues, please contact us.
Publisher’s note
All claims expressed in this article are solely those of the authors and do not necessarily represent those of their affiliated organizations, or those of the publisher, the editors and the reviewers. Any product that may be evaluated in this article, or claim that may be made by its manufacturer, is not guaranteed or endorsed by the publisher.
References
Abbas, K., Souane, A. A., Ahmad, H., Suita, F., Shu, Z., Huang, H., et al. (2025). Correlating fire incidents with meteorolgoparajogical variables in dry temperate forest. Forests 16:122. doi: 10.3390/f16010122
Abdo, H. G., Al-Mutiry, M., Almohamad, H., and Al Dughairi, A. A. (2022). GIS-based frequency ratio and analytic hierarchy process for forest fire susceptibility mapping in the western region of Syria. Sustainability 14:4668. doi: 10.3390/su14084668
Abedi Gheshlaghi, H., Feizizadeh, B., and Blaschke, T. (2020). GIS-based forest fire risk mapping using the analytical network process and fuzzy logic. J. Environ. Plann. Manag. 63, 481–499. doi: 10.1080/09640568.2019.1594726
Baqer Rasooli, S., and Bonyad, A. E. (2019). Evaluating the efficiency of the Dong model in determining fire vulnerability in Iran’s Zagros forests. J. For. Res. 30, 1447–1458. doi: 10.1007/s11676-018-0765-8
Bessie, W., and Johnson, E. (1995). The relative importance of fuels and weather on fire behavior in subalpine forests. Ecology 76, 747–762. doi: 10.2307/1939341
Beven, K. J., and Kirkby, M. J. (1979). A physically based, variable contributing area model of basin hydrology/Un modèle à base physique de zone d’appel variable de l’hydrologie du bassin versant. Hydrol. Sci. J. 24, 43–69. doi: 10.1080/02626667909491834
Cardone, B., D’ambrosio, V., Di Martino, F., and Miraglia, V. (2024). Hierarchical Fuzzy MCDA multi-risk model for detecting critical urban areas in climate scenarios. Appl. Sci. 14:3066. doi: 10.3390/app14073066
Chang, D.-Y. (1996). Applications of the extent analysis method on fuzzy AHP. Eur. J. Operational Res. 95, 649–655. doi: 10.1016/0377-2217(95)00300-2
Chou, S.-Y., and Chang, Y.-H. (2008). A decision support system for supplier selection based on a strategy-aligned fuzzy SMART approach. Exp. Syst. with Appl. 34, 2241–2253. doi: 10.1016/j.eswa.2007.03.001
Chuvieco, E., Aguado, I., Jurdao, S., Pettinari, M. L., Yebra, M., Salas, J., et al. (2012). Integrating geospatial information into fire risk assessment. Int. J Wildland Fire 23, 606–619. doi: 10.1071/wf12052
Chuvieco, E., and Congalton, R. G. (1989). Application of remote sensing and geographic information systems to forest fire hazard mapping. Remote Sens. Environ. 29, 147–159. doi: 10.1016/0034-4257(89)90023-0
Ding, Y., Zhao, K., Zheng, X., and Jiang, T. (2014). Temporal dynamics of spatial heterogeneity over cropland quantified by time-series NDVI, near infrared and red reflectance of Landsat 8 OLI imagery. Int. J. Appl. Earth Observ. Geoinformation. 30, 139–145. doi: 10.1016/j.jag.2014.01.009
Dong, X., Li-Min, D., Guo-Fan, S., Lei, T., and Hui, W. (2005). Forest fire risk zone mapping from satellite images and GIS for Baihe Forestry Bureau Jilin, China. J. For. Res. 16, 169–174. doi: 10.1007/BF02856809
Ersoy, I., Ünsal, E., and Gürsoy, Ö (2025). A multi-criteria forest fire danger assessment system on GIS Using literature-based model and analytical hierarchy process model for mediterranean coast of Manavgat, Türkiye. Sustainability 17:1971. doi: 10.3390/su17051971
Eskandari, S. (2017). A new approach for forest fire risk modeling using fuzzy AHP and GIS in Hyrcanian forests of Iran. Arabian J. Geosci. 10:190. doi: 10.1007/s12517-017-2976-2
Eskandari, S., and Miesel, J. R. (2017). Comparison of the fuzzy AHP method, the spatial correlation method, and the Dong model to predict the fire high-risk areas in Hyrcanian forests of Iran. Geomatics Nat. Hazards Risk 8, 933–949. doi: 10.1080/19475705.2017.1289249
Fekir, Y., Hamadouche, M. A., and Anteur, D. (2022). Integrated approach for the assessment of forest fire risk and burn severity mapping using GIS, AHP method, and Google Earth Engine in Western Algeria. Euro-Mediterranean J. Environ. Integr. 7, 531–544. doi: 10.1007/s41207-022-00338-y
Flannigan, M. D., Wotton, B. M., Marshall, G. A., De Groot, W. J., Johnston, J., Jurko, N., et al. (2016). Fuel moisture sensitivity to temperature and precipitation: Climate change implications. Climatic Change 134, 59–71. doi: 10.1007/s10584-015-1521-0
Gai, C., Weng, W., and Yuan, H. “GIS-based forest fire risk assessment and mapping,” in Proceediongs of the 2011 Fourth international joint conference on computational sciences and optimization, 2011, (Piscataway, NJ: IEEE), 1240–1244.
Gaither, C. J., Poudyal, N. C., Goodrick, S., Bowker, J. M., Malone, S., and Gan, J. (2011). Wildland fire risk and social vulnerability in the Southeastern United States: An exploratory spatial data analysis approach. For. Policy Econ. 13, 24–36. doi: 10.1016/j.forpol.2010.07.009
Gao, C., Lin, H., and Hu, H. (2023). Forest-fire-risk prediction based on random forest and backpropagation neural network of Heihe area in Heilongjiang province. China. Forests 14:170. doi: 10.3390/f14020170
Gholamizadeh, K., Alauddin, M., Aliabadi, M. M., Soltanzade, A., and Mohammadfam, I. (2023). Comprehensive failure analysis in Tehran refinery fire accident: Application of accimap methodology and quantitative domino effect analysis. Fire Technol. 59, 453–472. doi: 10.1007/s10694-022-01348-6
Gul, Z., Tang, Z.-H., Arif, M., and Ye, Z. (2022). An insight into abiotic stress and influx tolerance mechanisms in plants to cope in saline environments. Biology 11:597. doi: 10.3390/biology11040597
Güngöroğlu, C. (2017). Determination of forest fire risk with fuzzy analytic hierarchy process and its mapping with the application of GIS: The case of Turkey/Çakırlar. Hum. Ecol. Risk Assess. Int. J. 23, 388–406. doi: 10.1080/10807039.2016.1255136
Guo, B., Zang, W., Yang, X., Huang, X., Zhang, R., Wu, H., et al. (2020). Improved evaluation method of the soil wind erosion intensity based on the cloud–AHP model under the stress of global climate change. Sci. Total Environ. 746:141271. doi: 10.1016/j.scitotenv.2020.141271
Gupta, S. K., Kanga, S., Meraj, G., Kumar, P., and Singh, S. K. (2023). Uncovering the hydro-meteorological drivers responsible for forest fires utilizing geospatial techniques. Theoretical Appl. Climatol. 153, 675–695. doi: 10.1007/s00704-023-04497-y
Hong, H., Jaafari, A., and Zenner, E. K. (2019). Predicting spatial patterns of wildfire susceptibility in the Huichang County, China: An integrated model to analysis of landscape indicators. Ecol. Indicators 101, 878–891. doi: 10.1016/j.ecolind.2019.01.056
Jafari Goldarag, Y., Mohammadzadeh, A., and Ardakani, A. (2016). Fire risk assessment using neural network and logistic regression. J. Indian Soc. Remote Sens. 44, 885–894. doi: 10.1007/s12524-016-0557-6
Jafarzadeh, A. A., Mahdavi, A., and Jafarzadeh, H. (2017). Evaluation of forest fire risk using the Apriori algorithm and fuzzy c-means clustering. J. For. Sci. 63, 370–380. doi: 10.17221/7/2017-JFS
Jia, X., Gao, Y., Wei, B., Wang, S., Tang, G., and Zhao, Z. (2019). Risk assessment and regionalization of fire disaster based on analytic hierarchy process and MODIS data: A case study of inner Mongolia. China. Sustainability 11:6263. doi: 10.3390/su11226263
João, T., João, G., Bruno, M., and João, H. (2018). Indicator-based assessment of post-fire recovery dynamics using satellite NDVI time-series. Ecol. Indicators 89, 199–212. doi: 10.1016/j.ecolind.2018.02.008
Kant Sharma, L., Kanga, S., Singh Nathawat, M., Sinha, S., and Chandra Pandey, P. (2012). Fuzzy AHP for forest fire risk modeling. Disaster Prevent. Manag. Int. J. 21, 160–171. doi: 10.1108/09653561211219964
Kayet, N., Dutta, T., Sahoo, S., Chakrabarty, A., Pathak, K., and Hatai, B. K. (2018). Comparative analysis of multi-criteria probabilistic FR and AHP models for forest fire risk (FFR) mapping in Melghat Tiger Reserve (MTR) forest. J. For. Res. 31, 565–579. doi: 10.1007/s11676-018-0826-z
Kumi-Boateng, B., Peprah, M. S., and Larbi, E. K. (2021). Prioritization of forest fire hazard risk simulation using Hybrid grey relativity analysis (HGRA) and Fuzzy analytical hierarchy process (FAHP) coupled with multicriteria decision analysis (MCDA) techniques–a comparative study analysis. Geodesy Cartogr. 47, 147–161. doi: 10.3846/gac.2021.13028
Lamat, R., Kumar, M., Kundu, A., and Lal, D. (2021). Forest fire risk mapping using analytical hierarchy process (AHP) and earth observation datasets: A case study in the mountainous terrain of Northeast India. SN Appl. Sci. 3:425. doi: 10.1007/s42452-021-04391-0
Li, S.-Y., Tao, G., and Zhang, L.-J. (2018). Fire risk assessment of high-rise buildings based on gray-FAHP mathematical model. Procedia Eng. 211, 395–402. doi: 10.1016/j.proeng.2017.12.028
Manzo-Delgado, L., Aguirre-Gómez, R., and Álvarez, R. (2004). Multitemporal analysis of land surface temperature using NOAA-AVHRR: Preliminary relationships between climatic anomalies and forest fires. Int. J. Remote Sens. 25, 4417–4424. doi: 10.1016/j.isprsjprs.2021.09.016
Matin, M. A., Chitale, V. S., Murthy, M. S., Uddin, K., Bajracharya, B., and Pradhan, S. (2017). Understanding forest fire patterns and risk in Nepal using remote sensing, geographic information system and historical fire data. Int. J. Wildland Fire 26, 276–286. doi: 10.1071/WF16056
Mehmood, K., Anees, S. A., Luo, M., Akram, M., Zubair, M., Khan, K. A., et al. (2024). Assessing Chilgoza Pine (Pinus Gerardiana) forest fire severity: Remote sensing analysis, correlations, and predictive modeling for enhanced management strategies. Trees For. People 16:100521. doi: 10.1016/j.tfp.2024.100521
Modugno, S., Balzter, H., Cole, B., and Borrelli, P. (2016). Mapping regional patterns of large forest fires in Wildland–Urban Interface areas in Europe. J. Environ. Manag. 172, 112–126. doi: 10.1016/j.jenvman.2016.02.013
Muhammad, S., Ali, A., Mehmood, K., Ahmad, H., Hayat, M., Khan, M. T., et al. (2024). Temporal variations in burn severity among various vegetation layers in subtropical Pinus Roxburghii (Chir Pine) forest of Hindu Kush mountain range. Trees Forests People 18:100664. doi: 10.1016/j.tfp.2024.100664
Nefu (n.d.). Overview of the protected area. Liangshui Experimental Forest Farm of Northeast Forestry University (NEFU). Available online at: https://ls.nefu.edu.cn/bhqgk/bhqjj.htm (accessed September 15, 2024).
Nikolić, G., Vujović, F., Golijanin, J., Šiljeg, A., and Valjarević, A. (2023). Modelling of Wildfire Susceptibility in Different Climate Zones in Montenegro Using GIS-MCDA. Atmosphere 14:929. doi: 10.3390/atmos14060929
Nuthammachot, N., and Stratoulias, D. (2019). Fusion of Sentinel-1A and Landsat-8 images for improving land use/land cover classification in Songkla Province, Thailand. Appl. Ecol. Environ. Res. 17, 3123–3135. doi: 10.15666/aeer/1702_31233135
Nuthammachot, N., and Stratoulias, D. (2021). Multi-criteria decision analysis for forest fire risk assessment by coupling AHP and GIS: Method and case study. Environ. Dev. Sustainabil. 23, 17443–17458. doi: 10.1007/s10668-021-01394-0
Nuthammachot, N., and Stratoulias, D. (2021a). A GIS- and AHP-based approach to map fire risk: A case study of Kuan Kreng peat swamp forest, Thailand. Geocarto Int. 36, 212–225. doi: 10.1080/10106049.2019.1611946
Nuthammachot, N., and Stratoulias, D. (2021b). Multi-criteria decision analysis for forest fire risk assessment by coupling AHP and GIS: Method and case study. Environ. Dev. Sustainabil. 23, 17443–17458. doi: 10.1007/s10668-021-01394-0
Özcan, Z., Caglayan, I., Kabak, Ö, and Kılıç Gül, F. (2024). Integrated risk mapping for forest fire management using the analytical hierarchy process and ordered weighted average: A case study in southern Turkey. Nat. Hazards 121, 959–1001. doi: 10.1007/s11069-024-06810-y
Pallikarakis, A., and Konstantopoulou, F. (2024). Multi-criteria wildfire risk hazard assessment in GIS environment: Projection for the future and impact on RES projects installation planning. J. Geosci. Environ. Protection 12, 242–265. doi: 10.4236/gep.2024.125014
Parvar, Z., Saeidi, S., and Mirkarimi, S. (2024). Integrating meteorological and geospatial data for forest fire risk assessment. J. Environ. Manag. 358:120925. doi: 10.1016/j.jenvman.2024.120925
Pourghasemi, H. R., Beheshtirad, M., and Pradhan, B. (2016). A comparative assessment of prediction capabilities of modified analytical hierarchy process (M-AHP) and Mamdani fuzzy logic models using Netcad-GIS for forest fire susceptibility mapping. Geomatics Nat. Hazards Risk 7, 861–885. doi: 10.1080/19475705.2014.984247
Pourtaghi, Z. S., Pourghasemi, H. R., Aretano, R., and Semeraro, T. (2016). Investigation of general indicators influencing on forest fire and its susceptibility modeling using different data mining techniques. Ecol. Indicators 64, 72–84. doi: 10.1016/j.ecolind.2015.12.030
Pourtaghi, Z. S., Rossi, M., and Pourghasemi, H. R. (2014). Forest fire susceptibility mapping in the Minudasht forests, Golestan province, Iran. Environ. Earth Sci. 73, 1515–1533. doi: 10.1007/s12665-014-3502-4
Rabiei, J., Khademi, M. S., Bagherpour, S., Ebadi, N., Karimi, A., and Ostad-Ali-Askari, K. (2022). Investigation of fire risk zones using heat–humidity time series data and vegetation. Appl. Water Sci. 12:216. doi: 10.1007/s13201-022-01742-z
Rahmati, O., Nazari Samani, A., Mahdavi, M., Pourghasemi, H. R., and Zeinivand, H. (2015). Groundwater potential mapping at Kurdistan region of Iran using analytic hierarchy process and GIS. Arabian J. Geosci. 8, 7059–7071. doi: 10.1007/s12517-014-1668-4
Ramo, R., and Chuvieco, E. (2017). Developing a random forest algorithm for MODIS global burned area classification. Remote Sensing 9:1193. doi: 10.3390/rs9111193
Saaty, T. L. (1990). How to make a decision: The analytic hierarchy process. Eur. J. Operational Res. 48, 9–26. doi: 10.1016/0377-2217(90)90057-I
Salma Nikhil, S., Danumah, J. H., Prasad, M. K., Nazar, N., Saha, S., et al. (2023). Prediction capability of the MCDA-AHP model in wildfire risk zonation of a protected area in the Southern Western Ghats. Environ. Sustain. 6, 59–72. doi: 10.1007/s42398-022-00259-0
Shao, Y., Feng, Z., Sun, L., Yang, X., Li, Y., Xu, B., et al. (2022). Mapping China’s forest fire risks with machine learning. Forests 13:856. doi: 10.3390/f13060856
Shapiro, A. F., and Koissi, M.-C. (2017). Fuzzy logic modifications of the Analytic hierarchy process. Insurance Math. Econ. 75, 189–202. doi: 10.1016/j.insmatheco.2017.05.003
Shekar, P. R., and Mathew, A. (2023). Integrated assessment of groundwater potential zones and artificial recharge sites using GIS and Fuzzy-AHP: A case study in Peddavagu watershed, India. Environ. Monit. Assess. 195:906. doi: 10.1007/s10661-023-11474-5
Sinha, A., Nikhil, S., Ajin, R. S., Danumah, J. H., Saha, S., Costache, R., et al. (2023). Wildfire risk zone mapping in contrasting climatic conditions: An approach employing AHP and F-AHP models. Fire 6:44. doi: 10.3390/fire6020044
Sivrikaya, F., and Küçük, Ö (2022). Modeling forest fire risk based on GIS-based analytical hierarchy process and statistical analysis in Mediterranean region. Ecol. Informatics 68:101537. doi: 10.1016/j.ecoinf.2021.101537
Tesfamariam, S., and Sadiq, R. (2006). Risk-based environmental decision-making using fuzzy analytic hierarchy process (F-AHP). Stochastic Environ. Res. Risk Assess. 21, 35–50. doi: 10.1007/s00477-006-0042-9
Tien Bui, D., Le, K.-T. T., Nguyen, V. C., Le, H. D., and Revhaug, I. (2016). Tropical forest fire susceptibility mapping at the Cat Ba National Park Area, Hai Phong City, Vietnam, using GIS-based kernel logistic regression. Remote Sens. 8:347. doi: 10.3390/rs8040347
Tiwari, A., Shoab, M., and Dixit, A. (2021). GIS-based forest fire susceptibility modeling in Pauri Garhwal, India: A comparative assessment of frequency ratio, analytic hierarchy process and fuzzy modeling techniques. Natural Hazards 105, 1189–1230. doi: 10.1007/s11069-020-04351-8
Wang, A., Zhang, D., Feng, Z., Li, X., and Li, X. (2023). Spatiotemporal Patterns and Risk Zoning of Wildfire Occurrences in Northeast China from 2001 to 2019. Forests 14:2350. doi: 10.3390/f14122350
Wanli, Z. (1999). Forest plant biological diversity in Liangshui Nature Reserve. J. For. Res. 10, 219–223. doi: 10.1007/BF02855459
Wu, Z., Hasham, A., Zhang, T., Gu, Y., Lu, B., Sun, H., et al. (2024). Analysis of PM2. 5 concentration released from forest combustion in Liangshui National natural reserve, China. Fire 7:311. doi: 10.3390/fire7090311
Xie, L., Zhang, R., Zhan, J., Li, S., Shama, A., Zhan, R., et al. (2022). Wildfire risk assessment in Liangshan Prefecture, China based on an integration machine learning algorithm. Remote Sens. 14:4592. doi: 10.3390/rs14184592
Xiong, Q., Luo, X., Liang, P., Xiao, Y., Xiao, Q., Sun, H., et al. (2020). Fire from policy, human interventions, or biophysical factors? Temporal–spatial patterns of forest fire in southwestern China. For. Ecol. Manag. 474:118381. doi: 10.1016/j.foreco.2020.118381
Yang, G., Shu, L., Sun, S., Di, X., and Liu, C. (2015). Temporal-spatial distribution regularities of forest fire casualties in China. J. Catastrophol. 30, 21–25. doi: 10.13292/j.1000-4890.202301.015
Yang, X., Liu, K., Hao, Z., Tao, Z., and Shi, G. (2023). An improved unascertained measure-set pair analysis model based on Fuzzy AHP and entropy for landslide susceptibility zonation mapping. Sustainability 15:6205. doi: 10.3390/su15076205
Ye, J., Wu, M., Deng, Z., Xu, S., Zhou, R., and Clarke, K. C. (2017). Modeling the spatial patterns of human wildfire ignition in Yunnan province, China. Appl. Geogr. 89, 150–162. doi: 10.1016/j.apgeog.2017.09.012
Yuen, K. K. F. (2014). Fuzzy cognitive network process: Comparisons with fuzzy analytic hierarchy process in new product development strategy. IEEE Trans. Fuzzy Syst. 22, 597–610. doi: 10.1109/TFUZZ.2013.2269150
Zacharakis, I., and Tsihrintzis, V. A. (2023). Integrated wildfire danger models and factors: A review. Sci. Total Environ. 899:165704. doi: 10.1016/j.scitotenv.2023.165704
Zhang, L., Shi, C., and Zhang, F. (2024). Predicting forest fire area growth rate using an ensemble algorithm. Forests 15:1493. doi: 10.3390/f15091493
Zhao, H., Sun, Y., Jia, W., Wang, F., Zhao, Z., and Wu, S. (2023). Study on the regeneration probability of understory coniferous saplings in the Liangshui nature reserve based on four modeling techniques. Remote Sens. 15:4869. doi: 10.3390/rs15194869
Zhao, P., Zhang, F., Lin, H., and Xu, S. (2021). GIS-based forest fire risk model: A case study in Laoshan national forest park, Nanjing. Remote Sens. 13:3704. doi: 10.3390/rs13183704
Zhao, W., Shan, H., and Zhong, R. (2008). A new model for the MODIS fire monitoring: Normalized difference thermal index. J. Natural Disasters 17, 153–157. doi: 10.11873/J.ISSN.1004-0323.2007.3.403
Zhen, Z., Li, F., Liu, Z., Liu, C., Zhao, Y., Ma, Z., et al. (2013). Geographically local modeling of occurrence, count, and volume of downwood in Northeast China. Appl. Geogr. 37, 114–126. doi: 10.1016/j.apgeog.2012.11.003
Keywords: fuzzy logic, Dong model, wildfire vulnerability, spatial risk analysis, forest fire susceptibility
Citation: Ahmad H, Wu Z, Huang H, Muhammad S, Hayat M, Abbas K, Yang X and Shu Z (2025) A comparative evaluation of forest fire hazard vulnerability through geographic information system-based techniques. Front. For. Glob. Change 8:1635041. doi: 10.3389/ffgc.2025.1635041
Received: 25 May 2025; Accepted: 29 September 2025;
Published: 16 October 2025.
Edited by:
Vincenzo Giannico, University of Bari Aldo Moro, ItalyReviewed by:
Narissara Nuthammachot, Prince of Songkla University, ThailandCumhur Güngöroğlu, Karabük Üniversitesi, Türkiye
Copyright © 2025 Ahmad, Wu, Huang, Muhammad, Hayat, Abbas, Yang and Shu. This is an open-access article distributed under the terms of the Creative Commons Attribution License (CC BY). The use, distribution or reproduction in other forums is permitted, provided the original author(s) and the copyright owner(s) are credited and that the original publication in this journal is cited, in accordance with accepted academic practice. No use, distribution or reproduction is permitted which does not comply with these terms.
*Correspondence: Zhan Shu, c2h1emhhbkBuZWZ1LmVkdS5jbg==