Abstract
Climate change necessitates urgent action across all sectors, including forestry, which remains underdeveloped in some countries—especially South Korea, where the carbon sequestration capacity of forests is declining due to tree aging. To address this challenge, a circular forest management system is crucial for promoting wood utilization and regeneration with climate-resilient species. This study develops a regional-scale sustainable forest management model that integrates wood production, processing, and biomass energy generation, and evaluates its economic viability in Goesan-gun, a forestry-centric district in South Korea. Data from timber production and wood-related industries were used to quantify outputs across the supply chain, including roundwood, processed wood, and energy, and to calculate cash flows encompassing annual investment requirements and revenues. The analysis also incorporated carbon credits and renewable energy certificates, which have become essential market instruments in the context of climate change. Results showed that total wood production from the 22,900-hectare project area amounted to 2,265,235 m3 (approximately 56,631 m3 annually), which is 2.6 times higher than the national average. The overall economic assessment indicates positive feasibility, with a net present value (NPV) of US$25.3 million, an internal rate of return (IRR) of 13.1%, and a benefit–cost ratio (BCR) of 1.17, considering carbon credits and renewable energy incentives. However, the wood processing sector alone was not economically feasible (NPV: –US$1.9 million; IRR: 1.1%), indicating a potential disconnect in the supply chain. These results indicate that forestry investment can be economically viable, but integrated governance is required to bridge sectoral financial gaps and sustain a regional-level forestry value chain.
1 Introduction
Amid the escalating climate crisis, the international community has recognized the urgent need to address climate change through all possible means. The estimated global costs of achieving climate targets that limit temperature increases between 2°C and 1.5°C above pre-industrial levels are approximately US$15 trillion and US$30 trillion, respectively (Vuuren et al., 2020). From a governmental perspective, meeting Nationally Determined Contributions established under the Paris Agreement will require substantial investment—exceeding US$1 trillion annually over the next 15 years (Climate Investment Funds, 2021). Consequently, the international community is seeking more cost-effective approaches, with nature-based climate solutions projected to deliver over one-third of the climate mitigation needed by 2030 (Griscom et al., 2017). Forests, as a core component of nature-based solutions, are vital not only for their capacity to sequester atmospheric CO2 but also for the contrasting effect of emissions from deforestation and forest degradation (Yanai et al., 2020). Accordingly, beyond expanding forest areas, it is essential to sustain forest cover and biomass stocks by maintaining an appropriate balance between the utilization and conservation of forest resources (Climate Investment Funds, 2021; Gromko et al., 2019).
Recently, the concept of net-zero emissions and carbon neutrality has driven countries and corporations to establish long-term pathways toward achieving net-zero targets (Ekkel, 2020). The Paris Agreement has also motivated various actors, including nations, international organizations, and private companies, to participate in forest-related initiatives (European Investment Bank, 2019). Most importantly, the international community has intensified efforts to curb the loss of tropical forests, which represent the largest proportion of global forest cover and account for approximately 17% of anthropogenic CO2 emissions worldwide (FAO, 2020; Li et al., 2020; Yanai et al., 2020).
Although tropical forests play a central role in climate change mitigation, the management of temperate and boreal forests is equally important, as these regions together contain approximately 45% of the total growing stocks in the world—approximately 252 billion m3 across 16% of global forest area and 556 billion m3 across 27% of global forest area (FAO, 2020, 2024). Enhancing CO2 sequestration in existing temperate forests should not be underestimated, given their considerable mitigation potential (Feng, 2022). For instance, forest management accounts for 60%−80% of mitigation potential in the United States, non-Annex 1 East Asian countries, and transition economies (Climate Investment Funds, 2021). Furthermore, the use of harvested wood products (HWPs) derived from sustainable forest management not only prolongs carbon retention in products but also substitutes carbon-intensive materials, such as plastics, steel, and cement (Nabuurs et al., 2007).
However, the utilization of forest resources remains insufficient, and several countries are highly dependent on imports to meet domestic wood demand, which consequently increases emissions from transportation. Globally, the volume of traded wood rose from 40 million m3 in 1990 to 140 million m3 in 2022 (FAO, 2024). Although countries in the Organization for Economic Cooperation and Development (OECD) generally manage their forest sustainably—harvesting an average of 69% of annual forest growth across 23 member states—some countries, such as Chile, Iceland, Italy, Japan, South Korea, Luxembourg, and the Netherlands, harvest less than half of their annual increment [OECD (Organisation for Economic Co-operation and Development), 2020].
For those countries, there is an urgent need to strengthen forest management, which requires substantial financial investment. Historically, however, forestry has been viewed as a highly risky sector, and institutional timberland investment was virtually non-existent in the early 1980s (European Investment Bank, 2019). Nevertheless, forestry investors have constantly sought new geographical regions, expanding beyond Latin America into Eastern Europe, Asia, and Africa, and have increased total investments to more than US$100 billion (Binkley et al., 2020; Chudy and Cubbage, 2020). Furthermore, the rapid expansion of the voluntary carbon market has created an additional opportunity for investors by providing new economic incentives for forest-related projects, such as conservation and restoration initiatives (World Economic Forum, 2021).
Forestry is increasingly recognized as a means of supplying sustainable materials and exhibiting climate action, particularly under mounting pressure on corporations, to establish sustainable business models and transition toward a low-carbon economy (Baccas and Warnatzsch, 2024). Governments are likewise exploring ways to mobilize private-sector financing for climate-related forestry projects, given the constraints of their fiscal capacity (Lujan and Silva-Chávez, 2018; Climate Investment Funds, 2021). Amid these ongoing environmental and social transitions, this study assessed the economic feasibility of sustainable forestry management to evaluate the potential for private-sector investment in forestry in South Korea, where challenges persist in expanding domestic timber utilization and attracting institutional investors (Woo et al., 2020).
The scope of analysis was expanded to include an integrated supply chain comprising forest management, wood processing, and renewable energy generation, thereby enhancing both investment profitability and the effectiveness of climate change mitigation efforts. Goesan-gun was selected as the study area because it has been developing an integrated regional-level forestry supply chain that encompasses multiple stages of production and processing (Korea Forestry Promotion Institute, 2024). The analysis also incorporated carbon credits and renewable energy certificates as emerging market instruments to assess forestry projects from the perspective of financial investors pursuing business opportunities in the context of climate change. Finally, this study identified key limitations to scale up integrated forest management systems and proposed additional measures to attract greater private investment in the forestry sector.
2 Materials and methods
2.1 Study area
This study was conducted in the forests of Goesan-gun, Chungcheongbuk-do, located in central South Korea. The forest conditions in this region are representative of the overall forest characteristics of the country. The growing stock is similar at both the provincial and national levels (159.9 m3/ha vs. 165.2 m3/ha), and the proportion of forested area is also comparable (65.9% vs. 62.7%) (Figure 1; Korea Forest Service, 2023d). Over the past decade, Goesan-gun has recorded a mean annual temperature of 12.5°C and a mean annual precipitation of 1,237 mm (KOSIS National Statistical Portal, 2024). As of 2024, the population of the district is 36,252, with agriculture as its primary industry, promoted under the slogan “Clean Goesan,” which emphasizes environmentally friendly and sustainable practices (Goesan-gun, 2024; Lee et al., 2024). Goesan-gun is recognized as a leading district in sustainable forest management. It was certified as a sustainable forest management city in 2022 by the Korea Forestry Promotion Institute and has been identified as an optimal site for wood industrial clusters due to its favorable market and transportation accessibility (Korea Forestry Promotion Institute, 2024; Woo et al., 2020). In line with these strengths, the district has pursued regional-scale sustainable forest management initiatives, including the establishment of a comprehensive forest management plan in 2020, the acquisition of Program for the Endorsement of Forest Certification for 2,565 ha in 2022, and the creation of an energy self-supporting village using forest biomass in 2024 (Ban et al., 2020; Goesan-gun, 2024).
Figure 1
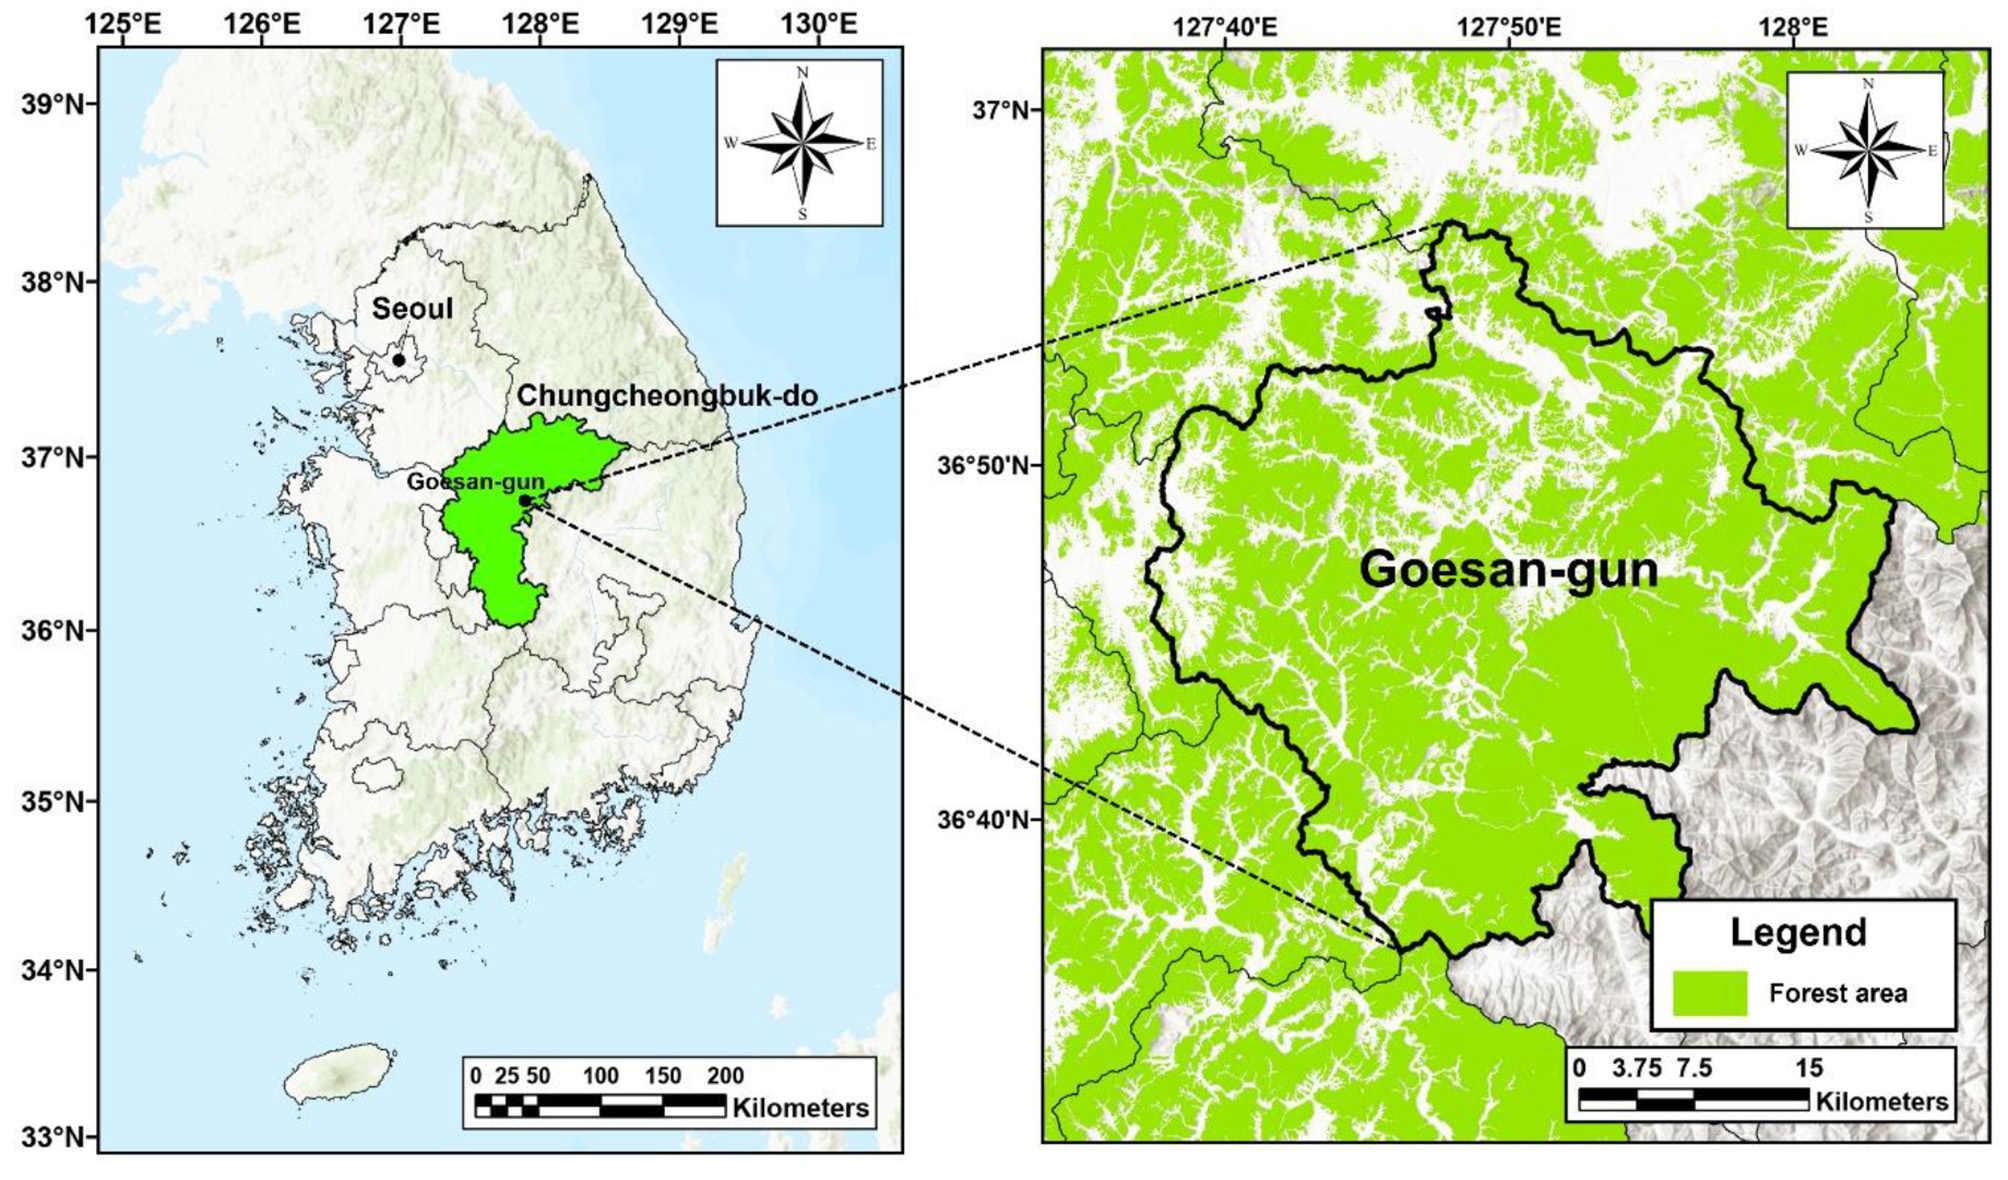
Location and forest cover of the study area in Goesan-gun, Chungcheongbuk-do, South Korea.
South Korea, including Goesan-gun, has maintained abundant forest stocks due to strong state-led reforestation and conservation policies initiated in the 1960s, coupled with limited harvesting of forest resources (Ma, 2021). In 2022, the growing stock in Goesan-gun was reported to be 174.9 m3/ha (Korea Forest Map Service, 2024). The stand age structure is relatively homogenous, with most stands aged between 30 and 60 years, and 92.5% of forests are classified as high-density regions (Supplementary Table S1; Korea Forest Map Service, 2024). Consequently, thinning is needed to improve the growing conditions for trees, particularly in stands older than 30 years, which exhibit higher tree densities (Lee et al., 2022; Brown et al., 2019).
2.2 Forest management scenario
The central objective of the project is to integrate various land tenures under a unified administrative framework and to promote the sustainable production of forest resources (Supplementary Figure S1). Through the establishment of a wood processing facility and a combined heat and power plant, forest resources are linked to vertically integrated regional supply chains (hereinafter referred to as “the project”; Supplementary Figure S2). This integrated system enhances the stability of raw material procurement and generates carbon-related benefits. Overall, these approaches are designed to address structural challenges to sustainable forest management, such as small-scale operations and limited access to markets for value-added products (Table 1).
Table 1
| Category | Current situation | Planned developments |
|---|---|---|
| Forest management | · Not active | · Introduction of active forest management |
| Ownership | · 3 ha per landowner | · 22,900 ha managed by a specialized company |
| Work system | · Harvest workers hired through intermediate vendors | · Establishment of three SPCs – Forestry sector – Processing sector – Energy sector |
| Harvesting | · Small-scale clear-cutting carried out separately | · 10% clear-cutting with replanting · 90% thinning |
| Supply chain | · Fragmented across sectors | · Integrated: harvest → wood process → energy generation |
| Marketable commodity | · Roundwood sold to the market | · Roundwood sold to the market · Roundwood supplied within the project · Carbon credits · Processed sawnwood · Processed woodchips · Processed firewood · Byproduct (wood dust) · Electricity · Heat used for RE100 by local industries · RECs |
| Sale | · Raw materials sold in small quantities to intermediate vendors | · Value-added products sold at a large scale (see marketable commodities above) |
| Subsidy | · None for clear-cutting · 90% for replanting |
· None for clear-cutting · 90% for replanting · 100% for thinning |
| Carbon credit issuing | · None | · Registration in the voluntary carbon scheme in the Republic of Korea |
| Forest certification | · 2,546 ha in public forests | · Expansion to the entire project area |
Current status and planned development of the project in Goesan-gun.
The total project duration was set to 40 years to reflect the regulated rotation age of major species, such as Pinus densiflora, other conifers, Castanea crenata, Betula platyphylla, and other broadleaved trees, which together occupy 47% of the province. This alignment between the project duration and the rotation age ensures at least one harvest cycle across all regeneration areas during the project period (Supplementary Table S2; FAO (Food and Agriculture Orgazization of the United Nations), 2018; Korea Forest Service, 2025). Assuming annual roundwood production from 1,000 ha—comprising 100 ha of clear-cutting and regeneration and 900 ha of thinning—the total management area amounted to 22,900 ha (Table 2 and Supplementary Table S3). Regeneration was incorporated into the project to replace existing tree species with those better adapted to changing climate conditions, given the long investment horizon in forestry and the multiple risks associated with future climate impacts (West et al., 2021). Thinning was applied to reduce stand density and create a more favorable growth environment for the remaining trees.
Table 2
| Classification | Contents | |
|---|---|---|
| Project periods | · 40 years | |
| Forestry SPC | Scale of management | · 1,000 ha under operation annually · Total area: 22,900 ha |
| Harvesting (Clear-cutting) | · 10% of annual operating area (100 ha per year) · Conducted in relatively poor-growth areas · Remaining 20% of standing trees managed according to environmentally friendly harvesting (Korea Forest Service, 2023a) |
|
| Thinning | · 90% of annual operating area (900 ha per year) · Conducted in general stands excluding harvesting areas · Rotational thinning across each operational unit on a 20-year cycle · 20% intensity for sustainable growth |
|
| Processing SPC | Installations | · Woodchip processing line · Sawnwood processing line · Firewood processing line |
| Procurement | · 100% of raw materials purchased from the forestry SPC | |
| Yield rate | · Woodchips: 76.5% · Sawnwood: 55.8% · Firewood: 96.0% |
|
| Commodity | · Woodchips supplied to the energy SPC · Sawnwood, firewood, and wood dust sold to the market |
|
| Energy SPC | Installment | · Combined heat and electricity plant using forest biomass |
| Procurement | · 100% raw materials purchased from the processing SPC | |
| Commodity | · Renewable heat for local consumers · Electricity to Korea Electric Power Corporation · REC to the Korea Electric Power Corporation |
|
Scenario of integrated forest management identified in this study.
SPC, special purpose company; REC, renewable energy certificate.
In this study, we assumed that clear-cutting would retain 20% of the existing volume, consistent with South Korean regulations, while thinning would remove 20% of the stand volume, which is below the regulatory limit of 30% thinning intensity (Korea Forest Service, 2023a). These parameters were established to ensure continued forest growth and to maintain or enhance carbon sinks, as high-intensity thinning can reduce stand volume and lead to long-term declines in carbon storage and forest health (Lee et al., 2015). Specifically, thinning 30% of current stands aged 40–50 years would decrease the volume by approximately 52.5 m3 from an average of 174.9 m3 in the study area, requiring approximately 20 years for recovery. Therefore, it is necessary to limit the thinning intensity to below 30% to allow stands to fully recover within a 20-year thinning cycle. Although both 25% and 20% thinning intensities can lead to additional growth within this period—requiring approximately 16 and 12 years, respectively, to recover their previous volumes—this study adopted a 20% thinning intensity to promote more effective stand growth and enhance carbon sequestration in thinning areas.
2.3 Production of commodities
The project was divided into three main components along the supply chain as follows: (1) the forestry sector was responsible for roundwood production, (2) the processing sector was engaged in manufacturing wood products, and (3) the energy sector generated electricity and heat from biomass (Supplementary Figure S2). A forestry special-purpose company (SPC) was assumed to oversee roundwood production using two harvesting methods: clear-cutting and thinning (Korea Forestry Promotion Institute, 2023). According to national wood industry statistics, 76.7% of coniferous roundwood was derived from clear-cutting and 23.3% from thinning. For broad-leaved species, clear-cutting and thinning accounted for 69.8% and 30.2%, respectively (Supplementary Figure S3; Supplementary Table S4; Korea Forest Service, 2023b). The harvested roundwood was categorized into four product types—woodchips for energy, sawnwood, firewood, and other biomass for medium-density fiberboard (MDF)—which were consolidated from 15 categories in the national statistics on roundwood production and utilization (Table 3; Korea Forest Service, 2023b).
Table 3
| (1) National statistics | ▸ | (2) Production volume ratio by species and harvest methods | ▸ | (3) Reconstitution | |||||||||
|---|---|---|---|---|---|---|---|---|---|---|---|---|---|
| Category | Conifers | Broad-leaved | Conifers | Broad-leaved | Wood products | Clear-cutting | Thinning | ||||||
| Clear-cutting | Thinning | Clear-cutting | Thinning | Conifers | Broad-leaved | Conifers | Broad-leaved | ||||||
| Total(o-O) | 2,086,794 | 1,454,464 | 1,601,197 | 485,597 | 1,015,518 | 438,946 | – | 61.2% | 38.8% | 52.5% | 47.5% | ||
| Sawnwood | 666,129 | 24,916 | 511,121 | 155,008 | 17,397 | 7,519 | Sawnwood (, , , ) | 19.7% | 0.7% | 16.9% | 0.9% | ||
| Preservative wood | 1,060 | - | 813 | 247 | - | - | |||||||
| Fire-retardant-treated wood | 27 | - | 21 | 6 | - | - | |||||||
| Glue-laminated timber | 3,050 | 1,200 | 2,340 | 710 | 838 | 362 | |||||||
| Woodchip | 121,568 | 190,008 | 93,279 | 28,289 | 132,665 | 57,343 | Woodchips (, , ) | 13.2% | 5.4% | 11.3% | 6.6% | ||
| Wood pellet | 76,599 | 1,336 | 58,774 | 17,825 | 933 | 403 | |||||||
| Wood dust/wood flour | 252,595 | 12,120 | 193,816 | 58,779 | 8,462 | 3,658 | |||||||
| Molded charcoal | 6,200 | 6,200 | 4,757 | 1,443 | 4,329 | 1,871 | Firewood (, , ) | 0.2% | 20.8% | 0.2% | 25.4% | ||
| Charcoal/pyroligneous liquid | 779 | 45,245 | 598 | 181 | 31,590 | 13,655 | |||||||
| Fuel wood | - | 727,437 | - | - | 507,902 | 219,535 | |||||||
| O Laminated/board | 958,787 | 387,777 | 735,677 | 223,110 | 270,749 | 117,028 | Other biomass (O, O) | 28.1% | 11.9% | 24.1% | 14.6% | ||
| O Mushroom log | - | 58,225 | - | - | 40,653 | 17,572 | |||||||
Proportion of marketable products by production method and forest type, reconstituted from national statistics on roundwood purchase volumes by end use in 2022 (Korea Forest Service, 2023b).
Production volumes by species and harvesting methods (Column 2) were calculated by multiplying each product volume (Column 1) by the corresponding production ratios for each harvesting methods, as described in Supplementary Figure S3.
Another significant source of revenue for the forestry SPC was carbon credits. In recent years, carbon markets have become increasingly essential mechanisms for incentivizing mitigation activities, such as sustainable forest management, thereby helping to offset the limited profitability of conventional forestry operations (Woo et al., 2021). Globally, nature-based solutions are recognized as particularly valuable because they deliver ecosystem services that extend beyond carbon sequestration (World Bank, 2023). Accordingly, the project was assumed to be registered under the Korea Forest Carbon Offset Scheme (KFCOS), applying the methodology of “Improved Forest Management through Extension of Rotation Age” for thinning areas—where the remaining trees, despite reaching the harvestable age and being eligible for harvest, continue to sequester CO2–and “Improving a Forest Type” for harvesting areas (Korea Forest Carbon Center, 2022). Most of the study areas were classified above age class IV, allowing the application of both methodologies. Thinning and harvesting were assumed to be conducted sequentially over 1,000 ha out of the total 22,900 ha each year, with stands reaching the rotation age throughout the project period (Supplementary Table S1).
The processing SPC was responsible for producing woodchips, sawnwood, and firewood by procuring roundwood as raw material from the forestry SPC. Given the need to supply sufficient woodchips to the energy SPC, which involved the largest investment in facility installation, woodchip processing was prioritized over firewood until the required input level was achieved. Sawnwood production was assumed to follow the national average rate in South Korea, reflecting its higher market value and greater capacity for long-term carbon storage in durable wood products (Soimakallio et al., 2021). The final output of the processing SPC was calculated by multiplying the roundwood volume by the average yield rate of wood processing, which was adjusted based on national wood industry statistics (Figure 2; Korea Forest Service, 2023b).
Figure 2
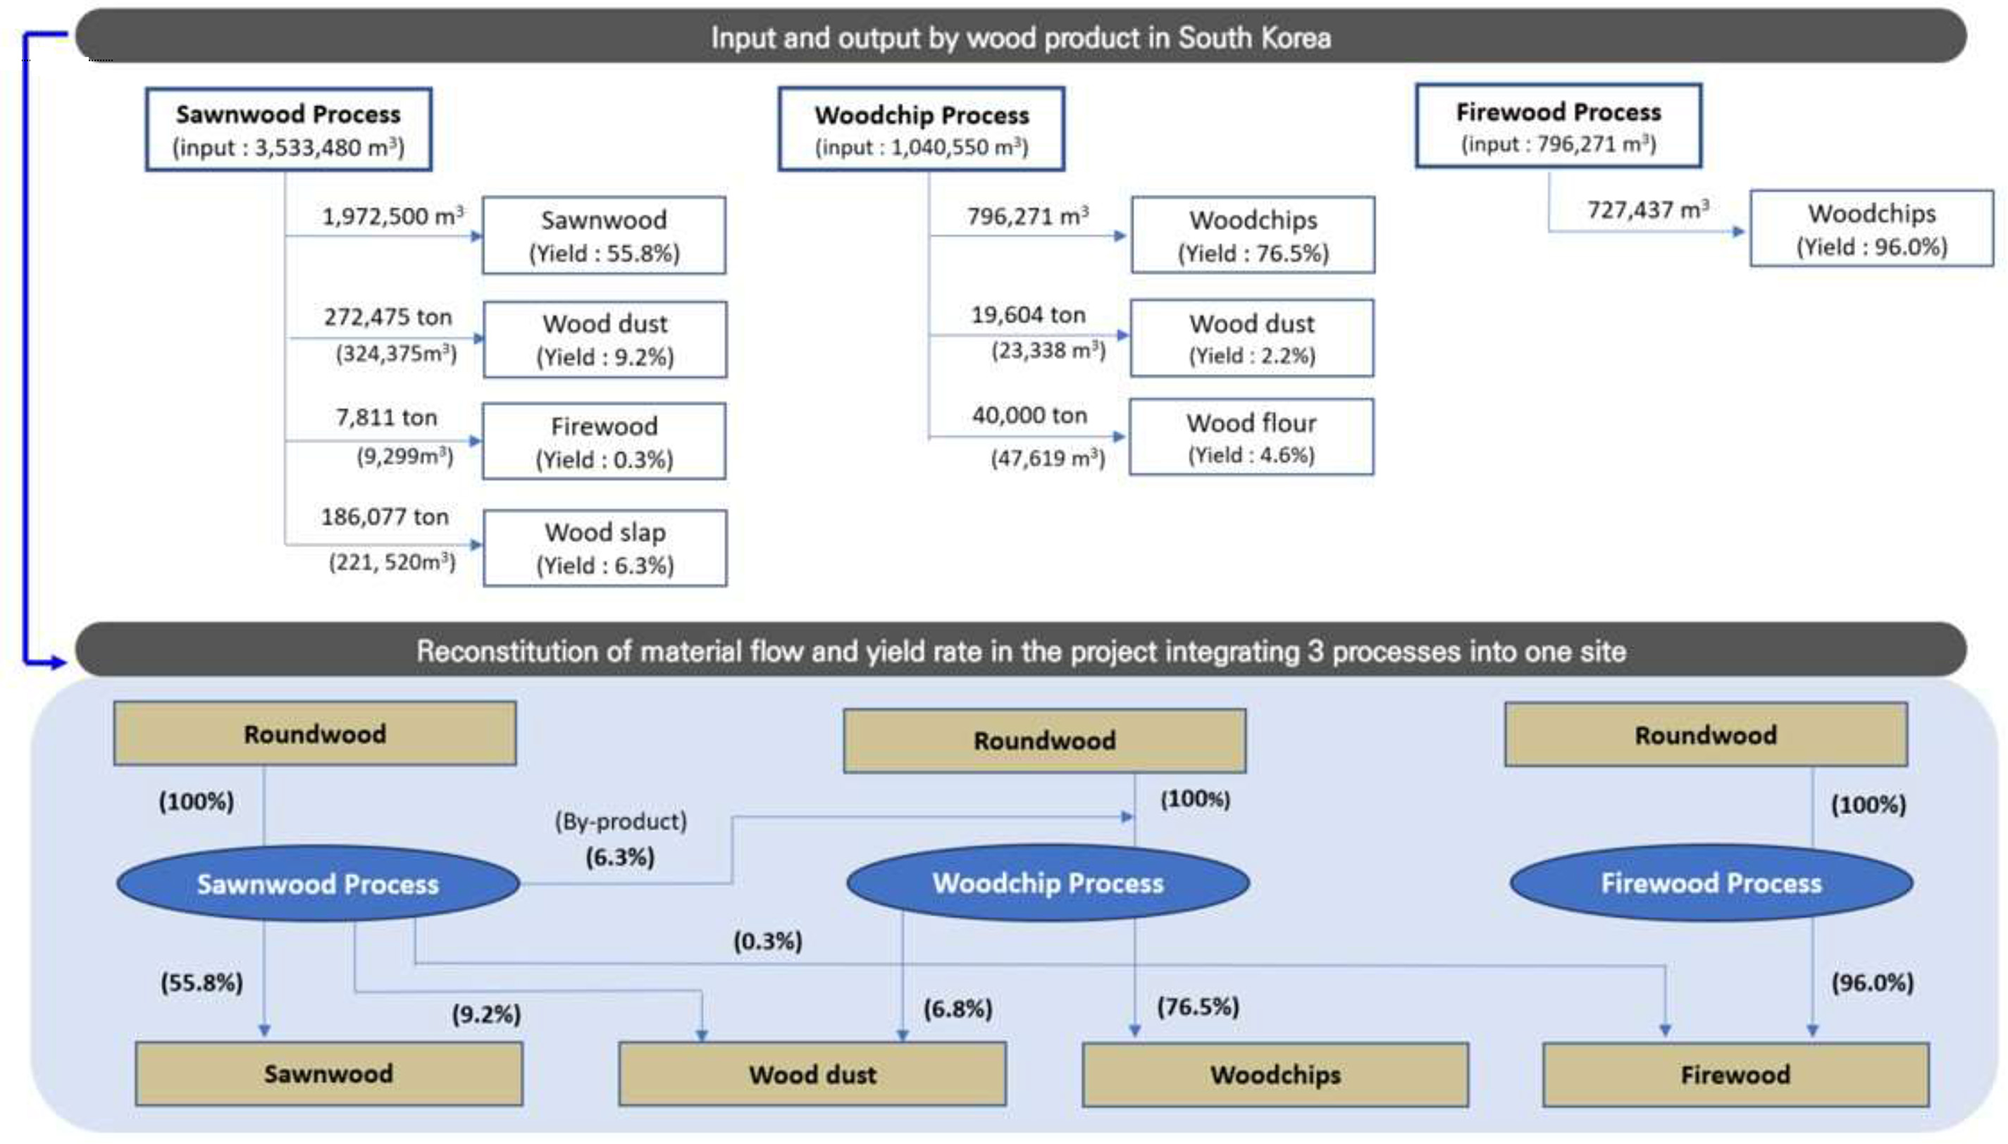
Yield rates at each step of processing based on input and output volumes by product in 2022. A conversion factor of 0.84 from volume to weight was applied. By-products generated from the woodchip process—namely, wood dust and wood flour—were combined into a single category, wood dust, to simplify product classification and improve process-line efficiency within the project. For the firewood processing factory, a yield rate of 96% was used, based on experimental data from the factory, rather than on statistical data.
The energy SPC was designed to procure woodchips from the processing SPC and generate both heat and electricity. To estimate energy output, this study applied conversion rates derived from an existing energy self-supporting village project in Goesan-gun (Figure 3; Korea Forestry Promotion Institute, 2023). These rates were verified as conservative when compared with similar cases in Japan (Ko et al., 2023).
Figure 3
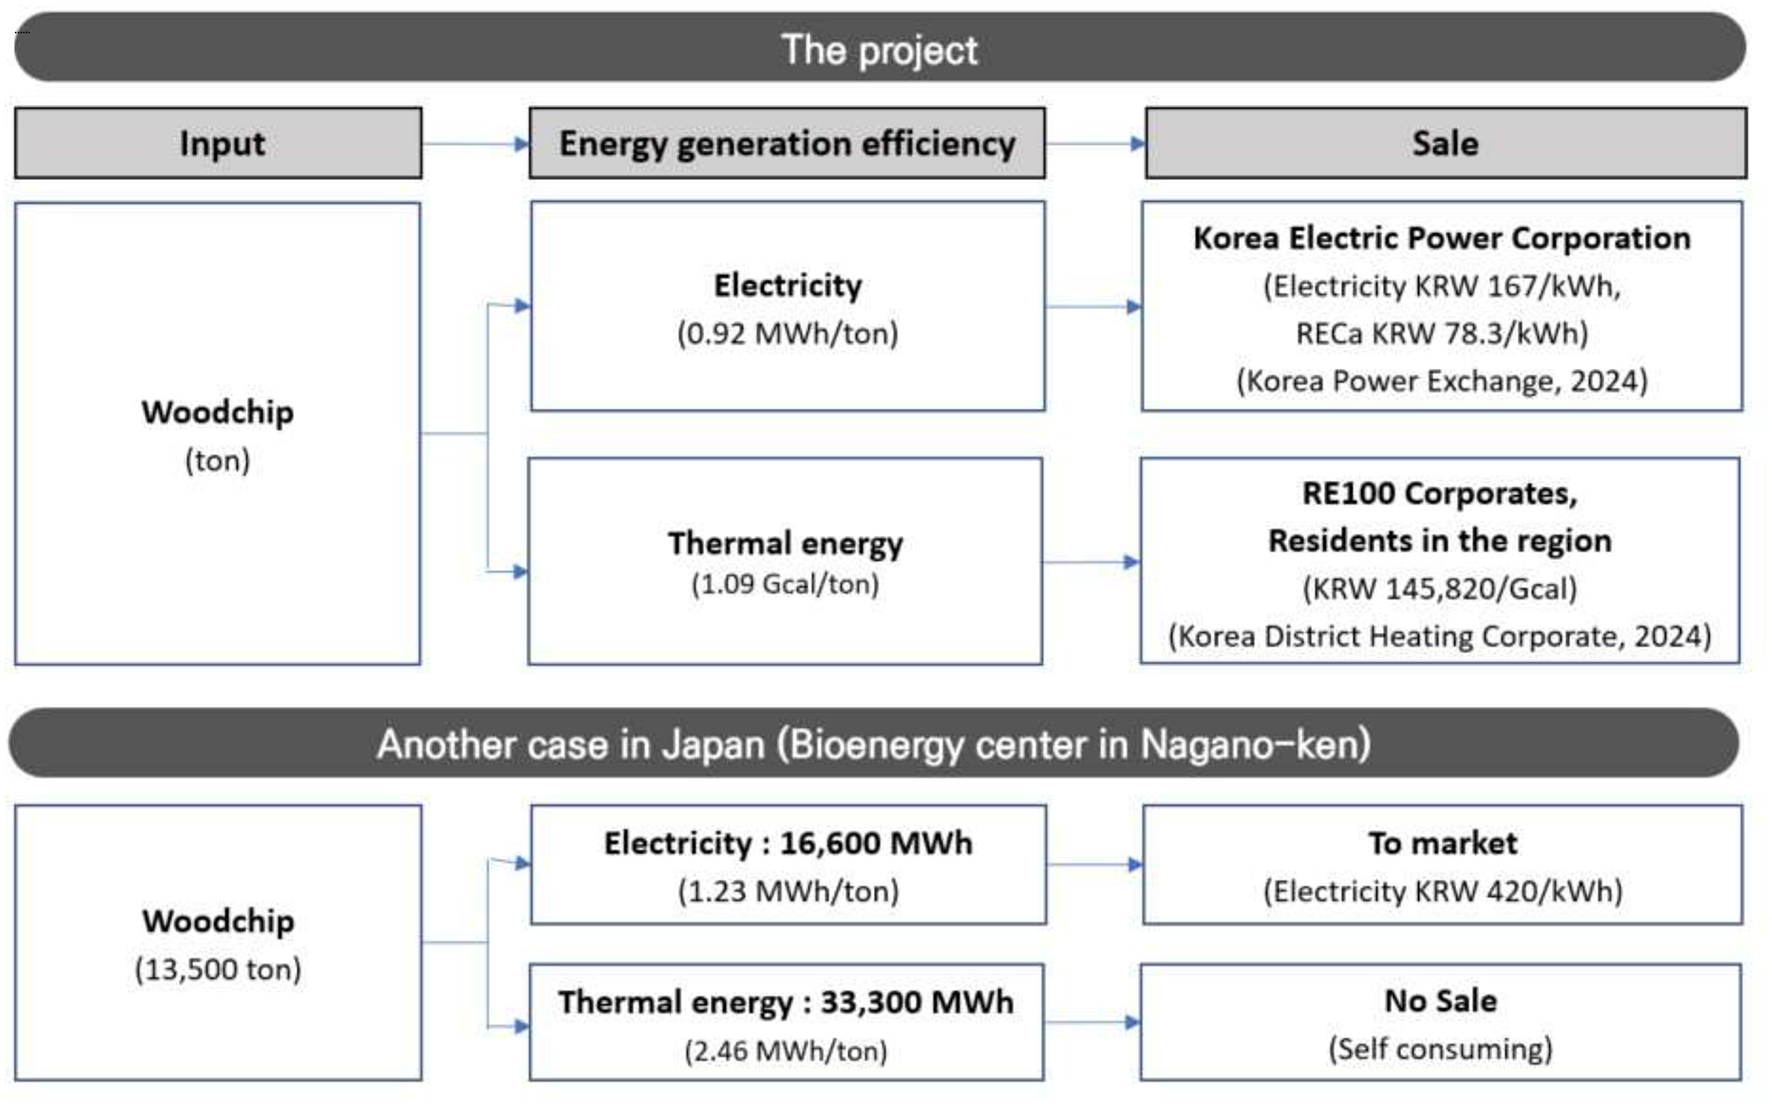
Conversion rates from woodchips to energy and the market prices used in this study, which are conservative compared to those reported for Japan (Ko et al., 2023).
2.4 Cost and revenue
The costs and revenues of each SPC were calculated separately. All monetary values were expressed in U.S. dollars (US$), using an exchange rate of US$1 = KRW1,258.84, which represents the 5-year average from 2020 to 2024. Based on the management scenarios presented in Table 2, the required numbers of equipment and facilities were determined according to the production volume and the operational efficiency of different types of machinery. Variable costs, such as personnel, fuel, and administrative expenses, were estimated using industrial averages in South Korea (Supplementary Tables S5–S8).
The cost structure of the forestry SPC included expenditures for harvesting machinery, fuel, maintenance, labor, rent, forest road installation, reforestation, and transportation. These costs reflected operational efficiency by slope, which was derived from spatial information analysis of the study area (Supplementary Tables S5, S6). Additionally, administrative expenses associated with the KFCOS and the Korea Forest Certification Council were incorporated to account for the added value provided by certification.
The processing SPC included sawnwood, woodchip, and firewood production facilities (Supplementary Table S7). Facility investment costs were estimated using data from the Wood Cluster Project in Taebaek City and a similar case in Cheongju for firewood production, with adjustments made according to the input volume of the project (Taebaek-si, 2023). The number of employees was calculated by multiplying the industry-average workforce per production unit by the input volume of the project, and labor costs were determined based on the average industry wage rates (Korea Forest Service, 2023b; KOSIS National Statistical Portal, 2024). Maintenance, insurance, utilities, electricity, and administrative expenses were estimated based on the national average for the manufacturing industry in South Korea (KOSIS National Statistical Portal, 2024).
The costs associated with generating electricity and thermal energy from forest biomass included factory construction, raw material procurement, facility operation, and labor (Supplementary Table S8). Factory construction costs were estimated based on a proposal from a company experienced in operating the only biomass energy facility in South Korea. The required workforce for factory operation was determined with reference to the energy self-supporting village in Goesan-gun and a comparable project in Japan (Ko et al., 2023).
The revenues of each SPC were calculated by multiplying production volumes by the corresponding average market prices in South Korea (Supplementary Table S9). The forestry SPC generated revenues from roundwood and carbon credits, while the processing SPC generated revenue from sawnwood, woodchips, firewood, and wood dust, and the energy SPC generated revenue from heat, electricity, and renewable energy certificates (RECs).
2.5 Profitability analysis
To evaluate profitability, this study employed net present value (NPV), internal rate of return (IRR), benefit–cost ratio (BCR), and economic payback (EPB), which are commonly used indicators for evaluating forestry investments (Table 4; Kim et al., 2012; Cubbage et al., 2015). NPV represents the sum of the present values of cash flows over the project period, and investment projects with positive NPV are considered economically feasible (Souza et al., 2021). IRR is the discount rate at which the NPV of a project equals zero; a project is regarded as economically feasible when the IRR exceeds the minimum return expected by investors (Souza et al., 2021). EPB represents the period required to recover the initial investment, while BCR is calculated as the ratio of the present value of benefits to the present value of costs (Alounsavath and Kim, 2021). For this analysis, a social discount rate of 4.5% was applied, as recommended by the Ministry of Economy and Finance of Korea (Lee, 2023; Song, 2017).
Table 4
| Profitability factors | Formula | Parameter explanations |
|---|---|---|
| NPV | = |
CF
t
: cash inflow or outflow in period j CF0: initial investment value T: project duration, years t: time, year r: project discount rate |
| IRR (r) | CF j : cash inflow or outflow in period j CF0: initial investment value T: project duration, years t: time, year r: project discount rate | |
| BCR | = | B t : benefit from the project in year t Ct: cost of the project in year t T: project duration, years t: time, year r: project discount rate |
| EPB (t) | = | CF j : cash inflow or outflow in period t t: time, year r: project discount rate |
Formulas of profitability factors.
In this study, a sensitivity analysis was conducted to assess uncertainties in project outcomes, specifically the extent to which variations in key variables—project area, timber production volumes, and timber and energy prices—would affect the results (Saltelli et al., 2008). By examining changes in IRR and NPV under scenarios involving a 50% increase or decrease from the reference values of these variables, the analysis identified the key factors that investors should consider to mitigate risks and optimize opportunities for project success.
For changes in the project area, it was assumed that the required machinery, processing facilities, and labor would vary proportionally with the scale of the area. Regarding changes in roundwood production, a decrease in output would not affect facility investment, as the investment scale is based on the initial project plan. Conversely, increases in production beyond planned capacity would necessitate additional facilities to process the surplus volume. Changes in wood prices would affect only the revenues of the processing SPC and the costs of the energy SPC, while changes in energy prices would solely influence the revenues of the energy SPC.
3 Results and discussion
3.1 Production volumes
Under the forest management scenario, the forestry SPC produced a total of 2,265,235 m3 of roundwood, equivalent to 56,631 m3 per year (Figure 4). This output was more than 2.6 times higher than the typical production level of 0.437% of the growing stock (867,563 m3), calculated from national timber production statistics, which report 4,742,065 m3 harvested from a total growing stock of 1,084,556,821 m3 (Korea Forest Service, 2023d). The input volume allocated for sawnwood was 421,275 m3 (18.6% of total production), representing a relatively low proportion within the cascading-use approach, which prioritizes long-lived wood products to maximize carbon storage before their use for biomass energy (Leoussis and Brzezicka, 2017). This outcome reflects the current state of the wood industry in South Korea, which under-utilizes the mitigation potential of HWPs, in contrast to Europe, where HWPs account for nearly 1% of total EU greenhouse gas emission reductions (Pilli et al., 2015). Another revenue source for the forestry SPC was carbon credits, calculated at 2,426,638 tCO2−eq according to the methodologies of KFCOS (Table 5).
Figure 4
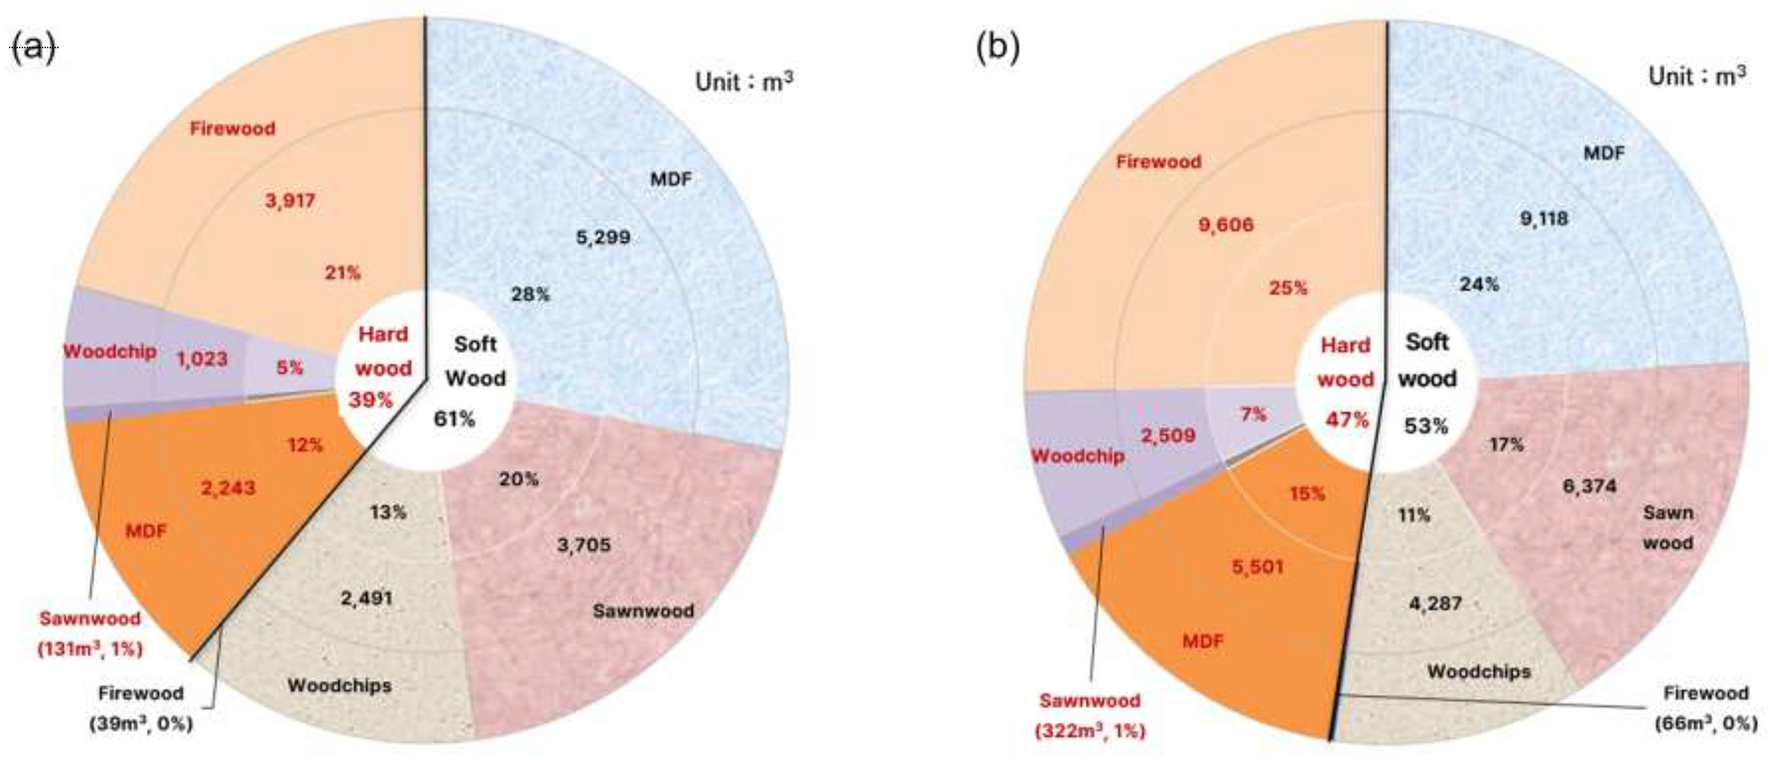
Proportion of input allocated to marketable products according to harvesting method: (a) clear-cutting and (b) thinning.
Table 5
| Period (Years) | Regeneration | Extension of rotation | Total |
|---|---|---|---|
| 1–5 | – | – | – |
| 6–10 | 15,612 | 114,318 | 129,930 |
| 11–15 | 31,478 | 217,457 | 248,935 |
| 16–20 | 47,038 | 302,455 | 349,492 |
| 21–25 | 69,544 | 331,188 | 400,732 |
| 26–30 | 94,738 | 317,257 | 411,995 |
| 31–35 | 116,411 | 317,257 | 433,668 |
| 36–40 | 134,630 | 317,257 | 451,887 |
| Total | 509,450 | 1,917,188 | 2,426,638 |
Amounts of carbon credits issued over the project period.
The input volume for the processing SPC was 1,378,819 m3, excluding 886,416 m3 of roundwood sold directly to the market by the forestry SPC. Of this volume, 17% was allocated to sawnwood, 39.1% to MDF, 24.1% to firewood, and 18.2% to woodchips. Over the 40-year project period, these allocations yielded outputs of 235,169 m3 of sawnwood, 519,306 t of woodchips, 143,058 t of firewood, and 102,874 t of wood dust (Table 6).
Table 6
| Category | Sawnwood (m3) | Woodchips (t) | Firewood (t) | Wood dust (t) |
|---|---|---|---|---|
| Project period (40 years) | 235,169 | 519,306 | 143,058 | 102,874 |
| Annual average | 5,879 | 12,983 | 3,576 | 2,572 |
Quantities of wood products obtained from processing.
The energy SPC was projected to generate 565,147 Gcal of thermal energy and 477,673 MWh of electricity from the 519,306 t of woodchips supplied by the forestry SPC (Table 7). A total of 657,217 REC units were acquired, representing 68.8% of the total roundwood supplied to the energy SPC, as REC credits are issued only for energy production using low-grade roundwood, not clear-cut timber (Korean Law Information Center, 2024).
Table 7
| Category | Heat energy (Gcal) | Electricity (MWh) | REC (MWh) |
|---|---|---|---|
| Project period (40 years) | 565,147 | 477,673 | 657,217 |
| Each year | 14,129 | 11,942 | 16,430 |
Quantities of energy products from energy generation.
REC, renewable energy certificate.
3.2 Cost and revenue
The total cost across all SPCs was US$515,949 thousand, while total revenue reached US$601,155 thousand, resulting in a net profit of US$85,206 thousand (Table 8; Supplementary Figure S4). For the forestry SPC, roundwood sales were the primary source of revenue, accounting for 61.8% of total revenue, while carbon credits and government subsidies contributed the remaining 38.2%. On the cost side, field operations, such as labor and operational expenses, comprised 88.1%, whereas equipment purchases and administrative costs accounted for the remaining 11.9%. In the absence of subsidies for forest regeneration and tending, forestry SPC revenue declined from US$260,144 thousand to US$169,697 thousand.
Table 8
| Category | Cost (US$1,000) | Revenue (US$1,000) | ||
|---|---|---|---|---|
| Annual | Project period | Annual | Project period | |
| Forestry SPC | 5,484 (5,230) | 219,347 (211,983) | 6,504 (5,151) | 260,144 (206,029) |
| Processing SPC | 4,253 | 170,136 | 4,283 | 171,314 |
| Energy SPC | 3,162 | 126,465 | 4,242 | 169,697 |
| Total | 12,899 (12,715) | 515,949 (508,584) | 15,029 (13,676) | 601,155 (547,040) |
Costs and revenues of each SPC for the forestry SPC, revenues depend on whether government subsidies are received for tending, thinning, and replanting.
In the revenue rows, for the forestry SPC and the total, values without parentheses represent revenues with subsidies, while values in parentheses represent revenues without subsidies.
For the processing SPC, sawnwood sales accounted for 48.9% of total revenue, despite representing only 23.5% of output volume, due to its highest unit price among the four product types. This was followed by woodchips (22.7%), firewood (15.6%), and wood dust (12.8%) of total revenue. These results highlight the importance of increasing the share of high-value products, such as sawnwood, not only to improve profitability but also to stabilize cash flow by minimizing vulnerability to fluctuations in byproduct prices (Sathre and Gustavsson, 2009). On the cost side, 70.5% of processing SPC expenditures were allocated to raw material procurement, indicating that forestry and processing SPCs are closely linked and potentially competitive in terms of financial performance (Buehlmann and Thomas, 2025).
For the energy SPC, the primary revenue sources were heat energy sales (38.6%) and electricity sales (37.3%). REC sales also contributed substantially (24.1%), reflecting that government subsidies through RECs remain a key driver for renewable energy producers (Song, 2023). On the cost side, raw material procurement (woodchips) represented the largest component (41.5%), followed by facility installation (26.8%) and operation (17.8%). This cost structure demonstrates that both feedstock supply and capital investment are critical determinants of overall costs, indicating the need for stable wood procurement strategies to manage price volatility and to minimize the risk of operational interruption caused by raw material shortages (Supplementary Table S8; Palander, 2024).
3.3 Profitability analysis
The annual cash flow for the project is summarized in Figure 5. The overall investment was fully recovered in the 10th year, with the forestry SPC reaching break-even in the 12th year and the energy SPC in the 7th year (Supplementary Table S10). Conversely, the processing SPC required 36 years to reach breakeven, reflecting a challenging business environment for wood processors in South Korea. The profitability analysis based on cash flow is presented in Table 9. The forestry SPC and energy SPC both achieved positive NPVs and IRRs, whereas the processing SPC yielded a negative NPV and a low IRR. Overall, the integrated project produced favorable economic outcomes.
Figure 5
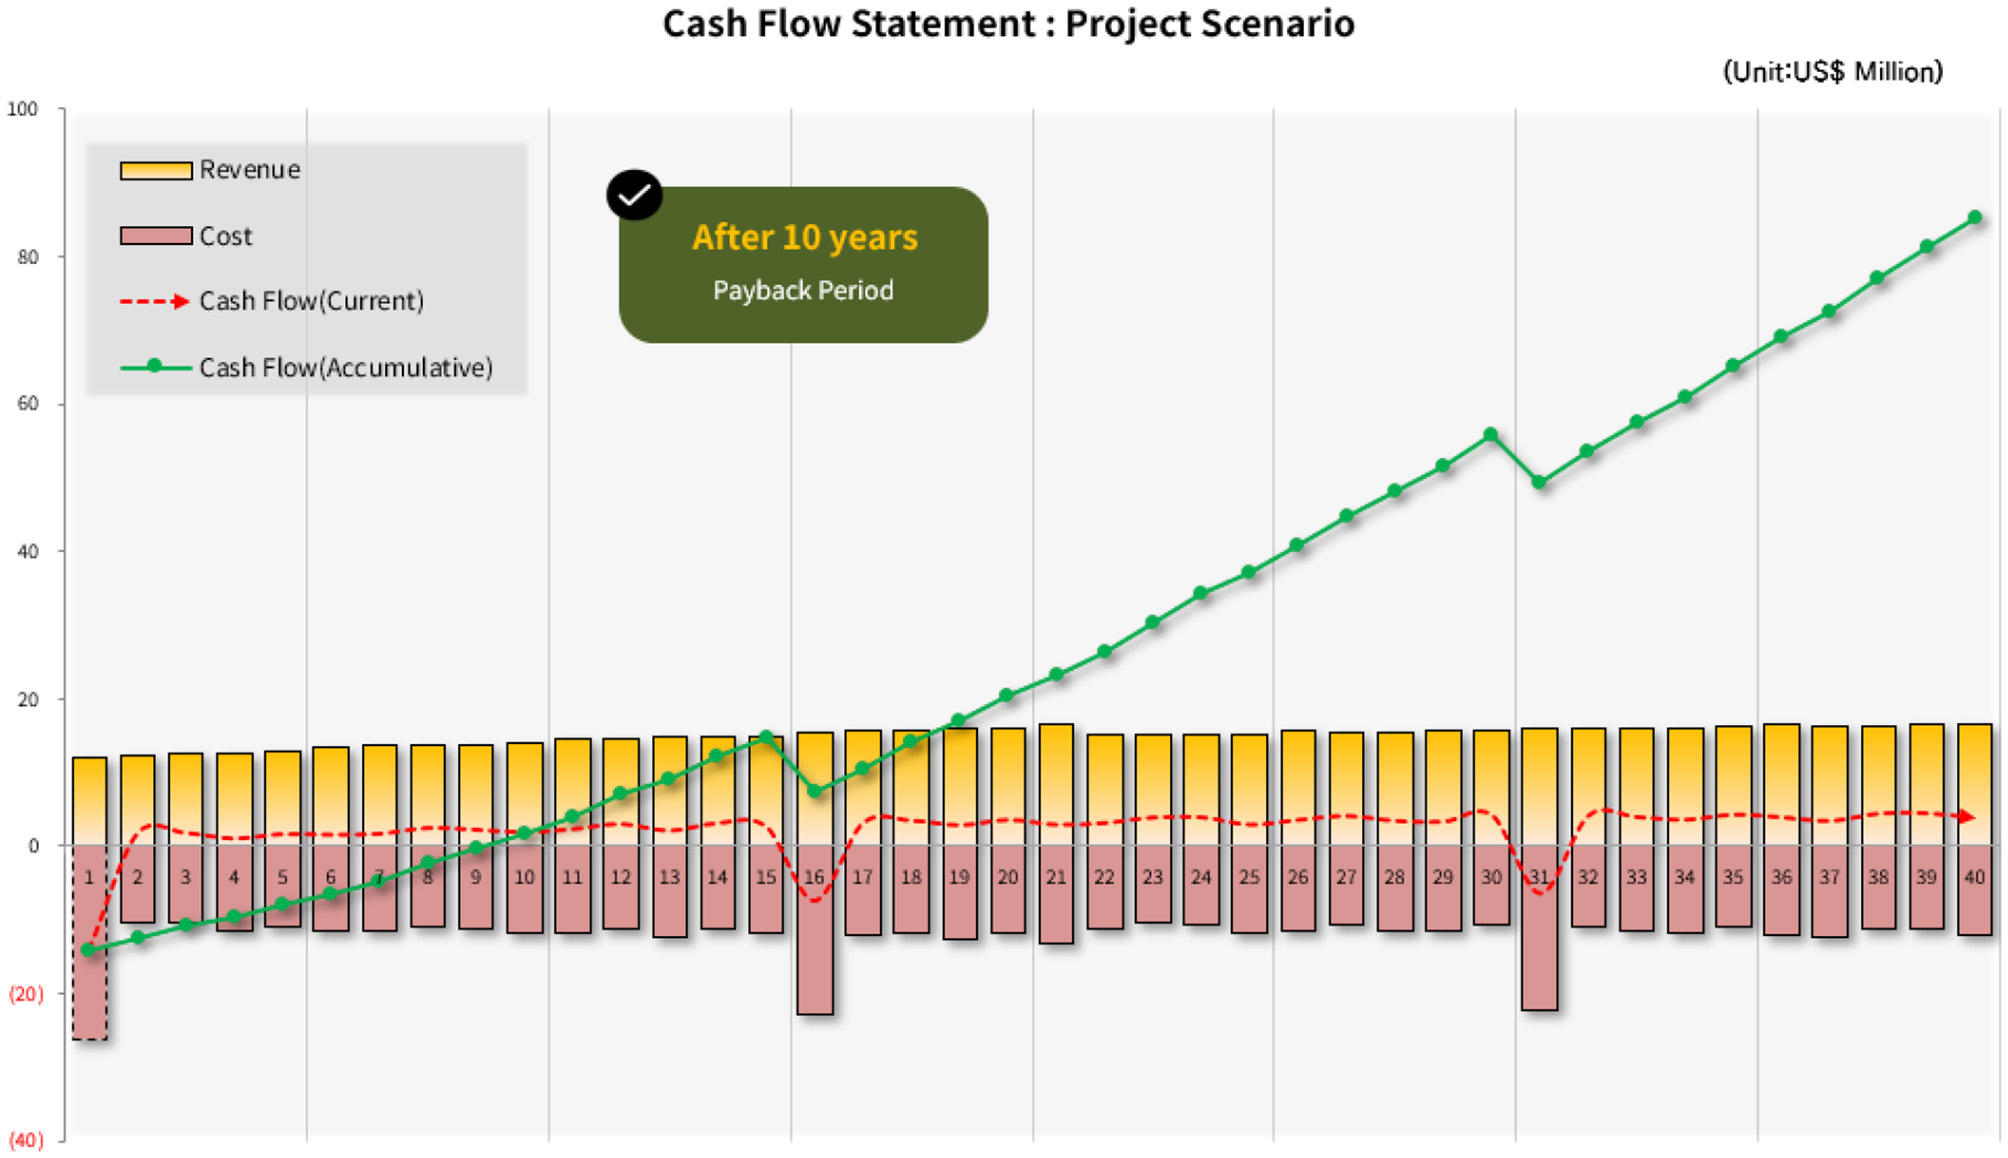
Cash flow of the entire project, obtained by summing the cash flows of the forestry SPC, processing SPC, and energy SPC. The initial investment is recovered in the 10th year of the project.
Table 9
| Category | NPV (US$1,000) | IRR | EPB (Years) | BCR |
|---|---|---|---|---|
| Forestry SPC | 11,673 (−10,735) | 15.9% (−1.6%) | 12 y (–) | 1.19 (0.97) |
| Processing SPC | −1,909 | 1.1% | 36 | 1.01 |
| Energy SPC | 15,540 | 16.6% | 7 | 1.34 |
| Integrated | 25,304 (2,896) | 13.1% (5.4%) | 10 (23) | 1.17 (1.08) |
Results of profitability analysis.
NPV, IRR, EPB, and BCR represent net present value, internal rate of return, economic payback, and benefit–cost ratio, respectively. For the forestry SPC, revenues differ depending on whether government subsidies are received for tending, thinning, and replanting. In the rows for forestry SPC and the total, values without parentheses represent the results with subsidies, whereas values in parentheses represent the results without subsidies.
Another important finding was the significant contribution of government subsidies and emerging market instruments, such as carbon credits and RECs, to overall project profitability (Min et al., 2017; Roy and Bhan, 2024). In the absence of government support for forest management, the forestry SPC yielded a negative NPV, and overall project profitability would decline, with the IRR decreasing from 13.1% to 5.4% (Table 9). These results highlight the essential role of public support in the forestry sector, as such policies can lower log prices and thereby also benefit the wood-processing industry (Moriguchi, 2023). In addition to subsidies, carbon credits accounted for 14.1% of forestry SPC revenue, while RECs contributed 24.1% of the revenue for the energy SPC. These findings underscore the importance of supporting sustainable forest management through carbon markets and institutional mechanisms, such as RECs.
The results of the sensitivity analysis for key variables, such as project area, roundwood production volume, wood product price, and energy price, are presented in Figure 6. Changes in the project area had a minimal effect on IRR, as investment costs scale proportionally with production volume. However, NPV varied directly with project area, reflecting that larger areas generate greater absolute returns. For roundwood production volume per unit area, a decrease from the reference scenario resulted in a proportional reduction in both IRR and NPV across all SPCs. Conversely, an increase in production volume had no significant effect, as higher outputs required additional investment in processing facilities and increased operating costs for the three SPCs.
Figure 6
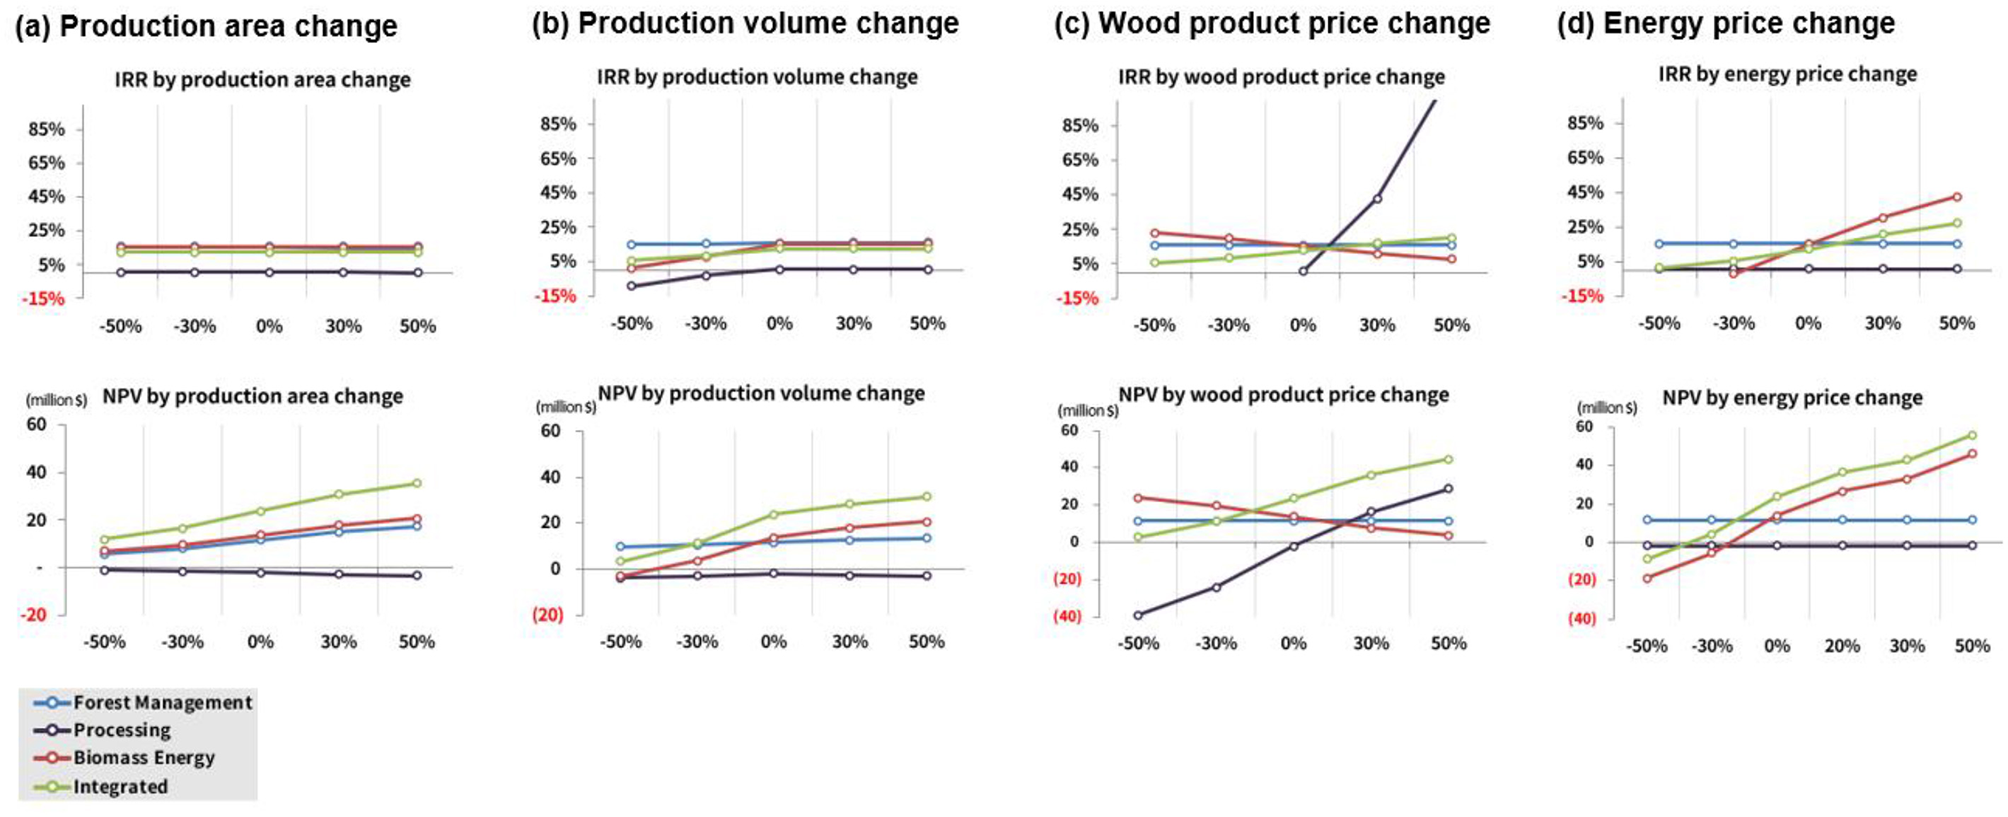
Results of the sensitivity analysis by variables. (a) Changes in IRR and NPV due to variations in project area, (b) changes in IRR and NPV due to variations in production volume, (c) changes in IRR and NPV due to variations in wood product prices, and (d) changes in IRR and NPV due to variations in energy prices.
In cases of variables of commodity price, the profitability of the processing SPC was highly sensitive to wood product prices, indicating that even moderate price increases could substantially improve its financial performance (Buehlmann and Thomas, 2025). For example, a moderate price increase raised the IRR from 0.54% to 11.89%. Conversely, the energy SPC exhibited lower sensitivity to changes in woodchip prices, reflecting relative stability in forest biomass energy operations despite fluctuations in procurement costs (Okolo and Susaeta, 2025). Therefore, increasing woodchip prices could serve as a viable strategy for improving the profitability of the processing SPC while sustaining overall supply chain performance from a stakeholder perspective (Ahl et al., 2018; Li et al., 2025). Finally, changes in energy prices only affected the profitability of the energy SPC.
3.4 Challenges of forest management in a temperate region
Many developed countries do not utilize domestic wood resources efficiently. In 19 of the 30 OECD countries, less than 70% of the annual forest stock increment was harvested, with South Korea exhibiting the lowest utilization rate at 18%, resulting in a higher reliance on wood imports (Supplementary Figure S5; FAO, 2024). Public perception in South Korea, as in some other countries, is often negative toward tree harvesting due to concerns over potential damage to forest environmental values (Mauser, 2021; Korea Forest Service, 2023c). Nevertheless, meeting societal demand for wood requires forest sector mitigation strategies that carefully balance increasing forest ecosystem carbon stocks with sustainable forest resource utilization (Nabuurs et al., 2007).
Results from this study indicate that the integrated forest management project could increase roundwood production by 2.6 times the current harvest level in South Korea through the expanded use of roundwood for processed wood products and energy generation. Such active forest management not only provides resources to meet human needs but also enhances forest resilience to elevated atmospheric carbon dioxide concentrations and associated climate impacts, such as fire, extreme droughts, irregular rainfall, and strong winds (Tognetti et al., 2022; West et al., 2021).
However, the successful implementation of the project requires greater participation from landowners as stakeholders, as private forests account for 66.1% of the total forest area in South Korea (Korea Forest Service, 2023d). Globally, smallholders, local communities, and indigenous peoples manage or own nearly half of the world's forest and farm landscapes (FAO, 2022). Therefore, engaging landowners as stakeholders and providing them with additional revenue can promote sustainable forest management and enable the expansion of project areas. The integrated project model enables landowners to benefit not only from increased revenue across the three vertically integrated SPCs but also from the supplementary income generated through carbon credits and RECs. This approach is consistent with the principle of climate-related transactions, ensuring that the financial gains from carbon projects are equitably distributed to local communities (Fischer et al., 2023).
For policymakers, this approach offers multiple advantages, such as climate mitigation through forestry and increased income for local communities. Therefore, it is necessary to restructure relevant institutions and prioritize subsidies for collective forestry projects, such as the model presented here (Kittredge, 2005). Moreover, since private forest owners often lack professional management capacity, technical support from forestry experts within investment entities can enhance overall business performance, as shown by this project model (European Investment Bank, 2019).
If only economic feasibility alone is considered, investment in wood processing appears unprofitable, creating the risk of supply chain disconnection. Therefore, establishing an integrated supply chain, as proposed in this study, becomes essential. Since wood processing is critical for maintaining continuity across upstream and downstream industries, the forestry and energy SPCs must support the processing SPC through unit price adjustments or other financial mechanisms to offset potential losses. In other words, integrated governance encompassing forestry, wood processing, and energy generation requires a central decision-making body to coordinate potential conflicts of interest among the three SPCs in a manner that maximizes benefits for all stakeholders, thereby reducing the risk of supply chain disruptions (Luo et al., 2021; Pekka et al., 2020).
3.5 Opportunity for financial investors
Private capital typically seeks higher profitability, resulting in limited financial investment in the forestry sector and the consequent underfunding of forestry projects [ISDA (International Swaps and Derivatives Association), 2022]. Furthermore, countries with a higher mean annual increment (MAI), primarily in tropical regions, produce more timber or achieve greater mitigation outcomes in forest carbon projects, yielding higher profitability than projects in temperate regions (Figure 7; Frey et al., 2018; Koh et al., 2021; Raihan et al., 2021).
Figure 7
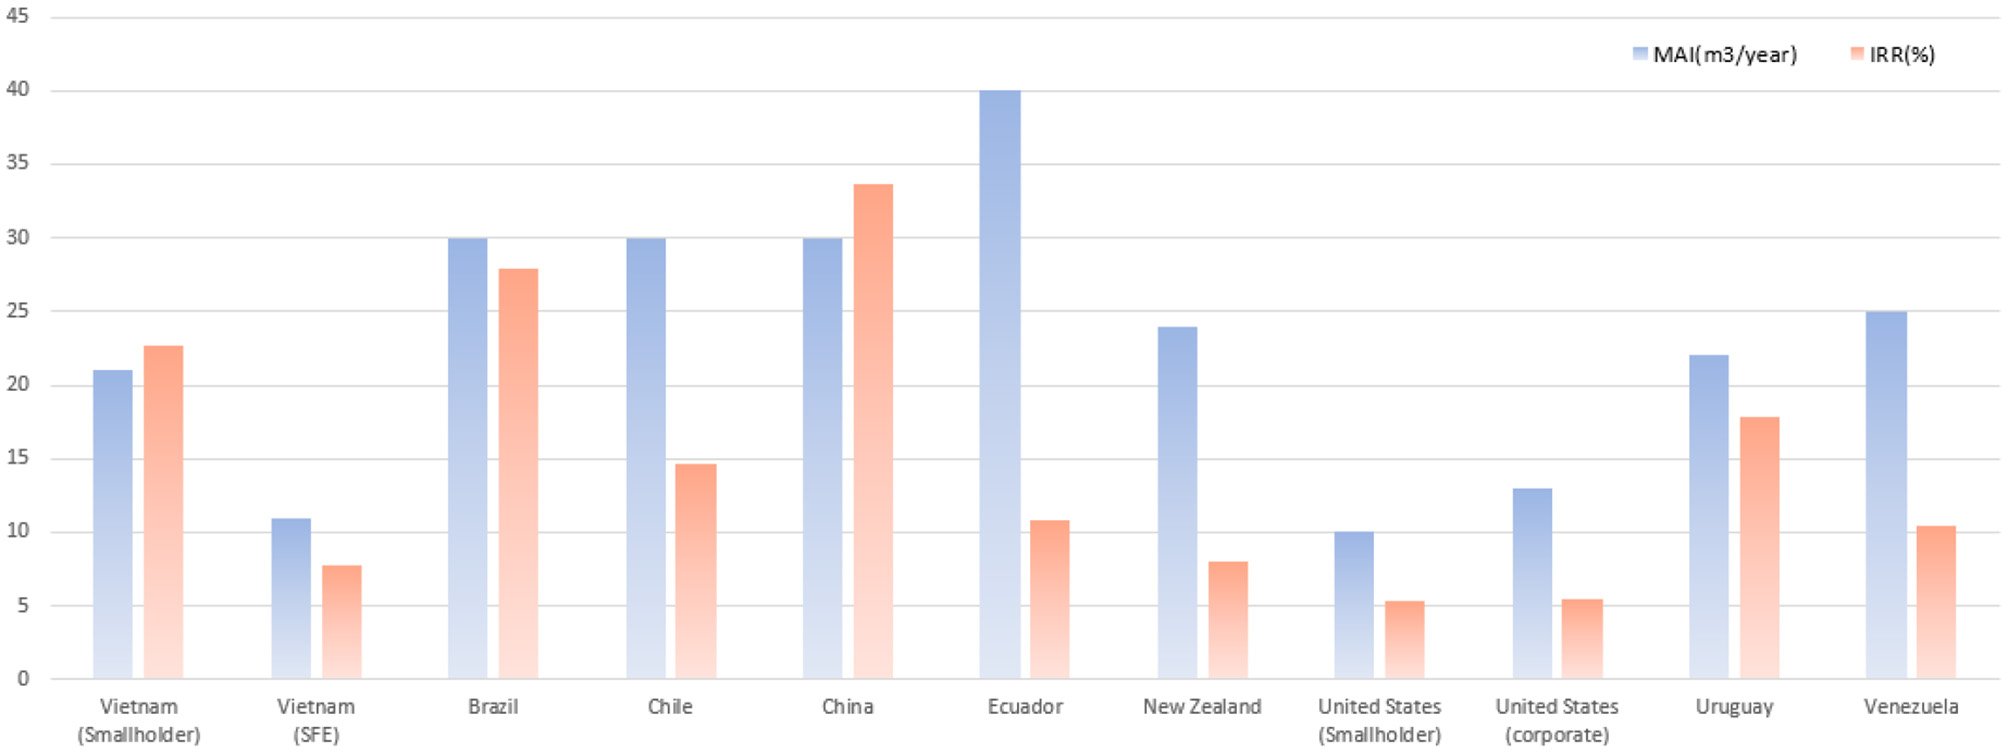
Differences in tree growth (MAI) and investment profitability (IRR) in forestry among countries (Raihan et al., 2021).
As confirmed in this study, forestry projects in temperate regions are heavily dependent on government subsidies for profitability (Jo et al., 2019). The initial IRR of the forestry SPC was −1.6% without subsidies, compared to 15.9% with subsidies. Notably, expanding the business scope to an integrated supply chain—such as processing and energy generation—converted the negative IRR to a positive 5.4%. Moreover, increases in carbon credit prices can substantially improve profitability. For example, if the unit price of carbon credits rises from the current level of US$13.1/t to the EU ETS price of US$61.3/t, the IRR of the forestry SPC will increase to 31.8%, while the IRR of the integrated supply chain will reach 18.0% (Supplementary Table S11). This indicates that carbon markets could incentivize forest managers in temperate regions to adopt sustainable forest management practices, potentially yielding substantial economic benefits, contingent upon market conditions.
With evolving economic, political, and environmental contexts, incentives for active forest management are increasing, supporting healthier and more resilient forests in the face of climate change (Bomfim et al., 2022; Ekkel, 2020). Moreover, the emergence of ESG frameworks has heightened private-sector engagement in sustainable forestry, even in contexts where immediate profitability is lower, because, beyond carbon sequestration, forests—such as slow-growing stands—provide a wide range of non-market, environmental, and non-timber public benefits, such as improvements in soil quality, water resources, and biodiversity (Gray, 2002; European Investment Bank, 2019).
4 Conclusions
The introduction of an integrated forest management system offers multiple climate mitigation benefits, such as CO2 sequestration in forests, substitution of fossil fuels, and the expansion of HWPs (Gregor et al., 2024). Fully realizing these benefits requires attracting investors who consider profit potential a key factor in forestry businesses.
Under the current circumstances in South Korea, the integrated project was deemed economically feasible. The energy sector exhibited the highest profitability, followed by the forestry sector, while the wood-processing sector showed negative profitability. For the forestry SPC, government subsidies and carbon credits contributed 24.1% and 14.1% of the profits, respectively. Similarly, for the energy SPC, revenues from REC sales accounted for 24.1% of the total income. These findings indicate that to promote sustainable forest management and establish regional forest supply chains, continued direct government support or market-based incentives through voluntary carbon markets are essential.
Leveraging these opportunities and policy support for forest-related industries could generate annual economic benefits of US$7,000,641 thousand if the project model were applied at the national level across the area of production forests of 3,286,458 ha in South Korea (Korea Forest Service, 2023d). Moreover, when additional environmental and social benefits are considered, the public benefits are substantial, further justifying government support for an integrated forest supply chain. Furthermore, these financial resources could be partially offset by increased tax revenues resulting from the expanded activity of forest-related industries.
This study has limitations due to its reliance on a single scenario, which reflects the extensive scope of the analysis across the entire forest supply chain. To address this limitation, a sensitivity analysis was conducted on variables such as project area, roundwood production volumes, and fluctuations in wood and energy prices. Additionally, because the study relied on average industry data rather than empirical measurements, the results may be conservative in terms of productivity and may not fully capture the potential gains in yield or operational efficiency that could arise from new investments. Therefore, follow-up studies should reanalyze the project as it progresses and as additional empirical data become available.
Despite these limitations, this study is significant in providing a framework for evaluating the economic feasibility of individual sectors and integrated supply chains. This approach helps identify vulnerable segments within the supply chain and offers a valuable tool for policymakers and investors seeking to assess overall economic viability and risk management across the forest-based value chain.
Statements
Data availability statement
The original contributions presented in the study are included in the article/Supplementary material, further inquiries can be directed to the corresponding author.
Author contributions
SS: Conceptualization, Data curation, Methodology, Investigation, Writing – original draft, Formal analysis. C-BL: Methodology, Supervision, Writing – review & editing, Funding acquisition, Conceptualization, Project administration.
Funding
The author(s) declared that financial support was received for this work and/or its publication. This study was conducted with support from the National Research Foundation of Korea (NRF) grant funded by the Korea government (MSIT) (Project No. RS-2024-00358413).
Conflict of interest
The author(s) declared that this work was conducted in the absence of any commercial or financial relationships that could be construed as a potential conflict of interest.
The author C-BL declared that they were an editorial board member of Frontiers, at the time of submission. This had no impact on the peer review process and the final decision.
Generative AI statement
The author(s) declared that generative AI was not used in the creation of this manuscript.
Any alternative text (alt text) provided alongside figures in this article has been generated by Frontiers with the support of artificial intelligence and reasonable efforts have been made to ensure accuracy, including review by the authors wherever possible. If you identify any issues, please contact us.
Publisher’s note
All claims expressed in this article are solely those of the authors and do not necessarily represent those of their affiliated organizations, or those of the publisher, the editors and the reviewers. Any product that may be evaluated in this article, or claim that may be made by its manufacturer, is not guaranteed or endorsed by the publisher.
Supplementary material
The Supplementary Material for this article can be found online at: https://www.frontiersin.org/articles/10.3389/ffgc.2025.1678140/full#supplementary-material
References
1
Ahl A. Eklund J. Lundqvist P. Yarime M. (2018). Balancing formal and informal success factors perceived by supply chain stakeholders: a study of woody biomass energy systems in Japan. J. Clean. Prod.175, 50–59. doi: 10.1016/j.jclepro.2017.11.108
2
Alounsavath P. Kim S.B. (2021). Economic feasibility of a sustainable production forest management system in Xaibouathong forest management area, Khammouan province, Lao PDR. For. Sci. Technol.17, 119–124. doi: 10.1080/21580103.2021.1952903
3
Baccas D. Warnatzsch E.A. (2024). Awareness and engagement of listed companies in combating deforestation and forest degradation in Brazil. Corp. Soc. Responsib. Environ. Manag.31, 3968–3987. doi: 10.1002/csr.2777
4
Ban K. M. Lee G. O. You Y. M. Lee S. H. Han S. B. Lee C. S. Jeong D. Y . (2020). 2021-2030 Comprehensive Forest Management Plan of Goesan-gun. Chungju: Chungbuk National University.
5
Binkley C. S. Stewart F. Power S. (2020). Pension Fund Investment in Forestry. Washington, DC: The World Bank Group.
6
Bomfim B. Pinagé E. R. Emmert F. Kueppers L. M. (2022). Improving sustainable tropical forest management with voluntary carbon markets. Plant Soil. 479, 53–60. doi: 10.1007/s11104-021-05249-5
7
Brown G. W. Murphy A. Fanson B. Tolsma A. (2019). The influence of different restoration thinning treatments on tree growth in a depleted forest system. For. Ecol. Manag.437, 10–16. doi: 10.1016/j.foreco.2019.01.022
8
Buehlmann U. Thomas B. (2025). The impact of cost and price fluctuations on U.S. hardwood sawmill profit. BioResources20, 5587–5601. doi: 10.15376/biores.20.3.5587-5601
9
Chudy R. P. Cubbage F. W. (2020). Research trends: forest investments as a financial asset class. For. Policy Econ.119:102273. doi: 10.1016/j.forpol.2020.102273
10
Climate Investment Funds (2021). Designing fiscal instruments for sustainable forests. Washington, DC: The World Bank.
11
Cubbage F. Davis R. Frey G. Behr D. C. Sills E. (2015). “Financial and economic evaluation guidelines for international forestry projects”, in Tropical Forestry Handbook, eds. L. Pancel and M. Köhl (Berlin: Springer), 2875–2896.
12
Ekkel T. (2020). Climate Compensation through Forestry Initiatives. Lund: Lund University.
13
European Investment Bank (2019). Financing rural, agricultural and forestry infrastructure. Brussels: European Commission.
14
FAO (Food and Agriculture Orgazization of the United Nations) (2018). Rethinking forest concessions: improving the allocation of state-owned forests for better economic, social and environmental outcomes.Rome: FAO.
15
FAO (2020). Global forest resources assessment 2020. Rome: FAO.
16
FAO (2022). The state of the world's forests.Rome: FAO.
17
FAO (2024). Available online at: www.fao.org/faostat (Accessed December 15, 2024).
18
Feng B. (2022). Forest carbon sink resource asset evaluation with case study of Fujian Province in China. Math. Prob. Eng.2022:7391473. doi: 10.1155/2022/7391473
19
Fischer H. W. Chhatre A. Duddu A. Pradhan N. Agrawal A. (2023). Community forest governance and synergies among carbon, biodiversity and livelihoods. Nat. Clim. Change13, 1340–1347. doi: 10.1038/s41558-023-01863-6
20
Frey G. E. Cubbage F. W. Ha T. T. T. Davis R. R. Carle J. B. Thon V. X. Dzung N. V. (2018). Financial analysis and comparison of smallholder forest and state forest enterprise plantations in Central Vietnam. Int. For. Rev.20, 181–198. doi: 10.1505/146554818823767582
21
Goesan-gun (2024). Available online at: https://www.goesan.go.kr (Accessed December 14, 2022).
22
Gray J. A. (2002). Forest concession policies and revenue systems - Country experience and policy changes for sustainable tropical forestry. Washington, DC: The World Bank.
23
Gregor K. Krause A. Reyer C. P. O. Knoke T. Meyer B. F. Suvanto S. Rammig A. (2024). Quantifying the impact of key factors on the carbon mitigation potential of managed temperate forests. Carbon Balance Manag.19:10. doi: 10.1186/s13021-023-00247-9
24
Griscom B. W. Adams J. Ellis P. W. Houghton R. A. Lomax G. Miteva D. A. et al . (2017). Natural climate solutions. Proc. Natl. Acad. Sci. U.S.A. 114, 11645–11650. doi: 10.1073/pnas.1710465114
25
Gromko D. Pistorius T. Seebauer M. Braun A. Meier E. (2019). Economics of forest landscape restoration – Estimating impacts, costs and benefits from ecosystem services. Freiburg: Unique Forestry and Land Use.
26
ISDA (International Swaps and Derivatives Association) (2022). Voluntary carbon market: analysis of regulatory oversight in the US.New York: ISDA.
27
Jo J. Roh T. Shin S. Youn Y. (2019). Sustainable assets and strategies affecting the forestry household income: empirical evidence from South Korea. Sustainability11:3680. doi: 10.3390/su11133680
28
Kim S. B. Kang H. D. Kong Y. H. Koo C. D. Kim D. J. Park G. S. et al . (2012). Introduction to world forest resources: Southeast Asia. Goyang: Iroom Namu.
29
Kittredge D. B. (2005), The cooperation of private forest owners on scales larger than one individual property: international examples and potential application in the United States. For. Policy Econ.7, 671–688. doi: 10.1016/j.forpol.2003.12.004
30
Ko K. H. Ahn B. I. Seo K. S. Lee W. P. Park Y. S. (2023). Study on energy cost reduction measures of facility farmhouses using forest biomass in Yesan-gun. Cheonan-si: Dankook University.
31
Koh L. P. Zeng Y. Sarira T. V. Siman K. (2021). Carbon prospecting in tropical forests for climate change mitigation. Nat. Commun.12:1271. doi: 10.1038/s41467-021-21560-2
32
Korea Forest Carbon Center (2022). Methodologies of the Korea forest carbon offset scheme. Available online at: https://carbonregistry.forest.go.kr/fcr_web/fco/spt/board/methodologyView.do?bbsId=BBSMSTR _000000000026andnttId=593 (Accessed November 14, 2022).
33
Korea Forest Map Service (2024). Available online at: https://map.forest.go.kr/forest/ (Accessed December 16, 2024).
34
Korea Forest Service (2023a). Guide on eco-friendly harvesting. Available online at: https://www.law.go.kr/LSW/admRulLsInfoP.do?admRulSeq=2100000227096#AJAX (Accessed November 10, 2022).
35
Korea Forest Service (2023b). Suvery on wood utilization of Korea in 2022. Daejeon: Korea Forest Service.
36
Korea Forest Service (2023c). The 3rd complehensive carbon sink enhancement plan (2023–2027). Daejeon: Korea Forest Service.
37
Korea Forest Service (2023d). 2023 forest and forestry statistics. Daejeon: Korea Forest Service
38
Korea Forest Service (2025). Enforcement rules of the act on the creaion and management of forest resources. Available online at: https:// www.law.go.kr (Accessed September 28, 2025).
39
Korea Forestry Promotion Institute (2023). Proposal for forest management in Chungchungbuk-do in Korea. Seoul: Korea Forestry Promotion Institute.
40
Korea Forestry Promotion Institute (2024). Annual management report in 2023. Seoul: Korea Forestry Promotion Institute.
41
Korean Law Information Center (2024). Available online at: https://law.go.kr/ (Accessed December 8, 2024).
42
KOSIS National Statistical Portal (2024). Available online at: https://kosis.kr/index/index.do (Accessed December 2, 2024).
43
Lee D. Jung S ChoiJ. (2022). Analysis of tree growth characteristics by first and second thinning in Korean white pine Plantations. J. Korean Soc. For. Sci. 111, 150–164. doi: 10.14578/jkfs.2022.111.1.150
44
Lee J. Han S. H. Kim S. Lee S. Son Y. M. Son Y. (2015). A meta-analysis on the effect of forest thinning on diameter growth and carbon stocks in Korea. J. Korea For. Soc.104, 527–535. doi: 10.14578/jkfs.2015.104.4.527
45
Lee J. S. (2023). A study on the optimal utilization of curtailed renewable energy using life cycle assessment and input-out analysis. [Dissertation]. Sejong University, Seoul.
46
Lee Y. Min H. Yi E. (2024). A study of slogan brand development in an agricultural city: Goesan-gun, Chungcheongbukdo. J. Integr. Des. Res.23:3. doi: 10.21195/jidr.2024.23.3.005
47
Leoussis J. Brzezicka P. (2017). Study on access-to-finance conditions for investments in bio-based industries and the blue economy. Luxembourg: European Investment Bank.
48
Li X. Zhang X. Yang H. (2020). Estimating the opportunity costs of avoiding oil palm-based deforestation in Indonesia: Implications for REDD+. Chin. J. Popul. Resour. Environ.18, 9–15. doi: 10.1016/j.cjpre.2021.04.010
49
Li Y. Wang A. Wu Q. Zhou Z. (2025). Vertical integration, supply chain disruptions, and corporate yield spreads. Br. Account. Rev. 101639. doi: 10.1016/j.bar.2025.101639. [Epub ahead of print].
50
Lujan B. Silva-Chávez G. (2018). Mapping forest finance. New York: Environmental Defense Fund.
51
Luo L. O'Hehir J. Regan C. M. Meng L. Connor J. D. Chow C. W. K. (2021). An integrated strategic and tactical optimization model for forest supply chain planning. For. Policy Econ.131:102571. doi: 10.1016/j.forpol.2021.102571
52
Ma S. K. (2021). Forest management guide for 100 years. Seoul: Korea Forestry Promotion Institute.
53
Mauser H. (2021). Key questions on forests in the EU. Joensuu: European Forest Institute. doi: 10.36333/k2a04
54
Min G. T. Seok H. D. Choi J. Y. (2017). Policy tasks to improve the profitability of forest management in Korea. Korea Rural Economic Institute. Naju-si: Korea Rural Economy Research Institute.
55
Moriguchi K. (2023). Towards the globally sustainable use of forestlands and wood resources: estimating fair timber price deriving supply curves in a proven stable state. Resour. Conserv. Recycl.199:107285. doi: 10.1016/j.resconrec.2023.107285
56
Nabuurs G. J. Masera O. Andrasko K. Benitez-Ponce P. Boer R. Dutschke M. et al . (2007). “Forestry”, in Climate Change 2007: Mitigation of Climate Change, eds. B. Metz, O. R. Davidson, P. R. Bosch, R. Dave, and L. A. Meyer (New York: Cambridge University Press), 541–584.
57
OECD (Organisation for Economic Co-operation and Development) (2020). Environment at a glance 2020. Paris: OECD.
58
Okolo C. V. Susaeta A. (2025). Forest biomass fuels and energy price stability: policy implications for U.S. gasoline and diesel markets. Energies18:3732. doi: 10.3390/en18143732
59
Palander T. (2024). Modeling techno-economic wood procurement from renewable forests for the sustainable energy supply of a CHP plant. Sustainability16:170. doi: 10.3390/su16010170
60
Pekka H. Reetta L. Juha L. Juha L. Tuula P. (2020). Joining up optimisation of wood supply chains with forest management: a case study of North Karelia in Finland. Forestry93, 163–177. doi: 10.1093/forestry/cpz058
61
Pilli R. Fiorese G. Grassi G. (2015). EU mitigation potential of harvested wood products. Carbon Balance Manag. 10:6. doi: 10.1186/s13021-015-0016-7
62
Raihan A. Begum R. A. Said M. N. M. (2021). A meta-analysis of the economic value of forest carbon stock. Malays. J. Soc. Space17, 321–338. doi: 10.17576/geo-2021-1704-22
63
Roy A. Bhan M. (2024). Forest carbon market-based mechanisms in India: learnings from global design principles and domestic barriers to implementation. Ecol. Indic. 158:111331. doi: 10.1016/j.ecolind.2023.111331
64
Saltelli A. Ratto M. Andres T. Campolongo F. Cariboni J. Gatelli D. et al . (2008). Global Sensitivity Analysis. Ther Primer.West Sussex: John Wiley and Sons Ltd.
65
Sathre F. Gustavsson L. (2009). Process-based analysis of added value in forest product industries. For. Policy Econ.11, 65–75. doi: 10.1016/j.forpol.2008.09.003
66
Soimakallio S. Kalliokoski T. Lehtonen A. Salminen O. (2021). On the trade-offs and synergies between forest carbon sequestration and substitution. Mitig. Adapt. Strat. Glob. Change26:4. doi: 10.1007/s11027-021-09942-9
67
Song H. (2023). Subsidized Deforestation: 10 years of biomass power in South Korea. Seoul: Solutions for our climate.
68
Song J. (2017). Revisiting social discount rates for public investment. KDI J. Econ. Policy39, 75–98. doi: 10.23895/kdijep.2017.39.2.75
69
Souza A. G. O. Barbosa F. S. Esperancini M. S. T. Guerra S. P. S. (2021). Economic feasibility of electrical power cogeneration from forestry biomass in an engineered wood panel industrial facility. Croat. J. For. Eng.42, 313–320. doi: 10.5552/crojfe.2021.873
70
Taebaek-si (2023). Project Plan for Establishing Forest Wood Cluster in southern Gangwon province. Taebaek-si: Taebaek-si.
71
Tognetti R. Smith M. Panzacchi P. (2022). Climate-smart forestry in mountain regions. Cham: Springer.
72
Vuuren D. P. V. Wijst K. V. D MarsmanS.BergM. V. D.HofA. F.JonesC.D. (2020). The costs of achieving climate targets and the sources of uncertainty. Nat. Clim. Chang. 10, 329–334. doi: 10.1038/s41558-020-0732-1
73
West T. A. P. Salekin S. Melia N. Wakelin S. J. Yao R. T. Meason D. (2021). Diversification of forestry portfolios for climate change and market risk mitigation. J. Environ. Manage. 289:112482. doi: 10.1016/j.jenvman.2021.112482
74
Woo H. Acuna M. Choi B. Kim J. (2021). Net revenue of forest carbon offset projects: Application of the Korean emission trading system in the forestry sector. Forests12:742. doi: 10.3390/f12060742
75
Woo H. Han H. Cho S. Jung G. Kim B. Ryu J. et al . (2020). Investigating the optimal location of potential forest industry clusters to enhance domestic timber utilization in South Korea. Forests11:936. doi: 10.3390/f11090936
76
World Bank (2023). State and trends of carbon pricing 2023. Washington, DC: The World Bank
77
World Economic Forum (2021). Investing in forests: the business case. Geneva: World Economic Forum.
78
Yanai R. D. Wayson C. Lee D. Espejo A. B. Campbell J. L. Green M. B. et al . (2020). Improving uncertainty in forest carbon accounting for REDD+ mitigation efforts. Environ. Res. Lett.15:124002. doi: 10.1088/1748-9326/abb96f
Summary
Keywords
climate change, forest biomass energy, integrated forestry supply chain, sustainable forest management, voluntary carbon markets
Citation
So S and Lee C-B (2026) Assessing the economic feasibility of integrating wood processing and energy generation in forest management: a case study from a forestry-centric district in temperate South Korea. Front. For. Glob. Change 8:1678140. doi: 10.3389/ffgc.2025.1678140
Received
12 August 2025
Revised
08 December 2025
Accepted
12 December 2025
Published
07 January 2026
Volume
8 - 2025
Edited by
Yuhui Weng, Stephen F. Austin State University, United States
Reviewed by
Bhupendra Singh, VCSG Uttarakhand University, India
Xufang Zhang, Texas A&M University San Antonio, United States
Updates
Copyright
© 2026 So and Lee.
This is an open-access article distributed under the terms of the Creative Commons Attribution License (CC BY). The use, distribution or reproduction in other forums is permitted, provided the original author(s) and the copyright owner(s) are credited and that the original publication in this journal is cited, in accordance with accepted academic practice. No use, distribution or reproduction is permitted which does not comply with these terms.
*Correspondence: Chang-Bae Lee, kecolee@kookmin.ac.kr
ORCID: Chang-Bae Lee orcid.org/0000-0002-3543-6440
Disclaimer
All claims expressed in this article are solely those of the authors and do not necessarily represent those of their affiliated organizations, or those of the publisher, the editors and the reviewers. Any product that may be evaluated in this article or claim that may be made by its manufacturer is not guaranteed or endorsed by the publisher.